Market Evaluation of Phosphate Fertilizers from ... - PalmOilis - MPOB
Market Evaluation of Phosphate Fertilizers from ... - PalmOilis - MPOB
Market Evaluation of Phosphate Fertilizers from ... - PalmOilis - MPOB

You also want an ePaper? Increase the reach of your titles
YUMPU automatically turns print PDFs into web optimized ePapers that Google loves.
OIL PALM INDUSTRY ECONOMIC JOURNAL (VOL. 5(1)/2005)<br />
<strong>Market</strong> <strong>Evaluation</strong> <strong>of</strong><br />
<strong>Phosphate</strong> <strong>Fertilizers</strong> <strong>from</strong><br />
Various Sources for Matured<br />
Oil Palm in Malaysia<br />
Mohd Nasir Amiruddin*;<br />
Zin Zawawi Zakaria*<br />
and Hasiah Embong*<br />
* Malaysian Palm Oil Board,<br />
P. O. Box 10620,<br />
50720 Kuala Lumpur,<br />
Malaysia.<br />
28<br />
INTRODUCTION<br />
<strong>Fertilizers</strong> account for about 24%<br />
<strong>of</strong> the production costs <strong>of</strong> palm oil.<br />
With their increasing cost, the aim<br />
should be to optimize fertilizer use<br />
for sustained high yields and<br />
pr<strong>of</strong>its per unit area through<br />
balanced fertilization and<br />
improved fertilizer efficiency (Teo<br />
et al., 1998). Tarmizi et al. (1998)<br />
studied the effects <strong>of</strong> N, P and K<br />
fertilizers on oil palm bunch<br />
components. N fertilizers showed<br />
significant effects on bunch<br />
number, bunch weight and total<br />
oil/bunch. High N decrease F/B but<br />
the effect on oil to bunch (O/B) was<br />
minimal. They also reported that<br />
P significantly increased bunch<br />
weight without affecting the other<br />
bunch parameters. K significantly<br />
increased nut weight but reduced<br />
ABSTRACT<br />
<strong>Fertilizers</strong> are one <strong>of</strong> the most important inputs in the production <strong>of</strong><br />
palm oil. Their use is dependent on the price <strong>of</strong> palm oil (PO), the<br />
higher the price the more the fertilizers used. P fertilizers significantly<br />
increased fresh fruit bunches (FFB) yield and the rates to be used will<br />
depend on the costs and benefits afforded by them. This study determines<br />
the costs and benefits <strong>of</strong> utilizing various sources <strong>of</strong> phosphate fertilizers<br />
through partial budgeting and dominance analysis for gross return (GR),<br />
total variable cost (TVC), marginal rate <strong>of</strong> net return (MRNR), net<br />
return (NR) and return on investment (ROI).<br />
the mesocarp to fruit (M/F) ratio.<br />
There are many sources <strong>of</strong><br />
phosphate rock currently available<br />
in the market. Their P contents<br />
and solubilities vary. Five <strong>of</strong> the<br />
fertilizers, CIRP (Christmas Island<br />
Rock <strong>Phosphate</strong>), Tunisia or Gafsa<br />
(TPR), Jordan (JPR), North<br />
Carolina (NCPR), China (CPR)<br />
and the more concentrated and<br />
soluble triple super phosphate<br />
(TSP) were studied to determine<br />
their effects on the yield <strong>of</strong> oil<br />
palm. Zin et al. (2001) applied<br />
three rates <strong>of</strong> phosphate including<br />
a control (without P), i.e. 1.5, 3.0<br />
and 4.5 kg equivalent <strong>of</strong> CIRP per<br />
palm per year. The field trials were<br />
conducted on (sedentary) Rengam<br />
series and coastal alluvial soil. The<br />
experimental design used was a<br />
randomized complete block design<br />
(RCBD) with four replicate.
MARKET EVALUATION OF PHOSPHATE FERTILIZERS FROM VARIOUS SOURCES FOR MATURED OIL PALM IN MALAYSIA<br />
Zin et al. (2001) recorded data<br />
over a six-year period <strong>of</strong> full<br />
response (third to eighth year) and<br />
showed that FFB yields <strong>from</strong> the<br />
P treatments were higher on both<br />
the soil types over the control<br />
plots. Zin et al. (1998) also found<br />
that phosphate fertilizer improved<br />
the leaf N, P and Ca levels although<br />
there were no significant<br />
differences between the rates and<br />
the different sources <strong>of</strong> P. However,<br />
at high rates <strong>of</strong> P, leaf K tended to<br />
be depressed probably due to the<br />
antagonistic effect <strong>of</strong> Ca. In<br />
addition, it increased the soil pH,<br />
available P, total P, exchangeable Ca<br />
and Mg but depressed the soil<br />
exchangeable Al. There were<br />
significant differences in the FFB<br />
yield response to the P treatments<br />
on the inland soil, but not on the<br />
coastal alluvial soil. There were<br />
however, no significant differences<br />
in FFB yield between P <strong>from</strong> CIRP,<br />
Gafsa, JPR, NCR and TSP. From<br />
the FFB yield response, the various<br />
P sources were ranked as follows<br />
in performance: JPR=NCPR=<br />
Gafsa=CIRP=TSP>CPR.<br />
Considering that CPR had the<br />
lowest performance, while the<br />
others had the same performance,<br />
economic analysis was conducted<br />
on the various phosphate fertilizers<br />
to determine the source <strong>of</strong> P that<br />
can provide the maximum gains to<br />
the palm oil industry.<br />
OBJECTIVES<br />
The objectives <strong>of</strong> this paper were<br />
to determine the costs and benefits<br />
<strong>of</strong> utilizing phosphate fertilizers<br />
<strong>from</strong> various sources, as well as to<br />
indicate the market demand for the<br />
fertilizers.<br />
METHODOLOGY<br />
To meet the objectives <strong>of</strong> the study,<br />
economic analysis using partial<br />
budgeting and dominance analysis<br />
for GR, TVC and interest rate<br />
incurred to buy the phosphate<br />
fertilizers was carried out.<br />
Dominance analysis for<br />
treatments was carried out on the<br />
basis <strong>of</strong> MRNR, variable cost (VC),<br />
NR and ROI. The total area under<br />
oil palm on inland as well as coastal<br />
soils was then used to determine<br />
the market demand for P fertilizer.<br />
The data <strong>of</strong> FFB yield were<br />
taken <strong>from</strong> Zin et al. (1998) in their<br />
evaluation <strong>of</strong> various phosphate<br />
fertilizers for mature oil palm in<br />
Malaysia. The mean annual FFB<br />
yields for the various treatments in<br />
the trials at three different locations<br />
over a six-year period were utilized.<br />
The data are shown in Tables 3 and<br />
4.<br />
RESULTS AND DISCUSSION<br />
Productivity <strong>of</strong> <strong>Phosphate</strong><br />
<strong>Fertilizers</strong> in Coastal Soils<br />
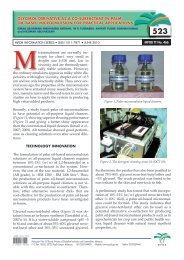
On the coastal soil, at 1.5 kg<br />
phosphate fertilizer per palm, the<br />
fertilizer producing the highest<br />
yield was NCPR. CPR was second.<br />
The ranking was NCPR > CPR ><br />
JPR > CIRP > TSP > TPR. Thus,<br />
TPR was the most inefficient at this<br />
low rate <strong>of</strong> application. At 3<br />
kg/palm, TPR became the most<br />
productive fertilizer followed by<br />
FFB yield (t/ha/yr)<br />
27<br />
26<br />
25<br />
24<br />
TSP although there was little<br />
difference between them. At this<br />
rate, TPR = TSP > JPR > NCPR ><br />
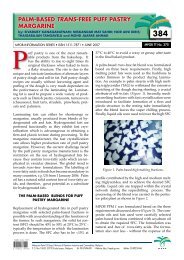
CPR > CIRP. Finally, at 4.5<br />
kg/palm, the ranking became CIRP<br />
> JPR > TSP > CPR > NCPR.<br />
However, increasing CIRP <strong>from</strong> 1.5<br />
kg/palm to 3.0 kg/palm decreased<br />
yield while 4.5 kg resulted in a<br />
tremendous increase in output.<br />
Increasing the other phosphate<br />
fertilizers <strong>from</strong> 1.5 kg/palm to 3.0<br />
kg/palm resulted in higher yields<br />
which declined on further increase<br />
to 4.5 kg. This, is illustrated in<br />
Figure 1. Thus, for coastal soils,<br />
the recommended maximum P<br />
application is 3.0 kg phosphate<br />
rock.<br />
Productivity <strong>of</strong> <strong>Phosphate</strong><br />
<strong>Fertilizers</strong> on Inland Soils<br />
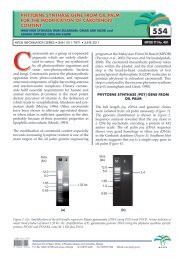
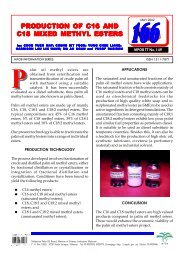
The productivity <strong>of</strong> the various<br />
phosphate fertilizers on inland soil<br />
is shown in Figure 2. Even though<br />
TSP was the most costly <strong>of</strong> the<br />
phosphate fertilizers, it produced<br />
the highest yield and thus,<br />
provided the highest return at 1.5<br />
kg/palm. From Figure 1, it can be<br />
seen that at 1.5 kg/palm, TSP ><br />
NCPR > TPR > CIRP > JPR > CPR.<br />
However, at 3 kg/palm, the ability<br />
<strong>of</strong> TSP to increase yield was very<br />
23<br />
1.5 3<br />
Rate (kg/p/yr)<br />
4.5<br />
JP<br />
CPR<br />
PO CIRP TPR JPR NCPR CPR TSP<br />
Figure 1. Dominance analysis for different rates <strong>of</strong> phosphate fertilizers on<br />
coastal soils.<br />
CIR<br />
TS<br />
P<br />
TP<br />
NC<br />
PO<br />
29
OIL PALM INDUSTRY ECONOMIC JOURNAL (VOL. 5(1)/2005)<br />
low compared to the other<br />
phosphate fertilizers. At this rate,<br />
CIRP produced the highest yield.<br />
In summary, at 3 kg/palm, CIRP ><br />
JPR > CPR > TPR > NCPR > TSP.<br />
Finally, at 4.5 kg/palm, the most<br />
efficient fertilizer was JPR, followed<br />
by CIRP > NCPR > TPR > TSP ><br />
CPR. These results were obtained<br />
<strong>from</strong> partial budgeting on palms<br />
cultivated on coastal soils. It can<br />
be seen that on inland soils FFB<br />
increased with the phosphate<br />
application rate.<br />
Imports <strong>of</strong> <strong>Phosphate</strong> <strong>Fertilizers</strong><br />
Malaysia imports various types<br />
<strong>of</strong> phosphate fertilizers, and among<br />
which are super phosphate,<br />
ammonium phosphate and rock<br />
phosphate (ground and unground).<br />
The quantum <strong>of</strong> phosphatic<br />
fertilizers imported has increased<br />
over the years <strong>from</strong> 590 315 t in<br />
1995 to 717 363 t in 2000 at an<br />
average annual growth rate <strong>of</strong><br />
3.9%. However, imports declined<br />
after 2000 to 528 023 t in 2003.<br />
Imports <strong>of</strong> rock phosphate have<br />
been quite constant at more than<br />
half a million tonnes yearly <strong>from</strong><br />
1995 to 2000 before declining to<br />
332 000 t in 2001 and 379 000 t in<br />
2003. The irregular imports is due<br />
to the fertilizer use being inversely<br />
30<br />
FFFB yield (t/ha/yr)<br />
27<br />
26<br />
25<br />
24<br />
23<br />
22<br />
21<br />
20<br />
CP<br />
19<br />
1.5 3<br />
Rate (kg/p/yr)<br />
4.5<br />
PO CIRP TPR JPR NCPR CPR TSP<br />
NCPR<br />
Figure 2. Dominance analysis for different rate <strong>of</strong> phosphate fertilizers on<br />
inland soils.<br />
TSP<br />
JPR<br />
CIR<br />
PO<br />
related to the price <strong>of</strong> palm oil<br />
lagged one year as illustrated in<br />
Table 1.<br />
The price <strong>of</strong> crude palm oil<br />
(CPO) was high in 1998 and<br />
declined <strong>from</strong> 1999 till 2001. This<br />
resulted in a decline in imports <strong>of</strong><br />
fertilizers <strong>from</strong> 605 123 t to<br />
331 928 t. Considering that the<br />
CPO price was lower in 2001 than<br />
in 2000, the effect is further seen<br />
in the quantum <strong>of</strong> fertilizers<br />
imported in 2002 which further<br />
declined to 305 935 t. However,<br />
when the price <strong>of</strong> CPO increased<br />
to RM 1364/t in 2002, fertilizer<br />
imports increased to 379 470 t in<br />
2003.<br />
Correlations between the price<br />
<strong>of</strong> CPO, vs. the average price <strong>of</strong><br />
phosphate fertilizers and import <strong>of</strong><br />
phosphate fertilizers for 1994 to<br />
2003 produced a strong and<br />
positive relationship between the<br />
CPO price and imports. The<br />
imports <strong>of</strong> P fertilizers fluctuate in<br />
tandem with implies that the price<br />
<strong>of</strong> CPO. The relationship between<br />
the CPO price and average fertilizer<br />
price, though positive, was not<br />
strong. On the other hand, the<br />
correlation between the average<br />
fertilizer price and imports <strong>of</strong><br />
fertilizers was negative, meaning<br />
there is an inverse relationship<br />
between the price <strong>of</strong> fertilizers,<br />
and their imports. This is<br />
illustrated in Table 2.<br />
Rock phosphate fertilizers are<br />
the most commonly applied<br />
phosphate fertilizers for oil palm.<br />
They are imported <strong>from</strong> various<br />
countries such as China, Christmas<br />
Island, Jordan, Tunisia and North<br />
Carolina. CIRP is the most<br />
important although its share has<br />
declined <strong>from</strong> a high <strong>of</strong> 48% in<br />
1998 to 25% in 2003. CPR in 2003<br />
was 13% <strong>of</strong> total imports while TPR<br />
and JPR accounted for 8% and 3%<br />
respectively. There were no<br />
imports <strong>of</strong> NCPR in 2002 and 2003<br />
possibly due to its high price and<br />
also the after effects <strong>from</strong> the 11<br />
September bombing <strong>of</strong> the World<br />
Trade Centre causing ships to fear<br />
to ferry American products. Rock<br />
phosphate <strong>from</strong> other sources<br />
accounted for 51% <strong>of</strong> the total<br />
imports in 2003. Prior to 2003, the<br />
other sources <strong>of</strong> imports were at<br />
least 25 countries, but in 2003 they<br />
had been whittled down to seven.<br />
These are Australia, Egypt, Algeria,<br />
India, Hong Kong, Japan and<br />
Thailand. The fertilizers included<br />
natural calcium phosphate, natural<br />
TABLE 1. RELATIONSHIP BETWEEN PRICES OF CRUDE PALM OIL<br />
(CPO), FERTILIZERS AND IMPORTS OF FERTILIZERS<br />
Year CPO price Average fertilizers price <strong>Fertilizers</strong> imports<br />
1998 2 377 248 605 123<br />
1999 1 450 241 577 929<br />
2000 997 224 520 119<br />
2001 895 219 331 928<br />
2002 1 364 214 305 935<br />
2003 1 544 240 379 470
MARKET EVALUATION OF PHOSPHATE FERTILIZERS FROM VARIOUS SOURCES FOR MATURED OIL PALM IN MALAYSIA<br />
TABLE 2. CORRELATION BETWEEN THE PRICES OF CRUDE PALM<br />
OIL (CPO), FERTILIZERS AND IMPORTS OF FERTILIZERS<br />
Correlation<br />
Avg. Fertilizer<br />
CPO price import<br />
CPO Pearson 1 0.261 0.606<br />
Sig. (2-tailed) - 0.498 0.083<br />
N 9 9 9<br />
Avg. fertilizer Pearson 0.261 1 -0.406<br />
Sig. (2-tailed) 0.498 - 0.278<br />
N 9 9 9<br />
Fertilizer Pearson 0.606 -0.406 1<br />
Sig. (2-tailed) 0.083 0.278 -<br />
N 9 9 9<br />
Note: lagged one year.<br />
aluminium calcium phosphate and<br />
phosphatic chalk (ground and<br />
ungrounded).<br />
Partial Budget Analysis<br />
Partial Budget analysis <strong>of</strong> the<br />
different rates <strong>of</strong> phosphate<br />
fertilizers to oil palm was<br />
performed assuming the other<br />
factors remaining constant. The<br />
price <strong>of</strong> RM 230/t FFB (the average<br />
for 1988-2003) was used to derive<br />
the gross returns <strong>from</strong> sale <strong>of</strong> FFB<br />
(The average price January-August<br />
2004 was RM 340/t). If the average<br />
price were to prove pr<strong>of</strong>itable than<br />
a sensitivity analysis on the price<br />
would not be necessary. The total<br />
variable cost for a hectare <strong>of</strong> oil<br />
palm with no phosphate application<br />
was estimated to be RM 2078. The<br />
prices <strong>of</strong> the various P fertilizers<br />
were computed based on the<br />
quantity and weighted average<br />
value <strong>of</strong> each imported by Malaysia<br />
during 1995-2003. They are in<br />
Table 3.<br />
For 1995-2000, the most<br />
expensive fertilizer was TSP,<br />
followed by TPR, NCPR, JPR, CIRP<br />
and CPR. However, after the 11<br />
September, Malaysia did not<br />
import any NCPR. The prices <strong>of</strong><br />
rock phosphate fertilizers went on<br />
an upward spiral but TSP declined.<br />
Nevertheless, TSP remained the<br />
most expensive fertilizer, followed<br />
by TPR, JPR, CPR and CIRP.<br />
The results <strong>of</strong> the partial budget<br />
analysis are illustrated in Tables 4<br />
and 5 with the former showing the<br />
dominance analysis for coastal<br />
soils and the latter for inland soils.<br />
Returns on Investment in Coastal<br />
Areas<br />
ROI is used widely to evaluate<br />
the performance <strong>of</strong> an operating<br />
TABLE 3. WEIGHTED AVERAGE PRICES OF PHOSPHATE<br />
FERTILIZERS, 1995-2000 AND 1995-2003 (RM/t)<br />
1995/2000 1995/2003<br />
CIRP (P ) 1<br />
TPR (P ) 2<br />
JPR (P ) 3<br />
NCPR (P ) 4<br />
CPR (P ) 5<br />
TSP (P ) 6<br />
170<br />
263<br />
193<br />
293<br />
178<br />
536<br />
186<br />
276<br />
206<br />
272<br />
201<br />
499<br />
division within a firm. Quite<br />
simply, it measures the pr<strong>of</strong>itability<br />
<strong>of</strong> a division relative to its<br />
investment base and is analogous<br />
to the similar concept used in<br />
project planning. M N Paudel and<br />
S H Upasena computed ROI as the<br />
ratio <strong>of</strong> gross return to total<br />
variable cost and this procedure is<br />
adopted in this analysis.<br />
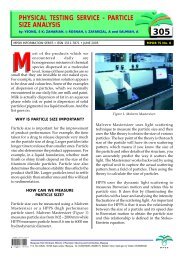
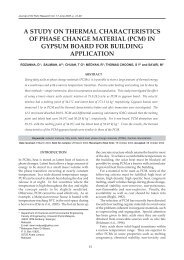
The ROI for the various<br />
phosphate fertilizers in coastal<br />
areas are shown in Table 4 and<br />
illustrated in Figure 3. All the ROI’s<br />
were positive. Using 1.5 kg/palm<br />
phosphate fertilizer, especially TSP<br />
and TPR, produced ROI below that<br />
<strong>of</strong> the control. At this rate, NCPR<br />
provided the highest return <strong>of</strong> RM<br />
3665/ha or ROI <strong>of</strong> 2.71. CPR gave<br />
the second highest return <strong>of</strong> RM<br />
3599, or ROI <strong>of</strong> 2.70. This was<br />
followed by JPR and CIRP. When<br />
the phosphate fertilizer was<br />
increased to 3 kg/palm, TPR<br />
provided the highest return <strong>of</strong> RM<br />
3846/ha. The ROI was 2.74. TSP<br />
provided the next highest return <strong>of</strong><br />
RM 3831 with ROI <strong>of</strong> 2.72. This<br />
was followed by JPR, NCPR and<br />
CPR. However, the return <strong>from</strong><br />
CIRP <strong>of</strong> RM 3396 at ROI <strong>of</strong> 2.57<br />
was lower than the control which<br />
returned RM 3405 at a ROI <strong>of</strong> 2.64.<br />
Increasing the phosphate<br />
application to 4.5 kg/palm<br />
completely changed the situation.<br />
The net return <strong>from</strong> CIRP<br />
increased <strong>from</strong> RM 3396 (at 3.0 kg/<br />
palm) to RM 3840/ha at a ROI <strong>of</strong><br />
2.74. CIRP was the only fertilizer<br />
that increased net return and ROI.<br />
The returns <strong>from</strong> JPR, TSP and TPR<br />
decreased but remained higher<br />
than that <strong>of</strong> the control. Not with<br />
standing this, their ROI were below<br />
that for the control. The other<br />
fertilizers gave negative returns<br />
with CPR and NCPR giving returns<br />
and ROI’s below those <strong>of</strong> the<br />
control.<br />
31
OIL PALM INDUSTRY ECONOMIC JOURNAL (VOL. 5(1)/2005)<br />
TABLE 4. DOMINANCE ANALYSIS FOR DIFFERENT P RATES ON COASTAL SOILS<br />
Treatment FFB yield Gross Input TVC (GR - TVC) (^NR/^TVC) (GR/TVC)<br />
(t/ha/yr) return (RM) cost (RM) Net<br />
return<br />
MRNR ROI<br />
P 0<br />
P R 1 1 (CIRP)<br />
P R 1 2<br />
P R 1 3<br />
P R 2 1 (TPR)<br />
P R 2 2<br />
P R 2 3<br />
P R 3 1 (JPR)<br />
P R 3 2<br />
P R 3 3<br />
P R 4 1 (NCPR)<br />
P R 4 2<br />
P R 4 3<br />
P R 5 1 (CPR)<br />
P R 5 2<br />
P R 5 3<br />
P R 6 1 (TSP)<br />
P R 6 2<br />
P R 6 3<br />
23.8<br />
24.4<br />
24.1<br />
26.2<br />
23.7<br />
26.3<br />
25.2<br />
24.5<br />
25.9<br />
25.4<br />
25.2<br />
25.6<br />
24.1<br />
24.8<br />
24.9<br />
23.9<br />
24.0<br />
26.3<br />
25.6<br />
5 483.2<br />
5 623.5<br />
5 556.8<br />
6 042.1<br />
5 464.8<br />
6 058.2<br />
5 812.1<br />
5 648.8<br />
5 957.0<br />
5 855.8<br />
5 807.5<br />
5 899.5<br />
5 547.6<br />
5 717.8<br />
5 727.0<br />
5 506.2<br />
5 533.8<br />
6 062.8<br />
5 894.9<br />
0<br />
41.2<br />
82.5<br />
123.8<br />
66.9<br />
133.8<br />
200.7<br />
49.9<br />
99.9<br />
149.8<br />
64.4<br />
128.9<br />
193.4<br />
40.8<br />
81.7<br />
122.6<br />
77.1<br />
154.2<br />
231.3<br />
2 078.0<br />
2 119.2<br />
2 160.5<br />
2 201.8<br />
2 144.9<br />
2 211.8<br />
2 278.7<br />
2 127.9<br />
2 177.9<br />
2 227.8<br />
2 142.4<br />
2 206.9<br />
2 271.4<br />
2 118.8<br />
2 159.7<br />
2 200.6<br />
2 155.1<br />
2 232.2<br />
2 309.3<br />
3 405.2<br />
3 504.2<br />
3 396.2<br />
3 840.2<br />
3 319.8<br />
3 846.3<br />
3 533.3<br />
3 520.8<br />
3 779.0<br />
3 627.9<br />
3 665.0<br />
3 692.5<br />
3 276.1<br />
3 598.9<br />
3 567.2<br />
3 305.5<br />
3 378.7<br />
3 830.6<br />
3 585.6<br />
0<br />
2.40<br />
-<br />
3.51<br />
-<br />
3.30<br />
0.64<br />
2.32<br />
3.74<br />
1.49<br />
4.03<br />
2.23<br />
-<br />
4.74<br />
1.98<br />
-<br />
-<br />
2.76<br />
0.78<br />
2.64<br />
2.65<br />
2.57<br />
2.74<br />
2.55<br />
2.74<br />
2.55<br />
2.65<br />
2.74<br />
2.63<br />
2.71<br />
2.67<br />
2.44<br />
2.70<br />
2.65<br />
2.50<br />
2.57<br />
2.72<br />
2.55<br />
Notes: Based on an FFB price <strong>of</strong> RM 230/t<br />
CIRP -1 TPR -2 JPR -3 NCPR -4 CPR -5 TSP -6 =<br />
=<br />
=<br />
1.5 kg ClRP@213 g P . 1<br />
3.0 kg ClRP@426 g P . 2<br />
4.5 kg ClRP@639 g P . 3<br />
Returns on Investment on Inland<br />
Soils<br />
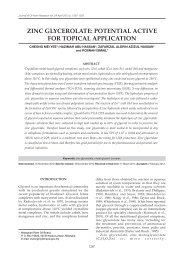
The results <strong>from</strong> the different<br />
rates <strong>of</strong> phosphate fertilizers on<br />
inland soils are shown in Table 4<br />
and Figure 4. From Figure 4, at 1.5<br />
kg all the phosphate fertilizers gave<br />
net returns higher than that <strong>of</strong> the<br />
control <strong>of</strong> RM 2451 and ROI <strong>of</strong><br />
2.18. TSP provided the highest net<br />
return <strong>of</strong> RM 3213 and a ROI <strong>of</strong><br />
2.49, followed by NCPR with RM<br />
3196 and a ROI <strong>of</strong> 2.49. TPR<br />
provided the third highest net<br />
return and ROI, followed by CIRP,<br />
JPR and CPR. Increasing the rate<br />
to 3.0 kg/palm, only TSP showed<br />
a decreased net return and ROI.<br />
The net return was RM 3217 while<br />
the ROI decreased to 2.42, thus<br />
producing the lowest net return<br />
and ROI. The highest net return<br />
and ROI was <strong>from</strong> CIRP with RM<br />
3433 and 2.59 respectively. The<br />
net return <strong>from</strong> JPR was RM 3418<br />
32<br />
Net return<br />
3 900<br />
3 800<br />
3 700<br />
3 600<br />
3 500<br />
3 400<br />
3 300<br />
JPR<br />
NCP<br />
CPR<br />
3 200<br />
1.5 3<br />
Rate<br />
4.5<br />
PO<br />
PO CIRP TPR JPR NCPR CPR TSP<br />
Figure 3. Net returns for different rates <strong>of</strong> phosphate fertilizers on coastal<br />
soils.<br />
and the ROI 2.57, making it the<br />
second most economically viable<br />
fertilizer. CPR provided the third<br />
highest return, followed by TPR<br />
and NCPR. When the rate was<br />
increased further to 4.5 kg/palm,<br />
JPR produced the highest net<br />
return <strong>of</strong> RM 3722 and a ROI <strong>of</strong><br />
2.67. The net return <strong>from</strong> CIRP<br />
CIRP<br />
TSP<br />
TPR<br />
<strong>of</strong> RM 3594 was the second highest<br />
while its ROI was 2.63. The net<br />
returns and ROI’s <strong>from</strong> NCPR, TPR,<br />
and TSP were third, fourth and<br />
fifth, respectively. However, CPR<br />
produced a lower net return and<br />
ROI than <strong>from</strong> 3.0 kg/palm.
MARKET EVALUATION OF PHOSPHATE FERTILIZERS FROM VARIOUS SOURCES FOR MATURED OIL PALM IN MALAYSIA<br />
TABLE 5. DOMINANCE ANALYSIS FOR DIFFERENT RATES ON INLAND SOILS<br />
Treatment FFB yield Gross Input TVC (GR - TVC) (^NR/^TVC) (GR/TVC)<br />
(t/ha/yr) return (RM) cost (RM) Net<br />
return<br />
MRNR ROI<br />
P 0<br />
P R 1 1 (CIRP)<br />
P R 1 2<br />
P R 1 3<br />
P R 2 1 (TPR)<br />
P R 2 2<br />
P R 2 3<br />
P R 3 1 (JPR)<br />
P R 3 2<br />
P R 3 3<br />
P R 4 1 (NCPR)<br />
P R 4 2<br />
P R 4 3<br />
P R 5 1 (CPR)<br />
P R 5 2<br />
P R 5 3<br />
P R 6 1 (TSP)<br />
P R 6 2<br />
P R 6 3<br />
19.69<br />
22.63<br />
24.32<br />
25.20<br />
23.04<br />
24.21<br />
24.97<br />
22.63<br />
24.33<br />
25.87<br />
23.21<br />
24.07<br />
24.97<br />
21.45<br />
24.18<br />
24.11<br />
23.34<br />
23.69<br />
24.81<br />
4 528.7<br />
5 204.9<br />
5 593.6<br />
5 796.0<br />
5 299.2<br />
5 568.3<br />
5 743.1<br />
5 204.9<br />
5 595.9<br />
5 950.1<br />
5 338.3<br />
5 536.1<br />
5 743.1<br />
4 933.5<br />
5 561.4<br />
5 545.3<br />
5 368.2<br />
5 448.7<br />
5 706.3<br />
0<br />
41.29<br />
82.58<br />
123.88<br />
66.91<br />
133.86<br />
200.77<br />
49.94<br />
99.91<br />
149.85<br />
64.49<br />
128.94<br />
193.43<br />
40.87<br />
81.75<br />
122.65<br />
77.10<br />
154.20<br />
231.30<br />
2 078.00<br />
2 119.29<br />
2 160.58<br />
2 201.88<br />
2 144.91<br />
2 211.86<br />
2 278.77<br />
2 127.94<br />
2 177.91<br />
2 227.85<br />
2 142.49<br />
2 206.94<br />
2 271.43<br />
2 118.87<br />
2 159.75<br />
2 200.65<br />
2 155.10<br />
2 232.20<br />
2 309.30<br />
2 450.70<br />
3 085.61<br />
3 433.02<br />
3 594.12<br />
3 154.29<br />
3 356.44<br />
3 464.33<br />
3 076.96<br />
3 417.99<br />
3 722.25<br />
3 195.81<br />
3 329.16<br />
3 471.67<br />
2 814.63<br />
3 401.65<br />
3 344.65<br />
3 213.10<br />
3 216.50<br />
3 397.00<br />
0<br />
15.38<br />
11.89<br />
9.23<br />
10.52<br />
6.77<br />
5.05<br />
12.54<br />
9.68<br />
8.49<br />
11.55<br />
6.81<br />
5.28<br />
8.90<br />
11.63<br />
7.29<br />
9.89<br />
4.97<br />
4.09<br />
2.18<br />
2.46<br />
2.59<br />
2.63<br />
2.47<br />
2.52<br />
2.52<br />
2.45<br />
2.57<br />
2.67<br />
2.49<br />
2.51<br />
2.53<br />
2.33<br />
2.58<br />
2.52<br />
2.49<br />
2.44<br />
2.47<br />
Marginal Rates <strong>of</strong> Net Return on<br />
Coastal Soils<br />
Total, average and marginal<br />
relationships are very useful in<br />
optimization analysis. The<br />
definitions <strong>of</strong> totals and averages<br />
are too well known to warrant<br />
restating, but it is perhaps<br />
appropriate to define marginal. A<br />
marginal relationship is defined as<br />
the change in the dependent<br />
variable <strong>of</strong> a function associated<br />
with a unitary change in one <strong>of</strong> the<br />
independent variables. In a total<br />
revenue function, marginal<br />
revenue is the change in total<br />
revenue associated with a one unit<br />
change in output. The MRNR for<br />
this purpose is thus defined as the<br />
change in NR due to a one unit<br />
change in the TVC. Thus, an<br />
entrepreneur would continue to<br />
produce a product until the<br />
marginal revenue equals the<br />
marginal cost.<br />
Considering that we are now<br />
bringing the concept <strong>of</strong> MRNR into<br />
the discussion, the important<br />
parameters are summarized in<br />
Net return<br />
3 800<br />
3 600<br />
3 400<br />
3 200<br />
3 000<br />
2 800<br />
2 600<br />
TPR<br />
2 400<br />
1.5 3<br />
Rate<br />
4.5<br />
PO CIRP TPR JPR NCPR CPR TSP<br />
Figure 4. Net returns for different rates <strong>of</strong> phosphate fertilizers on inland soils.<br />
Table 6 for ease in comparison.<br />
There were differences in the<br />
types <strong>of</strong> phosphate fertilizer to<br />
apply to obtain the highest return<br />
<strong>from</strong> the crop than on inland soils.<br />
At 1.5 kg/palm, NCPR provided the<br />
highest NR followed by CPR and<br />
JPR. However, MRNR for CPR was<br />
the highest followed by those for<br />
NCPR and CIRP. At this level, CIRP<br />
also provided a high net return, a<br />
MRNR greater than 1 and a ROI in<br />
NCPR<br />
TSP<br />
PO<br />
JPR<br />
CIRP<br />
CPR<br />
excess <strong>of</strong> 2. However, the MRNR’s<br />
for TSP and TPR were negative.<br />
Thus, if growers were to apply<br />
phosphate fertilizer at 1.5 kg/palm,<br />
the top choice would be NCPR. In<br />
case <strong>of</strong> difficulty in obtaining the<br />
fertilizer, the alternatives in order<br />
<strong>of</strong> maximizing pr<strong>of</strong>its are CPR, by<br />
JPR and CIRP. TSP and TPR<br />
should not be applied.<br />
If the rate <strong>of</strong> application were<br />
to be increased to 3.0 kg/palm, the<br />
33
OIL PALM INDUSTRY ECONOMIC JOURNAL (VOL. 5(1)/2005)<br />
TABLE 6. RANKING OF NET RETURNS (NR), MARGINAL RATE OF<br />
NET RETURN (MRNRs) AND RETURN ON INVESTMENT (ROIs) OF<br />
VARIOUS PHOSPHATE FERTILIZERS ON COASTAL SOILS<br />
Ranking 1.5 kg 3.0 kg 4.5 kg<br />
1 NCPR TPR CIRP<br />
NR 3 665 (3 659) 3 846 (3 833) 3 840 (3 828)<br />
MRNR 4.03 (3.57) 3.30 (2.91) 3.51 (3.10)<br />
ROI 2.71 (2.70) 2.74 (2.72) 2.74 (2.73)<br />
2 CPR TSP JPR<br />
NR 3 599 (3 595) 3 831 (3 815) 3 628 (3 613)<br />
MRNR 4.74 (4.21) 2.76 (2.42) 1.49 (1.26)<br />
ROI 2.70 (2.69) 2.72 (2.70) 2.63 (2.61)<br />
3 JPR JPR TSP<br />
NR 3 521 (3 516) 3 779 (3 769) 3 586 (3 562)<br />
MRNR 2.32 (2.02) 3.74 (3.32) 0.78 (0.62)<br />
ROI 2.65 (2.65) 2.74 (2.72) 2.55 (2.53)<br />
4 CIRP NCPR TPR<br />
NR 3 504 (3 500) 3 693 (3 680) 3 533 (3 513)<br />
MRNR 2.40 (2.09) 2.23 (1.94) 0.64 (0.49)<br />
ROI 2.65 (2.65) 2.67 (2.66) 2.55 (2.53)<br />
5 TSP CPR CPR<br />
NR 3 379 (3 371) 3 567 (3 527) 3 306 (3 246)<br />
MRNR -0.34 (-0.40) 1.98 (1.00) -0.81 (-0.87)<br />
ROI 2.57 (2.56) 2.65 (2.60) 2.50 (2.44)<br />
fertilizer that provided the highest<br />
net revenue was TPR with RM<br />
3846; its ROI was 2.74 and MRNR<br />
3.30. This is followed by TSP, JPR<br />
and NCPR with net returns <strong>of</strong> RM<br />
3831, RM 3779 and RM 3693,<br />
respectively. With marginal<br />
analysis, one would expect that<br />
further increases in CPR<br />
application would further increase<br />
pr<strong>of</strong>its. However, this did not<br />
materialize because its usage at 3.0<br />
kg/palm decrease in net revenue to<br />
RM 3567 <strong>from</strong> RM 3599 while the<br />
ROI declined <strong>from</strong> 2.70 to 2.65.<br />
Similarly, the MRNR declined <strong>from</strong><br />
4.74 to 1.98. Thus, at 3.0 kg/palm,<br />
one should apply TPR followed by<br />
TSP, JPR and NCPR. Increased<br />
application <strong>of</strong> CPR and CIRP<br />
should not be done because it<br />
would result in losses.<br />
34<br />
6 TPR CIRP NCPR<br />
NR 3 320 (3 313) 3 396 (3 388) 3 276 (3 257)<br />
MRNR -1.28 (-1.25) -0.11 (-0.19) -0.67 (-0.70)<br />
ROI 2.55 (2.54) 2.57 (2.60) 2.44 (2.42)<br />
At 4.5 kg/palm, CIRP gave the<br />
highest net return <strong>of</strong> RM 3840, the<br />
highest MRNR <strong>of</strong> 3.51 as well as the<br />
highest ROI <strong>of</strong> 2.74. Nevertheless,<br />
this net return was lower than that<br />
<strong>from</strong> TPR at 3.0 kg/palm. The net<br />
return <strong>from</strong> JPR was the second<br />
highest with a MRNR <strong>of</strong> slightly<br />
in excess <strong>of</strong> 1 and ROI <strong>of</strong> 2.63.<br />
Compared to the rate <strong>of</strong> 3.0 kg/<br />
palm, the higher level <strong>of</strong> 4.5 kg/<br />
palm resulted in further<br />
deterioration <strong>of</strong> the NR and ROI as<br />
well as MRNR. Application <strong>of</strong> the<br />
other phosphate fertilizers at 4.5<br />
kg/palm decreased the NR, ROI as<br />
well as the MRNR. This means that<br />
the maximum application should<br />
not exceed 3.0 kg/palm. Application<br />
<strong>of</strong> CPR should not be more than 1.5<br />
kg/palm as losses would be<br />
incurred.<br />
Marginal Rate <strong>of</strong> Net Return on<br />
Inland Soils<br />
Table 7 summarizes the<br />
marginal rates <strong>of</strong> return and other<br />
relevant parameters for comparing<br />
the amounts <strong>of</strong> phosphate fertilizer<br />
to be apply on inland soils. Table<br />
5 shows that there are differences<br />
in the types <strong>of</strong> phosphate fertilizer<br />
to apply to provide the highest<br />
return <strong>from</strong> the crop than on<br />
coastal soil. At 1.5 kg/palm, TSP<br />
provided the highest NR followed<br />
by NCPR and TPR. The MRNR for<br />
CIRP at 15.38 was the highest<br />
followed by JPR with 12.54. The<br />
MRNR for TSP was, however, low<br />
at 9.89 while that <strong>of</strong> NCPR higher<br />
at 11.55. Application <strong>of</strong> phosphate<br />
fertilizers is highly recommended<br />
considering that revenue can be<br />
further increased through their<br />
application. At 1.5 kg/palm, the<br />
preferred fertilizer to apply for the<br />
highest return obtainable would be<br />
TSP. The next would be NCPR<br />
followed by TPR, CIRP, JPR and<br />
CPR.<br />
When the rate <strong>of</strong> phosphate<br />
fertilizer application was raised to<br />
3.0 kg/palm, the net revenue<br />
increased except that <strong>from</strong> TSP<br />
which declined. CIRP provided the<br />
highest NR <strong>of</strong> RM 3433 and also<br />
the highest MRNR <strong>of</strong> 11.89. JPR<br />
provided the second highest return<br />
followed by CPR, TPR and NCPR.<br />
Considering that CIRP provided<br />
the best return, it should be the<br />
preferred fertilizer to apply.<br />
However, if it is not available, then<br />
the next best alternative is CPR.<br />
This is followed by TPR and NCPR.<br />
However, application <strong>of</strong> TSP at 3<br />
kg/palm would only slightly<br />
increase net revenue <strong>from</strong> RM 3213<br />
at 1.5 kg to RM 3217.<br />
Further increasing the<br />
phosphate fertilizers to 4.5 kg/palm<br />
resulted in further increases in net<br />
revenue except <strong>from</strong> CPR where<br />
revenue plummeted to RM 3345
MARKET EVALUATION OF PHOSPHATE FERTILIZERS FROM VARIOUS SOURCES FOR MATURED OIL PALM IN MALAYSIA<br />
TABLE 7. RANKING OF NET RETURNS (NR), MARGINAL RATE OF<br />
NET RETURN (MRNRs) AND RETURN ON INVESTMENTS (ROIs)<br />
FROM VARIOUS PHOSPHATE FERTILIZERS ON INLAND SOILS<br />
Ranking 1.5 kg 3.0 kg 4.5 kg<br />
1 TSP CIRP JPR<br />
NR 3 213 (3 205) 3 433 (3 425) 3 722 (3 708)<br />
MRNR 9.89 (8.90) 11.89 (10.72) 8.49 (7.64)<br />
ROI 2.49 (2.48) 2.59 (2.58) 2.67 (2.65)<br />
2 NCPR JPR CIRP<br />
NR 3 196 (3 189) 3 418 (3 408) 3 594 (3 582)<br />
MRNR 11.55 (10.42) 9.68 (8.73) 9.23 (8.30)<br />
ROI 2.49 (2.48) 2.57 (2.56) 2.63 (2.62)<br />
3 TPR CPR NCPR<br />
NR 3 154 (3 148) 3 402 (3 362) 3 472 (3 452)<br />
MRNR 10.52 (9.48) 11.63 (7.49) 5.28 (4.71)<br />
ROI 2.47 (2.46) 2.58 (2.53) 2.53 (2.51)<br />
4 CIRP TPR TPR<br />
NR 3 086 (3 081) 3 356 (3 343) 3 464 (3 444)<br />
MRNR 15.38 (13.89) 6.77 (6.07) 5.05 (4.50)<br />
ROI 2.46 (2.45) 2.52 (2.50) 2.52 (2.50)<br />
5 JPR NCPR TSP<br />
NR 3 077 (3 072) 3 329 (3316) 3 397 (3 374)<br />
MRNR 12.54 (11.33) 6.81 (6.11) 4.09 (3.63)<br />
ROI 2.45 (2.44) 2.51 (2.49) 2.47 (2.45)<br />
6 CPR TSP CPR<br />
NR 2 815 (2 810) 3 217 (3 201) 3 345 (3 285)<br />
MRNR 8.90 (7.98) 4.97 (4.42) 7.29 (4.57)<br />
ROI 2.33 (2.32) 2.44 (2.42) 2.52 (2.45)<br />
<strong>from</strong> RM 3402 at the 3.0 kg. This<br />
was surprising considering that the<br />
MRNR <strong>of</strong> CPR was the second<br />
highest and exceeded that <strong>of</strong> JPR.<br />
At 4.5 kg, JPR ranked first in<br />
providing the highest NR while its<br />
MRNR was lower than that <strong>of</strong> CIRP<br />
even though its net return was the<br />
second highest. The third highest<br />
net return was <strong>from</strong> NCPR,<br />
followed by TPR and TSP. Thus,<br />
applying 4.5 kg/palm phosphate<br />
fertilizer can further increase<br />
pr<strong>of</strong>its. JPR would be the most<br />
preferred choice, followed by CIRP,<br />
NCPR, TPR and TSP. Application<br />
<strong>of</strong> CPR is not recommended at 4.5<br />
kg/palm since the net return is<br />
lower than that at 3.0 kg/palm.<br />
Sensitivity Analysis<br />
Closely associated with the<br />
weather and other natural hazards<br />
that affect risk are price fluctuation<br />
and the increasing costs <strong>of</strong> inputs<br />
by oil palm growers. In this<br />
analysis, the price <strong>of</strong> FFB utilized<br />
was RM 230/t and was the average<br />
price during 1998-2003. The costs<br />
<strong>of</strong> the phosphate fertilizers used<br />
were their average landed prices<br />
also for the same period. During<br />
the period, the imported prices<br />
increased only very slowly at 0.43%<br />
per year. However, in this analysis,<br />
the prices were set to increase by<br />
10% a year to determine the<br />
sensitivity <strong>of</strong> returns to increasing<br />
prices. On the other hand, the<br />
price per tonne <strong>of</strong> FFB was fixed<br />
at RM 230. The results <strong>of</strong> the<br />
sensitivity analysis are shown by<br />
figures in brackets in Table 6 for<br />
coastal areas while those for inland<br />
areas are illustrated in Table 7.<br />
Sensitivity Analysis for Coastal<br />
Soils<br />
With a 10% increase in the<br />
prices <strong>of</strong> phosphate fertilizers,<br />
application at 1.5 kg/palm<br />
decreased NR, MRNR and ROI.<br />
The fertilizers in order <strong>of</strong> giving the<br />
highest returns were NCPR, CPR,<br />
JPR and CIRP. As the returns <strong>from</strong><br />
TSP and TPR were low, they should<br />
not be applied. At 3 kg/palm, the<br />
increase in fertilizer cost NR,<br />
MRNR and ROI for all the<br />
fertilizers. However, the NRs were<br />
positive and exceeded that <strong>of</strong> the<br />
control. The highest returns<br />
produced were in the order TPR ><br />
TSP > JPR > NCPR > CPR. The<br />
returns <strong>from</strong> CIRP was however,<br />
lower than that obtained with 1.5<br />
kg. At 4.5 kg/palm, the increase in<br />
price decreased net revenue for all<br />
the phosphate fertilizers. However,<br />
only the net return <strong>from</strong> CIRP<br />
exceeded TSP at 3 kg/palm. Thus,<br />
at 4.5 kg CIRP is the only fertilizer<br />
to apply for a better net return.<br />
Sensitivity Analysis for Inland<br />
Soils<br />
On inland areas, the increase in<br />
price at application <strong>of</strong> 1.5 kg/palm<br />
still allowed all the fertilizers to<br />
produce NR and ROI higher than<br />
those for the control. The ranking<br />
<strong>of</strong> fertilizers for the highest returns<br />
remained the same as that before<br />
the price increase. At 3 kg TSP<br />
should not be applied because net<br />
revenue would have declined to<br />
RM 3201 <strong>from</strong> RM 3205 at 1.5 kg.<br />
The fertilizers to apply for the<br />
highest returns were in the order<br />
CIRP > JPR > CPR > TPR > NCPR.<br />
Applying 4.5 kg/palm and<br />
assuming a 10% hike in price, the<br />
return produced by CPR was lower<br />
than that <strong>from</strong> 3.0 kg. Thus, CPR<br />
should not be applied at the 4.5<br />
kg/palm. The fertilizers to apply<br />
at 4.5 kg/palm for the highest<br />
returns were JPR followed by CIRP,<br />
NCPR, CPR and TSP.<br />
35
OIL PALM INDUSTRY ECONOMIC JOURNAL (VOL. 5(1)/2005)<br />
36<br />
CONCLUSION<br />
An economic evaluation <strong>of</strong><br />
phosphate fertilizers on oil palm on<br />
coastal and inland soils was done<br />
through partial budgeting and<br />
dominance analysis. It was found<br />
that to apply fertilizer depended on<br />
the NR obtained at the different<br />
levels <strong>of</strong> fertilizer.<br />
On coastal soils, apply NCPR,<br />
CPR, JPR or CIRP in order <strong>of</strong><br />
priority at 1.5 kg/palm to maximize<br />
returns. TSP and TPR should not<br />
be applied. Pr<strong>of</strong>its can be further<br />
increased by applying at 3.0<br />
kg/palm with the highest returns<br />
<strong>from</strong> TPR followed by TSP, JPR and<br />
NCPR. CPR and CIRP should not<br />
be applied at 3.0 kg/palm as losses<br />
would be incurred. Application at<br />
4.5 kg/palm further decreased NR<br />
and ROI as well as MRNR. This<br />
means that the application <strong>of</strong><br />
phosphate fertilizers on coastal<br />
soils should not exceed 3.0<br />
kg/palm. Application <strong>of</strong> CPR<br />
should not be more than 1.5 kg/<br />
REFERENCES<br />
palm, as losses would be incurred.<br />
The types <strong>of</strong> phosphate fertilizer<br />
to apply on inland soils differed<br />
form those on coastal soils. At 1.5<br />
kg/palm, the preferred fertilizers<br />
for the highest return were TSP ><br />
NCPR > TPR > CIRP > JPR > CPR.<br />
Increasing the application to 3.0<br />
kg/palm, increased the net revenue<br />
except with TSP which net revenue<br />
decline. CIRP provide the highest<br />
NR. Followed by JPR, then CPR,<br />
TPR and NCPR. TSP should not<br />
be applied at this rate because it<br />
decrease NR. The return is further<br />
increased if the rate is increased to<br />
4.5 kg/palm. At this rate, JPR was<br />
the best followed by CIRP, NCPR,<br />
TPR and TSP. CPR is not<br />
recommended at 4.5 kg/palm since<br />
the NR was lower than 3.0 kg/<br />
palm.<br />
A sensitivity analysis was also<br />
conducted with the cost <strong>of</strong><br />
phosphate fertilizers raised by 10%<br />
a year while the price <strong>of</strong> FFB was<br />
unchanged. Under this condition,<br />
application <strong>of</strong> most <strong>of</strong> the phosphate<br />
MALAYSIA AGRICULTURE DIRECTORY and INDEX 2001/2002 (2002).<br />
9th Edition 2001/2002. Agriquest Sdn Bhd, Kuala Lumpur. p. 250-252.<br />
PAUDEL, M N and UPASENA, S H. Economic evaluation <strong>of</strong> green leaf<br />
manure. A feasible alternative for nitrogen substitution in irrigated rice.<br />
http://www.nepalnet.net<br />
OWEN, G (1947). Retention <strong>of</strong> phosphate by Malayan soil types. J. Rubb.<br />
Res. Inst. Malaya, 12:1.<br />
TARMIZI, A M; HAMDAN, A B; ZIN, Z Z and MOHD TAYEB, D (1998).<br />
The effects <strong>of</strong> N, P and K fertilizers on oil palm bunch components.<br />
Proc. <strong>of</strong> the National Seminar on Opportunities for Maximizing Production<br />
through Better OER and Offshore Investment in Oil Palm. PORIM, Bangi.<br />
p. 22.<br />
TEO, C B; CHEW, P S; GOH, K J and KEE, K K (1998). Optimising<br />
return <strong>from</strong> fertilizer for oil palms: an integrated agronomic approach.<br />
Paper presented at the IFA Regional Conference for Asia and the Pacific,<br />
Hong Kong, China. 7-10 December 1998.<br />
ZIN Z ZAKARIA; FOONG, S F; JAMALUDIN; N; LEE, C T; A B<br />
HAMDAN; A M TARMIZI and KHALID, H (2001). <strong>Evaluation</strong> <strong>of</strong> various<br />
sources <strong>of</strong> phosphate fertilizer for mature oil palm in Peninsular Malaysia.<br />
Proc. <strong>of</strong> the 2001 PIPOC International Palm Oil Congress – Agriculture<br />
Conference. <strong>MPOB</strong>, Bangi. p. 272-281.<br />
fertilizers continued to be<br />
economically viable for both inland<br />
and coastal soils.<br />
The total area under oil palm in<br />
the country in 2003 was 3 802 040<br />
ha <strong>of</strong> which 3 303 133 ha or 87%<br />
<strong>of</strong> the area were mature. Based on<br />
the country’s import <strong>of</strong> phosphate<br />
fertilizers <strong>of</strong> 279 470 t all <strong>of</strong> which<br />
were applied for oil palm, the<br />
average application per palm was<br />
0.57 kg. This quantum is far below<br />
the amount for maximum net<br />
revenue. Thus, oil palm growers<br />
should increase their application <strong>of</strong><br />
phosphate fertilizers.<br />
ACKNOWLEDGEMENT<br />
The authors wish to thank the<br />
Director-General <strong>of</strong> <strong>MPOB</strong> for<br />
approval to present this paper.<br />
Thanks are also recorded to the<br />
Director <strong>of</strong> Economics and<br />
Industry Development Division for<br />
his useful comments.