

Room for Improvement - Odlum Brown
Room for Improvement - Odlum Brown
Room for Improvement - Odlum Brown

Create successful ePaper yourself
Turn your PDF publications into a flip-book with our unique Google optimized e-Paper software.
odlum brown limited trust • vision • investment integrity<br />
ob report<br />
january 2012<br />
inside this issue<br />
<strong>Room</strong> <strong>for</strong> <strong>Improvement</strong><br />
> Page 1<br />
OB Model Portfolio<br />
> Page 3<br />
<strong>Odlum</strong> <strong>Brown</strong>’s 18th Annual<br />
Address > Page 4<br />
<strong>Odlum</strong> <strong>Brown</strong> Limited<br />
Suite 1100 – 250 Howe Street<br />
Vancouver BC Canada V6C 3S9<br />
Tel 604 669 1600<br />
Fax 604 681 8310<br />
Toll Free 1 888 886 3586<br />
in<strong>for</strong>mation@odlumbrown.com<br />
odlumbrown.com<br />
Kelowna 250 861 5700<br />
Victoria 250 952 7777<br />
Chilliwack 604 858 2455<br />
Courtenay 250 703 0637<br />
Campbell River 250 286 3151<br />
Member-Canadian Investor Protection Fund<br />
PLATINUM MEMBER<br />
> <strong>Room</strong> <strong>for</strong> <strong>Improvement</strong><br />
many canadians believe the united<br />
States is headed <strong>for</strong> an economic disaster.<br />
Yet despite high unemployment, consumer<br />
deleveraging, troubled banks, a trillion-plus<br />
dollar Federal deficit, and political gridlock,<br />
U.S. stocks led the world in 2011. For the year<br />
through to December 15, 2011, all three of<br />
the major U.S. stock benchmarks produced<br />
positive total returns, measured in Canadian<br />
dollars.<br />
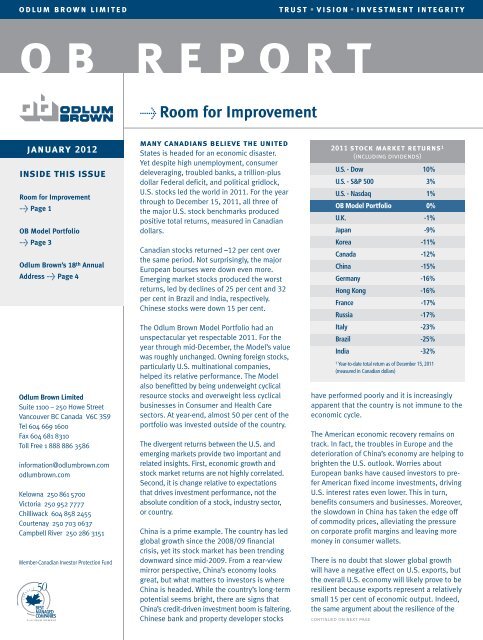
Canadian stocks returned –12 per cent over<br />
the same period. Not surprisingly, the major<br />
European bourses were down even more.<br />
Emerging market stocks produced the worst<br />
returns, led by declines of 25 per cent and 32<br />
per cent in Brazil and India, respectively.<br />
Chinese stocks were down 15 per cent.<br />
The <strong>Odlum</strong> <strong>Brown</strong> Model Portfolio had an<br />
unspectacular yet respectable 2011. For the<br />
year through mid-December, the Model’s value<br />
was roughly unchanged. Owning <strong>for</strong>eign stocks,<br />
particularly U.S. multinational companies,<br />
helped its relative per<strong>for</strong>mance. The Model<br />
also benefitted by being underweight cyclical<br />
resource stocks and overweight less cyclical<br />
businesses in Consumer and Health Care<br />
sectors. At year-end, almost 50 per cent of the<br />
portfolio was invested outside of the country.<br />
The divergent returns between the U.S. and<br />
emerging markets provide two important and<br />
related insights. First, economic growth and<br />
stock market returns are not highly correlated.<br />
Second, it is change relative to expectations<br />
that drives investment per<strong>for</strong>mance, not the<br />
absolute condition of a stock, industry sector,<br />
or country.<br />
China is a prime example. The country has led<br />
global growth since the 2008/09 financial<br />
crisis, yet its stock market has been trending<br />
downward since mid-2009. From a rear-view<br />
mirror perspective, China’s economy looks<br />
great, but what matters to investors is where<br />
China is headed. While the country’s long-term<br />
potential seems bright, there are signs that<br />
China’s credit-driven investment boom is faltering.<br />
Chinese bank and property developer stocks<br />
2011 stock market returns 1<br />
(including dividends)<br />
U.S. - Dow 10%<br />
U.S. - S&P 500 3%<br />
U.S. - Nasdaq 1%<br />
OB Model Portfolio 0%<br />
U.K. -1%<br />
Japan -9%<br />
Korea -11%<br />
Canada -12%<br />
China -15%<br />
Germany -16%<br />
Hong Kong -16%<br />
France -17%<br />
Russia -17%<br />
Italy -23%<br />
Brazil -25%<br />
India -32%<br />
1 Year-to-date total return as of December 15, 2011<br />
(measured in Canadian dollars)<br />
have per<strong>for</strong>med poorly and it is increasingly<br />
apparent that the country is not immune to the<br />
economic cycle.<br />
The American economic recovery remains on<br />
track. In fact, the troubles in Europe and the<br />
deterioration of China’s economy are helping to<br />
brighten the U.S. outlook. Worries about<br />
European banks have caused investors to prefer<br />
American fixed income investments, driving<br />
U.S. interest rates even lower. This in turn,<br />
benefits consumers and businesses. Moreover,<br />
the slowdown in China has taken the edge off<br />
of commodity prices, alleviating the pressure<br />
on corporate profit margins and leaving more<br />
money in consumer wallets.<br />
There is no doubt that slower global growth<br />
will have a negative effect on U.S. exports, but<br />
the overall U.S. economy will likely prove to be<br />
resilient because exports represent a relatively<br />
small 15 per cent of economic output. Indeed,<br />
the same argument about the resilience of the<br />
continued on next page
2/ob report<br />
“<br />
there is a lot more<br />
room <strong>for</strong> improvement<br />
and potential <strong>for</strong><br />
investors to be positively<br />
surprised following<br />
periods of economic<br />
adversity than periods<br />
of prosperity.<br />
”<br />
continued from page 1<br />
> <strong>Room</strong> <strong>for</strong> <strong>Improvement</strong><br />
insular U.S. economy proved to be prescient<br />
following the 1997/98 Asian financial crisis.<br />
Investors remain confident in the credit of the<br />
United States, even despite all the hoopla over<br />
the recent U.S. debt ceiling fiasco, the S&P debt<br />
downgrade, and the failure of the congressional<br />
“Super Committee” to <strong>for</strong>ge a budget compromise.<br />
The yield on 10-year U.S. Treasury bonds<br />
has fallen from more than 3.5 per cent in early<br />
2011 to less than two per cent, as of late.<br />
The monstrous U.S. budget deficit may rightfully<br />
scare investors, yet large deficits are normally<br />
followed by good stock market returns. The<br />
history of this seemingly counterintuitive reality<br />
is brilliantly chronicled in Ken Fisher’s latest book,<br />
Markets Never Forget (But People Do): How Your<br />
Memory is Costing You Money.<br />
While it is hard to believe, stocks generally<br />
per<strong>for</strong>m much better in the years following big<br />
budget deficits than they do following the years<br />
of surpluses (or smaller deficits). Consider what<br />
happened following the spike in the U.S. budget<br />
deficit during the nasty recession in 1982. Three<br />
years later, the S&P 500 was up more than 50<br />
per cent. Conversely, the budget surplus during<br />
Bill Clinton’s presidency in 1999 was anything but<br />
a recipe <strong>for</strong> good things to come. Three years later,<br />
the benchmark U.S. stock index was down more<br />
than 40 per cent. While we have highlighted a<br />
couple of extreme examples, the pattern is fairly<br />
consistent and there is actually a logical explanation<br />
<strong>for</strong> the outcome.<br />
There is a lot more room <strong>for</strong> improvement and<br />
potential <strong>for</strong> investors to be positively surprised<br />
following periods of economic adversity than<br />
periods of prosperity. During economic setbacks,<br />
stocks fall out of fashion and become inexpensive,<br />
as corporate profits and government finances<br />
deteriorate. Conversely, government finances<br />
improve during booms, as do corporate profitability,<br />
investor sentiment and stock prices. Stock market<br />
returns are greatly influenced by starting<br />
valuations, which are best during troubled times.<br />
We are enthusiastic about the outlook <strong>for</strong> the<br />
U.S. economy and favour many U.S. listed<br />
securities simply because there is lot of room<br />
<strong>for</strong> the U.S. economy to recover. Positive change<br />
will not happen overnight, but it should not<br />
take much marginal improvement to move<br />
valuations off depressed levels.<br />
Europe is commonly cited as the biggest risk <strong>for</strong><br />
2012. While the economic and political issues in<br />
the Eurozone are complex and <strong>for</strong>midable, we<br />
think that most of the concern has already been<br />
reflected in stock prices. Europe’s big problems<br />
could be setting the stage <strong>for</strong> excellent stock<br />
returns, much like big budget deficits. Collectively,<br />
the governments of the European Union have<br />
less debt leverage than the United States. The<br />
distribution of the debt is the problem and the<br />
reason why it will take time to develop and<br />
institute policies that will ease investor concerns.<br />
Nonetheless, we are hopeful because there is<br />
scope <strong>for</strong> positive change in Europe.<br />
We are cautious regarding the outlook <strong>for</strong><br />
Canada’s economy and stock market. While our<br />
country will benefit from renewed U.S. economic<br />
strength, there is simply not much room <strong>for</strong><br />
improvement. Home ownership is at a record<br />
high and consumer debt leverage has never been<br />
higher. In fact, Canadian consumers are now<br />
more leveraged than their American and British<br />
counterparts. Housing investment has been a big<br />
driver of Canada’s economy in recent years, but<br />
with consumers increasingly tapped out and<br />
home prices on the richer side of fair, there is not<br />
much latitude <strong>for</strong> Canada’s housing market to get<br />
even better. The resource sector is another area<br />
that has been a boon <strong>for</strong> the Canadian economy<br />
in recent years, yet it too will likely be less of a<br />
growth factor going <strong>for</strong>ward if China’s credit-driven<br />
property boom comes to an end.<br />
Our government managed to balance the books<br />
while the housing and resource sectors were<br />
booming, but now that both have slowed, the<br />
Federal budget is in the red. Canada remains in<br />
excellent fiscal shape relative to other developed<br />
nations and the country will undoubtedly benefit<br />
from the U.S. economic recovery. Still, Canadian<br />
investors would be wise to diversify beyond our<br />
borders.<br />
Overall, we believe that the global economy will<br />
muddle through in 2012. America’s economic<br />
strength and resilience will be the big surprise<br />
this year. Good businesses will continue to find<br />
room <strong>for</strong> improvement and add shareholder<br />
value. Those that embrace quality investments<br />
and <strong>for</strong>eign diversification should do well. Happy<br />
New Year.<br />
murray leith, bcomm, cfa<br />
vice president and director,<br />
investment research
FINANCIALS<br />
Toronto-Dominion Bank (TD)<br />
Brookfield Asset Management Inc. (BAM.A) 1<br />
Onex Corp. (OCX)<br />
Intact Financial Corp. (IFC)<br />
JPMorgan Chase & Co. (JPM)*<br />
The Howard Hughes Corp (HHC)*<br />
Berkshire Hathaway Inc. (BRK.B)* 2<br />
28.6%<br />
Manulife Financial Corp. (MFC)<br />
Royal Bank of Canada (RY)<br />
Bank of Nova Scotia (BNS)<br />
MATERIALS<br />
Barrick Gold Corp. (ABX)<br />
Potash Corporation (POT)<br />
Agrium Inc. (AGU)<br />
ENERGY<br />
Royal Dutch Shell PLC (RDS.B)* 3<br />
Cenovus Energy Inc. (CVE)<br />
TransCanada Corp. (TRP)<br />
Nexen Inc. (NXY)<br />
EnCana Corp. (ECA)<br />
Trinidad Drilling Ltd. (TDG)<br />
INDUSTRIALS<br />
Canadian National Railway Co. (CNR)<br />
3M Co. (MMM)*<br />
United Parcel Service Inc. (UPS)*<br />
Ritchie Bros. Auctioneers Inc. (RBA)<br />
CONSUMER DISCRETIONARY<br />
Starbucks Corp. (SBUX)*<br />
Lowe’s Companies Inc. (LOW)*<br />
Thomson Reuters Corp. (TRI)<br />
INFO TECH<br />
Syntel Inc. (SYNT)*<br />
Dell Inc. (DELL)*<br />
Cisco Systems Inc. (CSCO)*<br />
Apple (AAPL)*<br />
Google (GOOG)*<br />
STMicroelectronics NV (STM)*<br />
CONSUMER STAPLES<br />
The Coca-Cola Co. (KO)*<br />
Diageo PLC (DEO)*<br />
Colgate-Palmolive Co. (CL)*<br />
Sysco Corp. (SYY)*<br />
Loblaw Companies Inc. (L)<br />
Wal-Mart Stores Inc. (WMT)*<br />
TELECOM SERVICES<br />
BCE Inc. (BCE)<br />
UTILITIES<br />
Fortis Inc. (FTS)<br />
HEALTH CARE<br />
Stryker Corp. (SYK)*<br />
Novartis AG ADR (NVS)*<br />
Becton Dickinson and Co. (BDX)*<br />
SUB TOTAL<br />
SHORT-TERM INVESTMENTS<br />
PORTFOLIO TOTAL<br />
odlum brown model portfolio<br />
S&P/TSX<br />
Weight<br />
22.4%<br />
26.6%<br />
5.7%<br />
4.1%<br />
1.4%<br />
2.9%<br />
5.1%<br />
1.9%<br />
1.4%<br />
100%<br />
Dec 15/11<br />
Price<br />
$71.85<br />
$27.39<br />
$32.70<br />
$58.13<br />
$31.76<br />
$45.10<br />
$74.90<br />
$10.25<br />
$48.29<br />
$48.74<br />
$45.79<br />
$40.25<br />
$67.12<br />
$72.44<br />
$31.00<br />
$43.10<br />
$15.02<br />
$18.71<br />
$7.09<br />
$75.03<br />
$78.86<br />
$71.55<br />
$20.48<br />
$43.40<br />
$24.66<br />
$27.02<br />
$45.26<br />
$15.05<br />
$18.04<br />
$378.94<br />
$619.54<br />
$5.52<br />
$66.89<br />
$84.51<br />
$90.58<br />
$28.99<br />
$36.55<br />
$57.95<br />
$40.53<br />
$32.23<br />
$46.63<br />
$56.11<br />
$71.15<br />
Shares Cost Market<br />
Value<br />
1,600<br />
3,700<br />
2,700<br />
1,200<br />
2,000<br />
1,300<br />
600<br />
3,700<br />
750<br />
750<br />
1,900<br />
1,550<br />
900<br />
1,500<br />
1,900<br />
1,400<br />
3,100<br />
2,000<br />
3,900<br />
800<br />
650<br />
650<br />
2,000<br />
1,800<br />
2,500<br />
500<br />
1,500<br />
4,000<br />
3,400<br />
120<br />
75<br />
3,000<br />
1,000<br />
700<br />
550<br />
1,200<br />
900<br />
550<br />
2,000<br />
2,500<br />
1,400<br />
1,050<br />
700<br />
$71,826<br />
$89,816<br />
$49,293<br />
$43,380<br />
$77,846<br />
$63,704<br />
$49,545<br />
$82,991<br />
$23,805<br />
$15,713<br />
$90,915<br />
$64,434<br />
$43,227<br />
$90,034<br />
$65,792<br />
$21,550<br />
$96,024<br />
$66,178<br />
$46,800<br />
$42,264<br />
$56,003<br />
$50,735<br />
$41,880<br />
$41,912<br />
$58,391<br />
$20,605<br />
$29,558<br />
$61,149<br />
$53,270<br />
$39,079<br />
$38,148<br />
$31,490<br />
$49,982<br />
$48,931<br />
$45,094<br />
$42,458<br />
$38,214<br />
$31,394<br />
$69,350<br />
$58,375<br />
$75,744<br />
$57,696<br />
$51,043<br />
$2,285,639<br />
* = Prices in U.S. dollars U.S. Exchange ($US/$CDN) $0.9675 Foreign Weight 49.0%<br />
$114,960<br />
$101,343<br />
$88,290<br />
$69,756<br />
$65,654<br />
$60,600<br />
$46,450<br />
$37,925<br />
$36,218<br />
$36,555<br />
$87,001<br />
$62,388<br />
$60,408<br />
$112,311<br />
$58,900<br />
$60,340<br />
$46,562<br />
$37,420<br />
$27,651<br />
$60,024<br />
$52,981<br />
$48,070<br />
$40,960<br />
$80,745<br />
$63,721<br />
$13,510<br />
$70,171<br />
$62,223<br />
$63,397<br />
$47,001<br />
$48,027<br />
$17,116<br />
$69,138<br />
$61,145<br />
$51,493<br />
$35,957<br />
$32,895<br />
$32,943<br />
$81,060<br />
$80,575<br />
$67,475<br />
$60,895<br />
$51,478<br />
$2,503,732<br />
$21,382<br />
$2,525,114<br />
Portfolio<br />
Weight<br />
26.0%<br />
4.6%<br />
4.0%<br />
3.5%<br />
2.8%<br />
2.6%<br />
2.4%<br />
1.8%<br />
1.5%<br />
1.4%<br />
1.4%<br />
8.3%<br />
3.4%<br />
2.5%<br />
2.4%<br />
13.6%<br />
4.4%<br />
2.3%<br />
2.4%<br />
1.8%<br />
1.5%<br />
1.1%<br />
8.0%<br />
2.4%<br />
2.1%<br />
1.9%<br />
1.6%<br />
6.3%<br />
3.2%<br />
2.5%<br />
0.5%<br />
12.2%<br />
2.8%<br />
2.5%<br />
2.5%<br />
1.9%<br />
1.9%<br />
0.7%<br />
11.2%<br />
2.7%<br />
2.4%<br />
2.0%<br />
1.4%<br />
1.3%<br />
1.3%<br />
3.2%<br />
3.2%<br />
3.2%<br />
3.2%<br />
7.1%<br />
2.7%<br />
2.4%<br />
2.0%<br />
99.2%<br />
0.8%<br />
100%<br />
Dividend<br />
Yield<br />
3.8%<br />
1.9%<br />
0.3%<br />
2.5%<br />
3.1%<br />
0.0%<br />
0.0%<br />
1.0%<br />
4.5%<br />
4.3%<br />
1.4%<br />
0.7%<br />
0.7%<br />
4.6%<br />
2.6%<br />
3.9%<br />
1.3%<br />
4.4%<br />
2.8%<br />
1.7%<br />
2.8%<br />
2.9%<br />
2.2%<br />
1.6%<br />
2.3%<br />
4.7%<br />
0.5%<br />
0.0%<br />
1.3%<br />
0.0%<br />
0.0%<br />
7.2%<br />
2.8%<br />
3.8%<br />
2.6%<br />
3.7%<br />
2.3%<br />
2.5%<br />
5.4%<br />
3.7%<br />
1.8%<br />
4.2%<br />
2.5%<br />
$87.00<br />
$40.00<br />
$44.00<br />
$67.00<br />
$50.00<br />
$75.00<br />
$120.00<br />
$21.00<br />
$55.00<br />
$55.00<br />
$71.00<br />
$62.00<br />
$101.00<br />
$105.00<br />
$47.00<br />
$45.00<br />
$34.00<br />
$20.00<br />
$12.00<br />
$85.00<br />
$105.00<br />
$85.00<br />
$25.00<br />
$48.00<br />
$30.00<br />
$37.21<br />
$65.00<br />
$20.00<br />
$22.00<br />
$525.00<br />
$730.00<br />
$13.00<br />
$80.00<br />
$95.00<br />
$105.00<br />
$36.00<br />
$46.00<br />
$60.00<br />
$42.00<br />
$34.50<br />
$71.00<br />
$70.00<br />
$95.00<br />
1 Class A shares elect on-half of the company’s Board of Directors.<br />
2 A share of Class B common stock has the rights of 1/1,500 th of a share of Class A common stock except that a Class B share has 1/10,000 th of<br />
the voting rights of a Class A share.<br />
3 Class A shares have a Dutch source <strong>for</strong> tax purposes, and the Class B shares have a UK source.<br />
Target<br />
Price<br />
Total<br />
Return<br />
Potential<br />
25%<br />
48%<br />
35%<br />
18%<br />
61%<br />
66%<br />
60%<br />
106%<br />
18%<br />
17%<br />
56%<br />
55%<br />
51%<br />
50%<br />
54%<br />
8%<br />
128%<br />
11%<br />
72%<br />
15%<br />
36%<br />
22%<br />
24%<br />
12%<br />
24%<br />
42%<br />
44%<br />
33%<br />
23%<br />
39%<br />
18%<br />
143%<br />
22%<br />
16%<br />
18%<br />
28%<br />
28%<br />
6%<br />
9%<br />
11%<br />
54%<br />
29%<br />
36%<br />
ob report/3<br />
The <strong>Odlum</strong> <strong>Brown</strong> Model<br />
Portfolio was established on<br />
December 15, 1994 with a<br />
hypothetical investment of<br />
$250,000. The Model provides a<br />
basis with which to measure the<br />
quality of our advice. It also<br />
facilitates an understanding of<br />
how we believe individual<br />
security recommendations could<br />
be used within the context of a<br />
client portfolio. Trades are made<br />
using the closing price on the<br />
day a change is announced.<br />
Per<strong>for</strong>mance figures do not<br />
include any allowance <strong>for</strong> fees.<br />
Past per<strong>for</strong>mance is not<br />
indicative of future per<strong>for</strong>mance.<br />
The <strong>Odlum</strong> <strong>Brown</strong> Model<br />
Portfolio is an all-equity portfolio.<br />
It is important to note that a<br />
well-diversified portfolio should<br />
also include an appropriate mix<br />
of fixed income and money<br />
market instruments, which<br />
will depend on an investor’s risk<br />
tolerance and individual<br />
circumstances.
4/ob report<br />
please read our odlum<br />
brown limited disclaimer &<br />
disclosure / it is important<br />
<strong>Odlum</strong> <strong>Brown</strong> Limited is an independent, full-service<br />
investment firm focused on providing professional investment<br />
advice and objective research. We respect your right<br />
to be in<strong>for</strong>med of relationships with the issuers or strategies<br />
referred to in this report which might reasonably be<br />
expected to indicate potential conflicts of interest with<br />
respect to the securities or any investment strategies discussed<br />
or recommended in this report. We do not act as a<br />
market maker in any securities and do not provide investment<br />
banking or advisory services to, or hold significant positions<br />
in, the issuers covered by our research. Analysts and<br />
their associates may, from time to time, hold securities of<br />
issuers discussed or recommended in this report because<br />
they personally have the conviction to follow their own<br />
research, but we have implemented internal policies that<br />
impose restrictions on when and how an Analyst may buy<br />
or sell securities they cover and any such interest will be<br />
disclosed in our report in accordance with regulatory policy.<br />
Our Analysts receive no direct compensation based on<br />
revenue from investment banking services. We describe<br />
our research policies in greater detail, including a description<br />
of our rating system and how we disseminate<br />
our research, on the <strong>Odlum</strong> <strong>Brown</strong> Limited website at<br />
odlumbrown.com.<br />
This report has been prepared by <strong>Odlum</strong> <strong>Brown</strong> Limited and<br />
is intended only <strong>for</strong> persons resident and located in all the<br />
provinces and territories of Canada, where <strong>Odlum</strong> <strong>Brown</strong><br />
Limited's services and products may lawfully be offered <strong>for</strong><br />
sale, and therein only to clients of <strong>Odlum</strong> <strong>Brown</strong> Limited.<br />
This report is not intended <strong>for</strong> distribution to, or use by, any<br />
person or entity in any jurisdiction or country including the<br />
United States, where such distribution or use would be<br />
contrary to law or regulation or which would subject <strong>Odlum</strong><br />
<strong>Brown</strong> Limited to any registration requirement within such<br />
jurisdiction or country. As no regard has been made as to<br />
the specific investment objectives, financial situation, and<br />
other particular circumstances of any person who may<br />
receive this report, clients should seek the advice of a registered<br />
investment advisor and other professional advisors,<br />
as applicable, regarding the appropriateness of investing in<br />
any securities or any investment strategies discussed or<br />
recommended in this report.<br />
This report is <strong>for</strong> in<strong>for</strong>mation purposes only and is neither a<br />
solicitation <strong>for</strong> the purchase of securities nor an offer of<br />
securities. The in<strong>for</strong>mation contained in this report has<br />
been compiled from sources we believe to be reliable, however,<br />
we make no guarantee, representation or warranty,<br />
expressed or implied, as to such in<strong>for</strong>mation’s accuracy or<br />
completeness. All opinions and estimates contained in this<br />
report, whether or not our own, are based on assumptions<br />
we believe to be reasonable as of the date of the report and<br />
are subject to change without notice.<br />
Please note that, as at the date of this report, the Research<br />
Analyst responsible <strong>for</strong> the recommendations herein, associates<br />
of such Analyst and/or other individuals directly<br />
involved in the preparation of this report hold securities of<br />
the issuer(s) referred to directly or through derivatives.<br />
No part of this publication may be reproduced without the<br />
express written consent of <strong>Odlum</strong> <strong>Brown</strong> Limited. <strong>Odlum</strong><br />
<strong>Brown</strong> Limited is a Member-Canadian Investor Protection<br />
Fund.<br />
<strong>Odlum</strong> <strong>Brown</strong> Limited respects your time and your privacy. If<br />
you no longer wish us to retain and use your personal in<strong>for</strong>mation<br />
preferring to have your name removed from our mailing list,<br />
please let us know. For more in<strong>for</strong>mation on our Privacy Policy<br />
please visit our website at odlumbrown.com.<br />
> <strong>Odlum</strong> <strong>Brown</strong> , s 18 th Annual Address<br />
Debra Hewson, President and Chief Executive Officer, invites you and your guests to <strong>Odlum</strong><br />
<strong>Brown</strong>’s 18 th Annual Address. Join us <strong>for</strong> an in<strong>for</strong>mative discussion on the current investment<br />
environment featuring Vice President and Director of Investment Research, Murray Leith, and<br />
Fixed Income Strategist, Hank Cunningham.<br />
Presentations will take place throughout the province beginning February 13.<br />
Debra Hewson, President<br />
and Chief Executive Officer<br />
west vancouver<br />
Monday, February 13, 7PM<br />
Kay Meek Centre<br />
1700 Mathers Avenue<br />
RSVP by February 6 to Jennifer at<br />
604-844-5338 or jhadley@odlumbrown.com<br />
vancouver<br />
Tuesday, February 14<br />
afternoon session 2PM<br />
Fairmont Waterfront Vancouver<br />
Waterfront Ballroom<br />
900 Canada Place Way<br />
RSVP by February 7 to Jennifer at<br />
604-844-5338 or jhadley@odlumbrown.com<br />
victoria<br />
Wednesday, February 15, 7PM<br />
Delta Victoria Ocean Pointe, Ballroom<br />
45 Songhees Road<br />
RSVP by February 8 to Monica at<br />
250-952-7775 or mpratt@odlumbrown.com<br />
Murray Leith, Vice President and<br />
Director of Investment Research<br />
chilliwack<br />
Thursday, February 16, 7PM<br />
Coast Chilliwack Hotel, Rosedale <strong>Room</strong><br />
45920 First Avenue<br />
RSVP by February 9 to Matt at<br />
604-824-3376 or mehrenreich@odlumbrown.com<br />
Hank Cunningham,<br />
Fixed Income Strategist<br />
south surrey<br />
Tuesday, February 21, 7PM<br />
Morgan Creek Golf Course<br />
3500 Morgan Creek Way<br />
RSVP by February 14 to Jennifer at<br />
604-844-5338 or jhadley@odlumbrown.com<br />
courtenay<br />
Wednesday, February 22<br />
afternoon session 2PM<br />
Crown Isle Resort, Ballroom<br />
399 Clubhouse Drive<br />
RSVP by February 15 to Richard at<br />
250-703-0637 or rdobbs@odlumbrown.com<br />
kelowna<br />
Thursday, February 23, 7PM<br />
The Coast Capri, Ballroom<br />
1171 Harvey Avenue<br />
RSVP by February 16 to Nicole at<br />
250-861-5700 or npelletier@odlumbrown.com<br />
Register online via the<br />
Client Centre at odlumbrown.com<br />
Reserve seating early as space is limited.