1H11 1H10 2010 - Ackermans & van Haaren
1H11 1H10 2010 - Ackermans & van Haaren
1H11 1H10 2010 - Ackermans & van Haaren

Create successful ePaper yourself
Turn your PDF publications into a flip-book with our unique Google optimized e-Paper software.
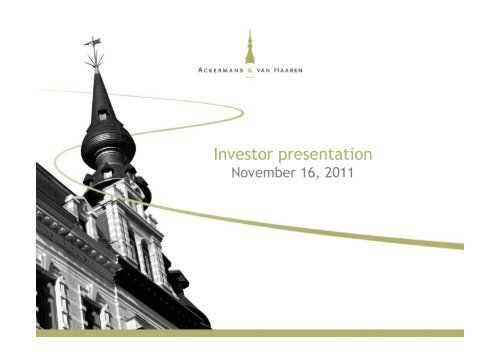
Investor presentation<br />
November 16, 2011
Simplified organisation chart<br />
As per 30/09/11<br />
(*) Sold in 2H11<br />
*<br />
2
Consolidated group result<br />
(in € mio) <strong>1H11</strong> <strong>1H10</strong> <strong>2010</strong> 2009 2008<br />
Contracting, dredging, conc. 20.5 27.4 58.7 50.8 72.8<br />
Real estate and related services -0.8 -0.3 8.6 -0.7 7.5<br />
Private banking 59.3 33.2 63.6 45.3 38.4<br />
Private equity 3.1 7.0 13.3 3.4 7.8<br />
Energy and materials 9.4 8.4 16.5 12.8 9.9<br />
Result from participations 91.5 75.6 160.7 111.6 136.4<br />
Private equity q y capital p gains g<br />
0.3 -0.8 -0.3 4.4 10.4<br />
Result from participations (incl.<br />
capital gains) 91.8 74.8 160.4 116.0 146.8<br />
AvH & subholdings 1.4 -1.5 -0.1 1.2 -36.0<br />
Other non-recurrent result 0.2 0.2 0.5 0.3 3.7<br />
CConsolidated lid d group result l 93 93.44 73 73.55 160 160.88 117 117.55 114 114.66<br />
3
Highlights <strong>1H11</strong><br />
DEME<br />
Strong increase of order book to € 2,422 mio (€ 2,387 mio per 31.03.11 and € 1,935 mio per 31.12.10)<br />
Loss on environmental project in Santos (Brazil), but strong fleet occupation<br />
REAL ESTATE<br />
LRE: portfolio value of € 504 mio; Occupancy rate 94.1%; Rental yield 7.33%<br />
Extensa : limited contribution from recurring sales of land plots and promotion projects<br />
Cobelguard: agreement to sell to Securitas (pending ‘competition’ competition clearance)<br />
Duval: turnover increase from promotion. Profitability impacted by seasonal effect holiday parks.<br />
Anima Care: acquisition of “Clos du Trimbleu” (Blegny, 47 beds) and “Zevenbronnen” (Walshoutem, 64 beds)<br />
PRIVATE BANKING<br />
Delen – Private Bank<br />
•Continued strong inflow of AUM to € 15,829 mio (vs € 15,585 mio per 31.03.11)<br />
•Agreement to acquire majority stake (73.5%) in JM Finn & Co<br />
Bank J.Van Breda & C°<br />
•Takeover of Antwerps Beroepskrediet (ABK) finalized: conso impact (badwill) € 27 27.9 9 mio (group share)<br />
•Total client assets increased to € 7,174 mio, of which € 308,0 mio from ABK (vs 6,696 mio per<br />
31.03.11); loan portfolio increased to € 2,960 mio, of which € 230,9 mio from ABK (vs € 2,693 mio (per<br />
31.03.11); stable low loan loss provision<br />
PRIVATE EQUITY<br />
Continued improvement of most private equity results; non recurring charges at Hertel<br />
Groupe Flo: Increase of turnover and net result (+27%) despite slow market<br />
Increase of GIB participation in Trasys Group to 83.89% and Groupe Flo to 47.6%<br />
ENERGY AND MATERIALS<br />
Sipef: Strong increase of palm oil production (+13%), turnover (+38%) and net result (+77%)<br />
Increase of AvH participation to 25.64%<br />
4
Highlights 3Q11<br />
DEME<br />
Order book at high level: € 2,260 mio (€ 2,422 mio per 30.06.11 and € 1,935 mio per 31.12.10)<br />
Continued high activity level<br />
REAL ESTATE<br />
LRE: portfolio value of € 503 mio; Occupancy rate 93.9%; Rental yield 7.29%<br />
Extensa : limited contribution from sales of land plots and promotion projects<br />
Cobelguard: sale to Securitas completed in October<br />
Duval: expected improvement of result realized<br />
PRIVATE BANKING<br />
Delen – Private Bank<br />
•AUM € 14,910 mio (€ 15,829 mio per 30.06.11 and € 15,272 mio per 31.12.10). AuM impacted by very<br />
volatile market, partially compensated by important net inflow<br />
•Acquisition of majority stake (73.5%) in JM Finn & Co approved in September<br />
Bank J.Van Breda & C°<br />
•Total client assets assets, excl ABK ABK, increased to € 66,936 936 mio (€ 6 6, 866 mio per 30 30.06.11 06 11 and € 66,369 369 mio per<br />
31.12.10); loan portfolio , excl ABK, amounted to € 2,730 mio; low loan loss provision<br />
•Participation in Antwerps Beroepskrediet (ABK) increased to 91.76%<br />
PRIVATE EQUITY Q<br />
Private equity participations showed divergent trends<br />
Groupe Flo: Increase of turnover and net result despite declining customer confidence<br />
Increase of Sofinim participation in Egemin to 59.5%<br />
ENERGY AND MATERIALS<br />
Sipef: Continued positive trend with increase of palm oil production (+9%)<br />
Max Green: biomass plant at Rodenhuize officially commissioned<br />
5
Other key figures (<strong>1H11</strong>-3Q11)<br />
Consolidated balance sheet AvH group 3Q11 <strong>1H11</strong> <strong>2010</strong><br />
(i (in € mio) i )<br />
Shareholders' equity (group share) 1,743.6 1,711.4<br />
Net cash AvH and subholdings 70.0 69.7* 77.7**<br />
* After € 51.3 mio dividends, € 23.2 mio investments (Sipef, Anima Care) and € 7.8 mio divestments<br />
** After € 47.7 mio dividends, € 41.1 mio investments (Hertel, Sipef, Financière Duval, OQM and<br />
Anima Care) and € 21.6 mio divestments (Engelhardt)<br />
Key figures per share 3Q11 <strong>1H11</strong> <strong>2010</strong><br />
Number of shares (#) 33 33,496,904 496 904 33 33,496,904 496 904<br />
Net result per share (€) 2.82 4.86<br />
Gross dividend 1.55<br />
Net equity 52.05 51.09<br />
Stock price: highest 71.72 71.72 64.9<br />
llowest t 51 51.00 00 61 61.03 03 45 45.7 7<br />
close 53.06 66.99 62.5<br />
6
2500<br />
2000<br />
1500<br />
1000<br />
500<br />
0<br />
Net equity vs market capitalization<br />
(in million euro)<br />
Average annual growth of<br />
13.2% over the last 10 year<br />
(2000-<strong>2010</strong>)<br />
Net equity (share of group)<br />
Market capitalization<br />
1998 1999 2000 2001 2002 2003 2004 2005 2006 2007 2008 2009 <strong>2010</strong> <strong>1H11</strong><br />
7
AvH share performance vs. BEL 20<br />
AVH AVH rebased to 100 BEL20 rebased to 100<br />
8
Net cash position AvH group<br />
(<strong>1H11</strong>-3Q11)<br />
(<strong>1H11</strong> 3Q11)<br />
AvH & Private Total Total<br />
(in € 000) subholdings equity (30/06/2011) (30/09/2011)<br />
Investment portfolio 22,929 22,929 19,288<br />
Term deposits 40,747 9,900 50,647 68,977<br />
Intercompany p y deposits p -67,035 , 67,035 ,<br />
0 0<br />
Cash 4,681 420 5,101 2,527<br />
Sh Short t t term ddebt bt - commercial i l paper -37,782 37 782 -37,782 37 782 -38,768 38 768<br />
Own shares (#364,400) 17,956 17,956 17,422<br />
Net cash GIB (50%) and Other 10,856 522<br />
(equity consolidation)<br />
-18,504 77,355 69,708 69,970<br />
9
DEME<br />
One of the<br />
largest and most<br />
diversified<br />
dredging and<br />
marine<br />
engineering<br />
companies in the<br />
world ld<br />
Segment ‘Contracting, dredging<br />
and concessions’<br />
concessions<br />
• Dredging was at the origins of <strong>Ackermans</strong> & <strong>van</strong> <strong>Haaren</strong> in 1876<br />
• Later diversification towards (maritime) construction and concessions<br />
VAN LAERE<br />
General<br />
contractor of<br />
large<br />
construction<br />
projects<br />
NMP<br />
Operator p of<br />
pipelines for gas<br />
and chemicals<br />
RENT-A-PORT<br />
Specialised p in port p<br />
development and<br />
logistics<br />
Since 1876 Since 1989 Since 1994 (NIM) Established in 2007<br />
10
Contracting, dredging and concessions<br />
Contribution to the AvH consolidated<br />
net result (group share) (in € mio) <strong>1H11</strong> <strong>1H10</strong> <strong>2010</strong><br />
Contracting, dredging and concessions 20.5 27.4 58.7<br />
DEME 20.5 27.8 58.3<br />
Rent-A-Port -1.5 -1.5 -1.5<br />
A.A. Van Laere 0.8 0.4 0.5<br />
Nationale Maatschappij der Pijpleidingen 0.7 0.7 1.5<br />
21.9%<br />
22.7%<br />
11
Ruwais, Abu Dhabi (UAE)<br />
DEME: Creating land for the future<br />
One of the largest and most diversified dredging and<br />
marine engineering companies in the h world ld<br />
London Gateway Project Project (UK)<br />
Scaldis, heavy lifting: Rambiz on<br />
Thornton Bank (C-Power wind farm)<br />
Walney (UK)<br />
12
DEME: key figures<br />
Consolidated key figures (in € mio) <strong>1H11</strong> <strong>1H10</strong> <strong>2010</strong><br />
Turnover 825.5 887.8 1,800.6<br />
EBITDA 138.2 155.3 328.7<br />
EBIT 61.9 83.8 176.9<br />
Net result 41.0 55.6 116.5<br />
Net cash flow 112.3 131.2 274.3<br />
Shareholder's equity 674.0 604.1 667.3<br />
Net financial position -602.3 -511.1 -481.0<br />
Total assets 2,277.1 2,135.1 2,172.5<br />
# personnel 3,734 3,583 3,635<br />
13
DEME: operational highlights <strong>1H11</strong><br />
• Turnover of € 825 mio with strong capacity utilization (see next slide)<br />
• Decrease of EBITDA and net result due to loss on environmental project p j in Santos<br />
(Brazil)<br />
• Underlying recurring EBITDA FY11 (excl. non-recurring results) in line with FY10<br />
• 50% partnership announced with Hochtief for construction and management of<br />
lifting vessels for offshore windfarms<br />
Evolution net result - EBIT - EBITDA as a % of turnover<br />
Ruwais<br />
14
DEME: capacity utilization<br />
(# ( weeks) )<br />
Ruwais<br />
15
DEME: breakdown turnover<br />
Consolidated turnover Consolidated turnover Consolidated turnover<br />
per region per activity per type of f customer<br />
10%<br />
10%<br />
13%<br />
3%<br />
13%<br />
5%<br />
46%<br />
3%<br />
10%<br />
18%<br />
5%<br />
4%<br />
6%<br />
54%<br />
10% 11%<br />
13% 12%<br />
<strong>2010</strong> <strong>1H11</strong> <strong>2010</strong> <strong>1H11</strong><br />
Europe EU Europe ‐ non EU<br />
Middle East India, Pakistan<br />
Africa America<br />
Asia & Oceania<br />
10%<br />
16%<br />
51%<br />
CCapital it lddredging d i<br />
Maintenance dredging<br />
Fallpipe & landfalls<br />
Environmental<br />
Marine works*<br />
7%<br />
17%<br />
53%<br />
* Including marine heavy lifting (Scaldis), offshore services<br />
(GeoSea), DEME building materials<br />
20%<br />
15%<br />
4%<br />
20%<br />
41%<br />
<strong>1H11</strong><br />
Government<br />
Oil and gas<br />
Mining<br />
Renewables<br />
Other<br />
16
DEME: order book (<strong>1H10</strong>-3Q11)<br />
Order book at high level, well-spread over different regions and activities<br />
3Q11: € 2,260 mio (vs € 2,422 mio at 30.06.11 and € 1,935 mio end <strong>2010</strong>)<br />
New orders in Belgium (C-Power offshore wind), Australia (ao Gladstone),<br />
Africa, South America<br />
Outlook 2011<br />
• Strong tender activity worldwide (see next slide)<br />
• Given the loss on Santos and several new large projects which will only fully<br />
contribute from 2012, results will remain below the record level of <strong>2010</strong>. Outlook<br />
for 2012 2012-2013 2013 is favourable (taking into account order book and tender activity)<br />
Evolution order book 2003-<strong>1H11</strong> (in € mio)<br />
<strong>1H11</strong> <strong>2010</strong><br />
Other 14% 24%<br />
Middle East + India 9% 7%<br />
Asia Pacific 22% 8%<br />
Europe 26% 37%<br />
Benelux 29% 25%<br />
17
DEME: market fundamentals remain<br />
strong<br />
Market driven by<br />
- Worldwide trade and population growth<br />
- Global world energy & commodities: coal, iron ore, oil & gas, renewable energy<br />
- Climate change: rising sea levels, coastal protection<br />
Examples<br />
- EU: London Gateway Gateway, Russia & Baltic Baltic, Belgium Belgium, Netherlands<br />
- Americas: Panama, Brazil, Mexico, Venezuela, Colombia…<br />
- Africa: South-Africa, Angola, Nigeria, Ghana, …<br />
- Middle-East: Abu Dhabi (Ruwais, Adnoc energy islands), Qatar (Doha Port)<br />
- AAustralia: li I Iron ore: P Port HHedland; dl d CCoal: l NNewcastle, l Ab Abott PPoint, i Gl Gladstone, d<br />
Hay Point; LNG: Wheatstone, Gladstone, Ichtys<br />
- Singapore: Reclamation projects for port & industrial estate<br />
- Indian subcontinent: port and LNG related<br />
- Offshore wind: Belgium (C-Power), Germany (En BW Baltic),<br />
Ireland, UK, France<br />
- Fallpipe & landfalls: Nordstream,Russia<br />
- Environmental: Belgium, France, UK and new markets<br />
Deepsea mining<br />
New diversifications<br />
- OWA (services for offshore wind assistance)<br />
- Combined Terminal Operation Worldwide (CTOW) (55%)<br />
- DEME Blue Energy (wave and tidal energy)<br />
Innovation<br />
- OceanflORE (deepsea mining, with IHC Merwede)<br />
- HGO InfraSea Solutions (jack-up vessels for offshore windfarm construction and oil&gas services)<br />
18
DEME profiting from multidisciplinarity:<br />
offshore wind farms before Belgian g coast<br />
19
DEME: Thornton Bank project<br />
(offshore ( wind farms) )<br />
Location: North Sea (±30 km offshore of Belgian coast)<br />
Ph Phase I I: CCompleted l t d i in 2008<br />
Phase II & III: Started in <strong>2010</strong><br />
Phase 2: 24 Jackets & WTG’s (6.15MW) + OTS to be operational in 2012 (147,6 MW)<br />
Phase 3: 24 Jackets & WTG’s + 2nd 150 kV Marine Cable to be operational in 2013<br />
(147,6 MW)<br />
Total otal of o 54 5 Wind W d Turbine u b e Ge Generator e ato (W (WTG) G)<br />
Offshore Transformation Station (OTS)<br />
20
DEME: Gladstone Western Basin<br />
dredging g g project p j (Australia) ( )<br />
- Customer: Gladstone Ports Corporation<br />
- Will make this LNG and raw materials port into one of<br />
the largest of Australia<br />
F Four contracts: t t value l of f € 720 mio i<br />
- Early works dredging: € 26 mio<br />
- Timing: from 4/<strong>2010</strong> till 3/2011<br />
- Contractor: Dredging International (Australia)<br />
- Parcel 5 dredging and reclamation works: € 190 mio<br />
- Enable the construction of LNG terminals<br />
- Contractor: Dredging International (Australia) – Van Oord Australia (50/50)<br />
- Timing: from 6/2011 till 3/2012<br />
- Parcels 1, 3 en 4 dredging and reclamation works: € 415 mio<br />
- Follow-up of works on Parcel 5<br />
- Contractor: Dredging International (Australia) – Van Oord Australia (50/50)<br />
- Timing: till 12/2014<br />
- Parcel 7: dredging and reclamation works: € 90 mio<br />
- Construction of coal terminal for Wiggins Island Coal Terminal<br />
- Contractor: Dredging International (Australia) – Van Oord Australia (50/50)<br />
- Ti Timing: i 8/2011 till 12/2014<br />
Gladstone<br />
Deepsea mining<br />
21
Continued investment in competitive,<br />
multifunctional & versatile fleet (2011-2012)<br />
(2011 2012)<br />
• 1 DP DP-DT DT fallpipe vessel Flintstone (19 (19,000 000 T – Singapore Singapore, in use as of July ‘11) 11)<br />
• 1 gravel trailer Victor Horta (5,000 m³ - IHC, in use as of July ‘11)<br />
• 2 seagoing rock cutters Al Jarraf and Amazone (13,000 kw – Singapore, in use as of Aug ‘11<br />
resp. J Jan ‘12)<br />
• 1 megatrailer next generation plus Congo River (30,000 m³ - IHC, in use as of July ‘11)<br />
• 1 trailer dredger Breughel (11,650 m3 - IHC, operational 2011)<br />
• 1 seagoing rock cutter Ambiorix (28,000 kw – IHC, operational 2012)<br />
• 1 jumbo jack-up vessel Neptune (IHC, operational 2012)<br />
• 1 backhoe dredger (joint ownership) (Ravestein, operational end 2011)<br />
• 1 multipurpose jack-up vessel Innovation (joint ownership) (Poland, operational 2012)<br />
Breughel<br />
Congo River<br />
22
Rent-A-Port<br />
Specialized company for port development, port management<br />
and logistics setup around 2 former DEME senior executives<br />
• Main activities in Vietnam (Dinh Vu), Nigeria (OK Free Trade Zone),<br />
Oman (Port of Duqm)<br />
• Rentel (288 MW offshore wind farm concession in North Sea) – 50%<br />
Consolidated key figures (in € mio) <strong>1H11</strong> <strong>1H10</strong> <strong>2010</strong><br />
Turnover 1.6 2.2 6.1<br />
Net result -3.3 -0.5 -3.8<br />
Shareholder's equity -0.8 7.4 3.3<br />
Net financial position -9.6 -7.6 -8.8<br />
23
Van Laere<br />
General contractor of large construction projects<br />
Highlights <strong>1H11</strong><br />
• Increase of net result thanks to better project margins<br />
• Order book: € 174 mio<br />
• Agreement to acquire construction activity of project developer<br />
Vooruitzicht (from August 1, 2011) to consolidate position in Belgian market<br />
CConsolidated lid t d k key figures fi (i (in € mio) i ) <strong>1H11</strong> <strong>1H10</strong> <strong>2010</strong><br />
Turnover 56.5 65.0 116.2<br />
Net result 0.8 0.4 0.5<br />
Shareholder's equity 33.8 32.9 33.0<br />
Net financial position 6.4 8.7 10.1<br />
# personnel 466<br />
State archives (Bruges)<br />
24
NMP / SNTC<br />
Operator of 700 km of pipelines for transport of<br />
industrial gases and chemicals in Belgium<br />
Highlights<br />
• Recurrent activities resulted in stable results<br />
Consolidated key figures (in € mio) <strong>1H11</strong> <strong>1H10</strong> <strong>2010</strong><br />
Turnover 6.2 6.2 12.3<br />
Net result 1.0 0.9 2.0<br />
Net cash flow 1.9 1.8 3.8<br />
Shareholder's equity 27.3 26.6 27.7<br />
Net financial position 12 12.33 10 10.11 12 12.44<br />
25
EXTENSA/<br />
LEASINVEST<br />
Real estate<br />
management and<br />
development<br />
Si Since 1994 (NIM)<br />
Segment ‘Real estate and related<br />
services’ services<br />
• First step in this sector through the acquisition of Leasinvest (via NIM in 1994)<br />
• Afterwards, acquisition of Extensa, IPO of real estate investment trust LRE<br />
and internationalisation of activities (e (e.g. g Romania Romania, Turkey)<br />
• Recent diversification towards related activities, such as security, holiday<br />
parks and senior care facilities<br />
COBELGUARD FIN FIN. DUVAL<br />
ANIMA CARE<br />
Security company Multidisciplinary Initiative in<br />
focused on static real estate group health & senior<br />
and mobile<br />
with activities in RE care sector<br />
security and store promotion, tourism<br />
theft prevention (100,000 beds), health<br />
(N° 3 in Belgium) care (1,102 beds) and<br />
parkings (5,200 places<br />
in Paris)<br />
Si Since 2006 Since 2007<br />
Si Since 2009<br />
26
Real estate and related services<br />
Contribution to the AvH consolidated net<br />
result (group share) (in € mio) <strong>1H11</strong> <strong>1H10</strong> <strong>2010</strong><br />
Real estate and related services -0.8 -0.3 8.6<br />
Extensa (1)<br />
Extensa -11.4 4 00 0.0 12 1.2<br />
Leasinvest Real Estate (2)<br />
3.1 1.7 5.0<br />
Cobelguard 0.1 0.5 1.0<br />
Groupe Financière Duval -2.8 2.8 -2.5 2.5 1.4<br />
Anima Care 0.1 -0.1 0.0<br />
(1) - Contribution from ongoing land sales (Wondelgem, Kuringen)<br />
- Ongoing project development (% completion): Roeselare, Roeselare Hasselt Cederpark Cederpark, Istanbul<br />
(2) After negative mark-to-market of portfolio valuation (share AvH - <strong>1H11</strong>: € -0.7 mio, <strong>1H10</strong>: € -1.9<br />
mio, <strong>2010</strong>: € -3.0 mio)<br />
27
Extensa Group<br />
Extensa: real estate development focused on residential and mixed<br />
development p projects p j<br />
Land development<br />
300,000 m² – 400,000 m² in Belgium<br />
Property development<br />
450,000 m² (Extensa share): 50% residential,<br />
30% office, 15% retail, 5% logistics<br />
Home market: Belgium, Luxembourg<br />
New markets: Romania, Slovakia, Turkey<br />
Leasinvest Real Estate: real estate management for offices, logistics<br />
and retail<br />
(Belgium, Luxembourg)<br />
Real estate portfolio value € 503 mio<br />
De Munt (Roeselare)<br />
The Crescent (Brussels)<br />
28
Extensa Group: conso balance sheet<br />
(Extensa – LRE combined)<br />
Consolidated balance sheet (in € mio) 30/06/11 31/12/10 30/06/11 31/12/10<br />
RE investments & Leasings 51.2 50.9 Net equity 127.5 124.8<br />
a.o. T Tour &Taxis &T i (50%) (50%): FV yield i ld of f 77.25% 25% 21 21.55 21 21.0 0 (i (incl. l SSub. b l loan AAvH H € 13 13.9 9 mio) i )<br />
a.o Wegener -Halliburton: rental yield 6.1% 18.7 19.5<br />
173,072 shares Retail Estates 8.5 8.0<br />
LLand d development d l t 15 15.55 16 16.22<br />
Real estate projects 57.6 50.9<br />
Leasinvest Real Estate 79.5 80.9 Financial debts (2)<br />
1,173,866 shares (1)<br />
90.5 97.7<br />
Oh Other assets 31 31.88 42 42.88 OOther h liabilities li bili i 17 17.66 19 19.22<br />
a.o. Cash € 17.2 (<strong>1H11</strong>), € 22.4 mio (<strong>2010</strong>)<br />
Total otal assets 235.6 35.6 241.7 . Total otal liabilities l ab l t es 235.6 35.6 241.7 .<br />
(1) AvH holding directly 30,236 shares (2) Net financial debt <strong>2010</strong>: € 75.3 mio, <strong>1H11</strong>: € 73.4 mio<br />
29
Leasinvest Real Estate (<strong>1H11</strong>-3Q11)<br />
Real Estate Investment Trust (bevak – sicafi)<br />
(in € mio) 3Q11 <strong>1H11</strong> <strong>2010</strong><br />
Operational result 15.8 30.9<br />
N Net result l 10 10.33 14 14.33<br />
Net equity (1)<br />
261.2 270.7 275.4<br />
Portfolio real estate - fair value 502 502.88 503 503.77 494 494.22<br />
Rental yield (%) 7.29 7.33 7.41<br />
Occupancy rate (%) 93.9 94.1 97.5<br />
Per share (€)<br />
Net asset value (1)<br />
65.36 67.74 68.92<br />
Stock price - closing 62.05 69.05 63.36<br />
High 70 70.00 00 70 70.00 00 68 68.89 89<br />
Low 58.27 64.75 56.66<br />
Dividend 4.10<br />
• Operational result impacted by lower rental income from sale of Axxes Business Park<br />
and Avenue Louise 250 in <strong>2010</strong>, only partially offset by the transaction with Redevco<br />
on Brixton Business Park<br />
• Increase of net result after negative mark-to-market of portfolio valuation (100% -<br />
<strong>1H11</strong>: € -2.5 2 mio, <strong>1H10</strong>: 0 € -6.3 63 mio, 20 <strong>2010</strong>: 0 € -10 0 mio)<br />
• Total debt <strong>1H11</strong>: € 240 mio (debt ratio: 46.72% vs 44.13% end <strong>2010</strong>)<br />
• 3Q11: decrease net current result due to buildings sold in <strong>2010</strong>; debt ratio: 47.87%<br />
30
16 buildings<br />
€ 227 million (45%) ( )<br />
87,317 m²<br />
Leasinvest Real Estate: portfolio<br />
(30/06/2011)<br />
Total portfolio of 54 buildings<br />
with a value of € 504 million and 350,059 m²<br />
38 buildings<br />
€ 277 million (55%)<br />
262 262,742 2 m² ²<br />
31
Leasinvest Real Estate:<br />
tailor-made (re)developments ( ) p <strong>1H11</strong><br />
Canal Logistics (Neder-Over-Heembeek)<br />
• Acquisition of a strategically situated development<br />
project of 47,000 m² (+ 2,500 m² offices) state-of-theart<br />
logistics site<br />
• 1st phase purchased <strong>1H10</strong>, first tenant starting 3Q11<br />
(7 (7,200 200 m² m with option to increase to 10,000 10 000 m²) m )<br />
• 2nd phase to be acquired 2H11<br />
The h Crescent (Brussels) l<br />
• Transformation into ‘green intelligent’ business center<br />
by the end of 2011<br />
• Service contract agreements signed for 45% of surface<br />
Diekirch (Luxembourg)<br />
• Development started end <strong>2010</strong> for a new 1,356 m²<br />
retail warehouse finished in 05/2011<br />
• Pre-leased for 12.5 years<br />
• Positive mark-to-market valuation booked in 2Q11<br />
32
Extensa: land development<br />
Book value per 30/06/2011: € 15.47 mio<br />
Location Total area Project (share Extensa) Permit Saleable<br />
land<br />
(Extensa)<br />
Sold as<br />
per<br />
30/06/11<br />
Average<br />
sales<br />
price<br />
Gh Ghent‐Wondelgem W d l 171 171,900 900 m² ² Ph Phase 11: 118 parcels, l project<br />
land for 100 apartments and<br />
social housing<br />
AAprill 2006 72 72,000 000 m² ² 70 70,940 940 m² ² 260 €/ €/m² ²<br />
Phase 2: 56 parcels July 2008 14,540 m² 14,540 m² 320 €/m²<br />
Phase 3: 21 parcels to be obtained 3,450 m² start sell<br />
Q2 2012<br />
Plot 337: project land for 14 to be obtained 1,000 m² start sell<br />
apartments<br />
Q2 2012<br />
90,990 m² ² 85,480 m² ²<br />
Hasselt‐Kuringen 33,400 m² Phase 1: 20 parcels & project<br />
land for 30 apartments<br />
January 2008 22,370 m² 22,370 m² 180€/m²<br />
Phase 2: 5 parcels March <strong>2010</strong> 3,740 m² 3,011 m² 180€/m²<br />
Antwerp‐Kontich 254,000 m² Phase 1: 162 parcels & project delayed due to<br />
land for 45 apartments p appeal pp ( (2012?) )<br />
Phase 2: 99 parcels & project delayed due to<br />
land for 18 apartments appeal (2012?)<br />
Phase 3: 111 parcels & project delayed due to<br />
land for 64 apartments appeal (2012?)<br />
Leuven‐Heverlee 65,000 m² 38 parcels & project land for<br />
24 park houses<br />
delayed due to<br />
appeal (2012?)<br />
26,110 m² 25,381 m²<br />
63,870 m²<br />
41,470 m²<br />
48,600 m²<br />
153,940 m²<br />
25,500 m²<br />
33
Extensa: project development<br />
Book value per 30/06/2011: € 57.60 mio<br />
Major active projects Permit Total units Sold as per<br />
(Extensa) 30/06/11<br />
Roeselare, De Munt<br />
(50% Extensa)<br />
Phase 1B: apartments February 2009 38 units 34 units<br />
Phase 1A: apartments February 2009 13 units 4 units<br />
Phase 2C: apartments To be obtained<br />
2011<br />
46 units<br />
Phase 2D: apartments To be obtained<br />
2012<br />
46 units<br />
Retail A+B+C+D February b 2009 8,634 m² ² 1,875 m² ²<br />
Parkings February 2009 471 places 247 places<br />
Hasselt‐Runkst, CederPark Phase 1A&B: 25 houses and 21<br />
apartments<br />
September 2008 46 units 24 units<br />
Phase 1C: 27 houses September 2008.<br />
Permit change<br />
introduced<br />
27 units<br />
Phase 2: 73 houses To be obtained 73 units<br />
Phase 3: 144 apartments To be obtained 144 units<br />
34
Extensa: project development<br />
Belux<br />
Brussels, Tour & Taxis (50%): 30 ha – 370,000 m²<br />
• Royal Depot 44,880 m² (32,064 m² offices, 5,557 m² archives, 7,259 m² retail: fully let)<br />
• The Warehouses: trade fair and exhibition center: 17,500 m²<br />
� Royal Depot/Warehouses valued at implicit yield of 7.25% (€ 103.5 mio vs debts<br />
of € 46 mio)<br />
• Development potential of 370,000 m² secured by Brussels Government decision in 3Q09<br />
• Building permit obtained for 218,000 m² mixed use 1Q10<br />
• First office building of 16,500 m² m secured with BIM/IBGE to be delivered 1Q13<br />
• Underground car park 250 cars to be deliverd 4Q12<br />
BIM/IBGE<br />
35
Extensa: project development<br />
Belux<br />
GD G.D. Luxembourg Luxembourg, Cloche d’Or d Or (50%): 20 ha – 400 400,000 000 m²<br />
• Development potential of 400,000 m²<br />
• Master plan approved, PAP obtained 3Q10, infrastructure approvad 3Q11<br />
• Phase I (300 residential units, 40,000 m² offices and 60,000 m² retail & leisure)<br />
under development; retail permissions obtained; hypermarket Auchan secured<br />
• Ilot A residential part to be developed first<br />
36
Extensa: project development<br />
New markets<br />
• Turkey, Istanbul - 100%<br />
• BBuilding ildi permit it f for 200 apartment t t<br />
building in central Istanbul (Bomonti)<br />
• Construction started in 3Q10, delivery in 3Q11<br />
and sold for 69%<br />
• Studio building (# 114) permit obtained, adjacent<br />
to apartments: foundation works started<br />
•Romania, R i partnership t hi i in retail t il parks k<br />
• 2008: Focsani (20%) – 51,000 m²: 77% rented out; valued at yield of 9.5%<br />
• 2009: Deva (20%) - 39,000 m²: delayed until confirmation by anchors<br />
•Extensa (Romania) ( ) – 50%<br />
Land positions acquired (2008) in Bucarest (offices, 24.000 m²) and Arad<br />
(residential/ retail)<br />
•Slovakia, Sl ki TTrnava - 50%<br />
• Total of 36 ha for development of a business park (retail, logistics and<br />
industrial): 11 ha of land re-sold to end users since 2008<br />
Bomonti<br />
37
Groupe Financière Duval (<strong>1H11</strong>-3Q11)<br />
French group focused on real estate projects, services and residences<br />
Highlights <strong>1H11</strong><br />
• Real estate promotion activities (CFA): Increased activity leading to improved<br />
results with improved quality of projects pipeline<br />
• SServices i (Y (Yxime) i ) (4 (4.5 5 mio i m² ² property t under d management) t)<br />
• Tourism (Odalys, NGF): holiday parks (100,000 beds, 283 sites), golf sites (26).<br />
Successful summer leading to improved results in 2H11<br />
• Health (Residalya) (1,102 beds, 18 sites)<br />
• Parkings (ParkA’) (5,200 parking places)<br />
• 3Q11: Expected improvement of result realized, thanks to successful summer<br />
season at Odalys and good evolution of activities and portfolio of CFA<br />
Key figures (in € mio) <strong>1H11</strong> <strong>1H10</strong> <strong>2010</strong><br />
Turnover 178.0 118.0 321.3<br />
EBIT -13 13.66 -14 14.66 11 11.77<br />
Net result -7.2 -8.3 3.2<br />
Shareholder's Shareholder s equity 85 85.77 72 72.77 94 94.88<br />
Net financial position -104.2 -106.3 -72.8 Granvelle<br />
38
Anima Care<br />
Anima Care focuses on the health and care sector in<br />
Belgium, g , pprimarily y in the higher g market segment g of senior care<br />
residences<br />
Highlights g g <strong>1H11</strong><br />
• Increase of turnover and net result<br />
• Acquisition in February 2011: Blegny (47 beds), with new-building of 120<br />
beds being prepared<br />
• AAcquisition i iti i in JJune 2011 2011: WWalshoutem lh t (64 beds), b d ) currently tl extended t d d ( (+41 41<br />
beds)<br />
• Total portfolio of 888 beds and service flats (384 beds and 38 service flats in<br />
operation) p )<br />
Key figures (in € mio) <strong>1H11</strong> <strong>1H10</strong> <strong>2010</strong><br />
Turnover 7.1 3.7 8.8<br />
EBITDA 1.0 0.5 1.2<br />
Net result 0.1 -0.1 0<br />
Shareholder's equity 12.1 6.0 9.9<br />
Net financial position -11.4 -8.4 -8.4<br />
39
Cobelguard (<strong>1H11</strong>-3Q11)<br />
Sold to Securitas (2H11)<br />
Security company focused on static guarding and surveillance by<br />
unarmed security guards on private property<br />
• Largest – purely Belgian – security company, employing 1,642 security agents<br />
• Startup of CIT (cash in transit)-transport activities (greenfield developed out<br />
of Brinks bankruptcy)<br />
Highlights <strong>1H11</strong>:<br />
• Increase of turnover not reflected in net result due to start of new activities<br />
and strong competition<br />
• Creation of BeMARC (67.2%): new cooperative initiative for alarm monitoring<br />
and technical assistance (operational 2H11)<br />
• 3Q11: Sale of Cobelguard to Securitas approved in October. AvH realized<br />
li limited i d capital i l gain i<br />
Key figures (in € mio) <strong>1H11</strong> <strong>1H10</strong> <strong>2010</strong><br />
Turnover 32.8 29.2 58.6<br />
EBIT 1.3 2.2 4.3<br />
Net result 0.9 1.7 2.9<br />
Shareholder's equity 10.7 9.1 10.3<br />
Net financial position -2.6 -1.4 0.7<br />
40
Segment ‘Financial services’<br />
• 1992: Merger with Bank Delen (50/50)<br />
1998: Acquisition of Bank J Van Breda & Co • 1998: Acquisition of Bank J.Van Breda & C and creation of Finaxis (60/40)<br />
o and creation of Finaxis (60/40)<br />
• 2004: Buy out Finaxis minority: AvH share increases to 75% (2008: 78.75%)<br />
DELEN – PRIVATE BANK<br />
Private bank focused<br />
on discretionary asset<br />
management and d<br />
patrimonial advice for<br />
private clients<br />
Since 1992<br />
BANK J.VAN BREDA & CO Specialised advisory bank<br />
for entrepreneurs and<br />
lib liberal l professions f i<br />
Since 1992 Si Since 1998 Si Since 2000<br />
ASCO-BDM<br />
Insurance group<br />
focused on marine and<br />
iindustrial d i l iinsurance<br />
41
Finaxis organisation chart<br />
15%<br />
AvH Promofi<br />
75% 25%<br />
Delen Investments CVA<br />
Finaxis<br />
99% 100%<br />
Bank J.Van Breda & C o<br />
100% 73% 92%<br />
Bank Delen JM Finn & Co<br />
ABK<br />
42
Financial services (<strong>1H11</strong>-3Q11)<br />
Contribution to the AvH consolidated net result<br />
(group share) (in € mio) <strong>1H11</strong> <strong>1H10</strong> <strong>2010</strong><br />
Financial services 59.3 33.2 63.6<br />
Finaxis-Promofi Finaxis Promofi -00.1 1 -00.3 3 -00.3 3<br />
Delen - Private Bank 23.4 21.8 42.7<br />
Bank J.Van Breda & C o<br />
36.1 10.3 20.2<br />
ASCO-BDM ASCO BDM -00.1 1 14 1.4 09 0.9<br />
Total assets under management (in € mio) 3Q11 <strong>1H11</strong> <strong>2010</strong><br />
Bank Delen: private banking AUM 14,910 15,829 15,272<br />
Van Breda: bancassurance products 11,424 424 11,437 437 11,414 414<br />
Van Breda: AUM at Delen* 2,037 2,119 1,968<br />
Van Breda: deposits 3,373 3,182 2,597<br />
(*) Already included in Delen: private banking AUM<br />
43
Delen – Private Bank: key figures<br />
Delen – Private Bank<br />
• Private bank<br />
• Focused on discretionary asset management for private clients<br />
Consolidated key figures (in € mio) <strong>1H11</strong> <strong>1H10</strong> <strong>2010</strong><br />
Gross revenues 76.7 72.1 141.0<br />
Net result 29.7 27.7 54.3<br />
Equity 356 356.6 6 318 318.1 1 344 344.1 1<br />
Assets under management 15,829 13,996 15,272<br />
CCost t / i income ratio ti 39 39.1% 1% 38 38.2% 2% 41 41.7% 7%<br />
ROE (IFRS) 17.0% 17.8% 16.8%<br />
Core Tier 1 capital ratio (1)<br />
13.3% (2)<br />
23.0% 25.3%<br />
# personnel 232<br />
(1) Including capital commitments (100%) re acquisition of JM Finn & Co (3Q11)<br />
(2) Excluding JM Finn: 29.3%<br />
44
Delen – Private Bank: income<br />
statement<br />
Conso (in € 000) <strong>1H11</strong> <strong>1H10</strong> <strong>2010</strong><br />
Net interest income 3852 3,852 11,052 052 33,116 116<br />
Gross fee income 72,423 69,706 133,805<br />
Other income 377 1,343 4,080<br />
Gross revenues 76,652 72,101 141,000<br />
Fees paid -7,850 -6,777 -13,805<br />
Operational expenses -24,024 -22,658 -47,811<br />
Amortisations & provisions -2,696 2,696 -2,034 2,034 -4,018 4,018<br />
Other expenses -240 -114 -293<br />
Loan loss provision -11 -4 -15<br />
Expenses -26,971 -24,811 -52,136<br />
Share of profit (loss) from equity<br />
accounted investments 200 209 405<br />
Profit before tax 42,031 40,722 75,464<br />
Income taxes -12,413 -12,911 -21,014<br />
Profit of the period<br />
Minority interests 74 -96 -169<br />
Share of the group 29,692 27,715 54,281<br />
45
Delen – Private Bank: balance sheet (1)<br />
(in € 000) <strong>1H11</strong> <strong>1H10</strong> <strong>2010</strong><br />
Cash & loans and ad<strong>van</strong>ces to banks<br />
Financial assets<br />
494,121 739,422 334,545<br />
- Financial assets available for sale 952,126 765,572 837,878<br />
- Financial assets held for trading 25,888 21,855 12,396<br />
- Loans and receivables 84,630 69,964 65,559<br />
- Other 1,841 1,444 1,640<br />
Tangibles assets 32 32,587 587 20 20,448 448 31 31,609 609<br />
Goodwill and other intangible assets 179,290 173,292 177,419<br />
Other assets 10,562 7,363 21,008<br />
Total assets 1,781,045 1,799,360 1,482,054<br />
Financial liabilities<br />
- Deposits from credit institutions 125,824 14,376 5,506<br />
- Deposits from clients 11,214,657 214 657 1387572 1,387,572 1060937 1,060,937<br />
- Other 21,439 16,549 8,451<br />
Provisions, tax and other liabilities 62,383 62,403 62,644<br />
Equity (including minority interests) 356,742 318,460 344,516<br />
Total liabilities 1,781,045 1,799,360 1,482,054<br />
(1) Before acquisition of JM Finn<br />
46
Delen – Private Bank: funds under<br />
management g (3Q11) ( )<br />
Start cooperation<br />
with Bank J.Van<br />
Breda & C° C<br />
De Ferm<br />
AuM CAGR 1992-<strong>2010</strong>: 20.3%<br />
Havaux<br />
(in € mio) 1992 1997 1998 1999 2000 2001 2002 2003 2004 2005 2006 2007 2008 2009 <strong>2010</strong> 3Q11<br />
Discretionary<br />
mandates 118 1,270 2,042 2,682 3,050 3,196 2,792 3,098 3,545 4,748 5,579 8,719 7,049 8,901 10,816 10,843<br />
Advisory clients 428 1,149 1,553 1,393 1,643 1,530 1,232 1,437 1,900 2,723 2,837 3,407 3,294 4,342 4,456 4,067<br />
Total 546 2,419 3,595 4,075 4,693 4,726 4,024 4,535 5,445 7,471 8,416 12,126 10,343 13,243 15,272 14,910<br />
BI&A<br />
CCapfi fi<br />
47
Delen – Private Bank: highlights and<br />
outlook (<strong>1H11</strong>-3Q11)<br />
( )<br />
Highlights <strong>1H11</strong><br />
• AuM grown g to new record level of € 15,829 , mio (vs ( 15,272 , mio as of<br />
31.12.10 and to € 15,585 mio as of 31.03.11), despite a slightly negative<br />
stock effect<br />
• Cost income ratio remained below 40% (39.1% vs 38.2% in <strong>1H10</strong>)<br />
• Net equity increased to € 357 mio (€ 345 mio end <strong>2010</strong>)<br />
• Agreement to acquire majority stake in JM Finn & Co (see next slide)<br />
• Core Tier1 impacted by JM Finn acquisition: 13.3%<br />
•No exposure p to PIIGS countries<br />
• 3Q11: AuM decreased to € 14,910 mio, impacted by very volatile market,<br />
despite continued important net inflow. Acquisition of JM Finn & Co<br />
approved in September by FSA FSA. To be consolidated from October<br />
onwards.<br />
Outlook 2011<br />
• Highly volatile markets potentially impacting value of AuM although<br />
(partially) compensated by continuous strong inflow of new AuM and<br />
conservative asset allocation<br />
48
JM Finn & Co<br />
• End of June 2011, 2011 Delen Investments announced agreement to acquire a major stake<br />
in JM Finn & Co: Delen 73.5% with current management retaining 26.5%<br />
• 100% transaction value: £ 85 mio<br />
• Regulatory g y approval pp received in September p 2011 ( (to be consolidated from October<br />
onwards)<br />
Cardiff Bristol Leeds<br />
Bury StE Ipswich<br />
UK private i client li wealth l h management fi firm<br />
• Established in 1945 as partnership,<br />
incorporated in 2006<br />
• 13 directors and 279 employees<br />
• Head office in London, offices in Leeds,<br />
Bristol, Ipswich, Bury St Edmunds and Cardiff<br />
49
JM Finn & Co – financials<br />
(last fiscal year – ending April 2011)<br />
AuM per type Evolution of AuM (in £m)<br />
TOTAL<br />
£6,306m<br />
• £ 6.3 6 3 billion assets under management (54% discretionary, discretionary 23% advisory) per<br />
30.04.11; 3Q11: £ 5.8 mio AuM per 30.09.11<br />
• Number of customers 17,430 (> £ 1 mio = 46% of AuM)<br />
• Key figures (April 2011):<br />
• Revenues of f £ 43.3 3 3 million ll<br />
• Profit after taxation (after exceptional costs of £ 1.4 million) of £ 4.1 million<br />
• Net equity of £ 14.9 million<br />
50<br />
50
Bank J.Van Breda & C°: key figures<br />
Bank J.Van Breda & C°<br />
Relationship p bank focused on private p as well as professional p<br />
needs for<br />
entrepreneurs and liberal professions<br />
(in € mio) <strong>1H11</strong> <strong>1H10</strong> <strong>2010</strong><br />
BBank k product d 50 50.22 46 46.77 93 93.44<br />
Net result (1)<br />
46.4 13.1 25.7<br />
Equity 297.9 247.7 258.6<br />
Total assets 4,077.1 3,141.0 3,202.8<br />
Total client assets (2)<br />
7,174.0 5,968.8 6,368.9<br />
Cost / income ratio 58.5% 57.8% 57.2%<br />
ROE 8.0% 10.7% 10.2%<br />
CAD (solvency ratio) 17.2% 14.3% 14.7%<br />
Core Tier 1 Capital Ratio 14.6% 11.2% 11.3%<br />
Net loan write write-offs offs / avg loan portfolio 006% 0.06% 012% 0.12% 015% 0.15%<br />
# personnel 418<br />
(1) Including 1 month of ABK at 40.8%, with negative acquisition goodwill of € 35.5 mio<br />
(2) Deposits and entrusted funds<br />
51
Bank J.Van Breda & C°:<br />
income statement<br />
Conso (in € 000) - IFRS <strong>1H11</strong> <strong>1H10</strong> <strong>2010</strong><br />
Net interest income 34,300 32,719 65,805<br />
Net fee income 13,329 12,637 23,796<br />
Other income 2,572 1,346 3,840<br />
Gross revenues 50,201 46,702 93,441<br />
Operational expenses -27,770 -25,406 -50,563<br />
Amortisations & provisions -1,578 -1,586 -2,916<br />
Loan loss provision -810 -1,411 -3,826<br />
Impairment AFS -3,773 3773<br />
Expenses -33,931 -28,403 -57,305<br />
Negative goodwill<br />
Sh Share of f profit fit (l (loss) ) f from equity it<br />
35,472<br />
accounted investments 65 196 144<br />
Profit before tax 51,807 18,495 36,280<br />
Income taxes -4,700 -5,363 -10,581<br />
Profit of the period<br />
Minority interests -728 728 -19 19 -35 35<br />
Share of the group 46,379 13,113 25,664<br />
52
Bank J.Van Breda & C°: balance<br />
sheet<br />
(in € 000) <strong>1H11</strong> <strong>1H10</strong> <strong>2010</strong><br />
Cash & loans and ad<strong>van</strong>ces to banks<br />
Financial assets<br />
339,083 , 88,040 , 71,646 ,<br />
- Financial assets available for sale 714,562 508,382 444,929<br />
- Financial assets held for trading 9,968 19,096 9,081<br />
- Loans and receivables (including finance leases) 22,959,672 959 672 22,482,334 482 334 22,631,485 631 485<br />
- Other 1,894 350 857<br />
Tangibles assets 30,940 28,762 29,314<br />
Goodwill and other intangible assets 7,465 6,222 6,814<br />
Other assets 13,504 7,804 8,693<br />
Total assets 4,077,088 3,140,989 3,202,819<br />
Financial liabilities<br />
- Deposits from credit institutions 162,190 252,935 176,365<br />
- Deposits from clients 3,069,638 2,374,406 2,475,108<br />
- Debt certificates (incl. bonds/ CP) 198,019 116,696 129,705<br />
- Subordinated liabilities 94,244 92,136 109,816<br />
- Other 24,781 40,122 27,186<br />
Provisions, tax and other liabilities 114,074 16,895 25,968<br />
Minority interests 116 116,267 267 85 51<br />
Equity (group share) 297,875 247,714 258,620<br />
Total liabilities 4,077,088 3,140,989 3,202,819<br />
53
Bank J.Van Breda & C°<br />
Continuous solid commercial performance<br />
(€ mio) 2003 2004 2005 2006 2007 2008 2009 <strong>2010</strong> <strong>1H11</strong> <strong>1H11</strong> <strong>1H11</strong> 3Q11<br />
BVB ABK Total Total<br />
Total deposits and funds<br />
- Entrusted funds,<br />
2,673 3,118 3,547 4,077 4,701 5,009 5,645 6,369 6,866 308 7,174 7,263<br />
of which 1,292 1,647 2,071 2,417 2,802 2,788 3,286 3,772 3,993 3,993 3,890<br />
AUM at Delen 612 815 1,037 , 1,220 , 1,463 , 1,370 , 1,668 , 1,968 , 2,119 , 2,119 , 2,037 ,<br />
Bancassurance 452 596 739 880 1,044 1,174 1,309 1,414 1,437 1,437 1,424<br />
- Client deposits 1,381 1,471 1,476 1,660 1,899 2,221 2,359 2,597 2,874 308 3,182 3,373<br />
Loans to target group 972 1,164 1,401 1,505 1,755 1,872 2,005 2,285 2,381 231 2,612 2,614<br />
4000<br />
3000<br />
2000<br />
1000<br />
0<br />
Total deposits & funds<br />
CAGR 2003-<strong>2010</strong>: 13.2%<br />
2003 2004 2005 2006 2007 2008 2009 <strong>2010</strong> <strong>1H11</strong> 3Q11<br />
Entrusted funds Client deposits Loans to target group<br />
54
Bank J.Van Breda & C°: highlights &<br />
outlook (<strong>1H11</strong>-3Q11)<br />
(<strong>1H11</strong> 3Q11)<br />
Highlights <strong>1H11</strong><br />
• Solid commercial performance<br />
− Client deposits and entrusted funds: € 77,174 174 mio, mio of which € 308 308,0 0 mio from<br />
ABK (€ 6,369 mio as of 31.12.10)<br />
− Continued growth of loan portfolio: € 2,960 mio, of which € 230,9 mio from<br />
ABK (€ ( 2,631 mio as of 31.12.10) )<br />
• Limited net loan loss provisions: 0.06% (vs 0.15% for FY10)<br />
• Results positively impacted by first consolidation of Antwerps Beroepskrediet<br />
(badwill of € 35.5 mio, part AvH € 27.9 mio)(see next slide)<br />
• Cost/income ratio of 58 58.46% 46%<br />
• Net equity increased to € 298 mio (vs € 259 mio as of 31.12.10). Core Tier 1 ratio<br />
14.6% (incl. ABK) and solvency ratio of 17.2%<br />
• Impairment on Greek bonds (€ 5 mio, 2013/ € 5 mio, 2016): mark-to-market<br />
impairment of 38%, resulting in net impact through P&L of € -2.5 mio as of<br />
30.06.11<br />
• 3Q11: Total client assets (excl. ABK) increased to € 6,936 mio, of which € 3,046<br />
mio client deposits and € 33,890 890 mio entrusted funds funds. Participation in ABK increased<br />
to 91.76%<br />
Outlook 2011<br />
• Challenging market environment for deposits putting pressure on interest<br />
income, but growing bank product expected based upon increased volume of<br />
deposits/funds and loans<br />
55
ABK (Antwerps Beroepskrediet)<br />
• End of January 2011 2011, friendly and conditional counter counter-takeover takeover bid launched on ABK<br />
• May 20, 2011: 40.8% of shares (87.33% of voting rights), leading to conso badwill of €<br />
35.5 mio<br />
• July y 8, , 2011: after final closing, g, Bank J.Van Breda & Co owns 49.7% of shares ( (89.2%<br />
of voting rights)<br />
• Participation increased to 91.76% (3Q11); additional badwill through equity<br />
• Price (€ 490 per share or € 120 mio for 100%) takes into account the cooperative<br />
structure of bank (limited dividend payment payment, capital reserves not to be distributed)<br />
Antwerp based niche bank catering towards small enterprises<br />
• Cooperative bank<br />
• 56 employees, 16 agencies<br />
• Last fiscal year (ending December <strong>2010</strong>):<br />
• Loans of € 239.7 mio (€ 231 mio as of 30.06.11)<br />
• Deposits of € 293 293.2 2 mio (€ 308 mio as of 30 30.06.11) 06 11)<br />
• Net equity of € 229.4 mio<br />
• Net equity (after provisions and IFRS) as of May 31, 2011: € 195<br />
mio<br />
56
Segment ‘Private equity’<br />
• First experience in private equity through acquisition of Brouwerij<br />
Maes, first buyout in Belgium (1988)<br />
• No fund structure<br />
• Investing own cash resources through<br />
• Sofinim, a development capital portfolio, originating from<br />
acquisition of NIM in 1994<br />
• GIB: 50/50 partnership with CNP<br />
Hertel EuroMediaGroup<br />
NMC Groupe Flo Spano
Private equity portfolio (30/09/2011)<br />
*<br />
58
Private equity: key figures<br />
(in € mio - AvH group share) <strong>1H11</strong> <strong>1H10</strong> <strong>2010</strong><br />
Sofinim -0.3 0.3 0.2 -0.5 0.5<br />
Contribution from portfolio c ies Sofinim (1)<br />
2.1 5.8 10.6<br />
Contribution from portfolio c ies GIB 1.3 1.0 3.2<br />
Contribution PE before capital gains 3.1 7.0 13.3 (2)<br />
p g<br />
Capital gains 0.3 -0.8 -0.3<br />
Total contribution PE 3.4 6.1 13.0<br />
(1) IFRS implies ‘fair value’ changes taken into account on all portfolio companies<br />
(2) Taking into account goodwill impairment within Distriplus of € 4.8 mio (part AvH): current<br />
contribution from Sofinim: € 18 18.1 1 mio<br />
59
Private equity: adjusted net asset<br />
value<br />
(in € mio) <strong>1H11</strong> <strong>1H10</strong> <strong>2010</strong><br />
Sofinim 434 434.00 430 430.99 437 437.11<br />
Unrealised capital gains Atenor (1)<br />
Market value Groupe Flo / Trasys (2)<br />
7.5 6.9 7.3<br />
40.5 21.7 24.0<br />
Total private equity 482.0 459.6 468.5<br />
(1) Underlying end-of-period stock price Atenor (# 604,880): € 33.5 per 30.06.11<br />
(2) Underlying end-of-period stock price Flo (# 28,280,716): € 6.49 per 30.06.11<br />
60
Private equity: highlights<br />
(<strong>1H11</strong>-3Q11)<br />
(<strong>1H11</strong> 3Q11)<br />
Highlights <strong>1H11</strong><br />
P f li ies<br />
• Porfolio cies -Most participations (esp. AR Metallizing, Manuchar, Spano, Turbo’s Hoet Groep) confirming<br />
positive trend of previous quarters.<br />
-Corelio: Participation p in acquisition q of television activities SBS Belgium g ( (via De Vijver). j )<br />
-Distriplus: Encouraging results with increase in turnover and net result, thanks to the<br />
commercial repositioning of the three chains.<br />
-Hertel: Focus by new management on consolidation of fast growth in past years. Limited<br />
i increase of f turnover t driven d i b by activities ti iti i in WWestern t E Europe and d AAustralia. t li RRestructuring t t i<br />
costs and non-recurring elements will probably result in loss for 2011.<br />
-NMC: Acquisition of polyethylene packaging division from Armacell (from Sep 2011)<br />
• Limited investment/divestment activity<br />
-Investments € 3.3 mio: Increase of GIB participation in Trasys Group to 83.89% and in<br />
Groupe Flo to 47.6%<br />
-Divestments Di estments € 56 5.6 mio<br />
• 3Q11: Q Divergent g trends at participations p p due to seasonal effects ( (Distriplus, p ,<br />
EuroMediaGroup), exchange rate effects (Manuchar), significant restructuring costs (Hertel)<br />
• Increase of participation in Egemin to 59.5%<br />
61
Groupe Flo<br />
Leading player in casual dining in France, operating various formats<br />
- Hippopotamus: 158 grill restaurants (68 franchise) (150 end <strong>2010</strong>)<br />
- Bistro Romain: 26 Italian restaurants (4 franchise) (29 end <strong>2010</strong>)<br />
- Brasseries: 34 ‘institutional brasseries’ and 40 Tavernes de Maître Kanter<br />
(33 and 40 end <strong>2010</strong>)<br />
- Tablapizza: 28 pizzerias (9 franchise) (28 end <strong>2010</strong>)<br />
Highlights <strong>1H11</strong><br />
• Notwithstanding a volatile market environment in 2Q11, turnover increased 1.1%<br />
vs <strong>1H10</strong> (1.1% (1 1% like like-for-like) for like) and EBITDA margin increased from 11.3% 11 3% to 11 11.9% 9%<br />
• Transformation of Bistro Romain on schedule and generating positive contribution<br />
as expected<br />
• 3Q11: Slight g increase in turnover despite p decrease in volumes in line with<br />
declining customer confidence. Good cost control resulted in stable margins.<br />
Key figures (in € mio) 3Q11 <strong>1H11</strong> <strong>2010</strong><br />
Turnover 279 279.99 190 190.66 378 378.88<br />
EBITDA 33.0 22.6 48.8<br />
Net result 9.6 6.8 15.3<br />
Net financial position -88.5 -88.1<br />
62
Segment ‘Energy and materials’<br />
• In 2009, 2009 creation of a fifth segment ‘Energy Energy and materials materials’<br />
• Focus on emerging markets and sectors such as renewable energy<br />
HENSCHEL<br />
SIPEF<br />
SAGAR CEMENTS<br />
Development and<br />
Agro industrial group with Production of cement and<br />
manufacturing of loading plantations in Indonesia en clinkers. Together with<br />
platforms and kippers kippers, Papua New Guinea for palm<br />
the Reddy family<br />
mainly in Poland<br />
oil, rubber and tea<br />
Since 1994 (NIM)<br />
ORIENTAL QUARRIES<br />
& MINES<br />
Stone quarries for building<br />
aggregates. Together with<br />
the Bakshi family<br />
Since 1997<br />
Since 2009 Since 2009<br />
MAX GREEN<br />
Renewable energy based<br />
on biomass (wood pellets)<br />
Joint venture with<br />
Electrabel<br />
Since 2008<br />
63
Energy and materials<br />
Contribution to the AvH consolidated net<br />
result (group share) (in € mio) <strong>1H11</strong> <strong>1H10</strong> <strong>2010</strong><br />
Energy and materials 9.4 8.4 16.5<br />
Sipef 9.9 5.4 14.3<br />
Henschel Group -1.2 1.8 0.9<br />
Sagar Cements 0.9 0.1 0.0<br />
Other -0.2 1.1 1.3<br />
64
Sipef (<strong>1H11</strong>-3Q11)<br />
A Belgian agro-industrial group operating and managing tropical plantation<br />
businesses (62,562 ha, of which 50,816 ha palm oil and 9,320 ha rubber),<br />
mainly in Indonesia and Papua New Guinea<br />
Highlights <strong>1H11</strong><br />
(in USD mio) 3Q11 <strong>1H11</strong> <strong>2010</strong><br />
€ 1 = USD 1.42 (<strong>1H11</strong>)<br />
G d ti (i T) (1)<br />
• Increase (+13%) of palm oil production<br />
Group production (in T) (1)<br />
due to climate conditions and more<br />
areas coming to maturity<br />
Palm oil 188,704 122,511 239,141<br />
• Higher sales prices resulted in record<br />
increase of turnover (+38%) and net<br />
Rubber<br />
Tea<br />
7,190<br />
11,896 896<br />
5,224<br />
11,292 292<br />
10,881<br />
3108 3,108<br />
result (+77%)<br />
Average market prices (in USD/T)<br />
• Expansion continued: license obtained<br />
i in SSouth h S Sumatra: 88,400 400 h ha + 22,100 100 h ha<br />
Palm oil<br />
Rubber<br />
1,159<br />
55,229 229<br />
1,199<br />
55,517 517<br />
901<br />
3654 3,654<br />
outgrowers<br />
Turnover 177.1 279.4<br />
• Increase of AvH participation to 25.64% EBIT 71.7 118.2<br />
• Successful takeover bid on Jabelmalux Net result 58.0 84.8<br />
(Luxembourg stock exchange)<br />
Net equity 395.6 368.5<br />
increasing beneficial ownership in<br />
group plantations with 2,657 2 657 ha<br />
Net cash position 52.3 56.5<br />
• 3Q11: Continued positive trend with<br />
9.1% increase of palm oil production<br />
Share high/low (in €) 74.30/64.10 71.93/36.11<br />
Market cap (€ mio) 624.4 635.6<br />
(1) Own + outgrowers<br />
65
Sagar Cements (1H-3Q)<br />
Cement plant, located in Hyderabad (Andra Pradesh), India<br />
Highlights <strong>1H11</strong><br />
• Good result thanks to return to stability on cement market with more stable pricing<br />
and improved p capacity p y utilization<br />
• Significant increase of net result<br />
• Merger with Amareswari Cement finalized (April 2011), AvH stake diluted to 12.94%<br />
• 3Q11: July 2011: AvH stake increased to 14 14.98% 98%<br />
Key figures (in € mio) <strong>1H11</strong> <strong>1H10</strong> <strong>2010</strong><br />
€ 1 = INR 63 63.29 29 € 1 = INR 60 60.98 98 € 1 = INR 60 60.61 61<br />
Turnover 65.6 51.1 81.9<br />
EBITDA 13.2 4.7 8.6<br />
Net result 59 5.9 01 0.1 -0 -0.2 2<br />
Shareholder's equity 37.8 36.4 34.4<br />
Net financial position p<br />
-36.8 -38.2 -40.5<br />
Share high/low (in INR) 152.8/121.1 209.5/145.0 209.5/115.0<br />
Market cap (INR mio) 2,400 2,175 2,265<br />
66
Oriental Quarries & Mines<br />
Aggregates quarries, India (in partnership with Oriental Structural Engineers )<br />
Highlights <strong>1H11</strong><br />
• Increase of sales volumes offset by less profitable sales mix and negative impact<br />
from monsoon<br />
• Quarries in Nangal, Ghatoli, Gwalior and Bangalore<br />
• Total crushing capacity of 2.3 million tons<br />
Key figures (in € mio) <strong>1H11</strong> <strong>1H10</strong> <strong>2010</strong><br />
€ 1 = INR R 63 63.29 29 € 1 = INR R 60 60.98 98 € 1 = INR R 60 60.61 61<br />
Turnover 4.0 4.0 6.5<br />
EBITDA 0.3 0.5 0.6<br />
NNet t result lt 03 0.3 04 0.4 03 0.3<br />
Shareholder's equity 8.4 9.3 8.7<br />
Net financial position 34 3.4 55 5.5 44 4.4<br />
67
Max Green<br />
Renewable energy based on biomass / wood pellets<br />
(joint venture with Electrabel)<br />
Highlights <strong>1H11</strong><br />
• First project: conversion of Rodenhuize 4 plant (Ghent) into 100%<br />
biomass fired unit with 180 Mwel capacity p y (after ( conversion) )<br />
(320,000 households).<br />
• Last phase of the conversion finalised<br />
• Conversion in first half 2011 resulted in limited production and<br />
negative contribution<br />
• 3Q11: biomass plant at Rodenhuize officially commissioned. The<br />
power plant is a world first in two ways: largest conversion of this<br />
kind in terms of capacity, best environmental results among all<br />
plants transformed to biomass units (reducing nitrogen oxides and<br />
dust emissions by 90%)<br />
68
Henschel Group<br />
Development and manufacturing of welded structures with a<br />
particular emphasis on telescopic cranes for mobile crane vehicles<br />
as well as loading platforms and kippers for light trucks<br />
Highlights <strong>1H11</strong><br />
• Results impacted by the recession on the crane market and startup losses<br />
f from new products d t<br />
Key figures (in € mio) <strong>1H11</strong> <strong>1H10</strong> (1)<br />
<strong>2010</strong><br />
Turnover 32.8 28.4 52.1<br />
Net result -22.4 4 35 3.5 22 2.2<br />
Net financial position -11.5 -3.4 -9.3<br />
(1) ( ) Pro o forma o a consolidation<br />
co sol dat o<br />
69
Outlook 2011<br />
‘Already at the occasion of the half year<br />
results results, the board of directors of<br />
<strong>Ackermans</strong> & <strong>van</strong> <strong>Haaren</strong> pointed out that<br />
“the uncertain economic climate, the<br />
impact of unavoidable budget cuts in the<br />
Western world and the volatility of the<br />
financial markets more than ever call for<br />
caution”. Although the recent trends do<br />
not lead to strong optimism as long as the<br />
necessary measures are not iimplemented l d<br />
consistently and effectively, the board of<br />
directors maintains its expectation that<br />
the results of the group will grow slightly<br />
in the current year 2011.’<br />
70
Contact<br />
For further questions or additional information,<br />
please consult our website: www.avh.be<br />
Contact:<br />
Luc Bertrand<br />
Ch Chairman i of f th the EExecutive ti CCommittee itt<br />
Jan Suykens<br />
Member of the Executive Committee<br />
Tom Bamelis<br />
Member of the Executive Committee<br />
T +32 3 231 87 79<br />
E dirsec@avh.be<br />
71