

IEC Acoustic Standard IEC 61400-11
IEC Acoustic Standard IEC 61400-11
IEC Acoustic Standard IEC 61400-11

You also want an ePaper? Increase the reach of your titles
YUMPU automatically turns print PDFs into web optimized ePapers that Google loves.
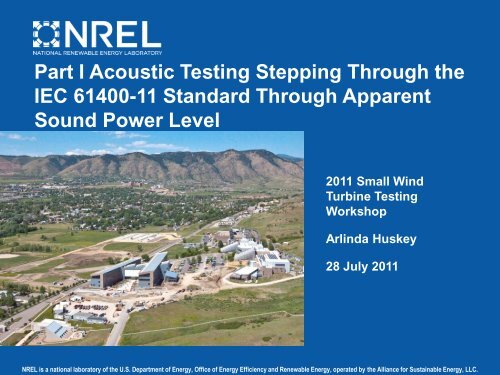
Part I <strong>Acoustic</strong> Testing Stepping Through the<br />
<strong>IEC</strong> <strong>61400</strong>-<strong>11</strong> <strong>Standard</strong> Through Apparent<br />
Sound Power Level<br />
20<strong>11</strong> Small Wind<br />
Turbine Testing<br />
Workshop<br />
Arlinda Huskey<br />
28 July 20<strong>11</strong><br />
NREL is a national laboratory of the U.S. Department of Energy, Office of Energy Efficiency and Renewable Energy, operated by the Alliance for Sustainable Energy, LLC.
Relevant Document<br />
<strong>IEC</strong> <strong>61400</strong>-<strong>11</strong> 2002-12 Wind Turbine<br />
Generator Systems – Part <strong>11</strong>: <strong>Acoustic</strong><br />
Noise Measurement Techniques 2.1<br />
Edition<br />
• Sound power levels<br />
• One-third octave levels<br />
• Tonality<br />
Note:<br />
lowercase spl = sound pressure level<br />
uppercase SPL = sound power level<br />
NATIONAL RENEWABLE ENERGY LABORATORY
1 Scope<br />
General description and purpose for the standard<br />
“enable noise emissions of a wind turbine”<br />
“methods appropriate to noise emissions assessment at<br />
locations close to the machine, in order to avoid errors<br />
due to sound propagation, but far enough away to allow<br />
for the finite source size”<br />
“standarisation of measurement procedures will also<br />
facilitate comparisons between different wind turbines<br />
“characterise in a consistent and accurate manner”<br />
“If, in some cases, less comprehensive measurements are<br />
needed, such measurements are made according to the<br />
relevant parts of the standard”<br />
NATIONAL RENEWABLE ENERGY LABORATORY<br />
3
2 Normative References<br />
References to instrument standards for noise<br />
measurement equipment, defining accuracy<br />
requirements, filters, frequency, etc.<br />
Reference to power performance standard for wind speed<br />
derived from power<br />
NATIONAL RENEWABLE ENERGY LABORATORY<br />
4
3 Definitions and 4 Symbols and Units<br />
3 Definitions and explanation for more important variables<br />
4 Definitions all variables used in the standard along with<br />
units<br />
NATIONAL RENEWABLE ENERGY LABORATORY<br />
5
5 Outline of the Method<br />
Overview of the method<br />
NATIONAL RENEWABLE ENERGY LABORATORY<br />
6
6 Instrumentation<br />
Required acoustic measurements<br />
Sound pressure levels<br />
One-third octave levels<br />
Narrowband spectra<br />
Can be met by different types of instruments<br />
Signal analyzer<br />
Laptop and software<br />
Handheld instruments, sound level meter<br />
Requirements<br />
Must met <strong>IEC</strong> Type 1 accuracy requirements and filters<br />
Frequency range<br />
NATIONAL RENEWABLE ENERGY LABORATORY<br />
7
6 Instrumentation<br />
Microphone & preamplifier<br />
Size, diameter no larger than 13mm<br />
Measurement board<br />
Circular with diameter of at least 1m<br />
Made with acoustically hard material like plywood with<br />
thickness 12mm or metal with 2.5mm. A larger board is<br />
recommended for soft ground.<br />
Primary microphone windscreen<br />
One half of an open cell foam sphere with diameter of 90mm<br />
Secondary microphone windscreen<br />
Sold but expensive<br />
Example – wire frame hemispherical shape 450mm<br />
diameter covered with 13-25mm layer of open cell foam<br />
NATIONAL RENEWABLE ENERGY LABORATORY<br />
8
6 Instrumentation<br />
<strong>Acoustic</strong>al calibrator<br />
Meet <strong>IEC</strong> 60942 class 1<br />
Example: 94dB at 1kHz calibrator<br />
Data recording/playback system<br />
Meet <strong>IEC</strong> 60651 for type 1, examples in Annex B<br />
Example: digital analog tape recorders, hard disk<br />
NATIONAL RENEWABLE ENERGY LABORATORY<br />
9
6 Instrumentation<br />
Anemometers<br />
End to end deviation of ±0.2m/s in range of 4-12m/s<br />
Capable of synchronizing with acoustic data<br />
Power transducer<br />
Meet <strong>IEC</strong> 60688, same as power performance<br />
Wind direction<br />
Accuracy of ±6 o<br />
Camera<br />
Distance measurement<br />
Pressure<br />
Accuracy of ±1kPa<br />
Temperature<br />
Accuracy of ±1 o C<br />
NATIONAL RENEWABLE ENERGY LABORATORY<br />
10
6 Instrumentation<br />
Traceable Calibration<br />
<strong>Acoustic</strong> calibrator 12 mo<br />
Microphone 24 mo<br />
Integrating sound level meter 24 mo<br />
Spectrum analyzer 36 mo<br />
Data recording/playback system 24 mo<br />
Anemometer 24 mo<br />
Power transducer 24 mo<br />
Exceptions<br />
Recalibrate after repair, damage, or suspect<br />
NATIONAL RENEWABLE ENERGY LABORATORY<br />
<strong>11</strong>
7 Measurements and Measurement Positions<br />
<strong>Acoustic</strong> measurement positions<br />
One required measurement position but 3 optional<br />
Downwind is the reference position<br />
Data ±15 o relative to the wind direction<br />
Horizontal distance for a horizontal axis turbine<br />
R o = H + D/2<br />
To minimize influence due to the edges of the measurement<br />
board, lay flat on ground and level edges or gaps with soil<br />
Inclination angle should be 25 o to 40 o<br />
Minimize reflections from nearby structures, less than 0.2dB<br />
Adjust the board to meet these requirements<br />
NATIONAL RENEWABLE ENERGY LABORATORY<br />
12
7 Measurements and Measurement Positions<br />
Wind speed and direction measurement positions<br />
Upwind at a height between 10m and rotor centre<br />
Horizontal distance of 2D-4D from rotor centre<br />
Allowable region for met tower for measured wind speed<br />
During test measurements, anemometer must not be in the<br />
wake of any structure including the turbine<br />
Anemometer and wind vane should not interfere with each<br />
other<br />
Other wordage about nacelle anno, not as important for<br />
small wind turbines<br />
NATIONAL RENEWABLE ENERGY LABORATORY<br />
13
7 Measurements and Measurement Positions<br />
<strong>Acoustic</strong> measurements<br />
The following information will be determined at integer wind<br />
speeds of 6, 7, 8, 9, and 10m/s<br />
- the apparent sound power levels<br />
- the one-third octave band levels<br />
- the tonality (not required for AWEA)<br />
Optional measurements<br />
- directivity<br />
- infrasound<br />
- low-frequency noise<br />
- impulsivity<br />
NATIONAL RENEWABLE ENERGY LABORATORY<br />
14
7 Measurements and Measurement Positions<br />
<strong>Acoustic</strong> measurement requirements<br />
Calibration of measurement chain at least before and after<br />
or if microphone is moved<br />
Record data for later analysis<br />
Omit data with interruptions in the background (cars, plane)<br />
Collect turbine and background data under similar conditions<br />
Cover as broad a range of wind speeds<br />
NATIONAL RENEWABLE ENERGY LABORATORY<br />
15
7 Measurements and Measurement Positions<br />
A-weighted sound pressure level<br />
At least 30 1-minute averaged measurements with wind speed<br />
when the turbine is operating (AWEA mod:10-sec)<br />
At least 3 measurements per wind speed bin. (For statistical<br />
purposes/good practice if using 10-second averages then 10<br />
points per wind speed bin)<br />
At least 30 minutes of background (turbine not operating)<br />
covering the same as turbine measurements<br />
A-weighted one-third octave levels<br />
At least 3 spectra measured over 1-minute for each integer<br />
wind speed and covering centre frequencies of 50Hz-10kHz<br />
(same as above modify for 10-second averages)<br />
Background covers the same requirements<br />
A-weighted narrowband<br />
At least 2 minutes closest to the integer wind speed<br />
NATIONAL RENEWABLE ENERGY LABORATORY<br />
16
7 Measurements and Measurement Positions<br />
Non-acoustic measurements: wind direction<br />
Method 1: determination of wind speed from the electric<br />
output and the power curve (not covering since not<br />
applicable to all small wind turbines)<br />
Method 2: determination of wind speed with an anemometer<br />
(AWEA mod)<br />
Adjust wind speed to 10m height and reference roughness<br />
length (covered in section 8)<br />
Measurement by anemometer at a height between 10m and<br />
hub height<br />
Wind speed data collected and arithmetically averaged over<br />
the same period as the acoustic measurements<br />
NATIONAL RENEWABLE ENERGY LABORATORY<br />
17
7 Measurements and Measurement Positions<br />
Non-acoustic measurements: wind direction<br />
Wind direction measurements must be within 15 degrees of<br />
nacelle azimuth position with respect to upwind<br />
Arithmetically averaged over the same period as acoustic<br />
measurements<br />
Non-acoustic measurements: Other<br />
Air temperature and pressure measured and recorded at<br />
least every 2 hours<br />
Optionally turbulence as discussed in Annex C<br />
Rotor speed and pitch angle are recommended<br />
NATIONAL RENEWABLE ENERGY LABORATORY<br />
18
8 Data Reduction Procedures<br />
Wind speed<br />
Wind speeds measured at height z shall be corrected to a<br />
wind speed at reference conditions by assuming wind<br />
profiles<br />
NATIONAL RENEWABLE ENERGY LABORATORY<br />
z Oref reference roughness length, 0.05m<br />
z O roughness length<br />
H rotor centre height<br />
z ref reference height, 10m<br />
z anemometer height<br />
Roughness length z O can be calculated or estimated using Table 1<br />
in the standard<br />
19
8 Data Reduction Procedures<br />
Correction for background noise<br />
Background correction is used for sound pressure levels, onethird<br />
octave levels, and tonality<br />
NATIONAL RENEWABLE ENERGY LABORATORY<br />
L s equivalent continuous sound pressure level of<br />
wind turbine operating alone<br />
L s+n equivalent continuous sound pressure level of<br />
wind turbine plus background noise<br />
L n background equivalent continuous sound<br />
pressure level<br />
If difference between Ls+n and Ln is greater than 6dBA use equation<br />
If between 3-6dBA then use correction of 1.3dBA and marked with<br />
an asterisk “*”. Cannot be used for sound power level calculation.<br />
If difference less than 3dBA, cannot report and report “turbine noise<br />
was less than background”<br />
20
8 Data Reduction Procedures<br />
Apparent sound power levels<br />
Preferred method from the standard is a 4 th order regression.<br />
AWEA mod is to bin data by wind speed into 1m/s bins and<br />
one point on both sides of the integer wind speed<br />
To get integer value, interpolate/extrapolate between bins<br />
This is done for total noise and background, then background<br />
correct integer value<br />
Calculate the apparent sound power levels for each integer<br />
wind speeds<br />
NATIONAL RENEWABLE ENERGY LABORATORY<br />
L aeq,c,k background corrected A-weighted sound pressure level at<br />
integer wind speed k and under reference conditions<br />
R 1 slant distance from rotor centre to microphone<br />
S O reference area, 1m 2<br />
21
A little breather before we move to looking at data<br />
NATIONAL RENEWABLE ENERGY LABORATORY<br />
Questions?<br />
22
Look at NoiseLab<br />
Setup<br />
Calibration<br />
Recording<br />
Clips<br />
Analysis<br />
NATIONAL RENEWABLE ENERGY LABORATORY<br />
23
Listen to turbine data<br />
EW50 background<br />
EW50 turbine, normal operation<br />
EW50 interruption<br />
VT10 turbine, normal operation<br />
VT10 turbine, unloaded<br />
NATIONAL RENEWABLE ENERGY LABORATORY<br />
24
Filtering for Valid Data<br />
– Listen for interrupting noises (cars, other turbines, airplanes)<br />
– Transitions<br />
– Wind direction or yaw direction outside of ±15 degrees from<br />
microphone board<br />
– Plot sound pressure vs. wind speed or power or rotor speed<br />
– Look for outliers, verify if they are “real”<br />
Rotor<br />
Wind<br />
Wind<br />
Turb or<br />
Time Power Speed Temperature Speed Pressure Direction Availability Leq WD ok? Back<br />
13:36:35 -156 0 10 8 80 228 0 41 -10 Back<br />
13:36:45 -156 0 10 6 80 240 0 40 -10 Back<br />
13:36:55 -156 0 10 8 80 226 0 39 -10 Back<br />
13:37:05 -156 0 10 9 80 225 0 40 -10 Back<br />
13:37:15 -156 0 10 8 80 220 0 40 -10 Back<br />
13:37:25 -156 0 10 9 80 221 0 39 -10 Back<br />
13:37:35 -156 0 10 10 80 228 0 41 -10 Back<br />
13:37:45 -156 0 10 10 80 221 0 41 -10 Back<br />
NATIONAL RENEWABLE ENERGY LABORATORY<br />
25
Outliers?<br />
sound pressure level (dB A)<br />
55<br />
50<br />
45<br />
40<br />
35<br />
30<br />
25<br />
20<br />
NATIONAL RENEWABLE ENERGY LABORATORY<br />
0 2 4 6 8 10 12 14<br />
wind speed (m/s)<br />
26
Binning and Averaging<br />
After binning by 10 meter wind speed,<br />
for each bin that has enough data in the<br />
bin<br />
– Arithmetically average wind speed,<br />
most likely will not be at the bin center<br />
but close<br />
– Energy average sound pressure<br />
levels<br />
– For each bin you have an average<br />
wind speed and sound pressure level<br />
NATIONAL RENEWABLE ENERGY LABORATORY<br />
wind<br />
Aweighted<br />
sound<br />
pressure<br />
count speed level 10 0.1*spl<br />
n spl<br />
1 <strong>11</strong>.9 50.59 <strong>11</strong>4551<br />
2 <strong>11</strong>.6 50.88 122462<br />
3 <strong>11</strong>.3 48.13 65013<br />
4 10.4 46.49 44566<br />
5 10.0 45.95 39355<br />
6 9.1 45.57 36058<br />
7 9.6 45.73 374<strong>11</strong><br />
8 8.3 44.36 27290<br />
82.2 Sum 486705<br />
10.3 Sum/n 60838<br />
log10 4.78<br />
10*log10 47.8
Bin Centers<br />
Bin wind speed averages likely will not<br />
be at the center so interpolate (or<br />
extrapolate at the ends) to get bin<br />
centers<br />
– Extrapolate 6 and 7 m/s bins to get<br />
the bin center at 6 m/s<br />
– Interpolate 6 and 7 m/s bins to get the<br />
bin center at 7 m/s<br />
– Interpolate 8 and 9 m/s bins to get the<br />
bin center at 8 and 9 m/s<br />
– Interpolate 9 and 10 m/s bins to get<br />
the bin center at 10 m/s<br />
Find turbine and background bin center<br />
values<br />
NATIONAL RENEWABLE ENERGY LABORATORY<br />
WS bin WS avg count spl avg<br />
6 6.02 16 48.0<br />
7 7.28 25 47.8<br />
8 7.95 47 50.4<br />
9 9.10 64 52.5<br />
10 10.20 55 55.7<br />
WS bin slope offset int spl<br />
6 -0.16 49.0 48.0<br />
7 -0.16 49.0 47.8<br />
8 1.83 35.9 50.5<br />
9 1.83 35.9 52.3<br />
10 2.91 26.0 55.1
Background Correction<br />
Calculate the background corrected<br />
sound pressure level<br />
spl<br />
corr<br />
�<br />
10 * log<br />
10<br />
Must have 6 dB separation between<br />
turbine and background noise to report<br />
sound power level<br />
– cannot report 7 m/s sound power level<br />
NATIONAL RENEWABLE ENERGY LABORATORY<br />
�0.1* splturb<br />
� �0.1* splback<br />
� 10 �<br />
��<br />
�10 �<br />
��<br />
WS<br />
bin<br />
Turb<br />
spl<br />
Back<br />
spl<br />
CORR<br />
spl<br />
Diff<br />
6 48.0 41.4 46.9 6.6<br />
7 46.7 42.8 45.4 3.8<br />
8 50.7 44.3 49.6 6.4<br />
9 52.3 45.0 51.4 7.4<br />
10 55.0 46.4 54.4 8.6
Sound Power Level<br />
Calculate the sound power level for each<br />
bin using the sound pressure levels,<br />
slant distance (distance from rotor center<br />
to microphone), and reference area (S o<br />
= 1 m 2 )<br />
SPL<br />
�<br />
SPL = 82.8 dB A<br />
spl corr = 46.9 dB A<br />
slant distance, R = 35.1 m<br />
S o = 1 m 2<br />
spl corr<br />
NATIONAL RENEWABLE ENERGY LABORATORY<br />
�<br />
6<br />
�<br />
10lg<br />
�<br />
�<br />
�<br />
�<br />
2<br />
4�<br />
R<br />
S0<br />
�<br />
�<br />
�<br />
�<br />
WS<br />
bin<br />
CORR<br />
spl<br />
Diff SPL<br />
6 46.9 6.6 82.8<br />
7 45.4 3.8 *<br />
8 49.6 6.4 85.4<br />
9 51.4 7.4 87.3<br />
10 54.4 8.6 90.2
NATIONAL RENEWABLE ENERGY LABORATORY<br />
Questions?<br />
Before we move onto one-third octaves<br />
31
One-Third Octave Levels<br />
Concepts are the same but averaging and correcting on the onethird<br />
octave bands.<br />
– Take three minutes of one-third octave data closest to the integer<br />
wind speed for turbine and background<br />
– Arithmetically average wind speeds and energy average the onethird<br />
octave spectra by band (i.e. 20, 25, 31.5 Hz)<br />
– Extrapolate or interpolate to get integer values<br />
– Background correct by band if there is a 6 dB separation. There is<br />
a standard correction for differences between 3 and 6 dB. Cannot<br />
background correct for differences lower than 3 dB. Note: There<br />
can be negative numbers. There can be bands where the<br />
background levels greater than the turbine levels.<br />
WS bin 20 25 31.5 40 50 63 80 100 125 160 200 250 315 400 500 630 800 1000 1250<br />
Turb 10.0 16.4 18.6 20.2 23.6 23.4 25.9 28.7 31.2 33.1 35.4 45.4 55.0 39.9 39.5 41.9 41.6 42.2 42.4 42.1<br />
Back 10.1 16.4 18.7 20.2 24.1 22.2 24.3 28.7 30.0 30.9 32.8 36.9 34.8 35.3 34.6 34.6 35.0 34.4 34.7 33.8<br />
Integer Turb 10 16.4 18.7 20.3 23.6 23.4 25.9 28.8 31.3 33.1 35.4 45.4 55.1 40.0 39.6 42.0 41.7 42.2 42.5 42.1<br />
Integer Back 10 16.2 18.4 20.0 24.0 22.2 24.3 28.6 30.0 30.9 32.7 36.7 34.7 35.2 34.5 34.5 34.8 34.3 34.6 33.6<br />
Difference 10 0.2 0.3 0.3 -0.4 1.3 1.6 0.2 1.3 2.2 2.7 8.7 20.4 4.8 5.1 7.5 6.8 7.9 7.9 8.5<br />
Back Corr 10 44.8 55.1 38.7 38.3 41.1 40.7 41.5 41.7 41.5<br />
NATIONAL RENEWABLE ENERGY LABORATORY
One-Third Octave Levels<br />
Sound pressure level [dB(A)]<br />
60<br />
50<br />
40<br />
30<br />
20<br />
10<br />
0<br />
NATIONAL RENEWABLE ENERGY LABORATORY<br />
Frequency [Hz]<br />
5 m/s<br />
6 m/s<br />
7 m/s<br />
8 m/s<br />
9 m/s<br />
10 m/s
That was quick and easier than I thought…<br />
Right?<br />
NATIONAL RENEWABLE ENERGY LABORATORY<br />
Questions?<br />
Before we move onto tonality<br />
34
Tonality<br />
To begin<br />
– Two minutes of FFT spectra data closest to the integer wind speed<br />
for turbine and background<br />
– Turbine narrowband analysis use 10-second spectra<br />
– Background spectra are energy averaged into one spectrum for<br />
use later in the turbine analysis<br />
– For each turbine 10-second spectrum identify possible tones. For<br />
each possible tone:<br />
• Determine critical bandwidth<br />
• Classify spectral lines in the critical band<br />
• Determine tone level<br />
• Determine masking level and correct for background<br />
• Determine tonality<br />
• Determine if the tone is reportable or “audible”<br />
NATIONAL RENEWABLE ENERGY LABORATORY
What Is Considered a Possible Tone?<br />
sound pressure level (dB A)<br />
-10<br />
NATIONAL RENEWABLE ENERGY LABORATORY<br />
50<br />
40<br />
30<br />
20<br />
10<br />
0<br />
0 1000 2000 3000 4000 5000 6000 7000 8000 9000 10000<br />
frequency (Hz)<br />
Technically – it is a peak with adjacent lines with lower amplitudes<br />
Analyze possible tones
Determine Critical Bandwidth<br />
Calculate the critical bandwidth<br />
Critical<br />
Bandwidth<br />
For this possible tone at 249 Hz (f c = 249), the critical<br />
bandwidth is 104.43 Hz<br />
Center critical bandwidth around the peak. For this<br />
example 196.8 to 301.2 Hz.<br />
This will not symmetrically fit due to the resolution. How<br />
to specifically deal with this is not covered in the<br />
standard.<br />
For our purposes, the critical bandwidth is 102 Hz<br />
covering the lines from 198 to 300 Hz<br />
NATIONAL RENEWABLE ENERGY LABORATORY<br />
�<br />
� � f �<br />
c<br />
� 25 � 75�1�<br />
1,<br />
4�<br />
�<br />
� �1000�<br />
� � �<br />
2<br />
�<br />
�<br />
�<br />
�<br />
�<br />
0,<br />
69<br />
Freq (Hz) spl (dB A)<br />
198 25.30<br />
201 25.50<br />
204 26.02<br />
207 29.15<br />
210 32.15<br />
213 37.62<br />
216 39.88<br />
219 39.75<br />
222 39.86<br />
225 41.20<br />
228 40.31<br />
231 42.48<br />
234 43.87<br />
237 42.31<br />
240 43.43<br />
243 43.21<br />
246 43.50<br />
249 45.44<br />
252 41.22<br />
255 35.09<br />
258 30.45<br />
261 29.38<br />
264 30.78<br />
267 27.78<br />
270 26.37<br />
273 26.79<br />
276 27.61<br />
279 28.68<br />
282 27.74<br />
285 27.67<br />
288 27.38<br />
291 27.10<br />
294 27.68<br />
297 27.91<br />
300 27.46
Calculate L 70% for Classification<br />
Within each critical band every spectral line is classified<br />
as tone, masking, or neither<br />
Calculate L 70% level<br />
The energy average of the 70% of spectral lines in the<br />
critical band with the lowest spl levels<br />
L 70% = 33.13 dB A<br />
Calculate the criterion level, L 70% + 6 dB A = 39.13 dB A<br />
sound pressure level (dB A)<br />
NATIONAL RENEWABLE ENERGY LABORATORY<br />
50<br />
45<br />
40<br />
35<br />
30<br />
25<br />
20<br />
15<br />
10<br />
5<br />
0<br />
198<br />
201<br />
204<br />
207<br />
210<br />
213<br />
216<br />
219<br />
222<br />
225<br />
228<br />
231<br />
234<br />
237<br />
240<br />
243<br />
246<br />
249<br />
252<br />
255<br />
258<br />
261<br />
264<br />
267<br />
270<br />
273<br />
276<br />
279<br />
282<br />
285<br />
288<br />
291<br />
294<br />
297<br />
300<br />
frequency (Hz)<br />
Freq (Hz) spl (dB A) 10^0.1*spl<br />
198 25.30 338.67<br />
201 25.50 354.59<br />
204 26.02 399.88<br />
270 26.37 433.42<br />
273 26.79 477.90<br />
291 27.10 512.81<br />
288 27.38 546.63<br />
300 27.46 557.78<br />
276 27.61 576.47<br />
285 27.67 584.37<br />
294 27.68 586.63<br />
282 27.74 594.64<br />
267 27.78 599.23<br />
297 27.91 617.72<br />
279 28.68 737.67<br />
207 29.15 822.10<br />
261 29.38 866.01<br />
258 30.45 <strong>11</strong>08.94<br />
264 30.78 <strong>11</strong>97.30<br />
210 32.15 1642.39<br />
255 35.09 3231.56<br />
213 37.62 5781.61<br />
219 39.75 9447.28<br />
222 39.86 9678.80<br />
216 39.88 9733.16<br />
228 40.31<br />
225 41.20<br />
252 41.22<br />
237 42.31<br />
231 42.48<br />
243 43.21<br />
240 43.43<br />
246 43.50<br />
234 43.87<br />
249 45.44<br />
sum/n 2057.10<br />
10*log10 33.13
Classify ‘Masking’<br />
A line is classified as ‘masking’ if its level is less<br />
than the criterion level L 70% + 6 dB.<br />
L pn,avg is then the energy average of all ‘masking’<br />
lines.<br />
sound pressure level (dB A)<br />
50<br />
45<br />
40<br />
35<br />
30<br />
25<br />
20<br />
15<br />
10<br />
5<br />
0<br />
L pn,avg = 30.<strong>11</strong> dB A<br />
198<br />
201<br />
204<br />
207<br />
210<br />
213<br />
216<br />
219<br />
222<br />
225<br />
228<br />
231<br />
234<br />
237<br />
240<br />
243<br />
246<br />
249<br />
252<br />
255<br />
258<br />
261<br />
264<br />
267<br />
270<br />
273<br />
276<br />
279<br />
282<br />
285<br />
288<br />
291<br />
294<br />
297<br />
300<br />
frequency (Hz)<br />
NATIONAL RENEWABLE ENERGY LABORATORY<br />
masking<br />
L pn,avg<br />
Freq (Hz) spl (dB A) Classification 10^0.1*spl<br />
198 25.30 masking 338.7<br />
201 25.50 masking 354.6<br />
204 26.02 masking 399.9<br />
207 29.15 masking 822.1<br />
210 32.15 masking 1642.4<br />
213 37.62 masking 5781.6<br />
216 39.88 0<br />
219 39.75 0<br />
222 39.86 0<br />
225 41.20 0<br />
228 40.31 0<br />
231 42.48 0<br />
234 43.87 0<br />
237 42.31 0<br />
240 43.43 0<br />
243 43.21 0<br />
246 43.50 0<br />
249 45.44 0<br />
252 41.22 0<br />
255 35.09 masking 3231.56<br />
258 30.45 masking <strong>11</strong>08.94<br />
261 29.38 masking 866.01<br />
264 30.78 masking <strong>11</strong>97.30<br />
267 27.78 masking 599.23<br />
270 26.37 masking 433.42<br />
273 26.79 masking 477.90<br />
276 27.61 masking 576.47<br />
279 28.68 masking 737.67<br />
282 27.74 masking 594.64<br />
285 27.67 masking 584.37<br />
288 27.38 masking 546.63<br />
291 27.10 masking 512.81<br />
294 27.68 masking 586.63<br />
297 27.91 masking 617.72<br />
300 27.46 masking 557.78<br />
sum/n 1025.83<br />
10*log10 30.<strong>11</strong>
Classify ‘Tone’<br />
A line is classified as ‘tone’ if its level exceeds L pn,avg + 6 dB A = 36.<strong>11</strong> dB A<br />
Where there are several lines classified as ‘tone’, the line having the greatest<br />
level is identified. Adjacent lines are then only classified as ‘tone’ if their levels<br />
are within 10 dB A of this level.<br />
NATIONAL RENEWABLE ENERGY LABORATORY<br />
sound pressure level (dB A)<br />
50<br />
45<br />
40<br />
35<br />
30<br />
25<br />
20<br />
15<br />
10<br />
5<br />
0<br />
198<br />
201<br />
204<br />
207<br />
210<br />
213<br />
216<br />
219<br />
222<br />
225<br />
228<br />
231<br />
234<br />
237<br />
240<br />
243<br />
246<br />
249<br />
252<br />
255<br />
258<br />
261<br />
264<br />
267<br />
270<br />
273<br />
276<br />
279<br />
282<br />
285<br />
288<br />
291<br />
294<br />
297<br />
300<br />
frequency (Hz)<br />
masking<br />
tone<br />
L pn,avg + 6
Determination of Tone Level<br />
The sound pressure level of the tone L pt, is determined<br />
by energy summing all spectral lines classified as ‘tone’<br />
spl<br />
sum<br />
� 10 * log<br />
If there are more than 2 lines then a correction must be<br />
applied for using the Hanning window. Divide the<br />
energy sum by 1.5.<br />
L pt = 51.88 dB A<br />
n<br />
10 �<br />
i�1<br />
NATIONAL RENEWABLE ENERGY LABORATORY<br />
10<br />
0.<br />
1*<br />
spl<br />
i<br />
Freq (Hz) spl (dB A) Classification 10^0.1*spl<br />
198 25.30 0.0<br />
201 25.50 0.0<br />
204 26.02 0.0<br />
207 29.15 0.0<br />
210 32.15 0.0<br />
213 37.62 tone 5781.6<br />
216 39.88 tone 9733.2<br />
219 39.75 tone 9447.3<br />
222 39.86 tone 9678.8<br />
225 41.20 tone 13176.0<br />
228 40.31 tone 10750.3<br />
231 42.48 tone 17696.5<br />
234 43.87 tone 24360.8<br />
237 42.31 tone 17038.8<br />
240 43.43 tone 22031.6<br />
243 43.21 tone 20962.0<br />
246 43.50 tone 22364.2<br />
249 45.44 tone 34958.8<br />
252 41.22 tone 13247.8<br />
255 35.09 0.0<br />
258 30.45 0.0<br />
261 29.38 0.0<br />
264 30.78 0.0<br />
267 27.78 0.0<br />
270 26.37 0.0<br />
273 26.79 0.0<br />
276 27.61 0.0<br />
279 28.68 0.0<br />
282 27.74 0.0<br />
285 27.67 0.0<br />
288 27.38 0.0<br />
291 27.10 0.0<br />
294 27.68 0.0<br />
297 27.91 0.0<br />
300 27.46 0.0<br />
sum/1.5 154151.80<br />
Lpt 51.88
Correction for Background<br />
Remember the 2-minute background spectrum?<br />
Look at the same critical band (198 to 300 Hz) and<br />
ensure the tone does not originate from background<br />
Calculate the background noise level by taking the<br />
energy sum of the same critical band if the difference is<br />
more than 6 dB A. Otherwise, “influenced by<br />
background”<br />
Correct masking level L pn,ave with background level<br />
spl<br />
corr<br />
Background level = 23.03 dB A<br />
L pn,ave = 30.<strong>11</strong><br />
�<br />
10 * log<br />
10<br />
L pn, corr = 23.03 dB A<br />
NATIONAL RENEWABLE ENERGY LABORATORY<br />
�0.1* splturb<br />
� �0.1* splback<br />
� 10 �<br />
��<br />
�10 �<br />
��<br />
Freq (Hz) spl (dB A) 10^0.1*spl<br />
198 6.651 4.62<br />
201 7.221 5.27<br />
204 7.710 5.90<br />
207 8.941 7.84<br />
210 9.224 8.36<br />
213 7.170 5.21<br />
216 6.567 4.54<br />
219 6.220 4.19<br />
222 6.058 4.03<br />
225 6.0<strong>11</strong> 3.99<br />
228 6.661 4.64<br />
231 7.248 5.31<br />
234 7.962 6.26<br />
237 8.537 7.14<br />
240 8.857 7.69<br />
243 9.650 9.23<br />
246 9.775 9.50<br />
249 7.935 6.22<br />
252 7.621 5.78<br />
255 8.037 6.36<br />
258 8.231 6.65<br />
261 8.132 6.50<br />
264 7.866 6.12<br />
267 6.957 4.96<br />
270 6.399 4.36<br />
273 6.146 4.12<br />
276 5.996 3.98<br />
279 6.050 4.03<br />
282 5.735 3.75<br />
285 6.019 4.00<br />
288 6.291 4.26<br />
291 7.187 5.23<br />
294 7.742 5.95<br />
297 8.222 6.64<br />
300 9.165 8.25<br />
sum 200.86<br />
10*log10 23.03
Determination of Masking Level<br />
Calculate the masking level, L pn<br />
� critical bandwidth �<br />
Lpn � Lpn,<br />
corr �10<br />
* log10<br />
�<br />
�<br />
�effective<br />
noisebandwidth<br />
�<br />
Where for our case<br />
critical bandwidth = 300 – 198 = 102 Hz<br />
effective noise bandwidth = 1.5 * resolution = 4.5 Hz<br />
Masking level<br />
L pn = 36.58 dB A<br />
NATIONAL RENEWABLE ENERGY LABORATORY
Determination of Tonality<br />
The difference between the masking level and tone level is the tonality ∆L tn<br />
For the one critical band analyzed<br />
NATIONAL RENEWABLE ENERGY LABORATORY<br />
�L<br />
� L �L<br />
tn<br />
pn<br />
∆L tn = 51.88 - 36.58 = 15.30<br />
pt
Determination of Tonality<br />
The difference between the masking level and tone level is the tonality ∆L tn<br />
For the one critical band analyzed<br />
∆L tn = 15.30<br />
There will be 12 spectra to analyze the same peak and get a ∆L tn value for<br />
each spectrum<br />
For spectra where there are no tones use the following value<br />
The 12 resulting ∆L tn are energy averaged to one ∆L k<br />
NATIONAL RENEWABLE ENERGY LABORATORY<br />
�L<br />
� L �L<br />
tn<br />
pt<br />
� critical bandwidth �<br />
�L<br />
tn<br />
� �10<br />
* log10<br />
�<br />
�<br />
�effective<br />
noisebandwidth<br />
�<br />
pn
Determination of Audibility<br />
For each value ∆L k, a frequency dependent correction must be applied to<br />
compensate for the response of the human ear to tones of different frequencies<br />
The tonal audibility, ∆L a,k<br />
Where<br />
For tonal audibilities meeting the condition<br />
The values of ∆L a,k are reported<br />
NATIONAL RENEWABLE ENERGY LABORATORY<br />
L<br />
ΔL<br />
� �L<br />
�L<br />
a<br />
�<br />
a,k<br />
k<br />
a<br />
� � f �<br />
�2<br />
� lg�1�<br />
� �<br />
��<br />
� 502�<br />
Δ<br />
L a,k<br />
�<br />
�3.<br />
0<br />
2.<br />
5<br />
�<br />
�<br />
��
Tonality can be complicated and there is a<br />
flowchart in the standard to help<br />
NATIONAL RENEWABLE ENERGY LABORATORY<br />
Questions?<br />
We are done!<br />
Do you think you could do a noise analysis now?<br />
For questions beyond the workshop:<br />
Arlinda Huskey<br />
arlinda.huskey@nrel.gov<br />
303-384-6987<br />
47