Acoustic monopoles, dipoles, and quadrupoles
Acoustic monopoles, dipoles, and quadrupoles
Acoustic monopoles, dipoles, and quadrupoles

You also want an ePaper? Increase the reach of your titles
YUMPU automatically turns print PDFs into web optimized ePapers that Google loves.
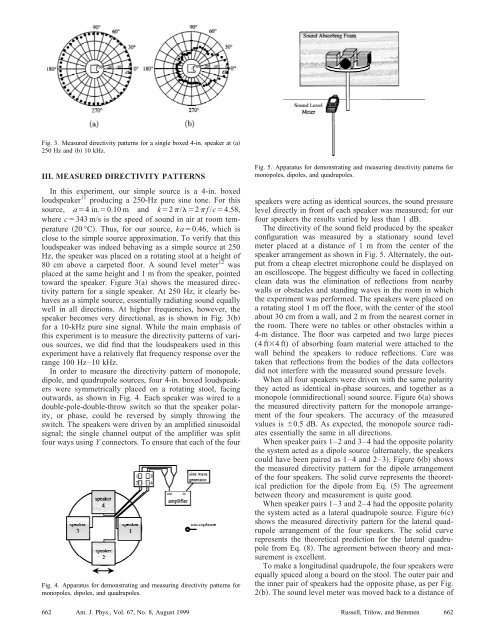
Fig. 3. Measured directivity patterns for a single boxed 4-in. speaker at �a�<br />
250 Hz <strong>and</strong> �b� 10 kHz.<br />
III. MEASURED DIRECTIVITY PATTERNS<br />
In this experiment, our simple source is a 4-in. boxed<br />
loudspeaker 11 producing a 250-Hz pure sine tone. For this<br />
source, a�4 in.�0.10 m <strong>and</strong> k�2�/��2� f /c�4.58,<br />
where c�343 m/s is the speed of sound in air at room temperature<br />
�20 °C�. Thus, for our source, ka�0.46, which is<br />
close to the simple source approximation. To verify that this<br />
loudspeaker was indeed behaving as a simple source at 250<br />
Hz, the speaker was placed on a rotating stool at a height of<br />
80 cm above a carpeted floor. A sound level meter 12 was<br />
placed at the same height <strong>and</strong> 1 m from the speaker, pointed<br />
toward the speaker. Figure 3�a� shows the measured directivity<br />
pattern for a single speaker. At 250 Hz, it clearly behaves<br />
as a simple source, essentially radiating sound equally<br />
well in all directions. At higher frequencies, however, the<br />
speaker becomes very directional, as is shown in Fig. 3�b�<br />
for a 10-kHz pure sine signal. While the main emphasis of<br />
this experiment is to measure the directivity patterns of various<br />
sources, we did find that the loudspeakers used in this<br />
experiment have a relatively flat frequency response over the<br />
range 100 Hz–10 kHz.<br />
In order to measure the directivity pattern of monopole,<br />
dipole, <strong>and</strong> quadrupole sources, four 4-in. boxed loudspeakers<br />
were symmetrically placed on a rotating stool, facing<br />
outwards, as shown in Fig. 4. Each speaker was wired to a<br />
double-pole-double-throw switch so that the speaker polarity,<br />
or phase, could be reversed by simply throwing the<br />
switch. The speakers were driven by an amplified sinusoidal<br />
signal; the single channel output of the amplifier was split<br />
four ways using Y connectors. To ensure that each of the four<br />
Fig. 4. Apparatus for demonstrating <strong>and</strong> measuring directivity patterns for<br />
<strong>monopoles</strong>, <strong>dipoles</strong>, <strong>and</strong> <strong>quadrupoles</strong>.<br />
Fig. 5. Apparatus for demonstrating <strong>and</strong> measuring directivity patterns for<br />
<strong>monopoles</strong>, <strong>dipoles</strong>, <strong>and</strong> <strong>quadrupoles</strong>.<br />
speakers were acting as identical sources, the sound pressure<br />
level directly in front of each speaker was measured; for our<br />
four speakers the results varied by less than 1 dB.<br />
The directivity of the sound field produced by the speaker<br />
configuration was measured by a stationary sound level<br />
meter placed at a distance of 1 m from the center of the<br />
speaker arrangement as shown in Fig. 5. Alternately, the output<br />
from a cheap electret microphone could be displayed on<br />
an oscilloscope. The biggest difficulty we faced in collecting<br />
clean data was the elimination of reflections from nearby<br />
walls or obstacles <strong>and</strong> st<strong>and</strong>ing waves in the room in which<br />
the experiment was performed. The speakers were placed on<br />
a rotating stool 1 m off the floor, with the center of the stool<br />
about 30 cm from a wall, <strong>and</strong> 2 m from the nearest corner in<br />
the room. There were no tables or other obstacles within a<br />
4-m distance. The floor was carpeted <strong>and</strong> two large pieces<br />
(4ft�4 ft) of absorbing foam material were attached to the<br />
wall behind the speakers to reduce reflections. Care was<br />
taken that reflections from the bodies of the data collectors<br />
did not interfere with the measured sound pressure levels.<br />
When all four speakers were driven with the same polarity<br />
they acted as identical in-phase sources, <strong>and</strong> together as a<br />
monopole �omnidirectional� sound source. Figure 6�a� shows<br />
the measured directivity pattern for the monopole arrangement<br />
of the four speakers. The accuracy of the measured<br />
values is �0.5 dB. As expected, the monopole source radiates<br />
essentially the same in all directions.<br />
When speaker pairs 1–2 <strong>and</strong> 3–4 had the opposite polarity<br />
the system acted as a dipole source �alternately, the speakers<br />
could have been paired as 1–4 <strong>and</strong> 2–3�. Figure 6�b� shows<br />
the measured directivity pattern for the dipole arrangement<br />
of the four speakers. The solid curve represents the theoretical<br />
prediction for the dipole from Eq. �5� The agreement<br />
between theory <strong>and</strong> measurement is quite good.<br />
When speaker pairs 1–3 <strong>and</strong> 2–4 had the opposite polarity<br />
the system acted as a lateral quadrupole source. Figure 6�c�<br />
shows the measured directivity pattern for the lateral quadrupole<br />
arrangement of the four speakers. The solid curve<br />
represents the theoretical prediction for the lateral quadrupole<br />
from Eq. �8�. The agreement between theory <strong>and</strong> measurement<br />
is excellent.<br />
To make a longitudinal quadrupole, the four speakers were<br />
equally spaced along a board on the stool. The outer pair <strong>and</strong><br />
the inner pair of speakers had the opposite phase, as per Fig.<br />
2�b�. The sound level meter was moved back to a distance of<br />
662 Am. J. Phys., Vol. 67, No. 8, August 1999 Russell, Titlow, <strong>and</strong> Bemmen<br />
662