PROCESS ASSESSMENT IN THE SUPPLY CHAIN: the eMBARQtM ...
PROCESS ASSESSMENT IN THE SUPPLY CHAIN: the eMBARQtM ...
PROCESS ASSESSMENT IN THE SUPPLY CHAIN: the eMBARQtM ...

You also want an ePaper? Increase the reach of your titles
YUMPU automatically turns print PDFs into web optimized ePapers that Google loves.
(WERC). In addition to <strong>the</strong> standard<br />
sampling, business profile and industry<br />
breakdowns were also acquired to make<br />
closer comparisons.<br />
aSSeSSMent FInDIngS<br />
The 2007 ratings were presented sideby-side<br />
with 2004 ratings as a point of<br />
reference. This technique demonstrated<br />
<strong>the</strong> improvements in process that had<br />
occurred in <strong>the</strong> interval between <strong>the</strong><br />
two assessments. For reference, <strong>the</strong> following<br />
details <strong>the</strong> overall impact.<br />
• Approximately half of <strong>the</strong> process<br />
attributes rated in 2004 received <strong>the</strong><br />
same score in 2007. In almost all<br />
cases, those areas were rated in an<br />
acceptable range and no initiatives<br />
had been undertaken to improve<br />
<strong>the</strong>m. The visibility, however, ensured<br />
that <strong>the</strong>y did not slip.<br />
• 12% of <strong>the</strong> attributes were scored<br />
less than one point lower, and 9%<br />
more than one point lower<br />
– In most cases, this was <strong>the</strong> result of<br />
a more exhaustive examination in<br />
2007, with <strong>the</strong> interviews conducted<br />
with <strong>the</strong> worker (ra<strong>the</strong>r than <strong>the</strong><br />
managers) in <strong>the</strong>ir workplace, and<br />
following up initial questions with<br />
“can you show me” versus merely<br />
accepting general, affirmative<br />
answers such as “yes, we do that.”<br />
• 6% of <strong>the</strong> attributes were scored less<br />
than one point higher, and 23% more<br />
than one point higher<br />
– In 50% of <strong>the</strong> cases, <strong>the</strong> increases<br />
were in <strong>the</strong> Deliver process, which<br />
includes <strong>the</strong> core processes of distribution<br />
operations.<br />
Overall, significant improvements<br />
were found in <strong>the</strong> areas of purchasing<br />
function effectiveness, receiving, and<br />
inspection. In <strong>the</strong> interim, EMBARQ<br />
Logistics had also implemented a labor<br />
management system (LMS) across all<br />
distribution centers, and tied it into <strong>the</strong><br />
warehouse management system (WMS).<br />
The “pay-for-performance” shop floor<br />
measures were tied into <strong>the</strong> LMS, and<br />
found to be best-in-class. Measures<br />
taken from those systems showed that<br />
<strong>the</strong>se initiatives were already contributing<br />
to increased organizational alignment<br />
and focus.<br />
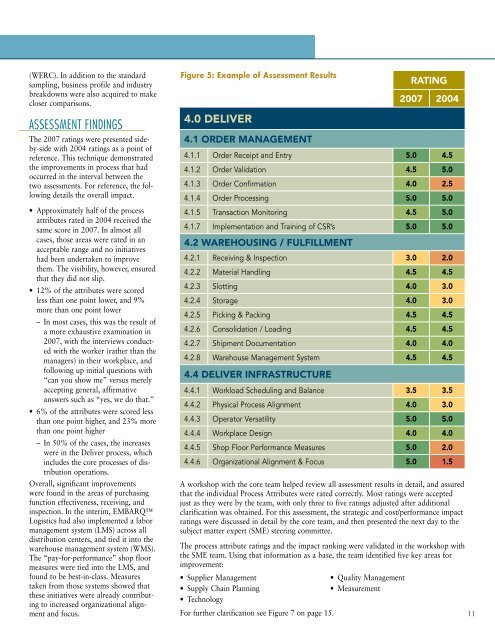
Figure 5: example of Assessment Results<br />
4.0 deliver<br />
4.1 order MAnAgeMent<br />
rAting<br />
2007 2004<br />
4.1.1 Order Receipt and Entry 5.0 4.5<br />
4.1.2 Order Validation 4.5 5.0<br />
4.1.3 Order Confirmation 4.0 2.5<br />
4.1.4 Order Processing 5.0 5.0<br />
4.1.5 Transaction Monitoring 4.5 5.0<br />
4.1.7 Implementation and Training of CSR’s 5.0 5.0<br />
4.2 WArehouSing / fulfillMent<br />
4.2.1 Receiving & Inspection 3.0 2.0<br />
4.2.2 Material Handling 4.5 4.5<br />
4.2.3 Slotting 4.0 3.0<br />
4.2.4 Storage 4.0 3.0<br />
4.2.5 Picking & Packing 4.5 4.5<br />
4.2.6 Consolidation / Loading 4.5 4.5<br />
4.2.7 Shipment Documentation 4.0 4.0<br />
4.2.8 Warehouse Management System 4.5 4.5<br />
4.4 deliver infrAStructure<br />
4.4.1 Workload Scheduling and Balance 3.5 3.5<br />
4.4.2 Physical Process Alignment 4.0 3.0<br />
4.4.3 Operator Versatility 5.0 5.0<br />
4.4.4 Workplace Design 4.0 4.0<br />
4.4.5 Shop Floor Performance Measures 5.0 2.0<br />
4.4.6 Organizational Alignment & Focus 5.0 1.5<br />
A workshop with <strong>the</strong> core team helped review all assessment results in detail, and assured<br />
that <strong>the</strong> individual Process Attributes were rated correctly. Most ratings were accepted<br />
just as <strong>the</strong>y were by <strong>the</strong> team, with only three to five ratings adjusted after additional<br />
clarification was obtained. For this assessment, <strong>the</strong> strategic and cost/performance impact<br />
ratings were discussed in detail by <strong>the</strong> core team, and <strong>the</strong>n presented <strong>the</strong> next day to <strong>the</strong><br />
subject matter expert (SME) steering committee.<br />
The process attribute ratings and <strong>the</strong> impact ranking were validated in <strong>the</strong> workshop with<br />
<strong>the</strong> SME team. Using that information as a base, <strong>the</strong> team identified five key areas for<br />
improvement:<br />
• Supplier Management<br />
• Supply Chain Planning<br />
• Technology<br />
For fur<strong>the</strong>r clarification see Figure 7 on page 15.<br />
• Quality Management<br />
• Measurement<br />
11