is your metrics program measuring up? - Supply Chain Visions
is your metrics program measuring up? - Supply Chain Visions
is your metrics program measuring up? - Supply Chain Visions

You also want an ePaper? Increase the reach of your titles
YUMPU automatically turns print PDFs into web optimized ePapers that Google loves.
CLM<br />
ENHANCING YOUR CAREER. ADVANCING YOUR PROFESSION.<br />
EXPLORES...<br />
V o l u m e O n e 2 0 0 4 S P R I N G/S U M M E R<br />
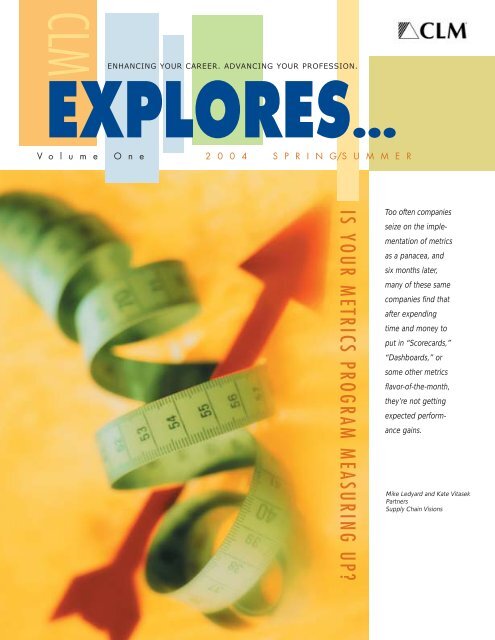
IS YOUR METRICS PROGRAM MEASURING UP?<br />
Too often companies<br />
seize on the implementation<br />
of <strong>metrics</strong><br />
as a panacea, and<br />
six months later,<br />
many of these same<br />
companies find that<br />
after expending<br />
time and money to<br />
put in “Scorecards,”<br />
“Dashboards,” or<br />
some other <strong>metrics</strong><br />
flavor-of-the-month,<br />
they’re not getting<br />
expected performance<br />
gains.<br />
Mike Ledyard and Kate Vitasek<br />
Partners<br />
S<strong>up</strong>ply <strong>Chain</strong> V<strong>is</strong>ions
If you’re interested in submitting an idea<br />
or proposal for CLM Explores…, please<br />
contact the Research Coordinator at<br />
CLMResearch@CLM1.org.<br />
CLM CLM<br />
EXPLORES...<br />
Explores… <strong>is</strong> publ<strong>is</strong>hed five times a year<br />
by the Council of Log<strong>is</strong>tics Management<br />
2805 Butterfield Road, Suite 200<br />
Oak Brook, IL 60523-1170 USA<br />
Phone: (630) 574-0985 Fax (630) 574-0989<br />
Web site: www.clm1.org<br />
Editor: Madeleine Miller-Holodnicki<br />
Direct line: (630) 645-3487<br />
E-mail: mholodnicki@clm1.org<br />
2<br />
© Copyright 2004 Council of Log<strong>is</strong>tics Management<br />
Is Your Metrics Program Measuring Up?<br />
The Building Blocks of a Successful<br />
Performance Management Program . . . . . . . . . . . . . . . . . . . . . 3<br />
The Foundation: Aligning Metrics to Strategy . . . . . . . . . . . . . 3–4<br />
Metrics systems make v<strong>is</strong>ion statements real<br />
Have you fallen into a measurement trap?<br />
The Vital Few: The importance of a handful of<br />
<strong>metrics</strong> that are the strategic focus of activities<br />
Building Block 1: Process, Not Functional Metrics . . . . . . . . . . 4–5<br />
Building Block 2: Use Balanced Metrics . . . . . . . . . . . . . . . . . . . . 5<br />
Building Block 3: Embed Metrics in Your Culture . . . . . . . . . . . 5–6<br />
Building Block 4: Link Metrics to an<br />
Incentive/Compensation Plan . . . . . . . . . . . . . . . . . . . . . . . . 6–7<br />
Building Block 5: Use Tools and Technology to<br />
Make Metrics Tracking Easier . . . . . . . . . . . . . . . . . . . . . . . . . . 7<br />
Summary. . . . . . . . . . . . . . . . . . . . . . . . . . . . . . . . . . . . . . . . . . . 7<br />
How Does Your Metrics Program Measure Up? . . . . . . . . . . . . 7–8<br />
BIBLIOGRAPHY<br />
1 Lew<strong>is</strong> Carroll, Alice’s Adventures in Wonderland, Macmillan and Co., London, England, 1865<br />
2 Steven Hronec and Arthur Anderson & Co., Vital Signs, Amacon, 1993, p 14<br />
3 “S<strong>up</strong>ply <strong>Chain</strong> Management Blues,” Modern Materials Handling, August 1, 2003<br />
4 Andy Neeley and Chr<strong>is</strong> Adams, “Perspectives on Performance: The Performance Pr<strong>is</strong>m,” Focus Magazine (online<br />
publication), August 2000, p 4<br />
5 George A. Miller, “The Magical Number Seven, Plus or Minus Two: Some Limits on our Capacity for Processing<br />
Information,” The Psychological Review, Vol 63, 1956, pp. 81-97<br />
6 Gregory P. Reilly and Raymond R. Reilly “Improving Corporate Performance Measurement” Journal of Cost<br />
Management, July/August 2001, pp. 42-44<br />
7 Robert S. Kaplan and David P. Norton, “The Balanced Scorecard–Measures that Drive Performance,” Harvard<br />
Business Review, Jan/Feb 1992<br />
8 For additional information, please see:<br />
Robert S. Kaplan and David P. Norton, “Using the Balanced Scorecard as a Strategic Management System,”<br />
Harvard Business Review, Vol 74, No 1, 1996, pp. 78-98<br />
Robert S. Kaplan and David P. Norton, The Balanced Scorecard: Translating Strategy into Action, Harvard<br />
Business School Press, Boston, 1996<br />
Robert S. Kaplan and David P. Norton, The Strategy-Focused Organization, Harvard Business School Press,<br />
Boston, 2001<br />
9 William A. Schiemann and John H. Lingle, “Seven Greatest Myths Of Measurement,” Management Review, 86(5)<br />
(1997), pp. 29-32.<br />
10 For additional information, see http://www.<strong>is</strong>ixsigma.com or similar reference sites.<br />
11 For additional information, see http://www.asq.org/basics/pdca.html or similar reference sites,<br />
12 Stephen Barr, “Postal Service Tries Pay-for-Performance System for Management,” Washington Post, January 15,<br />
2004, p B02<br />
13 The Hawthorne effect refers to an increase in worker productivity produced by the psychological stimulus of being<br />
singled out and made to feel important. The concept was demonstrated in a research project (1927-1932) of the<br />
Hawthorne Plant of the Western Electric Company in Cicero, Illino<strong>is</strong> which was led by Harvard Business School professor<br />
Elton Mayo along with associates F.J. Roethl<strong>is</strong>berger and William J. Dickson.<br />
Source—Franke, R.H. & Kaul, JD “The Hawthorne Experiments: First Stat<strong>is</strong>tical Interpretation.” American<br />
Sociological Review, 1978, 43, pp. 623-643
The Building Blocks of a<br />
Successful Performance<br />
Management Program<br />
Metrics alone do not guarantee improved<br />
business results. All too often, many people<br />
fail to understand a fundamental point:<br />
a <strong>metrics</strong> <strong>program</strong> <strong>is</strong> not the same as a<br />
performance management <strong>program</strong>. While<br />
it’s true that <strong>metrics</strong> are a necessary and<br />
irreplaceable element in performance<br />
management, as a stand-alone initiative,<br />
they’re inadequate. The challenge facing<br />
business managers <strong>is</strong> in taking <strong>metrics</strong> to<br />
the next level, and creating a viable performance<br />
management process grounded<br />
in fact.<br />
Peter Drucker said, “If you can’t measure<br />
it, you can’t manage it.” Unfortunately,<br />
many well-intentioned managers have<br />
internalized the message as “measurement<br />
<strong>is</strong> management.” In reality, <strong>metrics</strong> are<br />
just the launching point for effective performance<br />
management. Genichi Taguchi<br />
got closer to the essence of <strong>metrics</strong> when<br />
he said, “You cannot manage what you<br />
do not first measure.” In order to properly<br />
use <strong>metrics</strong>, you must incorporate these<br />
<strong>metrics</strong> into a broader performance management<br />
process. The rallying cry for performance<br />
<strong>metrics</strong> should be, “You cannot<br />
improve measures you do not actively use.”<br />
No two successful performance management<br />
<strong>program</strong>s are the same, but all successful<br />
performance management <strong>program</strong>s<br />
share common principles. To help shed light<br />
on what separates a good company from a<br />
great company, please refer to the framework<br />
above right that shows the “foundation”<br />
and “building blocks” of a successful<br />
performance management <strong>program</strong>.<br />
The Foundation and each of the Building<br />
Blocks will be d<strong>is</strong>cussed in detail. The first<br />
four (noted as “required”) are essential to<br />
the successful implementation and use of<br />
a performance measurement <strong>program</strong>.<br />
Getting the right measures in place, and<br />
establ<strong>is</strong>hing the culture to depend on these<br />
measures, should be completed first. Th<strong>is</strong><br />
follows the general rule that process should<br />
be completed before the investment in<br />
technology <strong>is</strong> made. The “Optional” and<br />
“Nice to Have” components can be added<br />
later to enhance the value to the company<br />
once the culture <strong>is</strong> establ<strong>is</strong>hed and the<br />
desired results are being achieved.<br />
BUILDING BLOCKS OF A SUCCESSFUL METRICS PROGRAM<br />
Process,<br />
Not<br />
Functional<br />
Focused<br />
Required<br />
Metrics Technology / Tools<br />
Incentive / Compensation Plan<br />
Balanced<br />
Metrics<br />
Metrics Aligned to Strategy<br />
The Foundation: Aligning Metrics to Strategy<br />
It’s no coincidence that the foundation of a successful performance management <strong>program</strong><br />
<strong>is</strong> grounded in having <strong>metrics</strong> aligned to a company’s strategy. Consider the following reference<br />
from Lew<strong>is</strong> Carroll’s Alice’s Adventures in Wonderland where Alice asks the<br />
Cheshire cat for directions:<br />
“Would you tell me, please, which way I ought to go from here?”<br />
“That depends a good deal on where you want to get to,” said the cat.<br />
“I don’t much care where,” said Alice.<br />
“Then it doesn’t matter which way you go,” said the cat. 1<br />
In business, it’s essential to know where you want to go, or else you can end <strong>up</strong> channeling<br />
an entire corporation in the wrong direction. Nonalignment cripples change; it puts<br />
an organization at odds with itself.<br />
Metrics systems make v<strong>is</strong>ion statements real<br />
Tom Malone, executive vice chairman of Milliken and Company, has stated, “Teams that<br />
don’t keep score are only practicing.” 2 Th<strong>is</strong> sports analogy can be extended to show how<br />
sports teams all over the world work to align their <strong>metrics</strong> and strategy. Take a football<br />
team for example.<br />
“If you think of football, strategic planning <strong>is</strong> like creating a playbook for the next season,”<br />
says Lori Mitchell-Keller of Manug<strong>is</strong>tics. “Tactical planning <strong>is</strong> the game plan you<br />
create for any given Sunday. And planning at the execution level <strong>is</strong> the audible the quarterback<br />
calls at the line of scrimmage in response to what’s happening with the defense.” 3<br />
The operational <strong>metrics</strong> are individual yardage gained (or prevented) on each play. These<br />
are used to adjust the execution plan during the game, and to evaluate and refine the tactical<br />
plan for the next situation. The overall strategic quantifiable metric <strong>is</strong> to maintain a<br />
positive margin between you and <strong>your</strong> opponent at the end of the game.<br />
Have you fallen into a measurement trap?<br />
Measurement<br />
Process<br />
and<br />
Culture<br />
Optional Nice to Have<br />
© 2003 S<strong>up</strong>ply <strong>Chain</strong> V<strong>is</strong>ions – all rights reserved<br />
Many companies fall into a classical measurement trap—that <strong>is</strong>, employees have many performance<br />
<strong>metrics</strong>, but they’re not linked to actionable plans that drive progress towards the<br />
company’s goals. One example <strong>is</strong> a Fortune 50 company in which a director-level employee<br />
was demonstrating what a great job her company had done establ<strong>is</strong>hing measures.<br />
They’d created scorecards for each department, and <strong>metrics</strong> were posted on an internal<br />
web site for all employees to review on demand. One could very quickly click through<br />
the site and look at the current measures for any gro<strong>up</strong> in the business unit. As she pulled<br />
<strong>up</strong> a scorecard, we randomly pointed to a metric and asked, “Is that a good thing or a<br />
bad thing?” She looked us straight in the eye and answered honestly that she had no 3<br />
idea.
4<br />
Th<strong>is</strong> <strong>is</strong> not unusual. Many companies have<br />
fallen into the trap of establ<strong>is</strong>hing measures<br />
for the sake of measures, and haven’t<br />
thought through how they’ll be used to<br />
manage the business.<br />
The Vital Few: The importance<br />
of a handful of <strong>metrics</strong> that are<br />
the strategic focus of activities<br />
“In the quest for data (and accountability),<br />
it’s easy to end <strong>up</strong> <strong>measuring</strong> everything<br />
that moves, but learning little about what<br />
<strong>is</strong> important.” 4 Managers have embraced<br />
the concept of a dashboard to provide a<br />
quick assessment of the current position<br />
of the business. The dashboard concept<br />
dates back to the French “Tableau to Bord<br />
(Management Chart)” concept from the<br />
1900s which typically was a one-page<br />
summary or chart.<br />
In today’s environment, it’s more likely to<br />
be an online, web-based presentation that<br />
draws information from a variety of<br />
sources in real time. However, studies have<br />
shown that people can only handle a small<br />
number of <strong>metrics</strong> at a given time. 5 In<br />
addition, it remains challenging to construct<br />
a summary view with a few critical<br />
Reliability<br />
Flexibility &<br />
Responsiveness<br />
Cost<br />
Asset<br />
Utilization<br />
<strong>metrics</strong> for the CEO, and yet be able to perform “root cause analys<strong>is</strong>” to surface the<br />
underlying drivers of the top-level measures. Only by linking the shop floor <strong>metrics</strong> to the<br />
strategic <strong>metrics</strong> can these relationships be establ<strong>is</strong>hed and leveraged.<br />
The concept that more measurement <strong>is</strong> better can lead companies astray. Forget quantity<br />
and focus instead on linking measures to strategic capabilities, customer expectations, and<br />
financial indicators.<br />
Building Block 1: Process, Not Functional Metrics<br />
A survey of University of Michigan Business School executive development <strong>program</strong><br />
attendees indicated that managers stood by as subordinates engaged in activities that<br />
clearly hurt the firm, but helped a key measure look strong. 6 These <strong>metrics</strong> are often<br />
created and managed at the functional<br />
“silo” level and individuals strive to achieve<br />
their results targets for their functions. Unfortunately,<br />
when left unchecked, people<br />
often “game” the system to meet their individual<br />
or functional goals.<br />
For example, a company rewarded its procurement<br />
people on purchase price variance,<br />
and its manufacturing people on<br />
machine efficiency. A purchase of a less<br />
expensive raw material slowed down the<br />
production equipment and increased the<br />
overall cost of goods. However, the pro-<br />
curement manager was paid h<strong>is</strong> bonus, and the manufacturing manager was “dinged” as<br />
a result. Functional <strong>metrics</strong> can drive suboptimization, waste time and money, and sap an<br />
organization of its vital energy.<br />
COMPANIES SHOULD STRIVE FOR ”BALANCED“ MEASURES THAT ARE MORE PROCESS AND STRATEGIC IN NATURE<br />
Results Measures Process Measures<br />
• Fill rates by customer, commodity<br />
•Available for customer pick<strong>up</strong> per request<br />
•Errors by line item, activity, reason code,<br />
etc.<br />
• Cycle count accuracy<br />
•Order fulfillment lead time by customer,<br />
commodity<br />
• Fill rates by customer, commodity<br />
•% expedite requests fulfilled by customer<br />
• Capacity load & utilization<br />
• Costs per line, per order, per activity, per<br />
shift, etc.<br />
• Load factors, lines per order, quantity<br />
per line, etc.<br />
•Freight costs per pound by mode and<br />
destination<br />
• Inventory turnover<br />
• Days of inventory<br />
• Return on investment<br />
• Return on assets<br />
• On-time delivery to commit, request<br />
•Order cycle time variability<br />
•Order processing accuracy<br />
• Forecasting accuracy<br />
• Planning accuracy<br />
• Manufacturing schedule adherence<br />
• Stock-outs against forecast<br />
• Backlog & back orders<br />
• Aggregate cycle times by activity<br />
•Order cycle time<br />
• Lead time from order receipt to manufacturer<br />
complete<br />
•Log<strong>is</strong>tics costs (order management + d<strong>is</strong>tribution +<br />
freight) as a percentage of sales<br />
•Freight costs as a percentage of sales to customer<br />
• D<strong>is</strong>tribution costs as a percentage of sales<br />
• Inventory shrink and obsolescence as a % of sales<br />
• Labor productivity analys<strong>is</strong><br />
• Over, short, damage as % of sales<br />
• Returns as a percentage of sales<br />
• Days of inventory in entire s<strong>up</strong>ply chain by<br />
activity<br />
•Total safety stocks as % of total inventory<br />
• Safety (hedge) sticks by customer<br />
• Dedicated inventories by customer<br />
• Local s<strong>up</strong>port inventories<br />
BUILDING BLOCKS OF A SUCCESSFUL<br />
METRICS PROGRAM<br />
Foundation:<br />
Metrics Aligned to Strategy<br />
Building Blocks:<br />
1. Process, Not Functional Metrics<br />
2. Use Balanced Metrics<br />
3. Embed Metrics in Your Culture<br />
4. Link Metrics to Compensation<br />
5. Use Tools & Technology<br />
Strategic Measures<br />
• Perfect order fulfillment (right<br />
item, right quantity, right place,<br />
right time, defect free, correct<br />
documentation)<br />
•Overall customer sat<strong>is</strong>faction<br />
• Upside production flexibility<br />
• Forecasting/planning cycle time<br />
•% expedite requests fulfilled<br />
•Order fulfillment lead time<br />
•Total s<strong>up</strong>ply chain management<br />
cost as a percentage of<br />
sales<br />
•Total delivered cost<br />
•Cash-to-cash cycle time<br />
• Net asset turnover, return on<br />
net assets<br />
© 2003 S<strong>up</strong>ply <strong>Chain</strong> V<strong>is</strong>ions – all rights reserved
Th<strong>is</strong> gets to the heart of the first building block—that companies need to focus on process,<br />
not functional results <strong>metrics</strong>. An integrated measurement system <strong>is</strong> a mechan<strong>is</strong>m for balancing<br />
the tendency toward functional suboptimization at the expense of the enterpr<strong>is</strong>e’s overall<br />
results. Strategic measures must be in place to serve as cross-functional regulators. These<br />
cross-functional <strong>metrics</strong>, if selected correctly, identify and track the measures critical to overall<br />
success. Going back to the football analogy…it’s nice to have the star player get all the<br />
yardage, but at the end of the day, the key goal <strong>is</strong> to get the most points. If the star player<br />
has played well, but the team has failed to score, they will lose the game.<br />
Companies should align targets and <strong>metrics</strong> across the organization. Examples of typical<br />
functional “Results” measures, cross-functional “Process” measures, and corporate-wide<br />
“Strategic” measures are shown in the exhibit on the lower half of the previous page.<br />
Companies should remember that it’s very important to lay the foundation first—start<br />
with the strategy, not with the measures themselves.<br />
The lesson <strong>is</strong> simple. Manage <strong>your</strong> business with process <strong>metrics</strong>, and evaluate <strong>your</strong> business<br />
using results and strategic <strong>metrics</strong>. The numbers must work together. Know what you<br />
are <strong>measuring</strong>, and understand cause and effect. Done properly, process <strong>metrics</strong> drive the<br />
desired results. Remember, people will try to “game” the system. Careful selection and<br />
balancing of measures will help limit the games, and drive the behaviors you seek.<br />
Building Block 2: Use Balanced Metrics<br />
In the early 90s, Kaplan and Norton wrote their first article on the concept of the<br />
Balanced Scorecard. 7 Over time, they establ<strong>is</strong>hed a new standard for the principles of performance<br />
measurement and management. The most apparent change introduced by the<br />
Balanced Scorecard methodology was the integration of other performance dimensions<br />
beyond a purely financial view, hence the “balanced” view on organizational achievement.<br />
Kaplan and Norton’s Balanced Scorecard Framework s<strong>up</strong>ports equal emphas<strong>is</strong> on internal<br />
and external perspectives. 8 Studies have found that companies that use a balanced set of<br />
strategic measures—both financial and nonfinancial—outperform their less-d<strong>is</strong>ciplined<br />
rivals in performance and management. 9 One key reason for th<strong>is</strong> <strong>is</strong> that companies that<br />
look only at financial <strong>metrics</strong> are analogous to driving a car by looking in the rear view<br />
mirror—because financial measures tend to be lagging indicators.<br />
The diagram below shows the key elements of Kaplan and Norton’s Balanced Scorecard<br />
approach.<br />
Customers<br />
“To achieve our v<strong>is</strong>ion,<br />
how should we appeal<br />
to our customers?”<br />
Financial<br />
“What level of performance<br />
or return <strong>is</strong> required?”<br />
V<strong>is</strong>ion and<br />
Strategy<br />
People<br />
“To achieve our v<strong>is</strong>ion, how<br />
will we sustain our ability to<br />
change and improve?”<br />
Operational<br />
Excellence<br />
“To sat<strong>is</strong>fy our customers<br />
and compete in our markets,<br />
at which business<br />
processes must we excel?”<br />
Source: Adapted from The Balanced<br />
Scorecard, Translating Strategy Into<br />
Action, Robert S. Kaplan, David P.<br />
Norton, Harvard Business School Press,<br />
Boston 1996.<br />
While it’s necessary to keep in mind that having a balanced set of measures <strong>is</strong> important,<br />
there are many methods a company can use to help select balanced measures. For example,<br />
from our experience, one company used the simple approach that all <strong>metrics</strong> they<br />
used had to fall into three categories: Quality, Service, and Productivity. Its reasoning was<br />
that quality measures were critical to getting customers, service-oriented measures (such<br />
as fill rate, on-time delivery, and cycle time performance) were essential to maintaining<br />
customers, and lastly, productivity (financial) measures were what was going to make the<br />
company profitable.<br />
Building Block 3: Embed<br />
Metrics in Your Culture<br />
Strategy <strong>is</strong> not just about what you want<br />
to do, it’s also about how you’re going to<br />
do it. In order to get people to buy in and<br />
commit to what’s going to happen, they<br />
must understand their role in achieving<br />
the company’s goals. Many times, management<br />
fails because the top team treks<br />
<strong>up</strong> the mountain to set strategy without<br />
regard to how the organization—with its<br />
own unique culture and variety of individuals—will<br />
be able to understand and<br />
implement its v<strong>is</strong>ion.<br />
Instead of coming back with the directive<br />
to “grow the business by 3%,” management<br />
needs to specify its desire to “increase<br />
the widget div<strong>is</strong>ion from $350 million to<br />
$425 million by introducing three new<br />
widget SKUs that will directly address<br />
customer needs for these new products.”<br />
So, how do you build continuous improvement<br />
into an organization and get the<br />
results you desire? Answer: integrate<br />
measurement into the organization’s<br />
culture. Culture <strong>is</strong> the sum of an organization’s<br />
norms, values, and beliefs, along<br />
with organizational artifacts, such as the<br />
processes, systems, and structures that<br />
s<strong>up</strong>port them. In many organizations,<br />
measurement <strong>is</strong> used as a club. It’s a tool<br />
for continuous pun<strong>is</strong>hment rather than<br />
continuous improvement. As such, it’s a<br />
tool to be avoided, subverted, or undermined<br />
rather than a source of valuable<br />
information for managing people and predicting<br />
business performance.<br />
Successful companies embed the measurement<br />
process and <strong>metrics</strong> in their culture.<br />
Putting a measurement process in place<br />
ensures frequent, constructive reviews of<br />
the <strong>metrics</strong>. Th<strong>is</strong> enables individuals,<br />
teams, and units to make timely course<br />
corrections. Used properly, measures can<br />
become the means of communication<br />
between the boardroom and the shop floor.<br />
The key <strong>is</strong> to show workers how their<br />
performance affects the overall business,<br />
then work with them to facilitate the<br />
selection and implementation of the measures.<br />
Granted, that’s easier said than<br />
done, but it definitely can be done, and<br />
has been done by a number of companies<br />
following a few simple rules. These five<br />
steps are similar to Six Sigma DMAIC<br />
methodology. 10<br />
5
1<br />
2<br />
3<br />
4<br />
5<br />
6<br />
Objective<br />
Performance<br />
Measure<br />
Results & Trend<br />
Pareto of Reasons<br />
75%<br />
15%<br />
Action Plan<br />
Short Term<br />
Long Term<br />
7%<br />
3%<br />
Process Check<br />
1. Clearly articulate the objective(s) to be met. Do<br />
<strong>your</strong> people understand <strong>your</strong> strategy? Do they understand<br />
their role in helping you achieve that strategy? Have<br />
operational and functional tactics been linked back to the<br />
strategic objectives?<br />
2. Link specific measures to the objectives. Set targets.<br />
Th<strong>is</strong> will help translate the strategic objective into a<br />
tactical common denominator. For example, if the overall<br />
objective <strong>is</strong> to “increase customer service,” one key measure<br />
might be to improve customer service levels in the<br />
call center by reducing wait time. The goal could be to<br />
“answer 80% of all customer calls in 20 seconds.”<br />
Clearly linking a tactical measure to a broader objective<br />
will help employees understand on what to focus. An important<br />
step <strong>is</strong> to determine the measure of success—or<br />
target—so employees will readily know when they’ve<br />
reached the goal.<br />
3. Measure the progress. Once clear expectations have<br />
been set, measure progress against the goal. Stat<strong>is</strong>tical<br />
Process Control (SPC) methods are good for identifying<br />
where a process has variance. However, many companies<br />
are very successful using informal tools such as Excel<br />
spreadsheets—or even simple graph paper—to plot their<br />
progress against their goals. The main focus should be<br />
that employees can easily understand and track their performance<br />
against the company’s objective.<br />
4. Find the underlying reasons. Establ<strong>is</strong>h a process for<br />
root cause analys<strong>is</strong> and development of corrective action<br />
plans. So far, so good—but now comes the hard part.<br />
What do you do if you’re not meeting <strong>your</strong> goal? The<br />
obvious problem (material was not available) <strong>is</strong> usually<br />
not the root cause (material was not ordered, the need for<br />
additional or special material was not identified, etc.). In<br />
order to keep the problem from recurring, the team must<br />
drill down to find the underlying reasons for the problem.<br />
Continuous improvement methodologies, such as the<br />
Deming Wheel PDCA (Plan/Do/Check/Act), 11 or the Six<br />
Sigma DMAIC (Design/Measure/Analyze/Improve/<br />
Control) are good guidelines to follow.<br />
For companies that are not familiar with or haven’t invested<br />
in wide-scale process improvement methods such as Six<br />
Sigma, a simple Pareto chart technique works wonders.<br />
The purpose of a Pareto chart <strong>is</strong> to help determine the<br />
root cause of why employees are not meeting their goal.<br />
In simple terms, what are the top reasons that a problem<br />
ex<strong>is</strong>ts? The investigation into root causes should be done<br />
by the working team that <strong>is</strong> performing the function to<br />
determine the barriers standing between them and success.<br />
Asking “why” 2-5 times usually yields the root cause.<br />
5. Fix the problem. Take action. Th<strong>is</strong> <strong>is</strong> where results<br />
begin. Employees who understand the problem or barrier<br />
to meeting an objective can develop an action plan to fix<br />
the problem.<br />
Building Block 4: Link<br />
Metrics to an Incentive/<br />
Compensation Plan<br />
When performance measures are linked to<br />
incentives, there’s a carrot at the end of<br />
the stick. Th<strong>is</strong> concept <strong>is</strong> not revolutionary,<br />
and <strong>is</strong> meeting with increasing acceptance<br />
every year. Even the US Postal<br />
Service has implemented a plan for 2004<br />
after a successful pilot in 2003. “The pay<br />
of postmasters, managers, and s<strong>up</strong>erv<strong>is</strong>ors<br />
will hinge on how well they meet customer<br />
service goals, improve workplace<br />
safety, and control overtime and other<br />
costs that can be measured.” 12<br />
A leading food manufacturer provided<br />
another interesting example to the author.<br />
Some years ago, the VP of s<strong>up</strong>ply chain<br />
pulled h<strong>is</strong> department heads together to<br />
inform them that from then on, a small<br />
percentage of their variable compensation<br />
would be based on the total time, cost,<br />
and quality across the entire s<strong>up</strong>ply<br />
chain—not just within their individual<br />
departments as had been done previously.<br />
After l<strong>is</strong>tening to several protests from<br />
individual managers about how they were<br />
unable to control what went on in other<br />
departments, the VP informed them,<br />
“Among all of you, you control the whole<br />
thing. Work it out!” Th<strong>is</strong> forced the managers<br />
to work together to determine how<br />
dec<strong>is</strong>ions made in one area affected another.<br />
The managers soon learned that a<br />
great commodity deal that required the<br />
purchase of three month’s worth of material<br />
suddenly didn’t look as good, and<br />
that running smaller production lots was<br />
sometimes cheaper. The percentage of<br />
their variable compensation based on the<br />
total measures has increased each year<br />
since because the value to the company<br />
was apparent in the bottom-line results.<br />
Linking <strong>metrics</strong> to compensation should<br />
include the following basic steps:<br />
• Adopt a process view of measurement<br />
to drive the desired behavior you want.<br />
• Link the incentive compensation system<br />
to specific measure targets.<br />
– If we achieve “X” overall rating,<br />
<strong>your</strong> bonus will be “Y” target times<br />
“Z”%.<br />
• Use a combination of “line-of-sight”<br />
(direct departmental control) <strong>metrics</strong>
and “process/gro<strong>up</strong>” <strong>metrics</strong> to facilitate<br />
cooperation and coordination with<br />
peers and other functions to achieve<br />
optimal results and prevent suboptimization.<br />
For example:<br />
–Department leads have 60% lineof-sight<br />
<strong>metrics</strong> and 40% process<br />
<strong>metrics</strong>.<br />
–Functional managers have 50% lineof-sight<br />
<strong>metrics</strong> and 50% process<br />
<strong>metrics</strong>.<br />
–Functional directors have 25% lineof-sight<br />
<strong>metrics</strong> and 75% process<br />
<strong>metrics</strong>.<br />
–The vice president has 100%<br />
process-oriented <strong>metrics</strong>.<br />
• Start with a small (but increasing) percentage<br />
of middle and <strong>up</strong>per managers’<br />
incentive compensation tied to a process<br />
measure they cannot control in and of<br />
themselves (per the food manufacturer<br />
example above). Increase the percentage<br />
over time as the organization and<br />
employees get used to new processfocused<br />
measures.<br />
A formal incentive and/or reward structure<br />
<strong>is</strong> not required to achieve success. Simply<br />
letting employees know that management<br />
will be using <strong>metrics</strong> as an indicator of<br />
their performance can have a positive<br />
impact. Th<strong>is</strong> concept <strong>is</strong> known as the<br />
Hawthorne Effect, and was demonstrated<br />
in a research project led by Harvard<br />
Business School professor Elton Mayo.<br />
The Hawthorne Effect has been described<br />
as the rewards you reap when you pay<br />
attention to people. The mere act of showing<br />
people that you’re concerned about<br />
them usually spurs them to better job performance.<br />
The Hawthorne Effect <strong>is</strong> also<br />
widely known as the “Somebody Upstairs<br />
Cares” syndrome. 13<br />
While most companies don’t tie compensation<br />
bonuses to their performance <strong>metrics</strong><br />
<strong>program</strong>s, many companies do use the<br />
annual review process to structure measurable<br />
goals for employee advancement.<br />
Best Practice companies also use performance<br />
measurement systems together with<br />
qualitative measurement initiatives to get<br />
a complete picture, since not everything<br />
can be reduced to digits and decimals.<br />
Performance measures become enablers of<br />
change by s<strong>up</strong>plying data for these initiatives,<br />
rather than simply lagging indicators<br />
of performance levels.<br />
Building Block 5: Use Tools and Technology to Make<br />
Metrics Tracking Easier<br />
The marketplace for software solutions to automate <strong>metrics</strong> collection and reporting<br />
<strong>is</strong> rapidly growing. Products packaged, marketed, and sold as “business performance<br />
management” tools are targeted at financial managers, such as CFOs and controllers.<br />
Cons<strong>is</strong>tent with th<strong>is</strong> trend, initiatives for business performance management from Oracle<br />
and PeopleSoft have come out of their financial application gro<strong>up</strong>s as extensions to the<br />
core financial applications.<br />
Today, most companies don’t use integrated software to run their businesses. So getting<br />
all the data to feed a dashboard or <strong>metrics</strong> scorecard can present a challenge. The success<br />
and growth in every business activity—from manufacturing to customer service—<strong>is</strong><br />
dependent <strong>up</strong>on how an organization utilizes its critical data. Effective data warehousing<br />
can help a company extract key data for easier performance management.<br />
It’s important to capture the widest range of <strong>metrics</strong> from the transaction system. The<br />
challenge, however, <strong>is</strong> to balance the availability of large numbers of <strong>metrics</strong> with the<br />
added complexity it represents from the broad user community of the data warehouse.<br />
The goal <strong>is</strong> to produce aggregate views with few <strong>metrics</strong> for the CEO while still maintaining<br />
the data needed in s<strong>up</strong>port of “root cause analys<strong>is</strong>” questions that will come back<br />
down from management.<br />
For example, many CEOs and CFOs are beginning to look at cash-to-cash cycle time. In<br />
order to determine corrective actions though, data must be captured that allows analys<strong>is</strong><br />
by s<strong>up</strong>ply chain segment, and perhaps by major customer, in order to <strong>is</strong>olate areas for<br />
improvement. The vital few measures must “roll <strong>up</strong>” from the local level, where employees<br />
understand the measure, take ownership of the data, and drive the results.<br />
It’s essential that software provide management with measures of such activities as on-time<br />
and complete shipment performance, costs against budget, inventory management, and the<br />
like. But it’s equally important for the software to find data errors and restore data integrity.<br />
IT can and must automate processes <strong>up</strong> and down the s<strong>up</strong>ply chain to eliminate redundant<br />
operations. Fixing errors, especially in log<strong>is</strong>tics, <strong>is</strong> a costly and time-consuming event<br />
for one’s own staff, but consider the impact on customers when the data <strong>is</strong> wrong.<br />
Summary<br />
No two successful performance management <strong>program</strong>s are the same, but all successful performance<br />
management <strong>program</strong>s share common principles. It’s important for managers to<br />
understand if their <strong>metrics</strong> <strong>program</strong> contains the “required” building blocks for a successful<br />
performance management <strong>program</strong>. Metrics should be aligned to strategy. They should be<br />
balanced between financial and nonfinancial measures. Metrics should be process-focused,<br />
not functionally-focused. Lastly, a company’s measurement process and culture must promote<br />
the active use of measures to drive positive change.<br />
How Does Your Metrics Program Measure Up?<br />
The chart on the following page will help you assess <strong>your</strong> own <strong>metrics</strong> <strong>program</strong>, and highlight<br />
the areas in which change <strong>is</strong> required. These standards were compiled by individuals<br />
utilizing academic research, as well as on-site observations of companies in practice. The<br />
following are representative of the sources used to compile the information in the chart:<br />
•white papers/case studies from companies specializing in benchmarking and best practices<br />
research, such as the Performance Measurement Gro<strong>up</strong>, Bain and Company, Best<br />
Practices LLC, and various universities, etc.<br />
• journals and trade magazines such as S<strong>up</strong>ply <strong>Chain</strong> Management Review, Journal of<br />
Business Log<strong>is</strong>tics, Log<strong>is</strong>tics Management, DC Velocity, Inbound Log<strong>is</strong>tics, American<br />
Shipper, and International Journal of Log<strong>is</strong>tics Management<br />
• functional white papers from sites such as WERC, APICS, American Productivity, and<br />
Quality Center, etc.<br />
• best practices as identified in The S<strong>up</strong>ply <strong>Chain</strong> Council’s SCOR model<br />
In addition, the researchers have done site v<strong>is</strong>its to over 250 locations to observe<br />
practices in action.<br />
7
Metrics Aligned<br />
and Driven by<br />
Corporate<br />
Goals<br />
Balanced<br />
Scorecard of<br />
Performance<br />
Measures<br />
Measurement<br />
Process and<br />
Culture<br />
Process<br />
Focused<br />
Metrics<br />
HOW DOES YOUR METRICS PROGRAM MEASURE UP?<br />
Poor Practice<br />
• Key Performance<br />
Indicators (KPIs)<br />
are poorly<br />
defined with<br />
weak links to<br />
goals.<br />
• Financial measures<br />
are the primary<br />
measures<br />
of performance.<br />
• Metrics are<br />
used sporadically—either<br />
functionally or<br />
individually.<br />
• Metrics offer<br />
little ability to<br />
capture or<br />
track data for<br />
nonfinancial<br />
measures.<br />
• Financial measures<br />
are the primary<br />
measures<br />
of performance.<br />
2805 Butterfield Road, Suite 200, Oak Brook, IL 60523-1170 USA<br />
Phone (630) 574-0985 • Fax (630) 574-0989 • www.clm1.org<br />
Inadequate Practice Common Practice Good Practice Best Practice<br />
• The KPIs required<br />
to achieve company<br />
goals are clearly<br />
defined.<br />
• Each functional department<br />
or work team<br />
measures the performance<br />
of its own process.<br />
• Manipulation or gaming<br />
of <strong>metrics</strong> occurs to<br />
achieve desired results<br />
(e.g. on-time fill rate to<br />
commit vs. request).<br />
• Metrics are reported<br />
on a regular bas<strong>is</strong>, but<br />
often used by only a<br />
few individuals.<br />
• Data integrity leads to<br />
a m<strong>is</strong>trust of measures.<br />
• Functional and financial<br />
<strong>metrics</strong> are used,<br />
but may be driving<br />
suboptimization.<br />
• There <strong>is</strong> no clear linkage<br />
between functional<br />
<strong>metrics</strong> and their<br />
financial leverage.<br />
• No measure of Perfect<br />
Order <strong>is</strong> maintained.<br />
• The KPIs required to<br />
achieve company goals<br />
are clearly defined and<br />
measured.<br />
• Each functional department<br />
or work team<br />
measures the performance<br />
of its own process.<br />
• Functional measures are<br />
aggregated to form a<br />
company-wide view.<br />
• Metrics are clearly d<strong>is</strong>played<br />
within the company, and<br />
communicated companywide<br />
(e.g. intranet, etc.).<br />
• Definitions are clear and<br />
agreed <strong>up</strong>on.<br />
• Reports are “seen” but not<br />
“used” by the majority of<br />
employees.<br />
• Most managers don’t use<br />
reports to drive the business.<br />
• Data integrity <strong>is</strong>sues may<br />
ex<strong>is</strong>t—but are actively<br />
being addressed as they’re<br />
d<strong>is</strong>covered.<br />
• Elements of process <strong>metrics</strong><br />
are collected, but not<br />
actively aligned to drive<br />
process behavior.<br />
• KPIs are defined, performance<br />
<strong>is</strong> measured,<br />
and targets are set.<br />
•A top 10 l<strong>is</strong>t (or similar)<br />
drives functional<br />
behavior and company<br />
goals.<br />
•A balanced scorecard of<br />
market, process, and<br />
financial measures <strong>is</strong><br />
used to make informed<br />
dec<strong>is</strong>ions and track performance.<br />
•Process <strong>metrics</strong> and<br />
results <strong>metrics</strong> are<br />
balanced to prevent<br />
suboptimization.<br />
• Metrics are used as a<br />
part of regular review<br />
meetings for all functions<br />
to drive business<br />
improvements.<br />
• Data <strong>is</strong> turned into<br />
information to make<br />
dec<strong>is</strong>ions.<br />
• Metrics reports are used<br />
by key employees and<br />
managers to drive the<br />
business.<br />
•A clear understanding<br />
of the financial impact<br />
of <strong>metrics</strong> ex<strong>is</strong>ts across<br />
all levels.<br />
• Elements of process<br />
<strong>metrics</strong> are in place and<br />
actively viewed from a<br />
process perspective on<br />
a regular bas<strong>is</strong>.<br />
• Indexing (such as<br />
Perfect Order Index) <strong>is</strong><br />
performed on an ad<br />
hoc bas<strong>is</strong>.<br />
• Each KPI <strong>is</strong> clearly defined with<br />
an actual-to-target gap analys<strong>is</strong><br />
and improvement plan.<br />
• An embedded <strong>metrics</strong> hierarchy<br />
ex<strong>is</strong>ts to associate functional<br />
<strong>metrics</strong> to a top 10 l<strong>is</strong>t, and to<br />
provide drill downs as needed<br />
(e.g. nested measures with red/<br />
yellow/green indicators).<br />
•A balanced scorecard of<br />
customer, operational,<br />
employee, and financial<br />
measures <strong>is</strong> used to make<br />
informed dec<strong>is</strong>ions and<br />
track performance.<br />
• Improvement targets and<br />
plans are in place to s<strong>up</strong>port<br />
each measure.<br />
•Metrics are used as a part<br />
of regular review meetings<br />
across all functions and<br />
levels (e.g. linking strategy<br />
to shop floor <strong>metrics</strong> to<br />
ensure all employees are<br />
marching to the beat of<br />
one drum).<br />
•Metrics are used to drill<br />
down and change the process<br />
to get the desired results.<br />
• Metrics are clearly d<strong>is</strong>played<br />
within the company, and<br />
have been made a part of<br />
the culture.<br />
• Active indexing (such as<br />
the Perfect Order Index) <strong>is</strong><br />
used with key <strong>metrics</strong>—<br />
root cause drill down <strong>is</strong><br />
readily available through<br />
linkage.<br />
• Measures are used with<br />
customers to agree <strong>up</strong>on<br />
process improvements.<br />
PRSRT STD<br />
US POSTAGE<br />
PAID<br />
CHICAGO, IL<br />
PERMIT #9711<br />
© 2004 S<strong>up</strong>ply <strong>Chain</strong> V<strong>is</strong>ions – all rights reserved