is your metrics program measuring up? - Supply Chain Visions
is your metrics program measuring up? - Supply Chain Visions
is your metrics program measuring up? - Supply Chain Visions

Create successful ePaper yourself
Turn your PDF publications into a flip-book with our unique Google optimized e-Paper software.
4<br />
Th<strong>is</strong> <strong>is</strong> not unusual. Many companies have<br />
fallen into the trap of establ<strong>is</strong>hing measures<br />
for the sake of measures, and haven’t<br />
thought through how they’ll be used to<br />
manage the business.<br />
The Vital Few: The importance<br />
of a handful of <strong>metrics</strong> that are<br />
the strategic focus of activities<br />
“In the quest for data (and accountability),<br />
it’s easy to end <strong>up</strong> <strong>measuring</strong> everything<br />
that moves, but learning little about what<br />
<strong>is</strong> important.” 4 Managers have embraced<br />
the concept of a dashboard to provide a<br />
quick assessment of the current position<br />
of the business. The dashboard concept<br />
dates back to the French “Tableau to Bord<br />
(Management Chart)” concept from the<br />
1900s which typically was a one-page<br />
summary or chart.<br />
In today’s environment, it’s more likely to<br />
be an online, web-based presentation that<br />
draws information from a variety of<br />
sources in real time. However, studies have<br />
shown that people can only handle a small<br />
number of <strong>metrics</strong> at a given time. 5 In<br />
addition, it remains challenging to construct<br />
a summary view with a few critical<br />
Reliability<br />
Flexibility &<br />
Responsiveness<br />
Cost<br />
Asset<br />
Utilization<br />
<strong>metrics</strong> for the CEO, and yet be able to perform “root cause analys<strong>is</strong>” to surface the<br />
underlying drivers of the top-level measures. Only by linking the shop floor <strong>metrics</strong> to the<br />
strategic <strong>metrics</strong> can these relationships be establ<strong>is</strong>hed and leveraged.<br />
The concept that more measurement <strong>is</strong> better can lead companies astray. Forget quantity<br />
and focus instead on linking measures to strategic capabilities, customer expectations, and<br />
financial indicators.<br />
Building Block 1: Process, Not Functional Metrics<br />
A survey of University of Michigan Business School executive development <strong>program</strong><br />
attendees indicated that managers stood by as subordinates engaged in activities that<br />
clearly hurt the firm, but helped a key measure look strong. 6 These <strong>metrics</strong> are often<br />
created and managed at the functional<br />
“silo” level and individuals strive to achieve<br />
their results targets for their functions. Unfortunately,<br />
when left unchecked, people<br />
often “game” the system to meet their individual<br />
or functional goals.<br />
For example, a company rewarded its procurement<br />
people on purchase price variance,<br />
and its manufacturing people on<br />
machine efficiency. A purchase of a less<br />
expensive raw material slowed down the<br />
production equipment and increased the<br />
overall cost of goods. However, the pro-<br />
curement manager was paid h<strong>is</strong> bonus, and the manufacturing manager was “dinged” as<br />
a result. Functional <strong>metrics</strong> can drive suboptimization, waste time and money, and sap an<br />
organization of its vital energy.<br />
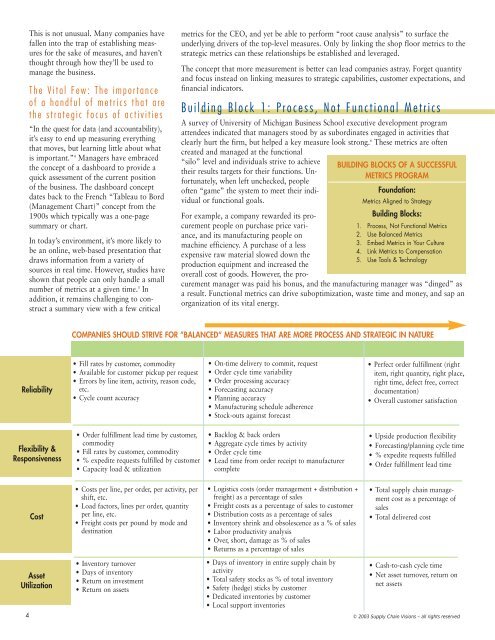
COMPANIES SHOULD STRIVE FOR ”BALANCED“ MEASURES THAT ARE MORE PROCESS AND STRATEGIC IN NATURE<br />
Results Measures Process Measures<br />
• Fill rates by customer, commodity<br />
•Available for customer pick<strong>up</strong> per request<br />
•Errors by line item, activity, reason code,<br />
etc.<br />
• Cycle count accuracy<br />
•Order fulfillment lead time by customer,<br />
commodity<br />
• Fill rates by customer, commodity<br />
•% expedite requests fulfilled by customer<br />
• Capacity load & utilization<br />
• Costs per line, per order, per activity, per<br />
shift, etc.<br />
• Load factors, lines per order, quantity<br />
per line, etc.<br />
•Freight costs per pound by mode and<br />
destination<br />
• Inventory turnover<br />
• Days of inventory<br />
• Return on investment<br />
• Return on assets<br />
• On-time delivery to commit, request<br />
•Order cycle time variability<br />
•Order processing accuracy<br />
• Forecasting accuracy<br />
• Planning accuracy<br />
• Manufacturing schedule adherence<br />
• Stock-outs against forecast<br />
• Backlog & back orders<br />
• Aggregate cycle times by activity<br />
•Order cycle time<br />
• Lead time from order receipt to manufacturer<br />
complete<br />
•Log<strong>is</strong>tics costs (order management + d<strong>is</strong>tribution +<br />
freight) as a percentage of sales<br />
•Freight costs as a percentage of sales to customer<br />
• D<strong>is</strong>tribution costs as a percentage of sales<br />
• Inventory shrink and obsolescence as a % of sales<br />
• Labor productivity analys<strong>is</strong><br />
• Over, short, damage as % of sales<br />
• Returns as a percentage of sales<br />
• Days of inventory in entire s<strong>up</strong>ply chain by<br />
activity<br />
•Total safety stocks as % of total inventory<br />
• Safety (hedge) sticks by customer<br />
• Dedicated inventories by customer<br />
• Local s<strong>up</strong>port inventories<br />
BUILDING BLOCKS OF A SUCCESSFUL<br />
METRICS PROGRAM<br />
Foundation:<br />
Metrics Aligned to Strategy<br />
Building Blocks:<br />
1. Process, Not Functional Metrics<br />
2. Use Balanced Metrics<br />
3. Embed Metrics in Your Culture<br />
4. Link Metrics to Compensation<br />
5. Use Tools & Technology<br />
Strategic Measures<br />
• Perfect order fulfillment (right<br />
item, right quantity, right place,<br />
right time, defect free, correct<br />
documentation)<br />
•Overall customer sat<strong>is</strong>faction<br />
• Upside production flexibility<br />
• Forecasting/planning cycle time<br />
•% expedite requests fulfilled<br />
•Order fulfillment lead time<br />
•Total s<strong>up</strong>ply chain management<br />
cost as a percentage of<br />
sales<br />
•Total delivered cost<br />
•Cash-to-cash cycle time<br />
• Net asset turnover, return on<br />
net assets<br />
© 2003 S<strong>up</strong>ply <strong>Chain</strong> V<strong>is</strong>ions – all rights reserved