Government Pension Fund – Global Holding of ... - Norges Bank
Government Pension Fund – Global Holding of ... - Norges Bank
Government Pension Fund – Global Holding of ... - Norges Bank

You also want an ePaper? Increase the reach of your titles
YUMPU automatically turns print PDFs into web optimized ePapers that Google loves.
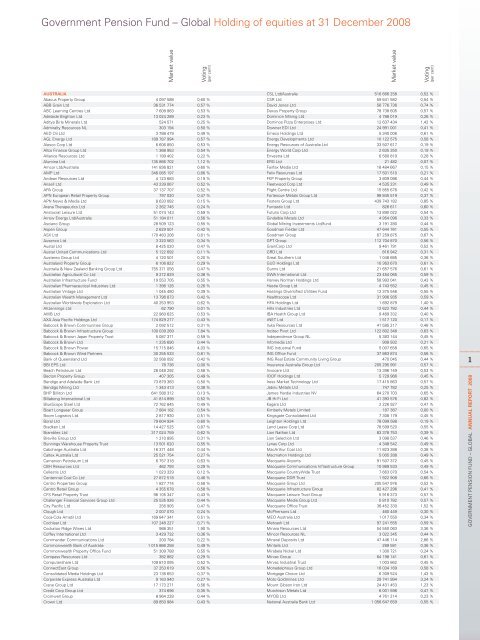
<strong>Government</strong> <strong>Pension</strong> <strong>Fund</strong> <strong>–</strong> <strong>Global</strong> <strong>Holding</strong> <strong>of</strong> equities at 31 December 2008<br />
Market value<br />
Voting<br />
(per cent)<br />
AUSTRALIA<br />
Abacus Property Group 4 097 588 0,60 %<br />
ABB Grain Ltd 36 531 774 0,57 %<br />
ABC Learning Centres Ltd 7 608 983 0,53 %<br />
Adelaide Brighton Ltd 13 024 289 0,23 %<br />
Aditya Birla Minerals Ltd 524 571 0,25 %<br />
Admiralty Resources NL 303 194 0,50 %<br />
AED Oil Ltd 3 788 479 0,49 %<br />
AGL Energy Ltd 189 787 994 0,57 %<br />
Alesco Corp Ltd 6 606 850 0,53 %<br />
Allco Finance Group Ltd 1 368 953 0,54 %<br />
Alliance Resources Ltd 1 189 402 0,22 %<br />
Alumina Ltd 135 866 702 1,12 %<br />
Amcor Ltd/Australia 141 836 821 0,60 %<br />
AMP Ltd 346 085 197 0,66 %<br />
Andean Resources Ltd 4 123 683 0,19 %<br />
Ansell Ltd 43 239 067 0,52 %<br />
APA Group 37 137 707 0,52 %<br />
APN European Retail Property Group 797 020 0,47 %<br />
APN News & Media Ltd 8 633 082 0,15 %<br />
Arana Therapeutics Ltd 2 262 745 0,24 %<br />
Aristocrat Leisure Ltd 51 074 143 0,59 %<br />
Arrow Energy Ltd/Australia 51 184 011 0,56 %<br />
Asciano Group 28 509 123 0,55 %<br />
Aspen Group 2 629 501 0,42 %<br />
ASX Ltd 170 483 206 0,61 %<br />
Ausenco Ltd 3 320 563 0,34 %<br />
Austal Ltd 8 425 020 0,47 %<br />
Austar United Communications Ltd 5 122 692 0,11 %<br />
Austereo Group Ltd 4 120 501 0,20 %<br />
Australand Property Group 6 106 822 0,29 %<br />
Australia & New Zealand <strong>Bank</strong>ing Group Ltd 755 371 056 0,47 %<br />
Australian Agricultural Co Ltd 9 272 829 0,38 %<br />
Australian Infrastructure <strong>Fund</strong> 19 553 705 0,55 %<br />
Australian Pharmaceutical Industries Ltd 1 396 126 0,26 %<br />
Australian Vintage Ltd 1 045 480 0,39 %<br />
Australian Wealth Management Ltd 13 796 873 0,42 %<br />
Australian Worldwide Exploration Ltd 40 253 953 0,62 %<br />
AVJennings Ltd 62 790 0,01 %<br />
AWB Ltd 22 960 625 0,53 %<br />
AXA Asia Pacifi c <strong>Holding</strong>s Ltd 174 829 277 0,43 %<br />
Babcock & Brown Communities Group 2 092 512 0,31 %<br />
Babcock & Brown Infrastructure Group 100 039 269 7,84 %<br />
Babcock & Brown Japan Property Trust 5 087 371 0,59 %<br />
Babcock & Brown Ltd 1 235 690 0,44 %<br />
Babcock & Brown Power 15 715 846 4,03 %<br />
Babcock & Brown Wind Partners 30 255 533 0,81 %<br />
<strong>Bank</strong> <strong>of</strong> Queensland Ltd 32 568 092 0,42 %<br />
BBI EPS Ltd 78 736 0,00 %<br />
Beach Petroleum Ltd 28 048 292 0,58 %<br />
Becton Property Group 407 305 0,49 %<br />
Bendigo and Adelaide <strong>Bank</strong> Ltd 73 879 383 0,50 %<br />
Bendigo Mining Ltd 1 343 413 0,38 %<br />
BHP Billiton Ltd 641 588 312 0,13 %<br />
Billabong International Ltd 41 814 898 0,52 %<br />
BlueScope Steel Ltd 72 762 845 0,49 %<br />
Boart Longyear Group 7 884 182 0,54 %<br />
Boom Logistics Ltd 2 817 930 0,51 %<br />
Boral Ltd 79 604 934 0,60 %<br />
Bradken Ltd 14 427 525 0,87 %<br />
Brambles Ltd 317 024 759 0,62 %<br />
Breville Group Ltd 1 210 895 0,31 %<br />
Bunnings Warehouse Property Trust 13 501 620 0,55 %<br />
Cabcharge Australia Ltd 16 371 448 0,44 %<br />
Caltex Australia Ltd 25 521 754 0,27 %<br />
Carnarvon Petroleum Ltd 6 757 318 0,63 %<br />
CBH Resources Ltd 462 793 0,29 %<br />
Cellestis Ltd 1 023 329 0,12 %<br />
Centennial Coal Co Ltd 27 872 518 0,46 %<br />
Centro Properties Group 1 827 774 0,58 %<br />
Centro Retail Group 4 355 678 0,58 %<br />
CFS Retail Property Trust 96 105 347 0,43 %<br />
Challenger Financial Services Group Ltd 25 535 926 0,44 %<br />
City Pacifi c Ltd 256 905 0,47 %<br />
Clough Ltd 2 007 070 0,24 %<br />
Coca-Cola Amatil Ltd 169 847 341 0,51 %<br />
Cochlear Ltd 107 248 227 0,71 %<br />
Cockatoo Ridge Wines Ltd 988 351 1,90 %<br />
C<strong>of</strong>fey International Ltd 3 429 732 0,36 %<br />
Commander Communications Ltd 200 784 0,22 %<br />
Commonwealth <strong>Bank</strong> <strong>of</strong> Australia 1 015 866 258 0,49 %<br />
Commonwealth Property Offi ce <strong>Fund</strong> 51 309 788 0,55 %<br />
Compass Resources Ltd 382 882 0,29 %<br />
Computershare Ltd 109 810 095 0,52 %<br />
ConnectEast Group 37 253 619 0,56 %<br />
Consolidated Media <strong>Holding</strong>s Ltd 23 136 653 0,37 %<br />
Corporate Express Australia Ltd 9 163 940 0,27 %<br />
Crane Group Ltd 17 173 271 0,56 %<br />
Credit Corp Group Ltd 374 696 0,35 %<br />
Cromwell Group 8 964 228 0,44 %<br />
Crown Ltd 89 850 984 0,43 %<br />
Market value<br />
Voting<br />
(per cent)<br />
CSL Ltd/Australia 516 666 258 0,52 %<br />
CSR Ltd 59 641 582 0,54 %<br />
David Jones Ltd 56 776 736 0,74 %<br />
Dexus Property Group 78 738 605 0,57 %<br />
Dominion Mining Ltd 4 788 019 0,26 %<br />
Dominos Pizza Enterprises Ltd 12 637 434 1,42 %<br />
Downer EDI Ltd 24 991 001 0,41 %<br />
Emeco <strong>Holding</strong>s Ltd 5 340 006 0,61 %<br />
Energy Developments Ltd 10 122 575 0,58 %<br />
Energy Resources <strong>of</strong> Australia Ltd 33 507 617 0,19 %<br />
Energy World Corp Ltd 2 635 350 0,19 %<br />
Envestra Ltd 6 580 819 0,28 %<br />
ERG Ltd 21 482 0,07 %<br />
Fairfax Media Ltd 18 484 667 0,15 %<br />
Felix Resources Ltd 17 501 510 0,21 %<br />
FKP Property Group 3 809 086 0,44 %<br />
Fleetwood Corp Ltd 4 535 231 0,49 %<br />
Flight Centre Ltd 15 855 676 0,42 %<br />
Fortescue Metals Group Ltd 98 845 519 0,37 %<br />
Fosters Group Ltd 439 743 182 0,85 %<br />
Funtastic Ltd 826 611 0,60 %<br />
Futuris Corp Ltd 13 890 022 0,54 %<br />
Gindalbie Metals Ltd 4 954 096 0,33 %<br />
<strong>Global</strong> Mining Investments Ltd/fund 3 191 280 0,44 %<br />
Goodman Fielder Ltd 47 644 761 0,55 %<br />
Goodman Group 67 259 875 0,67 %<br />
GPT Group 112 704 870 0,56 %<br />
GrainCorp Ltd 9 461 791 0,52 %<br />
GRD Ltd 816 942 0,31 %<br />
Great Southern Ltd 1 048 685 0,36 %<br />
GUD <strong>Holding</strong>s Ltd 10 363 670 0,61 %<br />
Gunns Ltd 21 657 576 0,61 %<br />
GWA International Ltd 23 454 065 0,59 %<br />
Harvey Norman <strong>Holding</strong>s Ltd 58 993 041 0,43 %<br />
Hastie Group Ltd 4 743 552 0,45 %<br />
Hastings Diversifi ed Utilities <strong>Fund</strong> 12 375 546 0,55 %<br />
Healthscope Ltd 31 906 935 0,59 %<br />
HFA <strong>Holding</strong>s Ltd 1 692 879 1,40 %<br />
Hills Industries Ltd 12 622 782 0,44 %<br />
IBA Health Group Ltd 9 469 332 0,40 %<br />
iiNET Ltd 1 517 120 0,17 %<br />
Iluka Resources Ltd 41 585 217 0,48 %<br />
Incitec Pivot Ltd 122 802 348 0,63 %<br />
Independence Group NL 5 383 144 0,45 %<br />
Infomedia Ltd 908 932 0,21 %<br />
ING Industrial <strong>Fund</strong> 5 007 658 0,65 %<br />
ING Offi ce <strong>Fund</strong> 37 863 874 0,56 %<br />
ING Real Estate Community Living Group 470 045 0,44 %<br />
Insurance Australia Group Ltd 205 295 991 0,57 %<br />
Invocare Ltd 13 396 149 0,53 %<br />
IOOF <strong>Holding</strong>s Ltd 5 729 966 0,45 %<br />
Iress Market Technology Ltd 17 415 863 0,57 %<br />
Jabiru Metals Ltd 747 782 0,25 %<br />
James Hardie Industries NV 64 270 703 0,65 %<br />
JB Hi-Fi Ltd 41 393 576 0,82 %<br />
Kagara Ltd 2 226 927 0,47 %<br />
Kimberly Metals Limited 187 387 0,00 %<br />
Kingsgate Consolidated Ltd 7 308 179 0,45 %<br />
Leighton <strong>Holding</strong>s Ltd 78 099 588 0,19 %<br />
Lend Lease Corp Ltd 78 599 520 0,55 %<br />
Lion Nathan Ltd 83 378 753 0,39 %<br />
Lion Selection Ltd 3 098 537 0,46 %<br />
Lynas Corp Ltd 4 348 542 0,49 %<br />
MacArthur Coal Ltd 11 823 388 0,38 %<br />
Macmahon <strong>Holding</strong>s Ltd 5 005 288 0,49 %<br />
Macquarie Airports 91 507 372 0,45 %<br />
Macquarie Communications Infrastructure Group 10 989 533 0,49 %<br />
Macquarie CountryWide Trust 7 663 070 0,54 %<br />
Macquarie DDR Trust 1 922 908 0,66 %<br />
Macquarie Group Ltd 205 547 976 0,52 %<br />
Macquarie Infrastructure Group 82 427 296 0,41 %<br />
Macquarie Leisure Trust Group 5 916 373 0,57 %<br />
Macquarie Media Group Ltd 5 810 782 0,57 %<br />
Macquarie Offi ce Trust 36 452 330 1,52 %<br />
McPhersons Ltd 460 449 0,30 %<br />
MEO Australia Ltd 1 017 550 0,34 %<br />
Metcash Ltd 97 241 555 0,59 %<br />
Minara Resources Ltd 54 550 063 3,36 %<br />
Mincor Resources NL 3 022 345 0,44 %<br />
Mineral Deposits Ltd 47 446 114 2,86 %<br />
Mintails Ltd 289 581 0,36 %<br />
Mirabela Nickel Ltd 1 300 721 0,24 %<br />
Mirvac Group 64 198 141 0,61 %<br />
Mirvac Industrial Trust 1 003 862 0,45 %<br />
Monadelphous Group Ltd 16 034 169 0,58 %<br />
Mortgage Choice Ltd 6 309 524 1,43 %<br />
Moto Goldmines Ltd 29 741 994 3,24 %<br />
Mount Gibson Iron Ltd 24 431 453 1,23 %<br />
Murchison Metals Ltd 6 001 596 0,47 %<br />
MYOB Ltd 4 761 214 0,23 %<br />
National Australia <strong>Bank</strong> Ltd 1 056 647 659 0,55 %<br />
1<br />
GOVERNMENT PENSION FUND <strong>–</strong> GLOBAL ANNUAL REPORT 2008
<strong>Government</strong> <strong>Pension</strong> <strong>Fund</strong> <strong>–</strong> <strong>Global</strong> <strong>Holding</strong> <strong>of</strong> equities at 31 December 2008<br />
Market value<br />
Voting<br />
(per cent)<br />
Navitas Ltd 9 045 106 0,22 %<br />
Newcrest Mining Ltd 571 766 129 0,76 %<br />
Nexus Energy Ltd 8 751 385 0,52 %<br />
Novogen Ltd 130 587 0,03 %<br />
NRW <strong>Holding</strong>s Ltd 1 447 340 0,55 %<br />
Nufarm Ltd 54 600 958 0,57 %<br />
Oakton Ltd 2 583 508 0,46 %<br />
Octaviar Ltd 4 014 531 0,17 %<br />
Oil Search Ltd 209 454 979 0,82 %<br />
OneSteel Ltd 61 965 440 0,58 %<br />
Orica Ltd 136 553 977 0,56 %<br />
Origin Energy Ltd 456 229 452 0,66 %<br />
OZ Minerals Ltd 40 665 852 0,49 %<br />
Pacifi c Brands Ltd 5 777 013 0,55 %<br />
Paladin Energy Ltd 33 438 908 0,45 %<br />
PanAust Ltd 2 822 980 0,47 %<br />
Panoramic Resources Ltd 4 707 465 0,52 %<br />
PaperlinX Ltd 16 256 222 0,79 %<br />
Perilya Ltd 623 440 0,38 %<br />
Perpetual Ltd 36 981 398 0,48 %<br />
Pharmaxis Ltd 3 199 610 0,28 %<br />
Platinum Asset Management Ltd 20 487 201 0,22 %<br />
Platinum Australia Ltd 3 199 200 0,52 %<br />
Platinum Capital Ltd 4 354 612 0,51 %<br />
PMP Ltd 4 696 287 0,57 %<br />
Primary Health Care Ltd 50 864 297 0,57 %<br />
Prime Retirement & Aged Care Property Trust/The 684 467 0,21 %<br />
Programmed Maintenance Services Ltd 7 303 116 0,50 %<br />
Qantas Airways Ltd 71 752 019 0,29 %<br />
QBE Insurance Group Ltd 795 360 227 0,64 %<br />
Queensland Gas Co Ltd 102 215 733 0,38 %<br />
Ramsay Health Care Ltd 38 190 897 0,43 %<br />
Redfl ex <strong>Holding</strong>s Ltd 5 258 962 0,36 %<br />
Resolute Mining Ltd 2 310 833 0,32 %<br />
Reverse Corp Ltd 9 705 641 1,96 %<br />
Ridley Corp Ltd 4 332 619 0,37 %<br />
RiverCity Motorway Group 2 427 490 0,36 %<br />
Riversdale Mining Ltd 11 115 460 0,50 %<br />
Roc Oil Co Ltd 7 191 306 0,50 %<br />
RP Data Ltd 1 622 648 0,60 %<br />
Rubicon America Trust 134 030 0,56 %<br />
SAI <strong>Global</strong> Ltd 9 650 555 0,58 %<br />
Salmat Ltd 6 644 647 0,27 %<br />
Santos Ltd 244 682 971 0,58 %<br />
Seek Ltd 47 613 617 1,07 %<br />
Senetas Corp Ltd 137 578 0,19 %<br />
Seven Network Ltd 20 115 683 0,30 %<br />
Sigma Pharmaceuticals Ltd 29 217 194 0,64 %<br />
Silex Systems Ltd 11 699 442 0,56 %<br />
Sims Metal Management Ltd 89 706 006 0,51 %<br />
Sino Gold Mining Ltd 33 710 053 0,47 %<br />
Skilled Group Ltd 2 288 100 0,27 %<br />
SMS Management & Technology Ltd 2 523 978 0,43 %<br />
Sonic Healthcare Ltd 157 416 980 0,58 %<br />
SP AusNet 29 922 411 0,29 %<br />
SP Telemedia Ltd 460 536 0,10 %<br />
Spark Infrastructure Group 1 586 606 0,02 %<br />
Specialty Fashion Group Ltd 1 047 330 0,45 %<br />
Spotless Group Ltd 17 998 816 0,60 %<br />
St Barbara Ltd 10 679 463 0,53 %<br />
Stockland 196 215 416 0,63 %<br />
Straits Resources Ltd 19 221 511 1,87 %<br />
STW Communications Group Ltd 2 668 299 0,38 %<br />
Suncorp-Metway Ltd 208 585 999 0,50 %<br />
Sundance Resources Ltd/Australia 2 607 385 0,35 %<br />
Sunland Group Ltd 4 678 070 0,40 %<br />
Super Cheap Auto Group Ltd 3 269 828 0,23 %<br />
Sylvania Resources Ltd 1 476 108 0,27 %<br />
TABCORP <strong>Holding</strong>s Ltd 101 432 875 0,56 %<br />
Tap Oil Ltd 3 355 293 0,57 %<br />
Tatts Group Ltd 128 001 041 0,74 %<br />
Telstra Corp Ltd 472 354 429 0,20 %<br />
Ten Network <strong>Holding</strong>s Ltd 14 244 439 0,27 %<br />
ThinkSmart Ltd 98 134 0,11 %<br />
Timbercorp Ltd 912 182 0,42 %<br />
Tishman Speyer Offi ce <strong>Fund</strong> 1 608 478 0,55 %<br />
Toll <strong>Holding</strong>s Ltd 116 040 309 0,56 %<br />
Tower Australia Group Ltd 24 150 302 0,56 %<br />
Transfi eld Services Ltd 11 431 058 0,36 %<br />
Transpacifi c Industries Group Ltd 18 835 432 0,38 %<br />
Transurban Group 187 636 436 0,56 %<br />
United Group Ltd 40 031 632 0,60 %<br />
Valad Property Group 2 376 078 0,57 %<br />
Ventracor Ltd 313 020 0,32 %<br />
Wattyl Ltd 1 381 052 0,42 %<br />
Wesfarmers Ltd 224 196 808 0,31 %<br />
West Australian Newspapers <strong>Holding</strong>s Ltd 9 735 757 0,17 %<br />
Western Areas NL 10 175 655 0,38 %<br />
Westfi eld Group 761 575 606 0,61 %<br />
Westpac <strong>Bank</strong>ing Corp 1 173 319 242 0,49 %<br />
WHK Group Ltd 4 774 640 0,42 %<br />
Market value<br />
Voting<br />
(per cent)<br />
Woodside Petroleum Ltd 532 289 590 0,43 %<br />
Woolworths Ltd 1 026 030 375 0,64 %<br />
WorleyParsons Ltd 88 006 939 0,55 %<br />
Wotif.com <strong>Holding</strong>s Ltd 27 893 869 0,75 %<br />
AUSTRIA<br />
Agrana Beteiligungs AG 10 892 405 0,22 %<br />
Andritz AG 251 187 864 2,73 %<br />
A-TEC Industries AG 12 049 079 0,71 %<br />
Atrium European Real Estate Ltd 94 387 084 1,73 %<br />
Austrian Airlines AG 15 460 093 0,45 %<br />
bwin Interactive Entertainment AG 165 253 228 3,90 %<br />
BWT AG 7 995 044 0,42 %<br />
CA Immo International AG 7 014 319 0,59 %<br />
CA Immobilien Anlagen AG 40 387 420 1,13 %<br />
Conwert Immobilien Invest SE 30 053 224 1,13 %<br />
Erste Group <strong>Bank</strong> AG 460 963 138 0,92 %<br />
EVN AG 55 678 802 0,32 %<br />
Flughafen Wien AG 38 627 680 0,60 %<br />
Immoeast AG 23 770 049 0,64 %<br />
IMMOFINANZ Immobilien Anlagen AG 27 674 435 1,26 %<br />
Intercell AG 287 746 322 2,87 %<br />
Lenzing AG 8 775 312 0,15 %<br />
Mayr Melnh<strong>of</strong> Karton AG 58 094 368 0,53 %<br />
Oesterreichische Post AG 125 611 798 0,76 %<br />
OMV AG 439 547 348 0,80 %<br />
Palfi nger AG 12 335 180 0,32 %<br />
Raiffeisen International <strong>Bank</strong> <strong>Holding</strong> AG 111 790 418 0,38 %<br />
RHI AG 44 104 781 1,07 %<br />
Schoeller-Bleckmann Oilfi eld Equipment AG 84 316 383 2,47 %<br />
Semperit AG <strong>Holding</strong> 17 566 129 0,74 %<br />
Strabag SE 65 133 559 0,36 %<br />
Telekom Austria AG 400 803 310 0,87 %<br />
Uniqa Versicherungen AG 58 302 429 0,25 %<br />
Verbund - Oesterreichische Elektrizitaetswirtschafts AG 176 770 589 0,37 %<br />
Vienna Insurance Group 173 437 022 0,58 %<br />
Voestalpine AG 329 267 147 1,37 %<br />
Wienerberger AG 121 345 831 1,25 %<br />
Zumtobel AG 10 503 221 0,43 %<br />
BELGIUM<br />
Ackermans & van Haaren NV 121 769 475 1,03 %<br />
AGFA-Gevaert NV 34 353 258 1,47 %<br />
Anheuser-Busch InBev NV 2 033 156 767 1,07 %<br />
Arseus NV 9 214 791 0,49 %<br />
Banque Nationale de Belgique 41 802 936 0,44 %<br />
Barco NV 25 181 688 1,14 %<br />
Befi mmo SCA Sicafi 108 023 913 1,27 %<br />
Bekaert SA 97 734 517 1,05 %<br />
Belgacom SA 955 989 057 1,06 %<br />
Brederode SA 7 883 029 0,19 %<br />
Cie du Bois Sauvage 414 907 0,02 %<br />
C<strong>of</strong>i nimmo 112 136 503 1,12 %<br />
Colruyt SA 260 666 162 0,52 %<br />
Compagnie dEntreprises CFE 33 760 077 0,91 %<br />
Compagnie Maritime Belge SA 45 361 789 0,74 %<br />
Deceuninck NV 2 751 304 0,50 %<br />
Delhaize Group 749 941 730 1,74 %<br />
Dexia SA 291 337 210 0,53 %<br />
Dieteren SA 26 876 253 0,66 %<br />
Elia System Operator SA/NV 4 675 801 0,04 %<br />
Euronav NV 33 278 536 0,67 %<br />
EVS Broadcast Equipment SA 40 259 765 1,17 %<br />
Exmar NV 9 241 109 0,37 %<br />
Fluxys 12 859 886 0,59 %<br />
Fortis 270 825 879 1,27 %<br />
Gimv NV 27 907 739 0,40 %<br />
Groupe Bruxelles Lambert SA 1 603 196 796 1,80 %<br />
Intervest Offi ces 7 418 207 0,31 %<br />
Ion Beam Applications 9 087 621 0,45 %<br />
KBC Ancora 38 671 603 0,41 %<br />
KBC Groep NV 676 988 770 0,91 %<br />
Melexis NV 14 259 874 0,68 %<br />
Mobistar SA 150 115 309 0,50 %<br />
Nationale A Portefeuille 146 571 379 0,39 %<br />
Nyrstar 28 336 582 1,33 %<br />
Omega Pharma SA 67 241 674 1,06 %<br />
Option NV 6 735 987 0,88 %<br />
Recticel SA 4 746 943 0,42 %<br />
RHJ International 28 143 520 0,97 %<br />
Roularta Media Group NV 3 425 637 0,25 %<br />
RTL Group SA 55 069 432 0,09 %<br />
Sioen Industries NV 891 577 0,12 %<br />
S<strong>of</strong>i na SA 90 996 842 0,53 %<br />
Solvay SA 266 668 434 0,61 %<br />
Telenet Group <strong>Holding</strong> NV 133 276 468 1,03 %<br />
Tessenderlo Chemie NV 69 755 536 1,20 %<br />
UCB SA 521 575 789 1,25 %<br />
Umicore 211 457 982 1,26 %<br />
Van de Velde 7 428 899 0,23 %<br />
Warehouses De Pauw SCA 20 881 598 0,83 %<br />
Wereldhave Belgium NV 5 119 676 0,21 %<br />
2<br />
GOVERNMENT PENSION FUND <strong>–</strong> GLOBAL ANNUAL REPORT 2008
<strong>Government</strong> <strong>Pension</strong> <strong>Fund</strong> <strong>–</strong> <strong>Global</strong> <strong>Holding</strong> <strong>of</strong> equities at 31 December 2008<br />
Market value<br />
Voting<br />
(per cent)<br />
BERMUDA<br />
Genpact Ltd 14 395 071 0,12 %<br />
Maiden <strong>Holding</strong>s Ltd 39 449 831 0,00 %<br />
MF <strong>Global</strong> Ltd 13 623 936 0,79 %<br />
BRAZIL<br />
AES Tiete SA 42 159 710 0,11 %<br />
All America Latina Logistica SA 63 406 988 0,37 %<br />
Amil Participacoes SA 13 835 772 0,18 %<br />
Anglo Ferrous Brazil SA 1 061 097 0,00 %<br />
Aracruz Celulose SA 18 979 989 0,00 %<br />
B2W Cia <strong>Global</strong> Do Varejo 46 587 102 0,57 %<br />
Banco Bradesco SA 497 361 893 0,00 %<br />
Banco do Brasil SA 167 073 796 0,15 %<br />
Banco do Estado do Rio Grande do Sul 50 341 947 0,00 %<br />
Banco Itau <strong>Holding</strong> Financeira SA 540 666 480 0,00 %<br />
Banco Nossa Caixa SA 34 768 505 0,16 %<br />
BM&FBOVESPA SA 213 618 003 0,58 %<br />
BR Malls Participacoes SA 15 241 628 0,33 %<br />
Bradespar SA 64 525 260 0,01 %<br />
Brascan Residential Properties SA 2 734 167 0,14 %<br />
Brasil Telecom Participacoes SA 84 475 608 0,21 %<br />
Brasil Telecom SA 25 090 883 0,00 %<br />
Braskem SA 18 761 414 0,00 %<br />
Centrais Eletricas Brasileiras SA 306 918 016 0,14 %<br />
Cia Brasileira de Distribuicao Grupo Pao de Acucar 62 409 846 0,00 %<br />
Cia de Bebidas das Americas 239 859 647 0,04 %<br />
Cia de Concessoes Rodoviarias 103 947 667 0,36 %<br />
Cia de Gas de Sao Paulo 12 674 206 0,00 %<br />
Cia de Saneamento Basico do Estado de Sao Paulo 149 285 347 0,22 %<br />
Cia de Saneamento de Minas Gerais-COPASA 14 554 747 0,22 %<br />
Cia de Tecidos do Norte de Minas - Coteminas 2 402 674 0,00 %<br />
Cia de Transmissao de Energia Eletrica Paulista 20 550 107 0,00 %<br />
Cia Energetica de Minas Gerais 146 455 571 0,08 %<br />
Cia Energetica de Sao Paulo 42 606 490 0,00 %<br />
Cia Energetica do Ceara 2 853 444 0,00 %<br />
Cia Paranaense de Energia 46 041 990 0,00 %<br />
Cia Siderurgica Nacional SA 213 528 115 0,31 %<br />
Cia Vale do Rio Doce 1 311 785 183 0,18 %<br />
Confab Industrial SA 9 286 021 0,00 %<br />
Contax Participacoes SA 4 513 272 0,00 %<br />
Cosan Ltd 39 587 353 0,94 %<br />
Cosan SA Industria e Comercio 48 218 546 0,44 %<br />
CPFL Energia SA 450 924 0,00 %<br />
Cyrela Brazil Realty SA 36 643 654 0,37 %<br />
Cyrela Commercial Properties SA Empreendimentos e<br />
Participacoes 5 150 178 0,32 %<br />
Diagnosticos da America SA 27 194 998 0,70 %<br />
Drogasil SA 26 652 419 1,41 %<br />
Duratex SA 15 196 905 0,00 %<br />
EDP - Energias do Brasil SA 16 890 406 0,16 %<br />
Empresa Brasileira de Aeronautica SA 94 706 901 0,48 %<br />
Fertilizantes Fosfatados SA 22 001 593 0,00 %<br />
Gafi sa SA 19 245 691 0,46 %<br />
Gerdau SA 150 211 943 0,11 %<br />
<strong>Global</strong> Village Telecom <strong>Holding</strong> SA 133 779 633 1,37 %<br />
Gol Linhas Aereas Inteligentes SA 7 030 252 0,00 %<br />
Grendene SA 4 449 918 0,12 %<br />
Guararapes Confeccoes SA 3 255 310 0,19 %<br />
Investimentos Itau SA 282 884 705 0,00 %<br />
JBS SA 40 806 832 0,19 %<br />
Klabin SA 29 653 040 0,00 %<br />
Light SA 34 374 979 0,26 %<br />
LLX Logistica SA 2 373 999 0,00 %<br />
Localiza Rent A CAR 9 998 368 0,23 %<br />
Lojas Americanas SA 30 980 499 0,00 %<br />
Lojas Renner SA 30 535 716 0,53 %<br />
LPS Brasil Consultoria de Imoveis SA 3 347 711 0,34 %<br />
Lupatech SA 17 730 261 0,53 %<br />
Mahle-Metal Leve SA Industria e Comercio 572 868 0,00 %<br />
Marcopolo SA 4 806 509 0,00 %<br />
Marfrig Frigorifi cos e Comercio de Alimentos SA 7 670 813 0,13 %<br />
Metalurgica Gerdau SA 68 510 045 0,00 %<br />
MMX Mineracao e Metalicos SA 4 558 749 0,18 %<br />
MPX Energia SA 3 026 637 0,11 %<br />
MRV Engenharia e Participacoes SA 51 259 0,00 %<br />
Multiplan Empreendimentos Imobiliarios SA 14 728 217 0,33 %<br />
Natura Cosmeticos SA 40 499 991 0,17 %<br />
NET Servicos de Comunicacao SA 39 311 140 0,00 %<br />
Odontoprev SA 40 885 895 2,32 %<br />
OGX Petroleo e Gas Participacoes SA 56 068 910 0,11 %<br />
PDG Realty SA Empreendimentos e Participacoes 16 481 726 0,34 %<br />
Perdigao SA 141 166 959 0,48 %<br />
Petroleo Brasileiro SA 2 344 448 206 0,22 %<br />
Porto Seguro SA 16 998 627 0,19 %<br />
Pr<strong>of</strong>arma Distribuidora de Produtos Farmaceuticos SA 8 234 629 1,42 %<br />
Randon Participacoes SA 9 634 034 0,00 %<br />
Redecard SA 105 344 606 0,20 %<br />
Rossi Residencial SA 9 876 411 0,45 %<br />
Sadia SA 43 700 902 0,00 %<br />
Santos Brasil Participacoes SA 4 017 413 0,00 %<br />
Sao Paulo Alpargatas SA 4 903 458 0,00 %<br />
Market value<br />
Voting<br />
(per cent)<br />
SLC Agricola SA 6 696 434 0,16 %<br />
Souza Cruz SA 52 051 152 0,13 %<br />
Suzano Papel e Celulose SA 30 183 712 0,00 %<br />
Tam SA 56 153 518 0,00 %<br />
Tele Norte Leste Participacoes SA 142 787 231 0,23 %<br />
Telecomunicacoes de Sao Paulo SA 35 582 183 0,07 %<br />
Telemar Norte Leste SA 26 285 943 0,00 %<br />
Telemig Celular Participacoes SA 10 008 721 0,17 %<br />
Terna Participacoes SA 11 765 444 0,00 %<br />
Tim Participacoes SA 113 866 563 0,19 %<br />
Totvs SA 13 149 860 0,38 %<br />
Tractebel Energia SA 90 613 532 0,25 %<br />
Ultrapar Participacoes SA 64 515 835 0,00 %<br />
Uniao de Industrias Petroquimicas SA 5 265 507 0,00 %<br />
Usinas Siderurgicas de Minas Gerais SA 113 128 582 0,17 %<br />
Vivo Participacoes SA 112 450 161 0,36 %<br />
Votorantim Celulose e Papel SA 22 921 168 0,00 %<br />
Weg SA 53 116 423 0,23 %<br />
CANADA<br />
Absolute S<strong>of</strong>tware Corp 3 492 032 0,39 %<br />
Addax Petroleum Corp 158 502 182 0,85 %<br />
Aecon Group Inc 13 600 676 0,43 %<br />
AGF Management Ltd 17 377 414 0,00 %<br />
Agnico-Eagle Mines Ltd 152 173 735 0,28 %<br />
Agrium Inc 348 629 389 0,94 %<br />
Alamos Gold Inc 15 841 833 0,33 %<br />
Alimentation Couche Tard Inc 90 389 517 0,79 %<br />
Anvil Mining Ltd 1 470 541 0,34 %<br />
Astral Media Inc 31 652 666 0,00 %<br />
Atco Ltd 40 907 318 0,00 %<br />
Atrium Innovations Inc 9 969 705 0,42 %<br />
ATS Automation Tooling Systems Inc 9 624 669 0,44 %<br />
Aura Minerals Inc 1 322 927 0,25 %<br />
Aurizon Mines Ltd 13 201 082 0,39 %<br />
Ballard Power Systems Inc 1 906 744 0,31 %<br />
<strong>Bank</strong> <strong>of</strong> Montreal 335 628 782 0,35 %<br />
<strong>Bank</strong> <strong>of</strong> Nova Scotia 1 628 924 201 0,87 %<br />
BCE Inc 168 079 441 0,15 %<br />
Biovail Corp 31 721 929 0,31 %<br />
Birchcliff Energy Ltd 13 972 380 0,43 %<br />
Boardwalk Real Estate Investment Trust 34 832 525 0,49 %<br />
Bombardier Inc 166 135 810 0,19 %<br />
Brookfi eld Asset Management Inc 335 751 001 0,55 %<br />
Brookfi eld Properties Corp 84 577 655 0,41 %<br />
CAE Inc 47 911 149 0,41 %<br />
Calfrac Well Services Ltd 5 532 731 0,30 %<br />
Calloway Real Estate Investment Trust 23 256 639 0,46 %<br />
Cameco Corp 415 506 379 0,94 %<br />
Canaccord Capital Inc 5 082 257 0,41 %<br />
Canadian Apartment Properties REIT 27 992 955 0,47 %<br />
Canadian Hydro Developers Inc 7 665 345 0,32 %<br />
Canadian Imperial <strong>Bank</strong> <strong>of</strong> Commerce/Canada 1 003 598 712 0,91 %<br />
Canadian National Railway Co 585 277 250 0,49 %<br />
Canadian Natural Resources Ltd 783 625 666 0,52 %<br />
Canadian Pacifi c Railway Ltd 209 275 838 0,59 %<br />
Canadian Real Estate Investment Trust 35 469 506 0,45 %<br />
Canadian Tire Corp Ltd 100 392 710 0,00 %<br />
Canadian Utilities Ltd 59 885 031 0,00 %<br />
Canadian Western <strong>Bank</strong> 17 633 386 0,40 %<br />
Canam Group Inc 5 113 474 0,29 %<br />
Canfor Corp 15 798 394 0,26 %<br />
Cangene Corp 315 574 0,01 %<br />
CanWest <strong>Global</strong> Communications Corp 1 387 106 0,31 %<br />
Cardiome Pharma Corp 15 185 263 0,75 %<br />
Cascades Inc 18 007 702 0,94 %<br />
Catalyst Paper Corp 1 717 931 0,26 %<br />
CCL Industries 17 850 392 0,00 %<br />
Celestica Inc 27 946 412 0,44 %<br />
Celtic Exploration Ltd 12 073 265 0,41 %<br />
Centerra Gold Inc 8 343 901 0,15 %<br />
CGI Group Inc 60 464 221 0,41 %<br />
Chartwell Seniors Housing Real Estate Investment Trust 12 185 145 0,40 %<br />
CML Healthcare Income <strong>Fund</strong> 22 949 707 0,35 %<br />
Cogeco Cable Inc 22 788 382 0,35 %<br />
Cominar Real Estate Investment Trust 16 980 245 0,41 %<br />
Compton Petroleum Corp 2 595 450 0,38 %<br />
Connacher Oil and Gas Ltd 3 577 988 0,40 %<br />
Corridor Resources Inc 3 562 252 0,32 %<br />
Corus Entertainment Inc 6 078 032 0,00 %<br />
Cott Corp 1 677 878 0,27 %<br />
Crescent Point Energy Trust 43 013 892 0,25 %<br />
Crew Energy Inc 9 194 692 0,43 %<br />
Crystallex International Corp 6 202 665 1,78 %<br />
Denison Mines Corp 4 804 179 0,29 %<br />
Detour Gold Corp 8 354 739 0,39 %<br />
Dorel Industries Inc 22 648 007 0,49 %<br />
Dundee Corp 8 931 719 0,37 %<br />
Dundee Real Estate Investment Trust 5 522 712 0,47 %<br />
DundeeWealth Inc 7 114 662 0,18 %<br />
Eastern Platinum Ltd 42 560 418 3,29 %<br />
Eldorado Gold Corp 92 364 201 0,46 %<br />
3<br />
GOVERNMENT PENSION FUND <strong>–</strong> GLOBAL ANNUAL REPORT 2008
<strong>Government</strong> <strong>Pension</strong> <strong>Fund</strong> <strong>–</strong> <strong>Global</strong> <strong>Holding</strong> <strong>of</strong> equities at 31 December 2008<br />
Market value<br />
Voting<br />
(per cent)<br />
Emera Inc 49 003 398 0,35 %<br />
Empire Co Ltd 12 297 776 0,00 %<br />
Enbridge Inc 415 863 640 0,50 %<br />
EnCana Corp 1 251 032 762 0,52 %<br />
Ensign Energy Services Inc 48 700 166 0,42 %<br />
Entree Gold Inc 3 504 091 0,62 %<br />
Equinox Minerals Ltd 16 099 736 0,35 %<br />
European Goldfi elds Ltd 12 141 897 0,37 %<br />
Evertz Technologies Ltd Com 3 899 509 0,07 %<br />
Extendicare Real Estate Investment Trust 7 116 587 0,30 %<br />
Fairborne Energy Ltd 12 324 156 0,43 %<br />
Fairfax Financial <strong>Holding</strong>s Ltd 175 858 550 0,47 %<br />
Finning International Inc 62 605 134 0,43 %<br />
First Capital Realty Inc 15 480 029 0,16 %<br />
First National Financial Income <strong>Fund</strong> 13 708 665 1,82 %<br />
First Quantum Minerals Ltd 23 519 221 0,34 %<br />
First Uranium Corp 55 915 251 4,11 %<br />
FirstService Corp 4 707 636 0,19 %<br />
Flint Energy Services Ltd 4 933 751 0,26 %<br />
FNX Mining Co Inc 4 379 270 0,30 %<br />
Fortis Inc 109 700 695 0,47 %<br />
Forzani Group Ltd/The 4 830 399 0,39 %<br />
Franco-Nevada Corp 545 638 390 4,51 %<br />
Fronteer Development Group Inc 3 084 462 0,27 %<br />
Gabriel Resources Ltd 35 744 348 1,62 %<br />
Galleon Energy Inc 18 842 093 0,89 %<br />
Gammon Gold Inc 90 815 136 1,98 %<br />
Gennum Corp 60 819 0,01 %<br />
George Weston Ltd 78 305 121 0,18 %<br />
Gerdau Ameristeel Corp 60 062 408 0,33 %<br />
Gildan Activewear Inc 43 923 872 0,45 %<br />
Goldcorp Inc 611 049 695 0,38 %<br />
Golden Star Resources Ltd 5 664 195 0,34 %<br />
Great Canadian Gaming Corp 7 298 658 0,43 %<br />
Great-West Lifeco Inc 96 142 782 0,09 %<br />
Groupe Aeroplan Inc 38 401 206 0,39 %<br />
H&R Real Estate Investment Trust 29 887 850 0,48 %<br />
Hanfeng Evergreen Inc 6 824 366 0,35 %<br />
Harry Winston Diamond Corp 6 429 214 0,33 %<br />
Highpine Oil & Gas Ltd 8 408 076 0,42 %<br />
Home Capital Group Inc 18 453 200 0,48 %<br />
HudBay Minerals Inc 10 964 360 0,41 %<br />
Husky Energy Inc 189 350 053 0,13 %<br />
IAMGOLD Corp 35 413 853 0,28 %<br />
IGM Financial Inc 85 763 808 0,16 %<br />
Imperial Oil Ltd 332 499 235 0,16 %<br />
Industrial Alliance Insurance and Financial Services Inc 48 983 666 0,46 %<br />
ING Canada Inc 29 100 400 0,14 %<br />
Inmet Mining Corp 19 953 460 0,37 %<br />
InnVest Real Estate Investment Trust 6 804 624 0,42 %<br />
InterOil Corp 9 433 000 0,28 %<br />
iShares CDN S&P/TSX 60 Index <strong>Fund</strong> 21 613 977 0,00 %<br />
Iteration Energy Ltd 4 935 883 0,38 %<br />
Ivanhoe Mines Ltd/CA 107 012 955 1,50 %<br />
Jean Coutu Group PJC Inc/The 20 716 781 0,37 %<br />
Katanga Mining Ltd 613 149 0,13 %<br />
Kingsway Financial Services Inc 7 020 965 0,35 %<br />
Kinross Gold Corp 714 846 995 0,84 %<br />
Kirkland Lake Gold Inc 3 636 797 0,26 %<br />
Laurentian <strong>Bank</strong> <strong>of</strong> Canada 17 326 292 0,37 %<br />
Linamar Corp 4 973 012 0,37 %<br />
Loblaw Cos Ltd 243 558 887 0,45 %<br />
Lundin Mining Corp 8 317 650 0,32 %<br />
MacDonald Dettwiler & Associates Ltd 20 995 132 0,42 %<br />
MagIndustries Corp 8 738 326 3,00 %<br />
Magna International Inc 105 264 428 0,45 %<br />
Major Drilling Group International 6 739 840 0,40 %<br />
Manitoba Telecom Services Inc 27 215 979 0,21 %<br />
Manulife Financial Corp 881 672 805 0,46 %<br />
Maple Leaf Foods Inc 60 089 437 0,84 %<br />
Martinrea International Inc 3 318 005 0,36 %<br />
MDS Inc 14 193 187 0,28 %<br />
MEGA Brands Inc 292 875 0,39 %<br />
Melcor Developments Ltd 1 124 684 0,14 %<br />
Mercator Minerals Ltd 540 924 0,32 %<br />
Methanex Corp 34 725 127 0,48 %<br />
Metro Inc 17 305 845 0,08 %<br />
Molson Coors Canada Inc 9 287 083 0,00 %<br />
Morguard Real Estate Investment Trust 8 817 280 0,23 %<br />
National <strong>Bank</strong> <strong>of</strong> Canada 104 777 552 0,37 %<br />
New Gold Inc 6 482 772 0,30 %<br />
Newmont Mining Corp <strong>of</strong> Canada Ltd 39 817 711 0,25 %<br />
Nexen Inc 446 393 015 0,70 %<br />
Niko Resources Ltd 51 926 203 0,44 %<br />
Norbord Inc 1 986 364 0,33 %<br />
Nortel Networks Corp 2 961 618 0,33 %<br />
Northbridge Financial Corp 15 531 581 0,15 %<br />
Northgate Minerals Corp 3 945 523 0,27 %<br />
Nova Chemicals Corp 26 185 402 0,95 %<br />
Novagold Resources Inc 18 659 909 1,69 %<br />
NuVista Energy Ltd 14 798 698 0,38 %<br />
Market value<br />
Voting<br />
(per cent)<br />
Oilexco Inc 1 735 757 0,48 %<br />
Onex Corp 25 590 742 0,20 %<br />
Open Text Corp 50 521 289 0,46 %<br />
OPTI Canada Inc 59 441 724 2,97 %<br />
Osisko Mining Corp 9 001 711 0,26 %<br />
Pacifi c Rubiales Energy Corp 9 983 327 0,38 %<br />
PAN American Silver Corp 34 644 809 0,36 %<br />
Paramount Resources Ltd 5 802 380 0,22 %<br />
Pason Systems Inc 20 177 880 0,31 %<br />
Patheon Inc 20 340 197 1,78 %<br />
Petro Andina Resources Inc 4 904 759 0,35 %<br />
Petrobank Energy & Resources Ltd 40 052 589 0,42 %<br />
Petro-Canada 390 239 627 0,53 %<br />
Potash Corp <strong>of</strong> Saskatchewan 1 248 446 038 0,81 %<br />
Power Corp <strong>of</strong> Canada/Canada 230 375 395 0,44 %<br />
Power Financial Corp 170 959 505 0,18 %<br />
Precision Drilling Trust 7 703 282 0,10 %<br />
Primaris Retail Real Estate Investment Trust 15 272 531 0,40 %<br />
ProEx Energy Ltd 17 724 160 0,47 %<br />
QLT Inc 1 010 978 0,08 %<br />
Quadra Mining Ltd (3 335 544) 0,00 %<br />
Quebecor Inc 15 993 444 0,34 %<br />
Red Back Mining Inc 36 274 505 0,36 %<br />
Reitmans Canada Ltd 15 939 829 0,00 %<br />
Research In Motion Ltd 922 243 703 0,58 %<br />
RioCan Real Estate Investment Trust 77 243 926 0,45 %<br />
Rogers Communications Inc 504 247 020 0,00 %<br />
RONA Inc 95 316 295 1,21 %<br />
Royal <strong>Bank</strong> <strong>of</strong> Canada 1 157 583 380 0,40 %<br />
Russel Metals Inc 58 750 506 0,89 %<br />
Saputo Inc 55 215 550 0,21 %<br />
Savanna Energy Services Corp 24 872 820 0,93 %<br />
Sears Canada Inc 12 193 217 0,11 %<br />
Shaw Communications Inc 405 164 300 0,00 %<br />
ShawCor Ltd 28 471 115 0,47 %<br />
Sherritt International Corp 56 144 336 1,07 %<br />
Shoppers Drug Mart Corp 139 944 499 0,24 %<br />
Shore Gold Inc 1 258 956 0,27 %<br />
Sierra Wireless Inc 3 794 209 0,30 %<br />
Silver Standard Resources Inc 197 345 601 2,82 %<br />
Silver Wheaton Corp 56 307 721 0,49 %<br />
Silvercorp Metals Inc 7 605 383 0,34 %<br />
Sino-Forest Corp 31 940 129 0,35 %<br />
SNC-Lavalin Group Inc 150 136 918 0,44 %<br />
Stantec Inc 28 289 013 0,36 %<br />
Storm Exploration Inc 7 448 275 0,22 %<br />
Sun Life Financial Inc 405 087 623 0,45 %<br />
Suncor Energy Inc 849 986 337 0,67 %<br />
SunOpta Inc 9 004 818 1,27 %<br />
Talisman Energy Inc 475 455 803 0,67 %<br />
Taseko Mines Ltd 1 521 522 0,26 %<br />
Teck Cominco Ltd 71 876 520 0,44 %<br />
TELUS Corp 129 357 828 0,12 %<br />
Theratechnologies Inc 688 276 0,10 %<br />
Thompson Creek Metals Co Inc 10 916 537 0,32 %<br />
Thomson Reuters Corp 18 835 035 0,01 %<br />
Timminco Ltd 3 868 030 0,19 %<br />
TMX Group Inc 43 592 651 0,40 %<br />
Toromont Industries Ltd 38 793 222 0,46 %<br />
Toronto-Dominion <strong>Bank</strong> 1 828 918 918 0,87 %<br />
Torstar Corp 10 295 991 0,00 %<br />
TransAlta Corp 109 378 099 0,40 %<br />
Transat AT Inc 7 821 296 0,36 %<br />
TransCanada Corp 524 805 793 0,46 %<br />
Transcontinental Inc 13 348 086 0,37 %<br />
Trican Well Service Ltd 23 784 114 0,42 %<br />
Trinidad Drilling Ltd 10 303 824 0,42 %<br />
TriStar Oil and Gas Ltd 40 096 672 0,66 %<br />
Uex Corp 2 461 988 0,36 %<br />
Universal Energy Group Ltd 2 275 043 0,20 %<br />
Uranium One Inc 20 132 507 0,42 %<br />
Uranium Participation Corp 15 382 054 0,52 %<br />
UTS Energy Corp 8 316 156 0,39 %<br />
Viterra Inc 56 721 715 0,44 %<br />
West Fraser Timber Co Ltd 17 258 885 0,24 %<br />
Westaim Corp 487 748 0,38 %<br />
WesternZagros Resources Ltd 18 105 0,00 %<br />
Westport Innovations Inc 19 276 641 0,00 %<br />
Yamana Gold Inc 96 148 456 0,25 %<br />
Zarlink Semiconductor Inc 1 018 773 0,46 %<br />
CAYMAN ISLANDS<br />
Commoditrade Inc 1 051 102 0,52 %<br />
CHILE<br />
Banco de Chile 24 114 932 0,08 %<br />
Banco de Credito e Inversiones 6 351 762 0,05 %<br />
Banco Santander Chile 57 425 787 0,14 %<br />
CAP SA 43 914 367 0,40 %<br />
Centros Comerciales Sudamericanos SA 40 713 872 0,18 %<br />
Cia Cervecerias Unidas SA 34 588 690 0,27 %<br />
Cia de Telecomunicaciones de Chile SA 2 573 472 0,02 %<br />
Cia Sudamericana de Vapores SA 8 240 828 0,23 %<br />
4<br />
GOVERNMENT PENSION FUND <strong>–</strong> GLOBAL ANNUAL REPORT 2008
<strong>Government</strong> <strong>Pension</strong> <strong>Fund</strong> <strong>–</strong> <strong>Global</strong> <strong>Holding</strong> <strong>of</strong> equities at 31 December 2008<br />
Market value<br />
Voting<br />
(per cent)<br />
Colbun SA 44 391 509 0,23 %<br />
CorpBanca SA 3 456 818 0,06 %<br />
Distribucion y Servicio D&S SA 35 323 586 0,19 %<br />
Embotelladora Andina SA 17 938 356 0,00 %<br />
Empresa Nacional de Electricidad SA/Chile 168 491 201 0,08 %<br />
Empresa Nacional de Telecomunicaciones SA 43 281 336 0,24 %<br />
Empresas COPEC SA 117 657 027 0,17 %<br />
Enersis SA 143 579 741 0,09 %<br />
Farmacias Ahumada SA 3 403 737 0,26 %<br />
La Polar SA 27 907 632 1,07 %<br />
Lan Airlines SA 42 980 278 0,21 %<br />
SACI Falabella 49 208 420 0,11 %<br />
Sociedad Quimica y Minera de Chile SA 109 728 095 0,54 %<br />
Sonda SA 4 810 138 0,09 %<br />
CHINA<br />
Advanced Semiconductor Manufacturing Corp 1 432 647 0,98 %<br />
Air China Ltd 36 909 421 0,14 %<br />
AirMedia Group Inc 3 935 740 0,18 %<br />
Aluminum Corp <strong>of</strong> China Ltd 40 562 634 0,08 %<br />
Angang Steel Co Ltd 31 645 784 0,06 %<br />
Anhui Conch Cement Co Ltd 110 249 508 0,20 %<br />
Anhui Expressway Co 6 020 747 0,14 %<br />
Asia Cement China <strong>Holding</strong>s Corp 9 476 578 0,17 %<br />
AviChina Industry & Technology Co 6 059 958 0,14 %<br />
Baidu.com 50 650 237 0,00 %<br />
<strong>Bank</strong> <strong>of</strong> China Ltd 360 927 311 0,07 %<br />
<strong>Bank</strong> <strong>of</strong> Communications Co Ltd 177 528 822 0,07 %<br />
Baoshan Iron & Steel Co Ltd 19 970 355 0,02 %<br />
Baoye Group Co Ltd 38 289 205 3,92 %<br />
Beijing Capital International Airport Co Ltd 45 559 319 0,30 %<br />
Beijing Capital Land Ltd 6 594 128 0,29 %<br />
Beijing Hualian Hypermarket 1 594 092 0,05 %<br />
Beijing Jingkelong Co Ltd 9 772 150 0,97 %<br />
Beijing North Star Co 3 298 040 0,08 %<br />
Beijing Shunxin Agriculture Co 3 929 228 0,08 %<br />
Bengang Steel Plates Co 6 486 775 0,09 %<br />
BOE Technology Group Co Ltd 5 809 905 0,19 %<br />
Byd Co Ltd 130 162 337 0,55 %<br />
BYD Electronic International Co Ltd 4 691 250 0,08 %<br />
Central China Real Estate 19 243 985 1,50 %<br />
Changsha Zoomlion Heavy Industry Science and<br />
Technology Developme 1 604 335 0,01 %<br />
China BlueChemical Ltd 27 518 031 0,21 %<br />
China Citic <strong>Bank</strong> 209 318 131 0,22 %<br />
China Coal Energy Co 108 188 561 0,15 %<br />
China Communications Construction Co Ltd 315 957 642 0,25 %<br />
China Communications Services Corp Ltd 117 464 849 0,46 %<br />
China Construction <strong>Bank</strong> Corp 535 210 943 0,06 %<br />
China COSCO <strong>Holding</strong>s Co Ltd 107 057 916 0,21 %<br />
China CYTS Tours <strong>Holding</strong> Co Ltd 15 170 321 0,47 %<br />
China Dongxiang Group Co 94 631 906 0,98 %<br />
China Eastern Airlines Corp Ltd 9 065 380 0,18 %<br />
China Enterprise Co Ltd 5 320 095 0,08 %<br />
China Fiberglass Co Ltd 2 684 272 0,04 %<br />
China International Marine Containers Co Ltd 17 049 291 0,17 %<br />
China Life Insurance Co Ltd 1 036 563 140 0,17 %<br />
China Medical Technologies Inc 13 329 689 0,29 %<br />
China Merchants <strong>Bank</strong> Co Ltd 168 244 339 0,09 %<br />
China Merchants Property Development Co Ltd 8 358 936 0,07 %<br />
China Minsheng <strong>Bank</strong>ing Corp Ltd 6 632 814 0,01 %<br />
China Molybdenum Co Ltd 45 817 524 0,30 %<br />
China National Building Material Co Ltd 293 841 678 1,58 %<br />
China National Medicines Corp Ltd 2 153 257 0,03 %<br />
China Oilfi eld Services Ltd 40 091 635 0,16 %<br />
China Petroleum & Chemical Corp 316 852 145 0,09 %<br />
China Railway Construction Corp 87 934 576 0,07 %<br />
China Railway Group Ltd 82 190 299 0,08 %<br />
China Railway Tielong Container Logistics Co Ltd 1 567 161 0,03 %<br />
China Resources Microelectronics Ltd 221 0,00 %<br />
China Shenhua Energy Co Ltd 238 227 159 0,08 %<br />
China Shipping Container Lines Co Ltd 21 823 085 0,18 %<br />
China Shipping Development Co Ltd 44 871 009 0,19 %<br />
China South Locomotive and Rolling Stock Corp 5 506 803 0,01 %<br />
China Southern Airlines Co Ltd 8 125 732 0,11 %<br />
China Telecom Corp Ltd 197 047 227 0,09 %<br />
China United Telecommunications Corp Ltd 23 317 943 0,02 %<br />
China Vanke Co Ltd 47 848 810 0,08 %<br />
China Yangtze Power Co A 2 891 968 0,00 %<br />
Chongqing Iron & Steel Co Ltd 4 225 347 0,14 %<br />
Citic Securities Co Ltd/China 12 466 591 0,01 %<br />
CNinsure Inc 63 136 535 0,00 %<br />
CSG <strong>Holding</strong> Co Ltd 14 711 006 0,30 %<br />
Ctrip.com International Ltd 58 060 853 0,52 %<br />
Dalian Port PDA Co Ltd 33 833 093 0,66 %<br />
Dalian Zhangzidao Fishery Group Co Ltd 3 717 361 0,10 %<br />
Daqin Railway Co Ltd 8 637 092 0,01 %<br />
Dashang Group Co Ltd 19 913 826 0,37 %<br />
Datang International Power Generation Co Ltd 67 348 388 0,15 %<br />
Dazhong Transportation Group Co Ltd 13 704 351 0,29 %<br />
Dongfang Electric Corp Ltd 27 216 524 0,18 %<br />
Dongfeng Motor Group Co Ltd 42 436 148 0,22 %<br />
Market value<br />
Voting<br />
(per cent)<br />
Double Coin <strong>Holding</strong>s Ltd 158 0,00 %<br />
Eastcom Peace Smart Card Co Ltd 2 214 185 0,22 %<br />
Financial Street <strong>Holding</strong> Co Ltd 18 916 219 0,10 %<br />
First Tractor Co 6 712 736 0,47 %<br />
Focus Media <strong>Holding</strong> Ltd 11 475 931 0,14 %<br />
Fujian Longxi Bearing Group Co Ltd 7 406 797 0,49 %<br />
Fuyao Group Glass Industries Co Ltd 12 751 311 0,16 %<br />
Golden Meditech Co Ltd 47 432 543 3,25 %<br />
Great Wall Motor Co Ltd 6 331 406 0,24 %<br />
Gree Electric Appliances Inc 21 251 726 0,09 %<br />
Guangdong Electric Power Development Co Ltd 18 071 911 0,30 %<br />
Guangdong Provincial Expressway Development Co Ltd 3 159 483 0,10 %<br />
Guangshen Railway Co Ltd 21 787 732 0,12 %<br />
Guangzhou Baiyun International Airport Co Ltd 1 911 546 0,02 %<br />
Guangzhou Pharmaceutical Co Ltd 4 876 227 0,25 %<br />
Guangzhou R&F Properties Co Ltd 41 030 506 0,16 %<br />
Guangzhou Shipyard International Co Ltd 72 562 073 0,54 %<br />
Hainan Airlines Co Ltd 215 0,00 %<br />
Haitian International <strong>Holding</strong>s Ltd 13 906 263 0,93 %<br />
Hangzhou Steam Turbine Co 15 462 274 0,69 %<br />
Harbin Power Equipment Co Ltd 14 732 978 0,18 %<br />
Henan Shuanghui Investment & Development Co Ltd 4 429 611 0,02 %<br />
Huadian Power International Co 32 385 548 0,32 %<br />
Huaneng Power International Inc 176 881 993 0,16 %<br />
Huangshan Tourism Development Co Ltd 5 690 455 0,20 %<br />
Huaxin Cement Co Ltd 24 084 416 0,57 %<br />
Hunan Huatian Great Hotel Co Ltd 14 367 094 0,73 %<br />
Hunan Non-Ferrous Metal Corp Ltd 14 004 923 0,38 %<br />
Hunan Valin Steel Co Ltd 12 396 207 0,10 %<br />
Industrial & Commercial <strong>Bank</strong> <strong>of</strong> China 926 630 993 0,08 %<br />
Industrial <strong>Bank</strong> Co Ltd 12 704 950 0,02 %<br />
Inner Mongolia Eerduosi Cashmere Products Co Ltd 11 775 099 0,30 %<br />
Inner Mongolia Yitai Coal Co 25 890 644 0,20 %<br />
JA Solar <strong>Holding</strong>s Co Ltd 14 674 417 0,29 %<br />
Jiangsu Expressway Co Ltd 39 735 847 0,15 %<br />
Jiangsu Jiangnan High Polymer Fiber Co Ltd 13 583 923 0,89 %<br />
Jiangsu Kanion Pharmaceutical Co Ltd 4 299 606 0,09 %<br />
Jiangsu Xincheng Real Estate Co Ltd 7 668 454 0,74 %<br />
Jiangxi Copper Co Ltd 26 597 753 0,17 %<br />
Jilin Sino-Microelectronics Co Ltd 10 501 485 0,56 %<br />
Kailuan Clean Coal Co Ltd 20 984 599 0,29 %<br />
Keda Industrial Co Ltd 928 353 0,04 %<br />
Kweichow Moutai Co Ltd 12 338 912 0,01 %<br />
Lianhua Supermarket <strong>Holding</strong>s Co Ltd 8 526 278 0,16 %<br />
Lingbao Gold Co Ltd 3 448 956 0,25 %<br />
Luthai Textile Co Ltd 3 509 815 0,10 %<br />
Mayinglong Pharmaceutical Group Co Ltd 4 395 777 0,19 %<br />
Memtech International Ltd 158 449 0,08 %<br />
Mindray Medical International Ltd 81 765 762 0,86 %<br />
Maanshan Iron & Steel 15 684 661 0,08 %<br />
Netease.com 114 930 159 0,61 %<br />
Neus<strong>of</strong>t Corp 4 378 873 0,04 %<br />
New Oriental Education & Technology Group 68 861 319 0,12 %<br />
Ningbo Donly Transmission Equipment Co Ltd 1 972 328 0,12 %<br />
Offshore Oil Engineering Co Ltd 4 973 396 0,01 %<br />
PetroChina Co Ltd 826 890 437 0,06 %<br />
PICC Property & Casualty Co Ltd 63 249 141 0,48 %<br />
Ping An Insurance Group Co <strong>of</strong> China Ltd 354 496 573 0,14 %<br />
Qingdao Haier Co Ltd 7 090 075 0,06 %<br />
Qinghai Salt Lake Potash A 4 271 829 0,01 %<br />
Renhe Commercial <strong>Holding</strong>s Co Ltd 53 304 934 0,25 %<br />
SAIC Motor Corp Ltd 7 072 807 0,02 %<br />
Shandong Chenming Paper <strong>Holding</strong>s Ltd 92 105 366 1,56 %<br />
Shandong Dong-E E-Jiao-A 3 904 992 0,05 %<br />
Shandong Gold Mining Co Ltd 7 295 497 0,04 %<br />
Shandong Pharmaceutical Glass Co Ltd 22 620 770 0,90 %<br />
Shandong Weigao Group Medical Polymer Co Ltd 254 996 349 2,41 %<br />
Shanghai Bailian Group Co 2 466 218 0,03 %<br />
Shanghai Electric Group Co Ltd 90 077 460 0,25 %<br />
Shanghai Forte Land Co 4 373 679 0,15 %<br />
Shanghai Fosun Pharmaceutical Group Co Ltd 7 461 894 0,06 %<br />
Shanghai International Airport Co Ltd 13 089 086 0,06 %<br />
Shanghai International Port Group Co Ltd 3 213 454 0,00 %<br />
Shanghai Jinfeng Wine Co Ltd 5 330 454 0,13 %<br />
Shanghai Kehua Bio-Engineering Co Ltd 5 592 830 0,07 %<br />
Shanghai Lujiazui Finance & Trade Zone Development Co Ltd 12 042 068 0,10 %<br />
Shanghai Mechanical and Electrical Industry Co Ltd 4 552 254 0,11 %<br />
Shanghai New World Co Ltd 2 185 675 0,06 %<br />
Shanghai Pudong Development <strong>Bank</strong> 2 175 649 0,00 %<br />
Shanghai Tunnel Engineering Co Ltd 6 897 361 0,08 %<br />
Shanghai Zhangjiang High-Tech Park Development Co Ltd 18 264 126 0,12 %<br />
Shanghai Zhenhua Port Machinery Co 27 417 041 0,17 %<br />
Shanghai Zhixin Electric Co Ltd 3 648 863 0,04 %<br />
Shanxi Luan Environmental Energy Development Co Ltd 14 361 484 0,10 %<br />
Shenyang Chemical Industry 1 439 221 0,05 %<br />
Shenzhen Agricultural Products Co Ltd 4 951 554 0,07 %<br />
Shenzhen Chiwan Wharf <strong>Holding</strong>s Ltd 2 548 428 0,07 %<br />
Shenzhen Expressway Co Ltd 9 774 065 0,18 %<br />
Shenzhen Fiyta <strong>Holding</strong>s Ltd 2 428 927 0,20 %<br />
Sinopec Shanghai Petrochemical Co Ltd 21 129 064 0,16 %<br />
Sinopec Yizheng Chemical Fibre Co Ltd 5 199 670 0,16 %<br />
5<br />
GOVERNMENT PENSION FUND <strong>–</strong> GLOBAL ANNUAL REPORT 2008
<strong>Government</strong> <strong>Pension</strong> <strong>Fund</strong> <strong>–</strong> <strong>Global</strong> <strong>Holding</strong> <strong>of</strong> equities at 31 December 2008<br />
Market value<br />
Voting<br />
(per cent)<br />
Sinotrans Ltd 80 873 523 1,40 %<br />
Suning Appliance Co Ltd 10 711 938 0,02 %<br />
Suzhou New District Hi-Tech Industrial Co Ltd 6 927 656 0,25 %<br />
TBEA Co Ltd 11 140 857 0,04 %<br />
Tianjin Capital Environmental Protection Group Co Ltd 5 001 701 0,29 %<br />
Tianjin Port Co Ltd 1 605 194 0,01 %<br />
Tong Ren Tang Technologies Co Ltd 37 344 443 3,33 %<br />
Travelsky Technology Ltd 53 369 623 0,98 %<br />
Tsingtao Brewery Co Ltd 23 681 485 0,12 %<br />
Uni-President China <strong>Holding</strong>s Ltd 16 342 019 0,25 %<br />
Want Want China <strong>Holding</strong>s Ltd 172 558 913 0,45 %<br />
Weichai Power Co Ltd 113 049 682 1,03 %<br />
Weihai Guangtai Airport Equipment Co Ltd 2 364 713 0,12 %<br />
Weiqiao Textile Co 6 745 767 0,23 %<br />
Wuhan Zhongbai Group Co Ltd 5 924 838 0,11 %<br />
Wuliangye Yibin Co Ltd 9 214 167 0,02 %<br />
Xiamen International Port Co Ltd 3 541 218 0,16 %<br />
Xiamen King Long Motor Co Ltd 1 694 999 0,08 %<br />
Xinhua Finance Media Ltd 1 345 704 0,43 %<br />
Xining Special Steel Co 6 700 923 0,21 %<br />
Xinjiang Chalkis Co Ltd 2 208 450 0,10 %<br />
Xinjiang Guanghui Industry Co Ltd 3 743 758 0,05 %<br />
Xinjiang Joinworld Co Ltd 2 659 424 0,09 %<br />
Yantai Changyu Pioneer Wine Co 23 947 657 0,18 %<br />
Yantai North Andre Juice Co 36 433 693 3,15 %<br />
Yantai Wanhua Polyurethanes Co Ltd 16 653 350 0,10 %<br />
Yanzhou Coal Mining Co Ltd 39 707 261 0,16 %<br />
Yueyang Paper Co Ltd 1 413 648 0,04 %<br />
Yunnan Baiyao Group Co Ltd 8 077 975 0,04 %<br />
Yunnan Yunwei Co Ltd 7 483 546 0,26 %<br />
Zhaojin Mining Industry Co Ltd 181 988 466 2,30 %<br />
Zhejiang Expressway Co Ltd 70 341 616 0,39 %<br />
Zhejiang Guyuelongshan 3 505 449 0,13 %<br />
Zhengzhou Yutong Bus Co Ltd 12 630 002 0,26 %<br />
Zhong An Real Estate Ltd 7 001 838 0,30 %<br />
Zhuzhou CSR Times Electric Co Ltd 20 328 153 0,33 %<br />
Zijin Mining Group Co Ltd 193 471 071 0,31 %<br />
ZTE Corp 60 203 435 0,24 %<br />
CYPRUS<br />
<strong>Bank</strong> <strong>of</strong> Cyprus Public Co Ltd 418 404 0,00 %<br />
CZECH REPUBLIC<br />
CEZ 1 489 336 648 0,88 %<br />
Komercni <strong>Bank</strong>a AS 204 282 263 0,50 %<br />
Philip Morris CR AS 19 019 853 0,46 %<br />
Telefonica O2 Czech Republic AS 235 957 614 0,48 %<br />
Unipetrol 46 587 002 0,47 %<br />
Zentiva NV 74 121 099 0,50 %<br />
DENMARK<br />
A P Moller - Maersk AS 960 079 296 0,60 %<br />
ALK-Abello AS 45 956 236 0,73 %<br />
Alm Brand AS 9 620 556 0,62 %<br />
Amagerbanken AS 2 882 745 1,02 %<br />
Auriga Industries 12 183 147 0,57 %<br />
Bang & Olufsen AS 10 546 034 1,24 %<br />
Bavarian Nordic AS 7 143 723 0,53 %<br />
Carlsberg AS 247 001 601 0,24 %<br />
Coloplast AS 173 595 900 0,86 %<br />
D/S Norden 35 217 997 0,33 %<br />
D/S Torm AS 52 460 801 0,97 %<br />
Danisco AS 164 289 058 1,20 %<br />
Danske <strong>Bank</strong> AS 579 262 096 1,22 %<br />
Dfds AS 20 043 380 0,48 %<br />
DSV AS 189 762 041 1,35 %<br />
East Asiatic Co Ltd AS 50 189 577 1,54 %<br />
EBH <strong>Bank</strong> AS 2 204 0,38 %<br />
FLSmidth & Co AS 148 677 072 1,18 %<br />
Genmab AS 97 024 327 0,82 %<br />
GN Store Nord 34 007 581 1,22 %<br />
H Lundbeck AS 170 739 369 0,60 %<br />
IC Companys AS 5 863 838 0,59 %<br />
Jyske <strong>Bank</strong> AS 111 441 403 1,33 %<br />
NKT <strong>Holding</strong> AS 34 033 242 1,04 %<br />
Nordicom AS 727 377 0,26 %<br />
Novo Nordisk AS 2 464 556 574 1,32 %<br />
Novozymes AS 269 195 796 0,91 %<br />
Ringkjoebing Landbobank AS 7 392 857 0,36 %<br />
Rockwool International AS 11 006 942 0,32 %<br />
Roskilde <strong>Bank</strong> 51 655 0,90 %<br />
Royal UNIBREW AS 6 434 034 0,74 %<br />
Schouw & Co 15 275 226 0,52 %<br />
SimCorp AS 44 171 173 1,16 %<br />
Sjaelso Gruppen 5 530 562 0,79 %<br />
Spar Nord <strong>Bank</strong> AS 19 038 176 0,60 %<br />
Sydbank AS 73 686 389 1,30 %<br />
Topdanmark AS 196 475 633 1,40 %<br />
Trigon Agri AS 1 383 098 0,22 %<br />
TrygVesta AS 81 819 364 0,28 %<br />
Vestas Wind Systems AS 880 635 899 1,20 %<br />
William Demant <strong>Holding</strong> 73 193 387 0,43 %<br />
EGYPT<br />
Market value<br />
Voting<br />
(per cent)<br />
Alexandria Mineral Oils Co 7 527 070 0,14 %<br />
Arab Cotton Ginning 11 849 142 1,00 %<br />
Asek Co for Mining 4 312 730 0,05 %<br />
Commercial International <strong>Bank</strong> 68 949 179 0,50 %<br />
Delta Sugar Co 3 199 002 0,11 %<br />
Egyptian Co for Mobile Services 40 178 556 0,22 %<br />
Egyptian Financial & Industrial Co 11 783 284 0,53 %<br />
Egyptian Financial Group-Hermes <strong>Holding</strong> 29 982 795 0,35 %<br />
Egyptian for Tourism Resorts 13 138 143 0,55 %<br />
Egyptian Kuwaiti <strong>Holding</strong> Co 7 945 354 0,11 %<br />
El Ezz Steel Co 19 635 075 0,28 %<br />
ElSwedy Cables <strong>Holding</strong> Co 24 897 888 0,18 %<br />
Heliopolis Housing 8 102 466 0,32 %<br />
Housing & Development <strong>Bank</strong> 4 937 478 0,24 %<br />
Medinet Nasr Housing 11 845 184 0,33 %<br />
Nile Cotton Ginning 7 627 848 0,92 %<br />
Olympic Group Financial Investments 1 758 271 0,10 %<br />
Orascom Construction Industries 85 208 724 0,22 %<br />
Orascom Telecom <strong>Holding</strong> SAE 151 117 192 0,00 %<br />
Oriental Weavers 3 789 762 0,17 %<br />
Sidi Kerir Petrochemcials Co 9 154 076 0,13 %<br />
Six <strong>of</strong> October Development & Investment 7 909 518 0,52 %<br />
South Valley Cement 23 432 286 0,68 %<br />
Talaat Moustafa Group 29 633 926 0,38 %<br />
Telecom Egypt 35 083 645 0,10 %<br />
FINLAND<br />
Ahlstrom OYJ 12 597 864 0,42 %<br />
Alma Media 36 235 654 1,01 %<br />
Amer Sports OYJ 42 852 916 1,12 %<br />
Cargotec Corp 42 785 417 0,99 %<br />
Citycon Oyj 30 321 709 0,84 %<br />
Cramo OYJ 12 436 519 0,91 %<br />
Elektrobit Corp 1 643 416 0,40 %<br />
Elisa OYJ 315 123 744 1,58 %<br />
Finnair OYJ 37 667 040 0,62 %<br />
Finnlines OYJ 108 595 952 4,25 %<br />
Fortum Oyj 1 071 507 645 0,81 %<br />
F-Secure Oyj 12 058 048 0,42 %<br />
HKScan Oyj 8 985 420 0,62 %<br />
Huhtamaki Oyj 55 753 706 1,23 %<br />
Kemira OYJ 45 814 084 0,63 %<br />
Kesko OYJ 148 411 135 1,30 %<br />
Kone OYJ 290 231 828 0,88 %<br />
Konecranes Oyj 95 026 110 1,32 %<br />
Lassila & Tikanoja Oyj 28 138 651 0,68 %<br />
Lemminkainen Oyj 10 021 813 0,46 %<br />
Metso Oyj 197 368 190 1,68 %<br />
M-real OYJ 165 619 227 2,42 %<br />
Neste Oil OYJ 141 179 026 0,54 %<br />
Nokia OYJ 4 927 631 372 1,15 %<br />
Nokian Renkaat OYJ 105 968 112 1,10 %<br />
Oriola-KD OYJ 8 826 946 0,49 %<br />
Orion Oyj 124 088 384 0,09 %<br />
Outokumpu OYJ 119 313 265 0,82 %<br />
Outotec Oyj 160 064 555 3,63 %<br />
Pohjola <strong>Bank</strong> PLC 146 901 780 0,97 %<br />
Poyry Oyj 34 124 419 0,76 %<br />
Ramirent Oyj 30 268 633 0,88 %<br />
Rautaruukki OYJ 142 234 648 0,86 %<br />
Ruukki Group Oyj 33 100 173 1,02 %<br />
Sampo Oyj 1 497 584 808 2,04 %<br />
Sanoma Oyj 47 934 487 0,33 %<br />
Sponda OYJ 31 171 506 0,93 %<br />
Stockmann Oyj Abp 29 901 183 0,90 %<br />
Stora Enso Oyj 1 251 406 087 0,49 %<br />
Tietoenator Oyj 68 337 320 1,25 %<br />
UPM-Kymmene Oyj 2 629 620 895 5,77 %<br />
Uponor Oyj 66 216 450 1,21 %<br />
Vacon Plc 24 616 915 0,90 %<br />
Vaisala Oyj 8 225 474 0,26 %<br />
Wartsila Oyj 387 441 612 1,92 %<br />
YIT OYJ 78 405 387 1,38 %<br />
FRANCE<br />
Accor SA 1 015 473 420 1,32 %<br />
Aeroports de Paris 164 060 973 0,35 %<br />
Air France-KLM 160 765 356 0,60 %<br />
Air Liquide SA 1 899 195 165 1,14 %<br />
Alcatel-Lucent 389 437 567 1,05 %<br />
Alstom SA 1 394 180 960 1,20 %<br />
Alten Ltd 44 745 424 0,95 %<br />
Altran Technologies SA 34 304 512 0,91 %<br />
April Group 146 883 388 2,04 %<br />
ArcelorMittal 2 235 564 558 0,93 %<br />
Areva SA 94 295 922 0,00 %<br />
Arkema SA 88 714 629 1,22 %<br />
Assystem 8 700 441 0,78 %<br />
Atos Origin SA 137 854 649 1,13 %<br />
AXA SA 4 169 503 146 1,29 %<br />
Beneteau SA 32 219 662 0,56 %<br />
BioMerieux 132 567 724 0,58 %<br />
BNP Paribas 3 778 244 143 1,41 %<br />
6<br />
GOVERNMENT PENSION FUND <strong>–</strong> GLOBAL ANNUAL REPORT 2008
<strong>Government</strong> <strong>Pension</strong> <strong>Fund</strong> <strong>–</strong> <strong>Global</strong> <strong>Holding</strong> <strong>of</strong> equities at 31 December 2008<br />
Market value<br />
Voting<br />
(per cent)<br />
Boiron SA 6 710 828 0,18 %<br />
Bollore 97 216 000 0,48 %<br />
Bonduelle S.C.A. 21 808 161 0,48 %<br />
Bongrain SA 17 698 122 0,25 %<br />
Bourbon SA 125 175 244 1,29 %<br />
Boursorama 7 841 551 0,20 %<br />
Bouygues 1 142 209 082 1,13 %<br />
Bull SA 12 057 638 1,11 %<br />
Bureau Veritas SA 136 421 887 0,45 %<br />
CA Nord de France CCI 43 353 0,00 %<br />
Canal + 30 816 392 0,61 %<br />
Cap Gemini SA 456 882 089 1,17 %<br />
Carbone Lorraine 33 021 269 1,33 %<br />
Carrefour SA 2 505 847 419 1,33 %<br />
Casino Guichard Perrachon SA 251 553 277 0,49 %<br />
Christian Dior SA 999 818 093 1,40 %<br />
Cie de Saint-Gobain 1 510 767 008 1,21 %<br />
Cie Generale de Geophysique-Veritas 162 958 335 1,05 %<br />
Cie Generale dOptique Essilor International SA 809 739 683 1,18 %<br />
Ciments Francais SA 89 796 845 0,42 %<br />
Club Mediterranee 47 957 014 2,12 %<br />
CNP Assurances 416 671 855 0,56 %<br />
Compagnie des Alpes 6 621 881 0,16 %<br />
Compagnie Generale des Etablissements Michelin 580 518 278 1,09 %<br />
Credit Agricole SA 1 159 503 770 0,67 %<br />
Dassault Systemes SA 217 435 293 0,58 %<br />
Delachaux SA 155 803 330 2,79 %<br />
Derichebourg SA 29 961 730 1,12 %<br />
EDF 1 531 950 455 0,21 %<br />
EDF Energies Nouvelles SA 86 785 546 0,46 %<br />
Eiffage SA 306 295 703 0,92 %<br />
Eramet 151 142 600 0,43 %<br />
Esso SA Francaise 21 181 516 0,24 %<br />
Etablissements Maurel et Prom 120 554 380 1,26 %<br />
Etam Developpement SA 9 119 248 1,11 %<br />
Euler Hermes SA 210 195 957 1,37 %<br />
Eurazeo 111 321 310 0,62 %<br />
Euro Disney SCA 5 994 920 0,44 %<br />
Eur<strong>of</strong>i ns Scientifi c 25 893 169 0,53 %<br />
Eutelsat Communications 294 343 614 0,81 %<br />
Faiveley SA 32 809 106 0,49 %<br />
Faurecia 6 706 148 0,29 %<br />
Fimalac 28 370 100 0,42 %<br />
Fonciere Des Regions 135 958 027 0,69 %<br />
France Telecom SA 3 890 168 946 0,77 %<br />
GameL<strong>of</strong>t 45 618 163 4,25 %<br />
GDF Suez 5 704 851 133 0,76 %<br />
Gecina SA 114 499 146 0,38 %<br />
Gemalto NV 203 699 445 1,33 %<br />
Generale de Sante 8 865 414 0,13 %<br />
GFI Informatique 10 784 453 0,79 %<br />
GL Events 9 863 045 0,44 %<br />
Groupe Danone 3 007 822 674 1,39 %<br />
Groupe Eurotunnel SA 108 633 927 1,14 %<br />
Groupe Partouche 3 595 115 0,31 %<br />
Groupe Steria SCA 21 072 866 0,95 %<br />
Guerbet 9 450 207 0,30 %<br />
Guyenne et Gascogne SA 29 525 155 0,73 %<br />
Haulotte Group 7 541 929 0,53 %<br />
Havas SA 78 399 745 1,28 %<br />
Hermes International 943 541 269 0,92 %<br />
Iliad SA 192 515 481 0,59 %<br />
Imerys SA 70 655 955 0,35 %<br />
IMS-Intl Metal Service 21 392 502 1,32 %<br />
Ingenico 38 547 372 0,75 %<br />
Ipsen SA 198 419 301 0,87 %<br />
IPSOS 58 860 567 0,93 %<br />
JC Decaux SA 93 085 025 0,35 %<br />
Kaufman & Broad SA 7 132 091 0,41 %<br />
Klepierre 174 043 939 0,61 %<br />
Lafarge SA 618 052 861 0,75 %<br />
Lagardere SCA 418 343 585 1,13 %<br />
Laurent-Perrier 102 662 709 3,01 %<br />
Legrand SA 169 377 769 0,48 %<br />
LISI 14 169 836 0,55 %<br />
LOreal SA 2 034 888 874 0,56 %<br />
LVMH Moet Hennessy Louis Vuitton SA 1 284 546 856 0,56 %<br />
M6-Metropole Television 168 690 318 0,97 %<br />
Maisons France Confort 14 321 390 1,81 %<br />
Manitou BF SA 14 349 228 0,48 %<br />
Meetic 9 455 278 0,56 %<br />
Mercialys SA 84 436 073 0,51 %<br />
Natixis 128 874 958 0,36 %<br />
Neopost SA 247 346 897 1,26 %<br />
Nexans SA 142 780 507 1,23 %<br />
Nexity 58 532 991 1,03 %<br />
NicOx SA 47 840 059 1,34 %<br />
Norbert Dentressangle 11 707 664 0,44 %<br />
NRJ Group 13 654 706 0,31 %<br />
Orco Property Group 12 558 201 1,82 %<br />
Orpea 49 549 716 0,53 %<br />
Market value<br />
Voting<br />
(per cent)<br />
Outremer Telecom 1 640 572 0,20 %<br />
PagesJaunes Groupe 73 412 996 0,38 %<br />
Parrot SA 5 352 128 0,96 %<br />
Pernod-Ricard SA 1 002 325 304 0,88 %<br />
Peugeot SA 261 613 785 0,95 %<br />
Pierre & Vacances 19 324 298 0,59 %<br />
Plastic Omnium SA 5 695 334 0,43 %<br />
Poweo 8 748 141 0,81 %<br />
PPR 553 096 437 0,96 %<br />
Publicis Groupe 196 012 354 0,56 %<br />
Rallye SA 36 854 662 0,56 %<br />
Recylex SA 6 534 201 1,13 %<br />
Remy Cointreau SA 76 970 221 0,56 %<br />
Renault SA 568 975 294 1,11 %<br />
Rexel SA 27 659 393 0,23 %<br />
Rhodia SA 59 661 639 1,35 %<br />
Rodriguez Group 1 511 566 0,90 %<br />
Rubis 30 754 711 0,68 %<br />
Sa des Ciments Vicat 32 283 860 0,20 %<br />
Saft Groupe SA 46 879 435 1,35 %<br />
San<strong>of</strong>i -Aventis SA 6 172 282 861 0,98 %<br />
Schneider Electric SA 1 522 007 788 1,19 %<br />
SCOR SE 555 802 115 1,89 %<br />
SEB SA 80 059 865 0,75 %<br />
Seche Environnement SA 27 158 931 0,73 %<br />
Sechilienne-Sidec 117 124 412 1,35 %<br />
SeLoger.com 14 403 055 0,85 %<br />
Sequana 8 783 410 0,42 %<br />
SES SA 585 099 453 1,31 %<br />
Societe BIC SA 175 956 398 0,90 %<br />
Societe de la Tour Eiffel 19 581 393 1,15 %<br />
Societe Des Autoroutes Paris-Rhin-Rhone 125 546 362 0,23 %<br />
Societe Fonciere Financiere et de Participations FFP 16 484 041 0,29 %<br />
Societe Generale 2 759 814 149 1,36 %<br />
Societe Immobiliere de Location pour lIndustrie et le<br />
Commerce 108 383 234 0,96 %<br />
Societe Television Francaise 1 116 027 953 0,54 %<br />
Sodexo 588 856 341 0,97 %<br />
SOITEC 39 662 038 1,51 %<br />
Sopra Group SA 14 253 675 0,50 %<br />
Sperian Protection 16 723 273 0,50 %<br />
Spir Communication 4 022 513 0,33 %<br />
Stallergenes 39 071 449 0,81 %<br />
STMicroelectronics NV 357 502 949 0,84 %<br />
Suez Environnement SA 410 518 382 0,71 %<br />
Synergie SA 4 709 843 0,34 %<br />
Technip SA 429 398 286 1,85 %<br />
Teleperformance 140 667 352 1,29 %<br />
Theolia SA 16 298 557 1,41 %<br />
Thomson 42 926 768 1,70 %<br />
Total SA 11 313 967 564 1,26 %<br />
Trigano SA 3 484 619 0,38 %<br />
UBISOFT Entertainment 223 492 295 1,76 %<br />
Unibail-Rodamco 1 123 111 277 1,32 %<br />
Union Financiere de France BQE SA 7 495 886 0,23 %<br />
Uniross Batteries SAS 612 656 0,75 %<br />
Valeo SA 94 364 552 1,17 %<br />
Vallourec 564 521 487 1,33 %<br />
Veolia Environnement 1 424 825 739 1,40 %<br />
Vilmorin & Cie 96 303 937 1,01 %<br />
Vinci SA 1 991 777 778 1,38 %<br />
Virbac SA 31 707 282 0,65 %<br />
Vivendi 3 363 146 261 1,27 %<br />
Wendel 108 256 604 0,62 %<br />
Zodiac SA 136 035 105 0,97 %<br />
GEORGIA<br />
<strong>Bank</strong> <strong>of</strong> Georgia JSC 3 649 677 0,40 %<br />
GERMANY<br />
Adidas AG 907 752 928 1,73 %<br />
Air Berlin PLC 25 982 582 0,86 %<br />
Aixtron AG 54 982 701 1,32 %<br />
Allianz SE 4 688 033 520 1,42 %<br />
AMB Generali <strong>Holding</strong> AG 69 833 245 0,18 %<br />
Arcandor AG 35 806 479 0,47 %<br />
Arques Industries AG 8 458 156 1,30 %<br />
AWD <strong>Holding</strong> AG 4 031 453 0,04 %<br />
Balda AG 623 777 0,23 %<br />
BASF SE 3 181 040 719 1,28 %<br />
Bauer AG 59 724 166 1,22 %<br />
Bayer AG 4 248 950 518 1,38 %<br />
Bayerische Motoren Werke AG 593 103 676 0,06 %<br />
BayWa AG 44 638 802 0,54 %<br />
Bechtle AG 27 225 630 0,97 %<br />
Beiersdorf AG 329 644 780 0,32 %<br />
Bilfi nger Berger AG 135 385 284 1,00 %<br />
Carl Zeiss Meditec AG 19 121 552 0,28 %<br />
CAT Oil AG 3 426 249 0,35 %<br />
Celesio AG 182 796 812 0,57 %<br />
Centrotherm Photovoltaics AG 27 207 800 0,87 %<br />
Colonia Real Estate AG 6 259 267 0,99 %<br />
Comdirect <strong>Bank</strong> AG 19 073 835 0,22 %<br />
7<br />
GOVERNMENT PENSION FUND <strong>–</strong> GLOBAL ANNUAL REPORT 2008
<strong>Government</strong> <strong>Pension</strong> <strong>Fund</strong> <strong>–</strong> <strong>Global</strong> <strong>Holding</strong> <strong>of</strong> equities at 31 December 2008<br />
Market value<br />
Voting<br />
(per cent)<br />
Commerzbank AG 636 582 720 1,36 %<br />
Conergy AG 48 647 410 1,26 %<br />
Continental AG 1 082 316 289 0,50 %<br />
CropEnergies AG 6 261 199 0,26 %<br />
CTS Eventim AG 19 549 217 0,35 %<br />
DAB <strong>Bank</strong> AG 4 799 633 0,26 %<br />
Daimler AG 2 777 094 758 1,11 %<br />
Demag Cranes AG 48 337 810 1,25 %<br />
Deutsche <strong>Bank</strong> AG 1 933 009 054 1,25 %<br />
Deutsche Beteiligungs AG 21 190 722 1,30 %<br />
Deutsche Boerse AG 1 840 852 658 1,97 %<br />
Deutsche Euroshop AG 109 247 407 1,34 %<br />
Deutsche Lufthansa AG 344 975 688 0,69 %<br />
Deutsche Post AG 1 321 458 144 0,94 %<br />
Deutsche Postbank AG 161 915 092 0,49 %<br />
Deutsche Telekom AG 5 532 984 105 1,20 %<br />
Deutsche Wohnen AG 20 463 000 0,84 %<br />
Deutz AG 34 422 767 1,23 %<br />
DIC Asset AG 16 680 906 0,88 %<br />
Douglas <strong>Holding</strong> AG 162 091 937 1,32 %<br />
Draegerwerk AG & Co KGaA 15 774 512 0,00 %<br />
Duerr AG 8 679 177 0,42 %<br />
Dyckerh<strong>of</strong>f AG 7 358 401 0,00 %<br />
E.ON AG 9 089 589 165 1,64 %<br />
ElringKlinger AG 49 174 005 1,26 %<br />
EM.Sport Media AG 15 278 923 0,81 %<br />
Epcos AG 4 263 200 0,04 %<br />
Escada AG 3 555 930 0,52 %<br />
Fielmann AG 79 061 466 0,42 %<br />
Fraport AG Frankfurt Airport Services Worldwide 128 526 322 0,47 %<br />
Freenet AG 42 136 962 0,81 %<br />
Fresenius Medical Care AG & Co KGaA 868 537 913 0,91 %<br />
Fresenius SE 1 070 491 586 1,07 %<br />
Fuchs Petrolub AG 108 014 998 1,21 %<br />
GAGFAH SA 21 983 533 0,25 %<br />
GEA Group AG 578 669 510 2,66 %<br />
Gerresheimer AG 27 748 580 0,47 %<br />
Gerry Weber International AG 40 090 447 0,87 %<br />
GFK AG 26 163 707 0,34 %<br />
Gildemeister AG 49 527 091 1,50 %<br />
GPC Biotech AG 2 910 526 0,76 %<br />
Grenkeleasing AG 8 845 964 0,37 %<br />
H&R WASAG AG 23 613 358 0,74 %<br />
Hamburger Hafen und Logistik AG 68 093 472 0,41 %<br />
Hannover Rueckversicherung AG 114 122 131 0,43 %<br />
HeidelbergCement AG 62 499 425 0,16 %<br />
Heidelberger Druckmaschinen AG 51 876 874 1,13 %<br />
Henkel AG & Co KGaA 1 020 688 292 0,60 %<br />
Hochtief AG 274 556 178 1,13 %<br />
Hugo Boss AG 36 626 182 0,02 %<br />
Hypo Real Estate <strong>Holding</strong> AG 75 143 086 1,20 %<br />
IDS Scheer AG 8 135 184 0,43 %<br />
IKB Deutsche Industriebank AG 9 597 989 0,97 %<br />
Indus <strong>Holding</strong> AG 12 815 772 0,53 %<br />
Infi neon Technologies AG 75 317 300 1,08 %<br />
Interseroh SE 17 497 111 0,51 %<br />
IVG Immobilien AG 71 261 942 1,10 %<br />
Jenoptik AG 19 549 614 0,77 %<br />
Jungheinrich AG 16 709 140 0,00 %<br />
K+S AG 775 131 820 1,21 %<br />
Kizoo AG 9 337 485 0,59 %<br />
Kloeckner & Co SE 71 982 712 1,29 %<br />
Kloeckner-Werke AG 12 645 713 0,14 %<br />
Koenig & Bauer AG 10 817 400 0,69 %<br />
Kontron AG 43 601 789 1,21 %<br />
Krones AG 65 246 449 0,68 %<br />
KUKA AG 47 058 252 1,43 %<br />
Lanxess AG 129 971 848 1,17 %<br />
Leoni AG 59 980 470 1,60 %<br />
Linde AG 1 386 574 272 1,41 %<br />
MAN AG 894 370 548 1,68 %<br />
Manz Automation AG 19 885 018 1,09 %<br />
Medion AG 23 707 139 0,80 %<br />
Merck KGAA 480 643 502 1,18 %<br />
Metro AG 466 060 459 0,52 %<br />
MLP AG 94 960 913 0,92 %<br />
MPC Muenchmeyer Petersen Capital AG 4 608 336 0,44 %<br />
MTU Aero Engines <strong>Holding</strong> AG 96 537 951 0,97 %<br />
Muenchener Rueckversicherungs AG 2 674 970 946 1,20 %<br />
MVV Energie AG 38 698 565 0,19 %<br />
Norddeutsche Affi nerie AG 138 245 452 1,24 %<br />
Nordex AG 39 034 307 0,60 %<br />
Patrizia Immobilien AG 6 030 215 0,73 %<br />
Pfeiffer Vacuum Technology AG 47 072 337 1,15 %<br />
Pfl eiderer AG 14 669 880 0,43 %<br />
Phoenix Solar AG 23 668 437 1,45 %<br />
Porsche Automobil <strong>Holding</strong> SE 528 723 900 0,00 %<br />
Praktiker Bau- und Heimwerkermaerkte AG 63 593 824 1,44 %<br />
Premiere AG 47 947 699 1,18 %<br />
ProSiebenSat.1 Media AG 82 335 454 0,00 %<br />
Puma AG Rudolf Dassler Sport 104 488 552 0,48 %<br />
Market value<br />
Voting<br />
(per cent)<br />
Q-Cells SE 122 143 078 0,60 %<br />
Qiagen NV 242 392 199 1,02 %<br />
QSC AG 13 025 707 0,79 %<br />
Rational AG 43 946 322 0,47 %<br />
Rheinmetall AG 42 742 417 0,53 %<br />
Rhoen Klinikum AG 296 257 409 1,72 %<br />
RWE AG 3 504 679 584 1,02 %<br />
Salzgitter AG 301 443 710 0,94 %<br />
SAP AG 2 903 862 462 0,96 %<br />
Sartorius AG 5 245 048 0,00 %<br />
SGL Carbon AG 191 071 792 1,27 %<br />
Siemens AG 6 267 179 388 1,34 %<br />
Singulus Technologies 13 395 199 1,06 %<br />
Sixt AG 22 479 556 0,69 %<br />
SMA Solar Technology AG 59 125 602 0,47 %<br />
S<strong>of</strong>tware AG 108 344 146 0,97 %<br />
Solar Millennium AG 2 867 171 0,20 %<br />
Solarworld AG 147 960 035 0,90 %<br />
Solon SE 24 749 954 1,41 %<br />
Stada Arzneimittel AG 159 789 448 1,36 %<br />
Suedzucker AG 75 704 278 0,38 %<br />
Symrise AG 152 543 242 1,33 %<br />
Takkt AG 11 814 711 0,21 %<br />
Telegate AG 4 776 138 0,38 %<br />
Thielert AG 525 417 0,73 %<br />
ThyssenKrupp AG 859 578 418 0,91 %<br />
Tognum AG 111 733 076 0,97 %<br />
TUI AG 236 701 962 1,20 %<br />
United Internet AG 103 512 287 0,67 %<br />
Vivacon AG 7 544 235 1,00 %<br />
Volkswagen AG 2 618 613 452 0,15 %<br />
Vossloh AG 115 024 082 1,00 %<br />
Wacker Chemie AG 136 765 172 0,36 %<br />
Wincor Nixdorf AG 135 532 779 1,25 %<br />
Wirecard AG 40 321 936 0,99 %<br />
Aareal <strong>Bank</strong> AG 31 253 375 1,31 %<br />
GREECE<br />
Aegean Marine Petroleum Network Inc 74 732 909 1,48 %<br />
Agricultural <strong>Bank</strong> <strong>of</strong> Greece 30 301 531 0,25 %<br />
Alapis <strong>Holding</strong> Industrial and Commercial SA <strong>of</strong><br />
Pharmaceutical Che 53 020 345 1,03 %<br />
Alpha <strong>Bank</strong> AE 311 938 523 1,16 %<br />
Anek Lines SA 9 950 024 0,79 %<br />
Astir Palace Hotel SA 3 434 768 0,16 %<br />
Athens Medical Center SA 4 869 255 0,48 %<br />
Athens Water Supply & Sewage Co SA/The 18 755 398 0,35 %<br />
Attica <strong>Holding</strong>s SA 3 963 226 0,08 %<br />
Babis Vovos International Construction SA 88 068 597 2,98 %<br />
<strong>Bank</strong> <strong>of</strong> Attica 8 131 041 0,21 %<br />
Coca Cola Hellenic Bottling Co SA 103 928 239 0,28 %<br />
EFG Eurobank Ergasias SA 235 197 613 0,80 %<br />
Ellaktor SA 117 515 212 1,59 %<br />
Elval Aluminium Process Co 2 846 669 0,27 %<br />
Emporiki <strong>Bank</strong> SA 18 414 414 0,25 %<br />
Eurobank Properties Real Estate Investment Co 11 278 791 0,00 %<br />
Folli - Follie SA 17 899 486 0,96 %<br />
Forthnet SA 52 867 114 4,92 %<br />
Fourlis <strong>Holding</strong>s SA 71 275 619 2,87 %<br />
Frigoglass SA 7 797 103 0,59 %<br />
GEK Terna SA 47 752 195 2,24 %<br />
Geniki <strong>Bank</strong> 7 237 177 0,42 %<br />
Halcor SA 3 179 100 0,43 %<br />
Hellenic Duty Free Shops SA 6 366 604 0,22 %<br />
Hellenic Exchanges SA <strong>Holding</strong> Clearing Settlement and<br />
Registry 44 550 027 1,16 %<br />
Hellenic Petroleum SA 69 457 169 0,43 %<br />
Hellenic Telecommunications Organization SA 455 211 022 0,80 %<br />
Heracles General Cement Co SA 7 082 262 0,12 %<br />
Iaso SA 11 565 434 0,50 %<br />
Intracom <strong>Holding</strong>s SA 7 922 928 0,84 %<br />
Intralot SA-Integrated Lottery Systems & Services 51 421 305 1,11 %<br />
J&P-Avax SA 5 617 488 0,33 %<br />
JUMBO SA 79 590 075 1,55 %<br />
Kleeman Hellas SA 10 896 785 2,52 %<br />
Lambrakis Press SA 8 619 635 0,51 %<br />
Lamda Development SA 1 611 102 0,09 %<br />
Marfi n Investment Group SA 200 189 335 0,95 %<br />
Metka SA 16 802 906 0,50 %<br />
Michaniki SA 15 642 968 1,41 %<br />
MJ Maillis SA 1 225 116 0,52 %<br />
Motodynamic SA 127 554 0,14 %<br />
Motor Oil Hellas Corinth Refi neries SA 42 552 942 0,52 %<br />
Mytilineos <strong>Holding</strong>s SA 41 770 247 0,93 %<br />
National <strong>Bank</strong> <strong>of</strong> Greece SA 785 592 162 1,23 %<br />
OPAP SA 522 419 008 0,81 %<br />
Piraeus <strong>Bank</strong> SA 239 323 579 1,17 %<br />
Proton <strong>Bank</strong> SA 3 995 301 1,07 %<br />
Public Power Corp SA 102 683 144 0,39 %<br />
S&B Industrial Minerals SA 5 014 503 0,21 %<br />
Sarantis SA 11 967 369 0,76 %<br />
Sidenor Steel Products Manufacturing Co SA 15 324 559 0,51 %<br />
8<br />
GOVERNMENT PENSION FUND <strong>–</strong> GLOBAL ANNUAL REPORT 2008
<strong>Government</strong> <strong>Pension</strong> <strong>Fund</strong> <strong>–</strong> <strong>Global</strong> <strong>Holding</strong> <strong>of</strong> equities at 31 December 2008<br />
Market value<br />
Voting<br />
(per cent)<br />
Technical Olympic SA 1 558 448 0,40 %<br />
Titan Cement Co SA 34 397 972 0,33 %<br />
TT Hellenic Postbank SA 44 591 764 0,58 %<br />
Viohalco 40 815 314 0,51 %<br />
GUERNSEY C. I.<br />
Alternative Investment Strategies Ltd 6 666 918 0,00 %<br />
Park Plaza Hotels Ltd 3 471 194 2,07 %<br />
RGI International Ltd 679 204 0,16 %<br />
SHIRE PLC 56 756 730 0,00 %<br />
HONG KONG<br />
Agile Property <strong>Holding</strong>s Ltd 29 470 365 0,22 %<br />
Ajisen China <strong>Holding</strong>s Ltd 22 661 174 0,65 %<br />
Alco <strong>Holding</strong>s Ltd 256 044 0,04 %<br />
Allied Properties HK Ltd 2 151 026 0,05 %<br />
AMVIG <strong>Holding</strong>s Ltd 2 909 185 0,08 %<br />
Anta Sports Products Ltd 16 364 100 0,21 %<br />
Apac Resources Ltd 4 650 720 0,32 %<br />
Artini China Co Ltd 21 683 363 4,02 %<br />
Arts Optical International Hldgs 90 203 0,02 %<br />
Asia Financial <strong>Holding</strong>s Ltd 2 192 278 0,11 %<br />
Asia Standard International Group 1 099 851 0,17 %<br />
ASM Pacifi c Technology Ltd 21 827 182 0,24 %<br />
<strong>Bank</strong> <strong>of</strong> East Asia Ltd 110 515 079 0,45 %<br />
Beijing Enterprises <strong>Holding</strong>s Ltd 245 694 192 0,76 %<br />
Belle International <strong>Holding</strong>s Ltd 68 759 390 0,27 %<br />
BOC Hong Kong <strong>Holding</strong>s Ltd 196 534 482 0,23 %<br />
Bossini International Hldg 77 735 0,03 %<br />
Brilliance China Automotive <strong>Holding</strong>s Ltd 5 033 066 0,37 %<br />
C C Land <strong>Holding</strong>s Ltd 9 247 548 0,24 %<br />
Cafe de Coral <strong>Holding</strong>s Ltd 25 267 803 0,32 %<br />
Cathay Pacifi c Airways Ltd 58 704 051 0,19 %<br />
CATIC International <strong>Holding</strong>s Ltd 21 731 247 3,78 %<br />
Champion REIT 35 829 300 0,43 %<br />
Chaoda Modern Agriculture <strong>Holding</strong>s Ltd 25 203 807 0,22 %<br />
Chen Hsong <strong>Holding</strong>s 3 754 926 0,48 %<br />
Cheung Kong <strong>Holding</strong>s Ltd 515 130 205 0,34 %<br />
Cheung Kong Infrastructure <strong>Holding</strong>s Ltd 49 847 097 0,08 %<br />
Chevalier International <strong>Holding</strong>s Ltd 260 742 0,03 %<br />
China Agri-Industries <strong>Holding</strong>s Ltd 28 919 192 0,23 %<br />
China Chengtong Development Group Ltd 3 115 176 0,26 %<br />
China E-Learning Group Ltd 13 552 102 2,47 %<br />
China Everbright International Ltd 12 838 277 0,32 %<br />
China Everbright Ltd 33 716 184 0,25 %<br />
China Foods Ltd 11 881 269 0,16 %<br />
China Gas <strong>Holding</strong>s Ltd 12 689 104 0,37 %<br />
China Grand Forestry Green Resources Group Ltd 50 100 133 3,12 %<br />
China Green <strong>Holding</strong>s Ltd 15 017 518 0,30 %<br />
China High Speed Transmission Equipment Group Co Ltd 102 415 312 0,97 %<br />
China Huiyuan Juice Group Ltd 54 397 066 0,42 %<br />
China Insurance International <strong>Holding</strong>s Co Ltd 56 474 753 0,37 %<br />
China LotSynergy <strong>Holding</strong>s Ltd 22 699 771 2,72 %<br />
China Mengniu Dairy Co Ltd 210 381 095 1,48 %<br />
China Merchants China Direct Investments Ltd 14 923 936 1,24 %<br />
China Merchants <strong>Holding</strong>s International Co Ltd 73 928 326 0,23 %<br />
China Mining Resources Group Ltd 3 920 274 0,33 %<br />
China Mobile Ltd 2 065 140 110 0,15 %<br />
China Nickel Resources <strong>Holding</strong> Co Ltd 1 206 607 0,09 %<br />
China Oriental Group Co Ltd 342 308 0,01 %<br />
China Overseas Land & Investment Ltd 176 735 192 0,23 %<br />
China Pharmaceutical Group Ltd 6 979 152 0,18 %<br />
China Power International Development Ltd 146 175 501 2,80 %<br />
China Power New Energy Development Co Ltd 3 372 395 0,23 %<br />
China Resources Enterprise 81 292 484 0,28 %<br />
China Resources Gas Group Ltd 822 754 0,02 %<br />
China Resources Land Ltd 183 092 510 0,45 %<br />
China Resources Power <strong>Holding</strong>s Co Ltd 77 886 831 0,14 %<br />
China Sci-Tech <strong>Holding</strong>s Ltd 1 897 439 0,40 %<br />
China Solar Energy <strong>Holding</strong>s Ltd 494 381 0,22 %<br />
China State Construction International <strong>Holding</strong>s Ltd 8 515 870 0,29 %<br />
China Ting Group <strong>Holding</strong>s Ltd 19 154 116 1,91 %<br />
China Travel International Inv HK 50 528 633 0,65 %<br />
China Unicom Hong Kong Ltd 450 862 992 0,23 %<br />
China Water Affairs Group Ltd 51 767 493 5,00 %<br />
China Yurun Food Group Ltd 98 939 994 0,79 %<br />
Chinese Estates <strong>Holding</strong>s Ltd 35 546 148 0,21 %<br />
Chong Hing <strong>Bank</strong> Ltd 7 705 273 0,21 %<br />
Chow Sang Sang Hldg 3 767 846 0,17 %<br />
Citic 21CN Co Ltd 676 250 0,13 %<br />
Citic Pacifi c Ltd 107 777 609 0,65 %<br />
Citic Resources <strong>Holding</strong>s Ltd 6 400 933 0,13 %<br />
CLP <strong>Holding</strong>s Ltd (94 495 285) 0,00 %<br />
CNOOC Ltd 602 535 367 0,21 %<br />
Cnpc Hong Kong Ltd 25 431 694 0,26 %<br />
Coastal Greenland Ltd 512 306 0,06 %<br />
Comba Telecom Systems <strong>Holding</strong>s Ltd 1 457 014 0,13 %<br />
Cosco International <strong>Holding</strong>s Ltd 4 776 303 0,22 %<br />
COSCO Pacifi c Ltd 39 431 505 0,25 %<br />
Country Garden <strong>Holding</strong>s Co 27 523 958 0,10 %<br />
Dah Chong Hong <strong>Holding</strong>s Ltd 67 550 0,00 %<br />
Dah Sing <strong>Bank</strong>ing Group Ltd 17 317 313 0,37 %<br />
Dah Sing Financial <strong>Holding</strong>s Ltd 9 382 854 0,20 %<br />
Market value<br />
Voting<br />
(per cent)<br />
Daphne International <strong>Holding</strong>s Ltd 3 692 894 0,20 %<br />
Delta Networks Inc 2 989 910 0,23 %<br />
Denway Motors Ltd 140 793 166 0,86 %<br />
Dickson Concepts International Ltd 1 131 736 0,16 %<br />
Digital China <strong>Holding</strong>s Ltd 8 216 549 0,42 %<br />
DMX Technologies Group Ltd 714 717 0,29 %<br />
EganaGoldpfeil <strong>Holding</strong>s Ltd 4 770 0,00 %<br />
Emperor Entertainment Hotel Ltd 1 181 653 0,32 %<br />
Enerchina <strong>Holding</strong>s Ltd 977 538 0,20 %<br />
Esprit <strong>Holding</strong>s Ltd 169 123 096 0,34 %<br />
eSun <strong>Holding</strong>s Ltd 2 742 729 0,24 %<br />
Far East Consortium 5 201 597 0,34 %<br />
First Pacifi c Co 43 760 636 0,56 %<br />
Fosun International 19 736 622 0,13 %<br />
Fountain SET Hldgs 415 236 0,19 %<br />
Foxconn International <strong>Holding</strong>s Ltd 23 825 291 0,15 %<br />
Franshion Properties China Ltd 20 517 340 0,22 %<br />
FU JI Food and Catering Services <strong>Holding</strong>s Ltd 3 539 917 0,18 %<br />
Fubon <strong>Bank</strong> Hong Kong Ltd 4 865 205 0,18 %<br />
Fushan International Energy Group Ltd 17 713 175 0,22 %<br />
Galaxy Entertainment Group Ltd 5 016 338 0,13 %<br />
Geely Automobile <strong>Holding</strong>s Ltd 8 076 782 0,22 %<br />
Giordano International Ltd 12 814 809 0,49 %<br />
<strong>Global</strong> Bio-Chem Technology Group Co Ltd 8 738 395 0,34 %<br />
Golden Eagle Retail Group Ltd 14 095 921 0,16 %<br />
Golden Resorts Group Ltd 615 229 0,07 %<br />
Goldin Properties <strong>Holding</strong>s Ltd 199 050 743 3,83 %<br />
GOME Electrical Appliances <strong>Holding</strong>s Ltd 81 695 670 0,63 %<br />
Great Eagle <strong>Holding</strong>s Ltd 10 275 601 0,22 %<br />
Green <strong>Global</strong> Resources Ltd 2 583 934 1,74 %<br />
Greentown China <strong>Holding</strong>s Ltd 51 462 589 1,14 %<br />
Guangdong Investment Ltd 24 063 148 0,14 %<br />
Guangnan <strong>Holding</strong>s 628 095 0,10 %<br />
Guangzhou Investment Co Ltd 20 549 052 0,43 %<br />
Guoco Group Ltd 25 335 790 0,19 %<br />
GZI Real Estate Investment Trust 6 958 887 0,40 %<br />
GZI Transportation Ltd 783 402 0,02 %<br />
Haier Electronics Group Co Ltd 955 342 0,06 %<br />
Hang Lung Group Ltd 102 109 337 0,36 %<br />
Hang Lung Properties Ltd 167 026 652 0,26 %<br />
Hang Seng <strong>Bank</strong> Ltd 191 971 216 0,11 %<br />
Henderson Investment Ltd 1 156 850 0,09 %<br />
Henderson Land Development Co Ltd 215 491 786 0,39 %<br />
Hengan International Group Co Ltd 59 525 710 0,23 %<br />
Hi Sun Technology China Ltd 3 923 930 0,29 %<br />
Hidili Industry International Development Ltd 18 019 381 0,40 %<br />
HKC <strong>Holding</strong>s Ltd 8 645 012 0,18 %<br />
HKR International Ltd 5 683 621 0,28 %<br />
Hong Kong & China Gas Co Ltd 226 014 193 0,32 %<br />
Hong Kong Aircraft Engineerg Co Ltd 22 698 217 0,24 %<br />
Hong Kong Exchanges and Clearing Ltd 291 127 715 0,41 %<br />
Hong Kong Health Check and Laboratory <strong>Holding</strong>s Co Ltd 2 349 031 1,28 %<br />
Hongkong & Shanghai Hotels/The 71 478 481 0,93 %<br />
Hongkong Chinese Ltd 704 907 0,06 %<br />
HongKong Electric <strong>Holding</strong>s (300 229 557) 0,00 %<br />
Hongkong Land <strong>Holding</strong>s Ltd 192 070 714 0,49 %<br />
Hopewell Highway Infrastructure Ltd 10 239 196 0,09 %<br />
Hopewell <strong>Holding</strong>s 115 422 146 0,57 %<br />
Hopson Development <strong>Holding</strong>s Ltd 13 306 357 0,18 %<br />
HSBC China Dragon <strong>Fund</strong> 4 296 145 0,00 %<br />
Hua Han Bio-Pharmaceutical <strong>Holding</strong>s Ltd 12 522 142 2,50 %<br />
Huabao International <strong>Holding</strong>s Ltd 361 342 764 2,56 %<br />
Hutchison Harbour Ring Ltd 4 368 439 0,10 %<br />
Hutchison Telecommunications International Ltd 221 091 528 2,44 %<br />
Hutchison Whampoa Ltd 608 606 070 0,41 %<br />
Hysan Development Co Ltd 42 009 768 0,36 %<br />
I-CABLE Communications Ltd 329 605 0,03 %<br />
IDT International Ltd 715 186 0,19 %<br />
Industrial and Commercial <strong>Bank</strong> <strong>of</strong> China Asia Ltd 17 001 759 0,18 %<br />
Inspur International Ltd 14 455 575 0,65 %<br />
Intime Department Store Group Co Ltd 29 626 792 0,88 %<br />
iShares Asia Trust - iShares FTSE/Xinhua A50 China Tracker 75 575 555 0,30 %<br />
Jardine Matheson <strong>Holding</strong>s Ltd 194 204 644 0,24 %<br />
Jardine Strategic <strong>Holding</strong>s Ltd 75 926 672 0,10 %<br />
Johnson Electric <strong>Holding</strong>s Ltd 8 682 999 0,20 %<br />
K Wah International <strong>Holding</strong>s Ltd 3 056 541 0,11 %<br />
Kerry Properties Ltd 77 193 812 0,29 %<br />
Kingboard Chemical <strong>Holding</strong>s Ltd 36 776 926 0,35 %<br />
Kingboard Laminates <strong>Holding</strong>s Ltd 8 442 987 0,17 %<br />
Kingway Brewery <strong>Holding</strong>s Ltd 5 544 139 0,53 %<br />
Kowloon Development Co Ltd 7 012 183 0,23 %<br />
KWG Property <strong>Holding</strong> Ltd 61 045 082 1,13 %<br />
Lai Fung <strong>Holding</strong>s Ltd 502 601 0,06 %<br />
Lee & Man Paper Manufacturing Ltd 4 378 521 0,11 %<br />
Lenovo Group Ltd 56 876 172 0,32 %<br />
Li & Fung Ltd 143 320 525 0,33 %<br />
Li Ning Co Ltd 44 285 649 0,39 %<br />
Lifestyle International <strong>Holding</strong>s Ltd 98 171 155 0,83 %<br />
Lijun International Pharmaceutical <strong>Holding</strong> Ltd 27 808 913 2,66 %<br />
Link REIT/The 47 497 771 0,19 %<br />
Linmark Group Ltd 1 910 0,00 %<br />
9<br />
GOVERNMENT PENSION FUND <strong>–</strong> GLOBAL ANNUAL REPORT 2008
<strong>Government</strong> <strong>Pension</strong> <strong>Fund</strong> <strong>–</strong> <strong>Global</strong> <strong>Holding</strong> <strong>of</strong> equities at 31 December 2008<br />
Market value<br />
Voting<br />
(per cent)<br />
Lonking <strong>Holding</strong>s Ltd 27 614 693 0,71 %<br />
Luen Thai <strong>Holding</strong>s Ltd 78 277 0,02 %<br />
Lung Kee (Bermuda) <strong>Holding</strong>s 13 453 533 1,12 %<br />
Macau Success Ltd 1 296 701 0,11 %<br />
Mandarin Oriental International Ltd 8 563 848 0,13 %<br />
Melco International Development Ltd 6 129 887 0,21 %<br />
Midland <strong>Holding</strong>s Ltd 13 924 188 0,77 %<br />
Ming An <strong>Holding</strong>s Co Ltd/The 53 557 907 2,61 %<br />
Mingyuan Medicare Development Co Ltd 768 720 0,06 %<br />
Minmetals Resources Ltd 1 645 731 0,08 %<br />
Minth Group Ltd 8 435 912 0,32 %<br />
MTR Corp 22 804 413 0,02 %<br />
Natural Beauty Bio-Technology Ltd 502 873 0,02 %<br />
Neo-China Land Group <strong>Holding</strong>s Ltd 167 707 0,00 %<br />
New World China Land Ltd 10 662 693 0,13 %<br />
New World Department Store China Ltd 9 343 818 0,14 %<br />
New World Development Ltd 183 894 221 0,69 %<br />
Next Media Ltd 1 327 022 0,07 %<br />
Nine Dragons Paper <strong>Holding</strong>s Ltd 8 178 386 0,09 %<br />
NWS <strong>Holding</strong>s Ltd 31 111 434 0,15 %<br />
Orient Overseas International Ltd 17 907 043 0,18 %<br />
Oriental Press Group 1 577 609 0,10 %<br />
Pacifi c Andes International <strong>Holding</strong>s Ltd 1 735 0,00 %<br />
Pacifi c Basin Shipping Ltd 27 766 558 0,50 %<br />
Pacifi c Century Premium Developments Ltd 4 452 317 0,12 %<br />
Parkson Retail Group Ltd 18 985 953 0,09 %<br />
PCCW Ltd 70 698 110 0,31 %<br />
Peace Mark <strong>Holding</strong>s Ltd 5 510 285 0,32 %<br />
Playmates <strong>Holding</strong>s Ltd 440 989 0,23 %<br />
Playmates Toys Ltd 4 620 0,02 %<br />
Poly Hong Kong Investment Ltd 2 681 744 0,08 %<br />
Polytec Asset <strong>Holding</strong>s Ltd 5 922 269 0,30 %<br />
Ports Design Ltd 53 907 099 1,13 %<br />
Prosperity REIT 3 790 794 0,37 %<br />
Public Financial <strong>Holding</strong>s Ltd 17 168 146 0,60 %<br />
PYI Corp Ltd 599 129 0,12 %<br />
Regal Hotels International <strong>Holding</strong>s Ltd 4 407 848 0,22 %<br />
Regent Pacifi c Group Ltd 1 046 786 0,20 %<br />
Rexcapital Financial <strong>Holding</strong>s Ltd 4 133 933 0,33 %<br />
Road King Infrastructure 2 154 107 0,11 %<br />
Roadshow <strong>Holding</strong>s Ltd 33 429 0,01 %<br />
SA SA International <strong>Holding</strong>s Ltd 3 718 155 0,16 %<br />
Samling <strong>Global</strong> Ltd 7 846 938 0,52 %<br />
Samson <strong>Holding</strong> Ltd 668 570 0,02 %<br />
Semiconductor Manufacturing International Corp 8 363 725 0,15 %<br />
Shanghai Industrial <strong>Holding</strong>s Ltd 76 517 410 0,44 %<br />
Shangri-La Asia Ltd 82 797 174 0,36 %<br />
Shenzhen International <strong>Holding</strong>s 14 700 604 0,35 %<br />
Shenzhen Investment Ltd 9 816 118 0,25 %<br />
Shimao Property <strong>Holding</strong>s Ltd 103 816 988 0,66 %<br />
Shougang Concord International Enterprises Co Ltd 111 645 287 2,00 %<br />
Shui On Construction and Materials Ltd 2 084 566 0,12 %<br />
Shui On Land Ltd 12 099 046 0,13 %<br />
Shun Tak <strong>Holding</strong>s Ltd 19 940 617 0,46 %<br />
Silver Grant International 2 715 968 0,23 %<br />
Singamas Container <strong>Holding</strong>s Ltd 747 579 0,25 %<br />
Sino Land Co 80 807 023 0,23 %<br />
Sin<strong>of</strong>ert <strong>Holding</strong>s Ltd 43 515 799 0,18 %<br />
Sino-I Technology Ltd 280 104 0,04 %<br />
Sinolink Worldwide <strong>Holding</strong>s 3 802 178 0,20 %<br />
Sino-Ocean Land <strong>Holding</strong>s Ltd 150 804 853 1,07 %<br />
Sinopec Kantons <strong>Holding</strong>s Ltd 569 405 0,06 %<br />
SmarTone Telecommunications <strong>Holding</strong> Ltd 4 813 142 0,17 %<br />
Solomon Systech International Ltd 1 104 560 0,28 %<br />
SRE Group Ltd 4 586 248 0,35 %<br />
Stella International <strong>Holding</strong>s Ltd 5 777 261 0,13 %<br />
Sun Hung Kai & Co Ltd 3 677 245 0,06 %<br />
Sun Hung Kai Properties Ltd 501 188 635 0,33 %<br />
Superb Summit International Timber Co Ltd 25 477 952 2,62 %<br />
Swire Pacifi c Ltd 198 756 288 0,11 %<br />
Symphony <strong>Holding</strong>s Ltd 190 416 0,05 %<br />
TAI Cheung <strong>Holding</strong>s 3 351 073 0,21 %<br />
TCC International <strong>Holding</strong>s Ltd 2 136 137 0,10 %<br />
TCL Communication Technology <strong>Holding</strong>s Ltd 846 573 0,19 %<br />
TCL Multimedia Technology <strong>Holding</strong>s Ltd 933 440 0,08 %<br />
Techtronic Industries Co 9 937 071 0,48 %<br />
Television Broadcasts Ltd 47 676 979 0,48 %<br />
Tencent <strong>Holding</strong>s Ltd 414 992 464 0,51 %<br />
Texwinca <strong>Holding</strong>s Ltd 8 481 190 0,21 %<br />
Tian An China Investment 5 355 249 0,21 %<br />
Tianjin Development Hldgs 4 895 272 0,20 %<br />
Tianjin Port Development <strong>Holding</strong>s Ltd 5 710 693 0,19 %<br />
Tingyi Cayman Islands <strong>Holding</strong> Corp 45 256 194 0,10 %<br />
Titan Petrochemicals Group Ltd 955 767 0,15 %<br />
Tom Group Ltd 644 222 0,06 %<br />
Tomson Group Ltd 2 434 048 0,14 %<br />
Tongda Group <strong>Holding</strong>s Ltd 5 420 841 2,51 %<br />
Top Form International Ltd 297 387 0,12 %<br />
Towngas China Co Ltd 70 498 034 2,61 %<br />
TPV Technology Ltd 15 309 358 0,32 %<br />
Truly International <strong>Holding</strong>s 2 244 228 0,13 %<br />
Market value<br />
Voting<br />
(per cent)<br />
Varitronix International Ltd 1 137 076 0,19 %<br />
Victory City International <strong>Holding</strong>s Ltd 362 645 0,08 %<br />
VST <strong>Holding</strong>s Ltd 22 511 270 4,21 %<br />
VTech <strong>Holding</strong>s Ltd 25 870 420 0,36 %<br />
Wharf <strong>Holding</strong>s Ltd 193 561 107 0,37 %<br />
Wheelock & Co Ltd 43 481 467 0,14 %<br />
Wing Hang <strong>Bank</strong> Ltd 50 082 222 0,42 %<br />
Wing On Co International Ltd 407 467 0,02 %<br />
Xinao Gas <strong>Holding</strong>s Ltd 282 751 072 3,79 %<br />
Xinyi Glass <strong>Holding</strong>s Co Ltd 62 149 722 1,96 %<br />
Xinyu Hengdeli <strong>Holding</strong>s Ltd 57 981 313 2,16 %<br />
Xiwang Sugar <strong>Holding</strong>s Co Ltd 32 525 045 3,61 %<br />
Yue Yuen Industrial <strong>Holding</strong>s Ltd 31 836 120 0,14 %<br />
AAC Acoustic Technologies <strong>Holding</strong>s Inc 33 233 006 0,86 %<br />
HUNGARY<br />
Egis Gyogyszergyar Nyrt 10 737 988 0,38 %<br />
Magyar Telekom Telecommunications Plc 104 358 031 0,47 %<br />
MOL Hungarian Oil and Gas NyRt 362 564 650 0,91 %<br />
OTP <strong>Bank</strong> Nyrt 360 401 375 1,22 %<br />
Richter Gedeon Nyrt 148 850 943 0,77 %<br />
INDIA<br />
3i Infotech Ltd 8 044 006 1,11 %<br />
Aban Offshore Ltd 14 349 705 0,39 %<br />
ABB Ltd/India 30 557 077 0,22 %<br />
ACC Ltd 20 628 422 0,16 %<br />
Adani Enterprises Ltd 15 011 546 0,14 %<br />
Aditya Birla Nuvo Ltd 21 932 043 0,28 %<br />
Adlabs Films Ltd 1 768 788 0,15 %<br />
Aftek Ltd 1 382 699 0,77 %<br />
Allahabad <strong>Bank</strong> 10 604 542 0,32 %<br />
Alstom Projects India Ltd 4 466 054 0,19 %<br />
Ambuja Cements Ltd 25 435 446 0,17 %<br />
Amtek Auto Ltd 6 859 509 0,50 %<br />
Amtek India Ltd 3 232 800 0,78 %<br />
Anant Raj Industries Ltd 550 020 0,01 %<br />
Andhra <strong>Bank</strong> 3 888 655 0,10 %<br />
Ansal Properties & Infrastructure Ltd 1 487 158 0,28 %<br />
Apollo Hospitals Enterprise Ltd 2 696 726 0,07 %<br />
Apollo Tyres Ltd 6 476 930 0,45 %<br />
Arvind Ltd 2 099 895 0,38 %<br />
Ashok Leyland Ltd 7 012 071 0,24 %<br />
Asian Paints Ltd 18 604 209 0,15 %<br />
Aurobindo Pharma Ltd 1 562 040 0,12 %<br />
Axis <strong>Bank</strong> Ltd 111 340 481 0,43 %<br />
Bajaj Auto Ltd 37 995 184 0,47 %<br />
Bajaj Finserv Ltd 21 414 835 0,69 %<br />
Bajaj Hindusthan Ltd 9 186 134 0,62 %<br />
Bajaj <strong>Holding</strong>s and Investment Ltd 9 201 299 0,26 %<br />
Balrampur Chini Mills Ltd 8 851 593 0,48 %<br />
<strong>Bank</strong> <strong>of</strong> Baroda 8 603 693 0,06 %<br />
<strong>Bank</strong> <strong>of</strong> India 47 850 986 0,22 %<br />
BEML Ltd 1 576 827 0,08 %<br />
BGR Energy Systems Ltd 920 864 0,06 %<br />
Bharat Electronics Ltd 11 485 739 0,13 %<br />
Bharat Forge Ltd 10 918 304 0,41 %<br />
Bharat Heavy Electricals Ltd 207 259 389 0,22 %<br />
Bharat Petroleum Corp Ltd 53 153 468 0,27 %<br />
Bharti Airtel Ltd 642 672 988 0,33 %<br />
Biocon Ltd 3 084 024 0,18 %<br />
Birla Corp Ltd 2 719 833 0,19 %<br />
Bombay Dyeing & Manufacturing Co Ltd 7 788 617 0,73 %<br />
Bongaigaon Refi nery & Petrochemicals 5 670 005 0,47 %<br />
Cairn India Ltd 48 531 518 0,10 %<br />
Canara <strong>Bank</strong> 24 458 389 0,22 %<br />
Castrol India Ltd 3 603 368 0,06 %<br />
Century Textile & Industries Ltd 10 373 057 0,46 %<br />
CESC Ltd 16 614 418 0,39 %<br />
Chambal Fertilizers & Chemicals Ltd 9 269 938 0,42 %<br />
Chennai Petroleum Corp Ltd 7 299 670 0,27 %<br />
Cipla Ltd/India 74 835 451 0,36 %<br />
Colgate Palmolive India Ltd 13 834 049 0,17 %<br />
Container Corp Of India 4 961 553 0,04 %<br />
Corp <strong>Bank</strong> 5 981 741 0,15 %<br />
Crompton Greaves Ltd 35 675 294 0,50 %<br />
Cummins India Ltd 10 118 352 0,16 %<br />
Dabur India Ltd 17 375 470 0,17 %<br />
Deccan Chronicle <strong>Holding</strong>s Ltd 2 040 583 0,13 %<br />
Divis Laboratories Ltd 31 197 420 0,25 %<br />
DLF Ltd 48 682 354 0,07 %<br />
Dr Reddys Laboratories Ltd 30 068 134 0,27 %<br />
Educomp Solutions Ltd 10 402 526 0,17 %<br />
Elecon Engineering Co Ltd 1 084 588 0,21 %<br />
Eros International PLC 3 617 003 0,28 %<br />
Essar Oil Ltd 73 709 011 0,52 %<br />
Everonn Systems India Ltd 8 221 428 1,67 %<br />
Exide Industries Ltd 3 693 288 0,07 %<br />
Federal <strong>Bank</strong> Ltd 24 421 865 0,61 %<br />
Financial Technologies India Ltd 10 585 816 0,32 %<br />
GAIL India Ltd 105 461 384 0,42 %<br />
Gammon India Ltd 1 652 485 0,17 %<br />
Gateway Distriparks Ltd 5 056 867 0,35 %<br />
10<br />
GOVERNMENT PENSION FUND <strong>–</strong> GLOBAL ANNUAL REPORT 2008
<strong>Government</strong> <strong>Pension</strong> <strong>Fund</strong> <strong>–</strong> <strong>Global</strong> <strong>Holding</strong> <strong>of</strong> equities at 31 December 2008<br />
Market value<br />
Voting<br />
(per cent)<br />
Geodesic Information Systems Ltd 3 099 595 0,34 %<br />
GHCL Ltd 1 626 238 0,38 %<br />
GlaxoSmithKline Pharmaceuticals Ltd 3 326 145 0,02 %<br />
Glenmark Pharmaceuticals Ltd 24 887 564 0,23 %<br />
GMR Infrastructure Ltd 113 814 943 0,57 %<br />
Godrej Industries Ltd 2 418 825 0,08 %<br />
Grasim Industries Ltd 66 544 898 0,41 %<br />
Great Eastern Shipping Co Ltd/The 21 024 240 0,47 %<br />
Great Offshore Ltd 5 450 284 0,45 %<br />
GTL Ltd 9 405 164 0,33 %<br />
Gujarat Alkalies & Chemicals 2 159 150 0,29 %<br />
Gujarat Mineral Development Corp Ltd 4 518 421 0,23 %<br />
Gujarat Narmada Valley Fertilizers Co Ltd 2 944 647 0,24 %<br />
Gujarat NRE Coke Ltd 8 639 771 0,49 %<br />
Gujarat State Petronet Ltd 8 339 078 0,31 %<br />
GVK Power & Infrastructure Ltd 4 788 504 0,11 %<br />
HCL Technologies Ltd 17 693 718 0,16 %<br />
HCL-Infosystems Ltd 3 427 494 0,15 %<br />
HDFC <strong>Bank</strong> Ltd 224 855 022 0,42 %<br />
Hero Honda Motors Ltd 71 631 894 0,31 %<br />
Hindalco Industries Ltd 43 965 281 0,35 %<br />
Hindustan Construction Co 7 232 659 0,39 %<br />
Hindustan Oil Exploration 3 289 540 0,27 %<br />
Hindustan Petroleum Corp Ltd 59 522 477 0,45 %<br />
Hindustan Unilever Ltd 180 127 538 0,23 %<br />
Hindustan Zinc Ltd 6 184 646 0,03 %<br />
Hotel Leela Venture Ltd 6 429 483 0,62 %<br />
Housing Development & Infrastructure Ltd 8 894 443 0,17 %<br />
Housing Development Finance Corp 247 471 831 0,41 %<br />
ICICI <strong>Bank</strong> Ltd 291 214 932 0,27 %<br />
IDBI <strong>Bank</strong> Ltd 18 201 157 0,26 %<br />
Idea Cellular Ltd 47 252 417 0,20 %<br />
IFCI Ltd 14 238 605 0,60 %<br />
India Cements Ltd 15 996 266 0,40 %<br />
India Infoline Ltd 6 291 386 0,30 %<br />
Indiabulls Financial Services Ltd 22 341 662 0,46 %<br />
Indiabulls Securities Ltd 5 774 928 0,75 %<br />
Indian <strong>Bank</strong> 12 268 094 0,15 %<br />
Indian Hotels Co Ltd 36 826 445 0,78 %<br />
Indian Oil Corp Ltd 34 407 493 0,05 %<br />
Indian Overseas <strong>Bank</strong> 7 190 906 0,13 %<br />
Indraprastha Gas Ltd 1 280 585 0,06 %<br />
IndusInd <strong>Bank</strong> Ltd 5 083 291 0,27 %<br />
Info Edge India Ltd 18 299 725 1,14 %<br />
Infosys Technologies Ltd 547 458 938 0,39 %<br />
Infrastructure Development Finance Co Ltd 50 744 646 0,41 %<br />
Ispat Industries Ltd 6 421 028 0,31 %<br />
ITC Ltd 338 514 700 0,36 %<br />
IVRCL Infrastructures & Projects Ltd 14 334 522 0,52 %<br />
Jain Irrigation Systems Ltd 7 891 621 0,23 %<br />
Jaiprakash Associates Ltd 52 159 133 0,37 %<br />
Jaiprakash Hydro Power Ltd 5 195 053 0,24 %<br />
Jammu & Kashmir <strong>Bank</strong> Ltd 1 577 257 0,06 %<br />
Jet Airways India Ltd 15 157 679 0,60 %<br />
Jindal Saw Ltd 1 931 365 0,12 %<br />
Jindal Steel & Power Ltd 37 568 384 0,19 %<br />
JSW Steel Ltd 21 465 973 0,35 %<br />
Karnataka <strong>Bank</strong> Ltd 2 196 800 0,16 %<br />
Kingfi sher Airlines Ltd 3 474 781 0,22 %<br />
Kotak Mahindra <strong>Bank</strong> Ltd 38 547 749 0,22 %<br />
Lanco Infratech Ltd 139 263 133 2,81 %<br />
Larsen & Toubro Ltd 264 108 167 0,81 %<br />
LIC Housing Finance 13 516 851 0,48 %<br />
Lupin Ltd 28 884 717 0,40 %<br />
Mahanagar Telephone Nigam 12 787 845 0,18 %<br />
Maharashtra Seamless Ltd 3 944 566 0,26 %<br />
Mahindra & Mahindra Ltd 17 755 300 0,18 %<br />
Mangalore Refi nery & Petrochemicals Ltd 6 010 150 0,06 %<br />
Maruti Suzuki India Ltd 32 149 706 0,15 %<br />
Mercator Lines Ltd 8 910 275 0,78 %<br />
MIC Electronics Ltd 3 741 873 0,63 %<br />
Monnet Ispat & Energy Ltd 2 814 740 0,25 %<br />
Moser Baer India Ltd 8 817 324 0,51 %<br />
Mphasis Ltd 5 386 158 0,12 %<br />
Mundra Port and Special Economic Zone Ltd 22 852 121 0,12 %<br />
Nagarjuna Construction Co 10 297 722 0,44 %<br />
Nagarjuna Fertilizers & Chemicals 5 393 903 0,53 %<br />
National Aluminium Co Ltd 9 329 590 0,05 %<br />
Nava Bharat Ventures Ltd 2 136 662 0,15 %<br />
Nestle India Ltd 27 011 718 0,13 %<br />
New Delhi Television Ltd 949 967 0,08 %<br />
Neyveli Lignite Corp Ltd 5 383 645 0,03 %<br />
NTPC Ltd 124 958 834 0,06 %<br />
Oil & Natural Gas Corp Ltd 189 481 406 0,09 %<br />
Opto Circuits India Ltd 8 033 349 0,39 %<br />
Oracle Financial Sevices S<strong>of</strong>tware Ltd 6 046 490 0,11 %<br />
Parsvnath Developers Ltd 4 387 021 0,35 %<br />
Patel Engineering Ltd 3 308 954 0,22 %<br />
Patni Computer Systems Ltd 9 235 628 0,39 %<br />
Peninsula Land Ltd 1 508 667 0,16 %<br />
Petronet LNG Ltd 10 694 334 0,25 %<br />
Market value<br />
Voting<br />
(per cent)<br />
Piramal Healthcare Ltd 9 848 970 0,14 %<br />
Polaris S<strong>of</strong>tware Lab 3 200 203 0,52 %<br />
Power Finance Corp Ltd 11 497 819 0,05 %<br />
Power Grid Corp <strong>of</strong> India Ltd 36 911 403 0,07 %<br />
Praj Industries Ltd 8 660 906 0,51 %<br />
Prakash Industries Ltd 839 317 0,10 %<br />
PTC India Ltd 2 660 959 0,12 %<br />
Punj Lloyd Ltd 18 715 761 0,29 %<br />
Radico Khaitan Ltd 3 854 481 0,37 %<br />
Ranbaxy Laboratories Ltd 22 477 167 0,17 %<br />
Raymond Ltd/India 2 301 416 0,24 %<br />
REI Agro Ltd 1 825 242 0,06 %<br />
Reliance Capital Ltd 54 583 983 0,29 %<br />
Reliance Communications Ltd 127 877 426 0,19 %<br />
Reliance Energy Ltd 38 949 419 0,20 %<br />
Reliance Industries Ltd 674 887 720 0,26 %<br />
Reliance Natural Resources Ltd 52 059 896 0,39 %<br />
Reliance Petroleum Ltd 58 548 555 0,10 %<br />
Reliance Power Ltd 81 408 801 0,20 %<br />
Rolta India Ltd 12 102 409 0,45 %<br />
S Kumars Nationwide Ltd 2 304 729 0,31 %<br />
Satyam Computer Services Ltd 54 114 725 0,33 %<br />
Sesa Goa Ltd 25 145 124 0,26 %<br />
Shipping Corp Of India Ltd 6 097 050 0,13 %<br />
Shree Renuka Sugars Ltd 12 657 645 0,44 %<br />
Siemens India Ltd 38 274 076 0,28 %<br />
Sintex Industries Ltd 11 607 808 0,31 %<br />
Sobha Developers Ltd 20 663 0,00 %<br />
SREI Infrastructure Finance Ltd 1 457 214 0,22 %<br />
SRF Ltd 3 863 844 0,51 %<br />
State <strong>Bank</strong> <strong>of</strong> India Ltd 182 400 363 0,15 %<br />
Steel Authority Of India Ltd 33 923 250 0,07 %<br />
Sterling Biotech Ltd 21 433 315 0,40 %<br />
Subex Ltd 1 281 065 0,80 %<br />
Sun Pharma Advanced Research Co Ltd 1 048 911 0,08 %<br />
Sun Pharmaceutical Industries Ltd 46 245 071 0,15 %<br />
Sun TV Network Ltd 6 775 207 0,07 %<br />
Suzlon Energy Ltd 24 077 121 0,18 %<br />
Syndicate <strong>Bank</strong> 10 621 980 0,23 %<br />
Tata Chemicals Ltd 21 273 818 0,38 %<br />
Tata Communications Ltd 30 532 138 0,15 %<br />
Tata Consultancy Services Ltd 86 491 851 0,13 %<br />
Tata Motors Ltd 62 677 314 0,24 %<br />
Tata Power Co Ltd 68 227 233 0,29 %<br />
Tata Steel Ltd 108 113 391 0,47 %<br />
Tata Tea Ltd 30 118 869 0,56 %<br />
Tata Teleservices Maharashtra Ltd 9 728 752 0,16 %<br />
Tech Mahindra Ltd 4 854 356 0,11 %<br />
Thermax Ltd 2 924 149 0,09 %<br />
Titan Industries Ltd 36 219 519 0,61 %<br />
Torrent Power Ltd 4 383 430 0,09 %<br />
Trent Ltd 4 642 326 0,51 %<br />
Triveni Engineering & Industries Ltd 7 030 045 0,38 %<br />
UCO <strong>Bank</strong> 7 447 728 0,23 %<br />
Ultratech Cement Ltd 13 802 381 0,20 %<br />
Union <strong>Bank</strong> Of India 33 467 620 0,28 %<br />
Unitech Ltd 18 016 057 0,19 %<br />
United Phosphorus Ltd 25 296 938 0,37 %<br />
United Spirits Ltd 31 890 714 0,25 %<br />
Usha Martin Ltd 758 548 0,08 %<br />
Vijaya <strong>Bank</strong> 3 750 132 0,18 %<br />
Voltas Ltd 11 809 276 0,41 %<br />
Walchandnagar Industries 1 638 365 0,29 %<br />
Welspun-Gujarat Stahl Ltd 6 742 398 0,25 %<br />
Wipro Ltd 53 507 706 0,11 %<br />
Yes <strong>Bank</strong> Ltd 19 374 619 0,61 %<br />
Zee Entertainment Enterprises Ltd 56 342 007 0,65 %<br />
INDONESIA<br />
Adaro Energy PT 11 830 451 0,12 %<br />
AKR Corporindo Tbk PT 14 836 615 1,03 %<br />
Astra Agro Lestari Tbk PT 5 209 498 0,05 %<br />
<strong>Bank</strong> Central Asia Tbk PT 181 127 625 0,35 %<br />
<strong>Bank</strong> Danamon Indonesia Tbk PT 12 185 517 0,12 %<br />
<strong>Bank</strong> Internasional Indonesia Tbk PT 630 937 0,01 %<br />
<strong>Bank</strong> Mandiri Persero Tbk PT 40 760 798 0,15 %<br />
<strong>Bank</strong> OCBC Nisp Tbk PT 23 976 264 0,92 %<br />
<strong>Bank</strong> Pan Indonesia Tbk PT 14 293 438 0,19 %<br />
<strong>Bank</strong> Permata Tbk PT 10 388 621 0,43 %<br />
<strong>Bank</strong> Rakyat Indonesia 28 900 212 0,08 %<br />
Bumi Resources Tbk PT 76 844 370 0,68 %<br />
Ciputra Development Tbk PT 9 869 217 1,27 %<br />
Excelcomindo Pratama PT 2 935 727 0,07 %<br />
Holcim Indonesia Tbk PT 10 522 422 0,34 %<br />
Indika Energy Tbk PT 1 848 554 0,05 %<br />
Indo Tambangraya Megah PT 28 714 070 0,38 %<br />
Indocement Tunggal Prakarsa Tbk PT 61 863 232 0,57 %<br />
Ind<strong>of</strong>ood Sukses Makmur Tbk PT 13 526 641 0,26 %<br />
Indosat Tbk PT 104 463 463 0,52 %<br />
International Nickel Indonesia Tbk PT 24 920 410 0,20 %<br />
Lippo Karawaci Tbk PT 845 391 0,01 %<br />
Perusahaan Gas Negara PT 118 807 894 0,43 %<br />
11<br />
GOVERNMENT PENSION FUND <strong>–</strong> GLOBAL ANNUAL REPORT 2008
<strong>Government</strong> <strong>Pension</strong> <strong>Fund</strong> <strong>–</strong> <strong>Global</strong> <strong>Holding</strong> <strong>of</strong> equities at 31 December 2008<br />
Market value<br />
Voting<br />
(per cent)<br />
Perusahaan Perkebunan London Sumatra Indonesia Tbk PT 15 201 142 0,59 %<br />
PT Astra International Tbk 150 966 898 0,55 %<br />
Ramayana Lestari Sentosa Tbk PT 6 910 398 0,30 %<br />
Semen Gresik Persero Tbk PT 17 817 847 0,11 %<br />
Tambang Batubara Bukit Asam Tbk PT 95 886 533 0,94 %<br />
Telekomunikasi Indonesia Tbk PT 349 353 655 0,39 %<br />
Unilever Indonesia Tbk PT 87 359 085 0,23 %<br />
United Tractors Tbk PT 58 318 499 0,62 %<br />
IRELAND<br />
AER Lingus 33 589 564 0,43 %<br />
Allied Irish <strong>Bank</strong>s PLC 216 262 513 1,45 %<br />
Anglo Irish <strong>Bank</strong> Corp PLC 15 008 447 1,19 %<br />
Blackrock International Land PLC 713 611 0,24 %<br />
C&C Group PLC 65 272 826 1,41 %<br />
CRH PLC 1 230 763 945 1,33 %<br />
DCC Plc 110 021 684 1,32 %<br />
Elan Corp PLC 435 399 545 2,21 %<br />
FBD <strong>Holding</strong>s Plc 25 170 097 1,06 %<br />
Fyffes PLC 6 510 295 0,77 %<br />
Glanbia Plc 33 657 172 0,55 %<br />
Governor & Co <strong>of</strong> the <strong>Bank</strong> <strong>of</strong> Ireland/The 99 470 376 1,22 %<br />
Grafton Group PLC 70 405 770 1,36 %<br />
Greencore Group PLC 18 767 412 1,02 %<br />
Independent News & Media PLC 28 237 195 0,82 %<br />
Irish Continental Group PLC 14 398 892 0,33 %<br />
Irish Life & Permanent PLC 57 314 284 1,35 %<br />
Kerry Group PLC 201 631 743 0,90 %<br />
Kingspan Group Plc 65 716 412 1,30 %<br />
McInerney <strong>Holding</strong>s PLC 2 959 074 0,87 %<br />
Paddy Power PLC 69 166 327 1,11 %<br />
Ryanair <strong>Holding</strong>s PLC 581 392 272 1,07 %<br />
Smurfi t Kappa Group PLC 63 651 853 1,67 %<br />
Total Produce PLC 6 803 281 0,76 %<br />
United Drug Plc 55 225 932 1,09 %<br />
Waterford Wedgwood PLC 132 757 0,02 %<br />
ISLE OF MAN<br />
Hirco PLC 24 116 622 4,20 %<br />
REI Six Ten Retail Ltd 99 069 0,00 %<br />
Trading Emissions PLC 8 612 745 0,35 %<br />
ISRAEL<br />
Africa Israel Investments Ltd 5 514 863 0,18 %<br />
Africa Israel Properties Ltd 1 150 704 0,17 %<br />
Alony Hetz Properties & Investments Ltd 2 041 615 0,26 %<br />
<strong>Bank</strong> Hapoalim BM 75 812 217 0,38 %<br />
<strong>Bank</strong> Leumi Le-Israel BM 44 514 990 0,21 %<br />
Bezeq Israeli Telecommunication Corp Ltd 100 277 065 0,33 %<br />
Cellcom Israel Ltd 10 101 682 0,10 %<br />
Clal Industries and Investments 2 418 682 0,10 %<br />
Clal Insurance 1 978 009 0,10 %<br />
Delek Automotive Systems Ltd 4 591 144 0,14 %<br />
Delek Group Ltd 2 861 788 0,11 %<br />
Discount Investment Corp 6 873 743 0,15 %<br />
Elbit Imaging Ltd 4 631 017 0,30 %<br />
Elbit Systems Ltd 35 792 830 0,27 %<br />
Emblaze Ltd 7 770 723 1,83 %<br />
FMS Enterprises Migun Ltd 1 921 189 0,22 %<br />
Frutarom Industries Ltd 8 252 446 0,33 %<br />
Gazit-Globe Ltd 6 204 416 0,15 %<br />
Gilat Satellite Networks Ltd 1 271 074 0,17 %<br />
Harel Insurance Investments & Finances Ltd 7 673 306 0,21 %<br />
Housing & Construction <strong>Holding</strong>s Ltd 3 600 474 0,22 %<br />
Israel Chemicals Ltd 178 406 632 0,29 %<br />
Israel Corp Ltd/The 18 446 020 0,15 %<br />
Israel Discount <strong>Bank</strong> Ltd 12 160 255 0,20 %<br />
Jerusalem Economy Ltd 1 032 830 0,16 %<br />
Koor Industries Ltd 8 468 666 0,24 %<br />
Makhteshim-Agan Industries Ltd 41 305 892 0,42 %<br />
Migdal Insurance & Financial <strong>Holding</strong> Ltd 6 433 822 0,08 %<br />
Mizrahi Tefahot <strong>Bank</strong> Ltd 22 497 163 0,28 %<br />
Nice Systems Ltd 39 550 473 0,42 %<br />
Oil Refi neries Ltd 8 006 742 0,23 %<br />
Ormat Industries 9 486 462 0,18 %<br />
Osem Investments Ltd 21 497 376 0,23 %<br />
Partner Communications 42 045 800 0,24 %<br />
Paz Oil Co Ltd 11 448 517 0,17 %<br />
Perrigo Co 56 693 053 0,27 %<br />
Property & Building Corp 74 000 0,00 %<br />
Queenco Leisure International Ltd 4 424 100 0,00 %<br />
Shufersal Ltd 9 559 582 0,19 %<br />
Strauss Group Ltd 11 770 116 0,16 %<br />
Teva Pharmaceutical Industries Ltd 1 884 972 607 0,64 %<br />
ITALY<br />
A2A SpA 459 456 953 1,19 %<br />
ACEA SpA 168 505 885 0,84 %<br />
AcegasAps SpA 9 175 791 0,35 %<br />
Actelios SpA 4 849 107 0,24 %<br />
Aedes SpA 4 300 908 1,00 %<br />
Alleanza Assicurazioni SpA 317 140 440 0,67 %<br />
Amplifon SpA 8 557 018 0,54 %<br />
Ansaldo STS SpA 239 693 792 2,46 %<br />
Arnoldo Mondadori Editore SpA 49 602 895 0,56 %<br />
Market value<br />
Voting<br />
(per cent)<br />
Ascopiave SpA 14 274 641 0,42 %<br />
Assicurazioni Generali SpA 2 683 571 347 1,00 %<br />
Astaldi SpA 23 192 648 0,61 %<br />
Atlantia SpA 1 246 892 487 1,71 %<br />
Autogrill SpA 76 545 206 0,58 %<br />
Autostrada Torino-Milano SpA 51 900 572 1,11 %<br />
Azimut <strong>Holding</strong> SpA 62 990 295 1,19 %<br />
Banca Carige SpA 156 791 904 0,59 %<br />
Banca Generali SpA 27 330 230 0,91 %<br />
Banca Italease SpA 41 791 989 1,15 %<br />
Banca Monte dei Paschi di Siena SpA 501 696 266 0,61 %<br />
Banca Popolare dellEmilia Romagna Scrl 264 601 0,00 %<br />
Banca Popolare dellEtruria e del Lazio 33 254 341 1,14 %<br />
Banca Popolare di Milano Scarl 210 903 243 1,25 %<br />
Banca Pr<strong>of</strong>i lo SpA 2 269 493 0,38 %<br />
Banco di Desio e della Brianza SpA 19 318 236 0,37 %<br />
Banco Popolare SC 415 395 149 1,35 %<br />
Benetton Group SpA 74 029 161 0,68 %<br />
Beni Stabili SpA 43 238 644 0,47 %<br />
Biesse SpA 8 469 234 0,82 %<br />
Brembo SpA 12 021 231 0,49 %<br />
Bulgari SpA 75 300 029 0,58 %<br />
Buongiorno SpA 5 822 319 0,92 %<br />
Buzzi Unicem SpA 251 165 327 0,93 %<br />
Caltagirone Editore SpA 703 880 0,03 %<br />
Caltagirone SpA 415 772 0,01 %<br />
Cam Finanziaria SpA 2 731 963 0,28 %<br />
Cementir <strong>Holding</strong> SpA 23 950 737 0,62 %<br />
CIR-Compagnie Industriali Riunite SpA 61 108 075 1,09 %<br />
Class Editori SpA 1 061 077 0,15 %<br />
C<strong>of</strong>i de SpA 20 951 297 0,81 %<br />
Credito Artigiano SpA 12 072 919 0,22 %<br />
Credito Emiliano SpA 45 316 996 0,38 %<br />
Danieli & Co SpA 40 876 329 0,59 %<br />
Datalogic SpA 7 229 882 0,27 %<br />
Davide Campari-Milano SpA 129 206 453 0,95 %<br />
DiaSorin SpA 78 103 945 1,02 %<br />
Digital Multimedia Technologies SpA 17 628 057 1,31 %<br />
Edison SpA 85 462 356 0,19 %<br />
Enel SpA 2 219 408 403 0,82 %<br />
Engineering Ingegneria Informatica SpA 7 514 415 0,42 %<br />
ENI SpA 5 763 995 036 0,88 %<br />
ERG Renew SpA 1 768 178 0,21 %<br />
ERG SpA 146 455 845 1,18 %<br />
ErgyCapital SpA 264 068 0,10 %<br />
Esprinet SpA 12 294 247 0,74 %<br />
Eutelia 1 116 811 0,59 %<br />
Fastweb 51 426 275 0,32 %<br />
Fiat SpA 398 581 632 0,75 %<br />
Fiera Milano SpA 3 108 106 0,18 %<br />
Fondiaria-Sai SpA 591 625 293 1,40 %<br />
Gemina SpA 38 403 771 0,73 %<br />
Geox SpA 52 539 164 0,48 %<br />
Gewiss SpA 8 256 904 0,27 %<br />
GranitiFiandre SpA 2 214 788 0,19 %<br />
Gruppo Coin SpA 31 318 820 1,11 %<br />
Gruppo Editoriale LEspresso SpA 13 289 729 0,29 %<br />
Hera SpA 183 865 969 1,20 %<br />
IFIL - Investments SpA 95 778 707 0,52 %<br />
Immobiliare Grande Distribuzione 15 197 542 0,48 %<br />
IMMSI SpA 17 109 499 0,74 %<br />
Impregilo SpA 109 538 967 1,39 %<br />
Indesit Co SpA 29 111 844 0,61 %<br />
Industria Macchine Automatiche SpA 19 164 460 0,44 %<br />
Interpump Group SpA 42 747 838 1,31 %<br />
Intesa Sanpaolo SpA 3 203 419 969 0,98 %<br />
Iride SpA 73 523 478 1,10 %<br />
Istituto Finanziario Industriale SpA 24 844 124 0,69 %<br />
Italcementi SpA 146 496 920 0,60 %<br />
Italmobiliare SpA 49 116 090 0,29 %<br />
Juventus Football Club SpA 4 143 621 0,28 %<br />
KME Group SpA 3 205 228 0,31 %<br />
Landi Renzo SpA 17 002 357 0,47 %<br />
Lottomatica SpA 123 238 759 0,47 %<br />
Luxottica Group SpA 206 061 213 0,36 %<br />
Maire Tecnimont SpA 16 821 239 0,37 %<br />
Management & Capitali SpA 20 899 753 1,00 %<br />
Mariella Burani SpA 9 205 771 0,31 %<br />
MARR SpA 15 783 771 0,45 %<br />
Mediaset SpA 217 950 065 0,47 %<br />
Mediobanca SpA 351 309 116 0,61 %<br />
Mediolanum SpA 24 108 551 0,11 %<br />
Meliorbanca SpA 8 645 692 0,24 %<br />
Milano Assicurazioni SPA 55 993 429 0,58 %<br />
Nice SpA 5 759 563 0,29 %<br />
Parmalat SpA 228 924 756 1,20 %<br />
Permasteelisa SpA 28 471 334 1,09 %<br />
Piaggio & C SpA 22 226 578 0,46 %<br />
Piccolo Credito Valtellinese Scarl 138 339 427 1,09 %<br />
Pininfarina SpA 3 921 016 1,14 %<br />
Pirelli & C Real Estate SpA 11 362 324 0,68 %<br />
12<br />
GOVERNMENT PENSION FUND <strong>–</strong> GLOBAL ANNUAL REPORT 2008
<strong>Government</strong> <strong>Pension</strong> <strong>Fund</strong> <strong>–</strong> <strong>Global</strong> <strong>Holding</strong> <strong>of</strong> equities at 31 December 2008<br />
Market value<br />
Voting<br />
(per cent)<br />
Pirelli & C SpA 116 142 179 0,85 %<br />
Premafi n Finanziaria SpA 23 015 475 0,46 %<br />
Prysmian SpA 194 594 768 1,00 %<br />
RCS MediaGroup SpA 50 073 050 0,72 %<br />
Recordati SpA 46 913 111 0,60 %<br />
Risanamento SpA 9 729 685 0,85 %<br />
Sabaf SpA 5 051 275 0,30 %<br />
SAES Getters SpA 6 118 426 0,43 %<br />
Safi lo Group SpA 25 024 021 1,50 %<br />
Saipem SpA 463 848 209 0,91 %<br />
Saras SpA 104 889 458 0,47 %<br />
SAVE SpA 4 808 098 0,21 %<br />
Seat Pagine Gialle SpA 36 131 849 0,78 %<br />
Snai SpA 13 989 198 0,57 %<br />
Snam Rete Gas SpA (243 858 745) 0,00 %<br />
Societa Cattolica di Assicurazioni SCRL 150 638 251 1,20 %<br />
Societa Iniziative Autostradali e Servizi SpA 48 317 984 0,49 %<br />
Socotherm SpA 2 903 225 0,60 %<br />
Sogefi SpA 7 290 0,00 %<br />
SOL SpA 22 692 740 0,93 %<br />
Sorin SpA 11 461 860 0,54 %<br />
Stefanel 194 0,00 %<br />
Telecom Italia Media SpA 15 043 744 0,53 %<br />
Telecom Italia SpA 2 315 226 092 0,80 %<br />
Terna Rete Elettrica Nazionale SpA (143 664 061) 0,00 %<br />
Tiscali SpA 44 122 679 1,05 %<br />
Tods SpA 39 438 426 0,44 %<br />
Trevi Finanziaria SpA 35 146 701 0,77 %<br />
Uni Land SpA 4 702 257 0,60 %<br />
UniCredit SpA 2 716 505 761 1,20 %<br />
Unione di Banche Italiane SCPA 784 015 283 1,22 %<br />
Unipol Gruppo Finanziario SpA 154 329 191 0,80 %<br />
Vianini Lavori SpA 3 484 550 0,20 %<br />
JAPAN<br />
77 <strong>Bank</strong> Ltd/The 55 816 894 0,39 %<br />
A&D Co Ltd 1 042 197 0,17 %<br />
ABC-Mart Inc 213 393 188 1,00 %<br />
Accordia Golf Co Ltd 22 542 066 0,61 %<br />
Achilles Corp/Japan 3 504 526 0,18 %<br />
Acom Co Ltd 69 271 555 0,15 %<br />
ADEKA Corp 13 417 986 0,26 %<br />
Aderans <strong>Holding</strong>s Co Ltd 8 250 969 0,27 %<br />
Advan Co Ltd 858 003 0,11 %<br />
Advantest Corp 117 913 521 0,53 %<br />
Aeon Co Ltd 288 314 054 0,52 %<br />
Aeon Credit Service Co Ltd 28 872 984 0,25 %<br />
Aeon Delight Co Ltd 10 946 294 0,13 %<br />
Aeon Fantasy Co Ltd 17 484 286 1,57 %<br />
Aeon Mall Co Ltd 148 160 222 0,62 %<br />
Agrex Inc/Japan 8 545 211 1,41 %<br />
Ahresty Corp 783 710 0,16 %<br />
Ai <strong>Holding</strong>s Corp 2 168 372 0,17 %<br />
Aica Kogyo Co Ltd 15 487 015 0,29 %<br />
Aichi <strong>Bank</strong> Ltd/The 10 656 941 0,18 %<br />
Aichi Corp 1 937 647 0,09 %<br />
Aichi Machine Industry Co Ltd 536 995 0,05 %<br />
Aichi Steel Corp 7 011 369 0,16 %<br />
Aida Engineering Ltd 3 420 331 0,17 %<br />
Aiful Corp 6 344 838 0,19 %<br />
Aigan Co Ltd 805 863 0,10 %<br />
Aioi Insurance Co Ltd 155 254 328 0,58 %<br />
Aiphone Co Ltd 4 580 833 0,17 %<br />
Air Water Inc 61 005 864 0,54 %<br />
Airport Facilities Co Ltd 25 046 415 1,06 %<br />
Aisan Industry Co Ltd 1 275 487 0,07 %<br />
Aisin Seiki Co Ltd 71 928 136 0,26 %<br />
Ajinomoto Co Inc 193 225 016 0,37 %<br />
Akebono Brake Industry Co Ltd 11 265 108 0,26 %<br />
Akita <strong>Bank</strong> Ltd/The 13 887 949 0,24 %<br />
Alfresa <strong>Holding</strong>s Corp 48 499 179 0,35 %<br />
All Nippon Airways Co Ltd 88 515 831 0,17 %<br />
Aloka Co Ltd 1 283 721 0,07 %<br />
Alpen Co Ltd 86 584 585 1,58 %<br />
Alpha Systems Inc 2 548 564 0,11 %<br />
Alpine Electronics Inc 6 920 184 0,18 %<br />
Alps Electric Co Ltd 22 754 469 0,37 %<br />
Alps Logistics Co Ltd 17 514 674 1,30 %<br />
Amada Co Ltd 62 588 054 0,47 %<br />
Amano Corp 11 765 081 0,27 %<br />
Ando Corp 1 251 804 0,13 %<br />
Anritsu Corp 3 552 417 0,17 %<br />
AOC <strong>Holding</strong>s Inc 7 024 810 0,24 %<br />
AOKI <strong>Holding</strong>s Inc 6 981 059 0,20 %<br />
Aomori <strong>Bank</strong> Ltd/The 13 445 422 0,25 %<br />
Aoyama Trading Co Ltd 25 816 175 0,35 %<br />
Aozora <strong>Bank</strong> Ltd 26 914 172 0,25 %<br />
Aplus Co Ltd 552 521 0,07 %<br />
Arakawa Chemical Industries Ltd 2 647 002 0,17 %<br />
Arc Land Sakamoto Co Ltd 2 771 426 0,17 %<br />
Arcs Co Ltd 5 514 588 0,11 %<br />
Ariake Japan Co Ltd 6 514 000 0,15 %<br />
Market value<br />
Voting<br />
(per cent)<br />
Arisawa Manufacturing Co Ltd 1 506 236 0,18 %<br />
Arnest One Corp 37 266 234 3,73 %<br />
Arrk Corp 1 133 854 0,17 %<br />
Aruze Corp 15 794 281 0,28 %<br />
As One Corp 2 458 363 0,09 %<br />
Asahi Breweries Ltd 126 733 956 0,22 %<br />
Asahi Diamond Industrial Co Ltd 8 159 204 0,33 %<br />
Asahi Glass Co Ltd 171 931 287 0,37 %<br />
Asahi Kasei Corp 160 041 206 0,38 %<br />
Asahi Organic Chemicals Industry Co Ltd 3 890 124 0,17 %<br />
Asahi Pretec Corp 3 525 629 0,12 %<br />
Asatsu-DK Inc 21 985 713 0,32 %<br />
Asics Corp 41 597 881 0,37 %<br />
ASKA Pharmaceutical Co Ltd 2 865 106 0,14 %<br />
ASKUL Corp 10 554 246 0,16 %<br />
Astellas Pharma Inc 685 378 283 0,49 %<br />
Asunaro Aoki Construction Co Ltd 983 384 0,06 %<br />
Atrium Co Ltd 4 897 469 0,48 %<br />
Atsugi Co Ltd 7 445 476 0,37 %<br />
Autobacs Seven Co Ltd 22 927 030 0,36 %<br />
Avex Group <strong>Holding</strong>s Inc 6 612 763 0,19 %<br />
Awa <strong>Bank</strong> Ltd/The 44 186 225 0,38 %<br />
Bando Chemical Industries Ltd 2 889 670 0,17 %<br />
<strong>Bank</strong> <strong>of</strong> Ikeda Ltd/The 38 182 417 0,43 %<br />
<strong>Bank</strong> <strong>of</strong> Iwate Ltd/The 21 766 374 0,26 %<br />
<strong>Bank</strong> <strong>of</strong> Kyoto Ltd/The 107 015 570 0,38 %<br />
<strong>Bank</strong> <strong>of</strong> Nagoya Ltd/The 31 035 949 0,40 %<br />
<strong>Bank</strong> <strong>of</strong> Okinawa Ltd/The 31 858 976 0,52 %<br />
<strong>Bank</strong> <strong>of</strong> Saga Ltd/The 12 129 970 0,27 %<br />
<strong>Bank</strong> <strong>of</strong> the Ryukyus Ltd 9 559 624 0,36 %<br />
<strong>Bank</strong> <strong>of</strong> Yokohama Ltd/The 121 032 011 0,22 %<br />
Belc Co Ltd 17 697 215 1,18 %<br />
Belluna Co Ltd 3 932 314 0,38 %<br />
Benefi t One Inc 20 058 410 1,61 %<br />
Benesse Corp 313 500 749 0,97 %<br />
Best Denki Co Ltd 3 114 448 0,16 %<br />
Bic Camera Inc 2 572 663 0,07 %<br />
BML Inc 8 361 682 0,25 %<br />
Bridgestone Corp 486 436 565 0,58 %<br />
Brother Industries Ltd 55 671 152 0,49 %<br />
Bunka Shutter Co Ltd 27 722 600 1,28 %<br />
CAC Corp 16 843 971 1,31 %<br />
Calsonic Kansei Corp 4 068 247 0,15 %<br />
Canon Electronics Inc 7 478 876 0,18 %<br />
Canon Finetech Inc 2 163 892 0,07 %<br />
Canon Inc 1 499 064 503 0,53 %<br />
Canon Marketing Japan Inc 54 487 214 0,32 %<br />
Capcom Co Ltd 38 020 175 0,37 %<br />
Casio Computer Co Ltd 44 996 592 0,37 %<br />
Cawachi Ltd 6 883 686 0,18 %<br />
CCS Inc/Japan 5 523 510 1,92 %<br />
Central Finance Co Ltd 2 026 476 0,11 %<br />
Central Glass Co Ltd 38 054 907 0,64 %<br />
Central Japan Railway Co 743 442 966 0,55 %<br />
Century Leasing System Inc 2 912 008 0,09 %<br />
Chiba <strong>Bank</strong> Ltd/The 145 474 799 0,38 %<br />
Chiba Kogyo <strong>Bank</strong> Ltd/The 5 661 188 0,11 %<br />
Chiyoda Co Ltd 10 363 533 0,19 %<br />
Chiyoda Corp 119 661 525 1,22 %<br />
Chiyoda Integre Co Ltd 13 795 334 1,16 %<br />
Ch<strong>of</strong>u Seisakusho Co Ltd 20 396 735 0,33 %<br />
Chori Co Ltd 1 849 203 0,11 %<br />
Chubu Electric Power Co Inc 605 438 555 0,37 %<br />
Chudenko Corp 10 506 070 0,14 %<br />
Chuetsu Pulp & Paper Co Ltd 1 345 191 0,07 %<br />
Chugai Pharmaceutical Co Ltd 136 632 701 0,18 %<br />
Chugai Ro Co Ltd 5 839 589 0,28 %<br />
Chugoku <strong>Bank</strong> Ltd/The 93 591 003 0,38 %<br />
Chugoku Electric Power Co Inc/The 257 085 210 0,38 %<br />
Chugoku Marine Paints Ltd 9 890 997 0,29 %<br />
Chukyo <strong>Bank</strong> Ltd/The 3 864 093 0,07 %<br />
Chuo Mitsui Trust <strong>Holding</strong>s Inc 192 026 226 0,50 %<br />
Chuo Spring Co Ltd 475 278 0,03 %<br />
Circle K Sunkus Co Ltd 27 108 238 0,25 %<br />
Citizen <strong>Holding</strong>s Co Ltd 35 536 835 0,38 %<br />
CKD Corp 5 569 423 0,30 %<br />
Clarion Co Ltd 4 000 350 0,30 %<br />
Cleanup Corp 952 255 0,07 %<br />
CMIC Co Ltd 591 436 0,04 %<br />
CMK Corp/Japan 3 050 282 0,23 %<br />
Coca-Cola Central Japan Co Ltd 3 108 114 0,07 %<br />
Coca-Cola West Co Ltd 37 048 717 0,22 %<br />
Cocokara fi ne holdings Inc 3 347 567 0,15 %<br />
Colowide Co Ltd 2 011 762 0,08 %<br />
Commuture Corp 1 776 672 0,09 %<br />
Computer Engineering & Consulting Ltd 2 053 033 0,17 %<br />
COMSYS <strong>Holding</strong>s Corp 24 269 132 0,26 %<br />
Corona Corp 1 052 068 0,05 %<br />
Cosel Co Ltd 20 852 262 0,96 %<br />
Cosmo Oil Co Ltd 67 599 888 0,38 %<br />
Cosmos Pharmaceutical Corp 1 065 957 0,05 %<br />
13<br />
GOVERNMENT PENSION FUND <strong>–</strong> GLOBAL ANNUAL REPORT 2008
<strong>Government</strong> <strong>Pension</strong> <strong>Fund</strong> <strong>–</strong> <strong>Global</strong> <strong>Holding</strong> <strong>of</strong> equities at 31 December 2008<br />
Market value<br />
Voting<br />
(per cent)<br />
Create SD Co Ltd 15 018 126 0,45 %<br />
Credit Saison Co Ltd 87 165 879 0,51 %<br />
Creed Corp 331 645 0,17 %<br />
Creed Offi ce Investment Corp 6 853 175 0,72 %<br />
Cross Plus Inc 13 768 608 1,96 %<br />
CSK <strong>Holding</strong>s Corp 11 673 918 0,39 %<br />
Culture Convenience Club Co Ltd 188 921 648 1,39 %<br />
CyberAgent Inc 85 598 738 3,10 %<br />
Cybernet Systems Co Ltd 652 481 0,07 %<br />
Cybozu Inc 773 279 0,11 %<br />
Dai Nippon Printing Co Ltd 178 268 810 0,34 %<br />
Dai Nippon Toryo Co Ltd 1 305 411 0,11 %<br />
Daibiru Corp 13 480 105 0,16 %<br />
Daicel Chemical Industries Ltd 47 741 980 0,40 %<br />
Dai-Dan Co Ltd 2 157 404 0,12 %<br />
Daido Metal Co Ltd 1 427 455 0,17 %<br />
Daido Steel Co Ltd 26 229 679 0,29 %<br />
Daidoh Ltd 2 298 450 0,11 %<br />
Daiei Inc/The 15 994 635 0,30 %<br />
Daifuku Co Ltd 11 141 797 0,25 %<br />
Daihatsu Motor Co Ltd 170 134 345 0,66 %<br />
Daihen Corp 39 340 911 1,09 %<br />
Daiichi Chuo Kisen Kaisha 9 214 192 0,18 %<br />
Daiichi Jitsugyo Co Ltd 1 990 867 0,17 %<br />
Daiichi Sankyo Co Ltd 796 579 659 0,69 %<br />
Daiichikosho Co Ltd 2 360 399 0,05 %<br />
Daiken Corp 1 875 157 0,09 %<br />
Daikin Industries Ltd 529 379 744 1,01 %<br />
Daikoku Denki Co Ltd 1 087 539 0,07 %<br />
Daikyo Inc 3 562 690 0,17 %<br />
Daimei Telecom Engineering Corp 4 509 461 0,17 %<br />
Dainichiseika Color & Chemicals Manufacturing Co Ltd 1 641 419 0,09 %<br />
Dainippon Screen Manufacturing Co Ltd 12 515 259 0,37 %<br />
Dainippon Sumitomo Pharma Co Ltd 45 950 461 0,18 %<br />
Daio Paper Corp 20 909 900 0,19 %<br />
Daisan <strong>Bank</strong> Ltd/The 4 947 893 0,11 %<br />
Daiseki Co Ltd 30 303 148 0,52 %<br />
Daishi <strong>Bank</strong> Ltd/The 45 507 702 0,40 %<br />
Daiso Co Ltd 2 353 138 0,11 %<br />
Daisyo Corp 1 673 297 0,08 %<br />
Daito Trust Construction Co Ltd 166 228 884 0,37 %<br />
Daiwa House Industry Co Ltd 148 912 162 0,37 %<br />
Daiwa Industries Ltd 2 093 601 0,17 %<br />
Daiwa Securities Group Inc 328 640 965 0,58 %<br />
Daiwabo Co Ltd 19 113 454 0,44 %<br />
DCM Japan <strong>Holding</strong>s Co Ltd 10 484 951 0,13 %<br />
Dena Co Ltd 39 410 553 0,37 %<br />
Denki Kagaku Kogyo K K 45 407 672 0,54 %<br />
Denki Kogyo Co Ltd 5 181 477 0,17 %<br />
Denso Corp 252 346 297 0,25 %<br />
Dentsu Inc 86 024 564 0,23 %<br />
Denyo Co Ltd 2 290 370 0,18 %<br />
Descente Ltd 4 300 518 0,17 %<br />
DIC Corp 58 633 031 0,51 %<br />
Digital Arts Inc 7 591 165 1,06 %<br />
Disco Corp 48 665 159 1,01 %<br />
Don Quijote Co Ltd 58 838 418 0,59 %<br />
Doshisha Co Ltd 24 473 456 1,38 %<br />
Doutor Nichires <strong>Holding</strong>s Co Ltd 48 084 075 0,62 %<br />
Dowa <strong>Holding</strong>s Co Ltd 38 114 105 0,50 %<br />
Dream Incubator Inc 839 093 0,18 %<br />
DTS Corp 5 210 211 0,32 %<br />
Duskin Co Ltd 27 044 250 0,33 %<br />
Dwango Co Ltd 6 204 718 0,24 %<br />
Dydo Drinco Inc 8 878 184 0,24 %<br />
eAccess Ltd 41 200 943 0,67 %<br />
Eagle Industry Co Ltd 1 094 923 0,09 %<br />
Earth Chemical Co Ltd 11 442 428 0,28 %<br />
East Japan Railway Co 1 324 234 835 0,62 %<br />
Ebara Corp 25 967 326 0,39 %<br />
EDION Corp 13 842 916 0,39 %<br />
Ehime <strong>Bank</strong> Ltd/The 7 639 666 0,18 %<br />
Eighteenth <strong>Bank</strong> Ltd/The 7 948 098 0,17 %<br />
Eiken Chemical Co Ltd 1 440 185 0,12 %<br />
Eisai Co Ltd 694 609 749 0,82 %<br />
Eizo Nanao Corp 1 747 242 0,07 %<br />
Electric Power Development Co Ltd 297 096 087 0,66 %<br />
Elpida Memory Inc 23 920 131 0,44 %<br />
Enplas Corp 2 746 553 0,17 %<br />
EPS Co Ltd 12 014 414 0,45 %<br />
Epson Toyocom Corp 3 405 500 0,14 %<br />
ESPEC Corp 1 759 338 0,17 %<br />
Exedy Corp 18 937 479 0,57 %<br />
Ezaki Glico Co Ltd 36 453 558 0,35 %<br />
FamilyMart Co Ltd 207 699 897 0,70 %<br />
Fancl Corp 13 947 766 0,23 %<br />
Fanuc Ltd 542 268 346 0,47 %<br />
Fast Retailing Co Ltd 266 960 892 0,25 %<br />
FCC Co Ltd 4 646 575 0,15 %<br />
FDK Corp 740 917 0,07 %<br />
Fields Corp 37 472 049 0,96 %<br />
Market value<br />
Voting<br />
(per cent)<br />
Foster Electric Co Ltd 12 939 881 1,01 %<br />
FP Corp 18 963 525 0,25 %<br />
France Bed <strong>Holding</strong>s Co Ltd 2 750 400 0,10 %<br />
Freebit Co Ltd 4 974 465 0,30 %<br />
Frontier Real Estate Investment Corp 41 600 121 0,68 %<br />
Fudo Tetra Corp 849 892 0,11 %<br />
Fuji Co Ltd/Ehime 4 407 499 0,09 %<br />
Fuji Electric <strong>Holding</strong>s Co Ltd 27 655 862 0,36 %<br />
Fuji Electronics Co Ltd 1 070 360 0,11 %<br />
Fuji Fire & Marine Insurance Co Ltd/The 7 026 972 0,14 %<br />
Fuji Heavy Industries Ltd 53 379 597 0,37 %<br />
Fuji Kyuko Co Ltd 2 253 340 0,06 %<br />
Fuji Media <strong>Holding</strong>s Inc 46 693 842 0,20 %<br />
Fuji Oil Co Ltd 25 025 034 0,29 %<br />
Fuji Seal International Inc 25 119 789 0,75 %<br />
Fuji S<strong>of</strong>t Inc 20 261 181 0,39 %<br />
Fujibo <strong>Holding</strong>s Inc 12 954 696 1,71 %<br />
Fujicco Co Ltd 3 190 146 0,10 %<br />
FUJIFILM <strong>Holding</strong>s Corp 523 034 230 0,67 %<br />
Fujikura Kasei Co Ltd 1 716 515 0,15 %<br />
Fujikura Ltd 39 832 178 0,49 %<br />
Fujimi Inc 9 672 492 0,39 %<br />
Fujimori Kogyo Co Ltd 1 559 325 0,17 %<br />
Fujita Kanko Inc 3 045 315 0,07 %<br />
Fujitec Co Ltd 3 991 931 0,17 %<br />
Fujitsu Business Systems Ltd 2 633 825 0,09 %<br />
Fujitsu Frontech Ltd 456 739 0,03 %<br />
Fujitsu General Ltd 1 238 827 0,09 %<br />
Fujitsu Ltd 275 242 784 0,40 %<br />
Fujiya Co Ltd 3 207 139 0,13 %<br />
Fukuda Corp 378 337 0,07 %<br />
Fukui <strong>Bank</strong> Ltd/The 15 356 034 0,25 %<br />
Fukuoka Financial Group Inc 131 436 084 0,51 %<br />
Fukushima <strong>Bank</strong> Ltd/The 2 225 764 0,25 %<br />
Fukuyama Transporting Co Ltd 17 920 695 0,19 %<br />
Funai Electric Co Ltd 26 219 740 0,51 %<br />
Furukawa Co Ltd 7 261 097 0,26 %<br />
Furukawa Electric Co Ltd 113 230 330 0,48 %<br />
Furukawa-Sky Aluminum Corp 2 099 317 0,06 %<br />
Furuno Electric Co Ltd 1 558 985 0,11 %<br />
Furusato Industries Ltd 2 005 374 0,16 %<br />
Furuya Metal Co Ltd 27 183 288 1,52 %<br />
Fuso Pharmaceutical Industries Ltd 1 584 954 0,08 %<br />
Futaba Corp/Chiba 10 652 647 0,26 %<br />
Futaba Industrial Co Ltd 5 730 954 0,30 %<br />
Future Architect Inc 1 465 304 0,11 %<br />
Fuyo General Lease Co Ltd 9 158 639 0,23 %<br />
Gakken Co Ltd 1 335 536 0,12 %<br />
Gecoss Corp 550 590 0,04 %<br />
Geo Corp 13 824 532 0,42 %<br />
Glory Ltd 24 435 684 0,25 %<br />
GMO internet Inc 36 569 076 1,04 %<br />
Godo Steel Ltd 9 271 661 0,28 %<br />
Goldcrest Co Ltd 188 022 436 3,08 %<br />
Gold-Price-Linked exchange Traded <strong>Fund</strong> - Goldlink ETF 5 428 655 0,00 %<br />
Gourmet Kineya Co Ltd 544 565 0,04 %<br />
Green Hospital Supply Inc 1 722 555 0,17 %<br />
GS Yuasa Corp 42 564 889 0,28 %<br />
Gulliver International Co Ltd 1 439 217 0,11 %<br />
Gun-Ei Chemical Industry Co Ltd 1 421 585 0,10 %<br />
Gunma <strong>Bank</strong> Ltd/The 83 067 384 0,38 %<br />
Gunze Ltd 18 213 030 0,35 %<br />
H2O Retailing Corp 27 291 969 0,25 %<br />
Hachijuni <strong>Bank</strong> Ltd/The 86 086 899 0,41 %<br />
Hakuhodo DY <strong>Holding</strong>s Inc 76 964 117 0,52 %<br />
Hakuto Co Ltd 1 701 476 0,11 %<br />
Hamakyorex Co Ltd 1 201 519 0,10 %<br />
Hamamatsu Photonics KK 123 198 292 1,12 %<br />
Hankyu Hanshin <strong>Holding</strong>s Inc 353 286 699 0,70 %<br />
Hanwa Co Ltd 18 167 611 0,40 %<br />
Haruyama Trading Co Ltd 127 915 0,02 %<br />
Haseko Corp 221 325 683 2,35 %<br />
Heian Ceremony Service Co Ltd 6 182 549 1,25 %<br />
Heiwa Corp 22 058 353 0,22 %<br />
Heiwa Real Estate Co Ltd 9 566 962 0,36 %<br />
Heiwado Co Ltd 9 978 514 0,15 %<br />
Hibiya Engineering Ltd 3 971 461 0,18 %<br />
Higashi-Nippon <strong>Bank</strong> Ltd/The 8 596 401 0,19 %<br />
Higo <strong>Bank</strong> Ltd/The 39 286 686 0,38 %<br />
Hikari Tsushin Inc 26 997 116 0,36 %<br />
Hino Motors Ltd 15 091 680 0,19 %<br />
Hioki EE Corp 1 199 201 0,06 %<br />
Hirano Tecseed Co Ltd/Kinzoku 19 440 966 2,75 %<br />
Hirose Electric Co Ltd 103 609 928 0,37 %<br />
Hiroshima <strong>Bank</strong> Ltd/The 70 760 063 0,38 %<br />
HIS Co Ltd 34 360 035 0,70 %<br />
Hisaka Works Ltd 7 273 224 0,24 %<br />
Hisamitsu Pharmaceutical Co Inc 62 733 409 0,23 %<br />
Hitachi Cable Ltd 12 204 432 0,21 %<br />
Hitachi Capital Corp 16 333 470 0,15 %<br />
Hitachi Chemical Co Ltd 38 642 677 0,26 %<br />
14<br />
GOVERNMENT PENSION FUND <strong>–</strong> GLOBAL ANNUAL REPORT 2008
<strong>Government</strong> <strong>Pension</strong> <strong>Fund</strong> <strong>–</strong> <strong>Global</strong> <strong>Holding</strong> <strong>of</strong> equities at 31 December 2008<br />
Market value<br />
Voting<br />
(per cent)<br />
Hitachi Construction Machinery Co Ltd 33 490 554 0,19 %<br />
Hitachi High-Technologies Corp 24 960 026 0,17 %<br />
Hitachi Information Systems Ltd 9 241 320 0,15 %<br />
Hitachi Koki Co Ltd 27 094 551 0,38 %<br />
Hitachi Kokusai Electric Inc 10 208 467 0,27 %<br />
Hitachi Ltd 332 290 193 0,37 %<br />
Hitachi Maxell Ltd 9 638 675 0,15 %<br />
Hitachi Medical Corp 1 916 637 0,07 %<br />
Hitachi Metals Ltd 19 699 822 0,17 %<br />
Hitachi Plant Technologies Ltd 8 616 638 0,17 %<br />
Hitachi S<strong>of</strong>tware Engineering Co Ltd 9 611 639 0,14 %<br />
Hitachi Systems & Services Ltd 1 486 160 0,08 %<br />
Hitachi Tool Engineering Ltd 1 314 170 0,09 %<br />
Hitachi Transport System Ltd 12 067 442 0,10 %<br />
Hitachi Zosen Corp 20 262 332 0,41 %<br />
Hochiki Corp 1 482 143 0,09 %<br />
Hodogaya Chemical Co Ltd 1 275 440 0,11 %<br />
Hogy Medical Co Ltd 157 465 604 2,02 %<br />
Hokkaido Electric Power Co Inc 179 035 411 0,47 %<br />
Hokkaido Gas Co Ltd 1 162 356 0,08 %<br />
Hokkan <strong>Holding</strong>s Ltd 1 418 031 0,10 %<br />
Hokkoku <strong>Bank</strong> Ltd/The 33 412 801 0,40 %<br />
Hokuetsu <strong>Bank</strong> Ltd/The 4 233 702 0,11 %<br />
Hokuetsu Paper Mills Ltd 11 429 374 0,13 %<br />
Hokuhoku Financial Group Inc 90 985 779 0,40 %<br />
Hokuriku Electric Industry Co Ltd 3 413 842 0,27 %<br />
Hokuriku Electric Power Co 164 238 342 0,38 %<br />
Hokuto Corp 42 624 366 0,65 %<br />
Honda Motor Co Ltd 1 164 452 934 0,43 %<br />
Honeys Co Ltd 42 391 740 2,26 %<br />
Horiba Ltd 26 486 430 0,65 %<br />
Hosiden Corp 25 759 077 0,33 %<br />
Hosokawa Micron Corp 1 989 168 0,17 %<br />
House Foods Corp 32 327 549 0,24 %<br />
HOYA Corp 222 446 699 0,43 %<br />
Hurxley Corp 294 559 0,04 %<br />
Hyakugo <strong>Bank</strong> Ltd/The 43 251 195 0,40 %<br />
Hyakujushi <strong>Bank</strong> Ltd/The 46 798 978 0,39 %<br />
Ibiden Co Ltd 78 260 645 0,37 %<br />
IBJ Leasing Co Ltd 27 636 273 0,60 %<br />
Ichibanya Co Ltd 1 199 201 0,05 %<br />
Ichikoh Industries Ltd 612 539 0,06 %<br />
Ichiyoshi Securities Co Ltd 4 482 271 0,18 %<br />
Icom Inc 1 981 289 0,09 %<br />
Idec Corp/Japan 4 620 289 0,17 %<br />
Idemitsu Kosan Co Ltd 43 676 419 0,25 %<br />
IHI Corp 49 485 421 0,39 %<br />
Iida Home Max 497 060 0,05 %<br />
Iino Kaiun Kaisha Ltd 8 632 535 0,18 %<br />
Inaba Denki Sangyo Co Ltd 15 930 724 0,36 %<br />
Inaba Seisakusho Co Ltd 942 368 0,07 %<br />
Inabata & Co Ltd 2 404 953 0,17 %<br />
Inageya Co Ltd 1 025 404 0,03 %<br />
Ines Corp 3 004 955 0,18 %<br />
Information Services International-Dentsu Ltd 1 326 004 0,09 %<br />
INPEX Corp 374 283 371 0,29 %<br />
Internet Initiative Japan Inc 6 714 014 0,41 %<br />
Inui Steamship Co Ltd 6 409 243 0,42 %<br />
Invoice Inc 621 927 0,17 %<br />
Iseki & Co Ltd 16 037 628 0,33 %<br />
Isetan Mitsukoshi <strong>Holding</strong>s Ltd 91 370 884 0,40 %<br />
Ishihara Sangyo Kaisha Ltd 78 000 227 3,33 %<br />
Isuzu Motors Ltd 55 644 101 0,38 %<br />
IT <strong>Holding</strong>s Corp 58 663 734 0,63 %<br />
Ito En Ltd 40 270 676 0,41 %<br />
ITOCHU Corp 203 519 409 0,38 %<br />
Itochu Enex Co Ltd 5 348 090 0,09 %<br />
Itochu Techno-Solutions Corp 21 186 895 0,19 %<br />
Itochu-Shokuhin Co Ltd 1 827 884 0,05 %<br />
Itoham Foods Inc 8 510 274 0,16 %<br />
Itoki Corp 1 956 788 0,17 %<br />
Iwai Securities Co Ltd 3 186 477 0,23 %<br />
Iwasaki Electric Co Ltd 1 625 043 0,17 %<br />
IWATANI Corp 10 220 208 0,24 %<br />
Iyo <strong>Bank</strong> Ltd/The 107 153 063 0,39 %<br />
Izumi Co Ltd 35 522 236 0,26 %<br />
Izumiya Co Ltd 10 537 214 0,27 %<br />
J Front Retailing Co Ltd 74 904 821 0,49 %<br />
Jaccs Co Ltd 52 192 950 2,29 %<br />
Jafco Co Ltd 63 315 707 0,75 %<br />
Jalux Inc 707 934 0,05 %<br />
Janome Sewing Machine Co Ltd 1 006 170 0,17 %<br />
Japan Airlines Corp 75 776 858 0,17 %<br />
Japan Airport Terminal Co Ltd 22 532 858 0,24 %<br />
Japan Asia Investment Co Ltd 23 798 643 3,95 %<br />
Japan Aviation Electronics Industry Ltd 4 511 314 0,17 %<br />
Japan Cash Machine Co Ltd 2 017 902 0,10 %<br />
Japan Digital Laboratory Co Ltd 2 863 762 0,11 %<br />
Japan General Estate Co Ltd/The 646 356 0,17 %<br />
Japan Petroleum Exploration Co 43 199 056 0,25 %<br />
Japan Pulp & Paper Co Ltd 1 884 890 0,06 %<br />
Market value<br />
Voting<br />
(per cent)<br />
Japan Pure Chemical Co Ltd 1 643 087 0,17 %<br />
Japan Radio Co Ltd 4 075 971 0,28 %<br />
Japan Retail <strong>Fund</strong> Investment Corp 10 497 743 0,09 %<br />
Japan Securities Finance Co Ltd 50 418 480 1,62 %<br />
Japan Steel Works Ltd/The 133 772 938 0,38 %<br />
Japan Tobacco Inc 1 469 905 318 0,65 %<br />
Japan Transcity Corp 3 012 795 0,15 %<br />
Japan Vilene Co Ltd 3 575 358 0,17 %<br />
Japan Wind Development Co Ltd 27 470 942 1,05 %<br />
Japan Wool Textile Co Ltd/The 11 218 036 0,27 %<br />
JBCC <strong>Holding</strong>s Inc 2 237 088 0,18 %<br />
Jeol Ltd 2 888 897 0,17 %<br />
JFE <strong>Holding</strong>s Inc 344 239 508 0,31 %<br />
JFE Shoji <strong>Holding</strong>s Inc 3 286 468 0,07 %<br />
JGC Corp 229 366 543 0,88 %<br />
J-Oil Mills Inc 6 018 021 0,13 %<br />
Joint Corp 4 993 822 0,61 %<br />
Joshin Denki Co Ltd 6 764 577 0,20 %<br />
Joyo <strong>Bank</strong> Ltd/The 161 288 114 0,50 %<br />
JS Group Corp 293 139 600 0,88 %<br />
JSP Corp 14 230 368 0,93 %<br />
JSR Corp 76 216 962 0,39 %<br />
JTEKT Corp 87 134 550 0,51 %<br />
Juki Corp 2 952 468 0,32 %<br />
Jupiter Telecommunications Co Ltd 256 786 758 0,51 %<br />
Juroku <strong>Bank</strong> Ltd/The 46 670 368 0,39 %<br />
JVC KENWOOD <strong>Holding</strong>s Inc 7 613 712 0,25 %<br />
kabu.com Securities Co Ltd 15 487 888 0,19 %<br />
Kadokawa Group <strong>Holding</strong>s Inc 7 071 001 0,16 %<br />
Kaga Electronics Co Ltd 4 084 677 0,17 %<br />
Kagawa <strong>Bank</strong> Ltd/The 5 121 845 0,17 %<br />
Kagome Co Ltd 34 448 818 0,29 %<br />
Kagoshima <strong>Bank</strong> Ltd/The 48 166 183 0,40 %<br />
Kajima Corp 94 512 419 0,37 %<br />
Kakaku.com Inc 155 674 179 2,02 %<br />
Kaken Pharmaceutical Co Ltd 45 255 580 0,58 %<br />
Kameda Seika Co Ltd 1 135 939 0,05 %<br />
Kamei Corp 674 334 0,05 %<br />
Kamigumi Co Ltd 73 043 528 0,43 %<br />
Kanaden Corp 594 387 0,04 %<br />
Kanagawa Chuo Kotsu Co Ltd 550 281 0,02 %<br />
Kanamoto Co Ltd 1 410 153 0,17 %<br />
Kandenko Co Ltd 24 280 474 0,22 %<br />
Kaneka Corp 38 228 138 0,25 %<br />
Kanematsu Corp 7 076 099 0,25 %<br />
Kanematsu Electronics Ltd 13 749 413 0,80 %<br />
Kansai Electric Power Co Inc/The 257 344 269 0,13 %<br />
Kansai Paint Co Ltd 37 605 873 0,39 %<br />
Kansai Urban <strong>Bank</strong>ing Corp 7 957 908 0,16 %<br />
Kanto Auto Works Ltd 8 230 298 0,15 %<br />
Kanto Denka Kogyo Co Ltd 5 004 590 0,33 %<br />
Kanto Natural Gas Development Ltd 18 327 736 0,68 %<br />
Kanto Tsukuba <strong>Bank</strong> Ltd/The 5 470 745 0,41 %<br />
Kao Corp 588 981 794 0,52 %<br />
Kappa Create Co Ltd 38 385 489 0,99 %<br />
Kasumi Co Ltd 2 687 292 0,11 %<br />
Katakura Industries Co Ltd 2 947 849 0,10 %<br />
Kato Sangyo Co Ltd 4 795 763 0,11 %<br />
Kato Works Co Ltd 1 691 627 0,17 %<br />
Kawasaki Heavy Industries Ltd 85 962 506 0,37 %<br />
Kawasaki Kisen Kaisha Ltd 75 016 297 0,37 %<br />
Kayaba Industry Co Ltd 6 589 776 0,22 %<br />
KDDI Corp 656 674 163 0,30 %<br />
Keihan Electric Railway Co Ltd 90 701 102 0,50 %<br />
Keihanshin Real Estate Co Ltd 5 600 212 0,37 %<br />
Keihin Corp 8 160 826 0,22 %<br />
Keihin Electric Express Railway Co Ltd 123 259 695 0,37 %<br />
Keio Corp 99 676 135 0,37 %<br />
Keisei Electric Railway Co Ltd 56 159 700 0,38 %<br />
Keiyo <strong>Bank</strong> Ltd/The 27 205 225 0,26 %<br />
Keiyo Co Ltd 2 663 386 0,09 %<br />
Kenedix Inc 19 597 667 1,58 %<br />
Kenedix Realty Investment Corp 40 275 284 1,05 %<br />
Kentucky Fried Chicken Japan Ltd 602 884 0,02 %<br />
KEY C<strong>of</strong>fee Inc 2 379 864 0,09 %<br />
Keyence Corp 606 816 801 0,86 %<br />
Kikkoman Corp 59 630 766 0,35 %<br />
Kinden Corp 63 003 700 0,38 %<br />
Kinki Nippon Tourist Co Ltd 1 101 180 0,09 %<br />
Kinki Sharyo Co Ltd 2 248 242 0,09 %<br />
Kintetsu Corp 205 530 256 0,38 %<br />
Kintetsu World Express Inc 38 784 257 0,79 %<br />
Kirin <strong>Holding</strong>s Co Ltd 301 678 537 0,34 %<br />
Kisoji Co Ltd 3 870 497 0,10 %<br />
Kissei Pharmaceutical Co Ltd 28 145 430 0,23 %<br />
Kitagawa Iron Works Co Ltd 1 903 274 0,23 %<br />
Kita-Nippon <strong>Bank</strong> Ltd/The 3 151 524 0,17 %<br />
Kitano Construction Corp 1 293 670 0,10 %<br />
Kitz Corp 6 907 400 0,27 %<br />
Kiyo <strong>Holding</strong>s Inc 25 386 996 0,32 %<br />
Koa Corp 2 925 171 0,18 %<br />
15<br />
GOVERNMENT PENSION FUND <strong>–</strong> GLOBAL ANNUAL REPORT 2008
<strong>Government</strong> <strong>Pension</strong> <strong>Fund</strong> <strong>–</strong> <strong>Global</strong> <strong>Holding</strong> <strong>of</strong> equities at 31 December 2008<br />
Market value<br />
Voting<br />
(per cent)<br />
Koatsu Gas Kogyo Co Ltd 3 654 378 0,17 %<br />
Kobayashi Pharmaceutical Co Ltd 29 542 760 0,23 %<br />
Kobe Steel Ltd 122 932 258 0,32 %<br />
Koei Co Ltd 8 029 227 0,16 %<br />
Kohnan Shoji Co Ltd 6 455 241 0,22 %<br />
Koito Manufacturing Co Ltd 78 028 035 1,14 %<br />
Kojima Co Ltd 939 710 0,11 %<br />
Kokuyo Co Ltd 20 994 134 0,32 %<br />
Komatsu Ltd 494 128 767 0,57 %<br />
Komatsu Seiren Co Ltd 1 160 811 0,08 %<br />
Komehyo Co Ltd 3 003 217 1,15 %<br />
Komeri Co Ltd 33 791 756 0,37 %<br />
Komori Corp 13 274 584 0,26 %<br />
Konaka Co Ltd 1 037 500 0,17 %<br />
Konami Corp 97 232 868 0,38 %<br />
Konica Minolta <strong>Holding</strong>s Inc 106 731 147 0,38 %<br />
Konishi Co Ltd 1 499 554 0,11 %<br />
Kosaido Co Ltd 419 624 0,08 %<br />
Kose Corp 20 105 489 0,19 %<br />
Kourakuen Corp 931 059 0,06 %<br />
Ks <strong>Holding</strong>s Corp 35 794 712 0,61 %<br />
Kubota Corp 319 769 179 0,51 %<br />
Kumagai Gumi Co Ltd 643 050 0,10 %<br />
Kumiai Chemical Industry Co Ltd 2 087 653 0,11 %<br />
Kurabo Industries Ltd 8 160 053 0,29 %<br />
Kuraray Co Ltd 103 924 441 0,51 %<br />
KUREHA Corp 15 089 854 0,24 %<br />
Kurimoto Ltd 423 834 0,07 %<br />
Kurita Water Industries Ltd 92 292 101 0,38 %<br />
Kuroda Electric Co Ltd 6 023 351 0,29 %<br />
Kyocera Corp 467 519 307 0,50 %<br />
Kyoden Co Ltd 4 951 910 1,30 %<br />
Kyodo Printing Co Ltd 2 145 508 0,14 %<br />
Kyoei Steel Ltd 7 819 975 0,13 %<br />
Kyokuto Kaihatsu Kogyo Co Ltd 1 849 512 0,17 %<br />
Kyokuto Securities Co Ltd 1 760 057 0,15 %<br />
Kyokuyo Co Ltd 2 647 589 0,15 %<br />
Kyorin Co Ltd 14 610 096 0,20 %<br />
Kyoritsu Maintenance Co Ltd 1 579 941 0,09 %<br />
Kyosan Electric Manufacturing Co Ltd 2 810 109 0,17 %<br />
Kyoto Kimono Yuzen Co Ltd 578 119 0,07 %<br />
Kyowa Exeo Corp 30 657 303 0,35 %<br />
kyowa Hakko Kirin Co Ltd 77 284 414 0,19 %<br />
Kyudenko Corp 12 263 137 0,26 %<br />
Kyushu Electric Power Co Inc 369 444 975 0,42 %<br />
Lawson Inc 150 990 522 0,38 %<br />
Leopalace21 Corp 72 510 998 0,65 %<br />
Life Corp 2 587 919 0,03 %<br />
Lintec Corp 19 064 830 0,26 %<br />
Lion Corp 39 111 344 0,35 %<br />
Mabuchi Motor Co Ltd 47 970 140 0,37 %<br />
Mac House Co Ltd 14 555 924 2,35 %<br />
Macnica Inc 18 377 975 1,08 %<br />
Macromill Inc 886 737 0,08 %<br />
Maeda Corp 15 349 777 0,30 %<br />
Maeda Road Construction Co Ltd 18 234 194 0,28 %<br />
Maezawa Kasei Industries Co Ltd 1 821 396 0,17 %<br />
Maezawa Kyuso Industries Co Ltd 1 634 112 0,09 %<br />
Makino Milling Machine Co Ltd 7 981 853 0,36 %<br />
Makita Corp 80 845 922 0,37 %<br />
Mandom Corp 11 548 174 0,24 %<br />
Mars Engineering Corp 21 111 042 0,40 %<br />
Marubeni Corp 170 507 102 0,38 %<br />
Marubun Corp 1 427 455 0,17 %<br />
Marudai Food Co Ltd 3 928 051 0,15 %<br />
Maruetsu Inc/The 11 399 249 0,20 %<br />
Maruha Nichiro <strong>Holding</strong>s Inc 13 895 409 0,23 %<br />
Marui Group Co Ltd 46 152 035 0,36 %<br />
Maruichi Steel Tube Ltd 57 779 242 0,32 %<br />
Marusan Securities Co Ltd 7 196 560 0,28 %<br />
Maruzen Showa Unyu Co Ltd 1 271 733 0,06 %<br />
Maspro Denkoh Corp 1 536 461 0,11 %<br />
Matsuda Sangyo Co Ltd 2 593 027 0,13 %<br />
Matsui Securities Co Ltd 30 997 273 0,20 %<br />
Matsumotokiyoshi <strong>Holding</strong>s Co Ltd 30 848 680 0,40 %<br />
Matsuya Co Ltd 11 142 770 0,14 %<br />
Matsuya Foods Co Ltd 1 539 272 0,08 %<br />
Max Co Ltd 11 984 289 0,29 %<br />
Mazda Motor Corp 31 190 049 0,19 %<br />
McDonalds <strong>Holding</strong>s Co Japan Ltd 1 112 303 0,01 %<br />
MCJ Co Ltd 1 841 423 1,62 %<br />
MEC Co Ltd/Japan 304 925 0,07 %<br />
Mediceo Paltac <strong>Holding</strong>s Co Ltd 69 994 861 0,35 %<br />
Megachips Corp 10 153 825 0,33 %<br />
Megane TOP Co Ltd 59 499 964 3,28 %<br />
Meidensha Corp 10 216 037 0,21 %<br />
Meiji Dairies Corp 45 599 004 0,37 %<br />
Meiji Seika Kaisha Ltd 47 738 796 0,37 %<br />
Meiko Electronics Co 4 878 297 0,42 %<br />
Meisei Industrial Co Ltd 973 265 0,09 %<br />
Meitec Corp 14 793 348 0,35 %<br />
Market value<br />
Voting<br />
(per cent)<br />
Meiwa Estate Co Ltd 823 799 0,09 %<br />
Melco <strong>Holding</strong>s Inc 3 106 136 0,19 %<br />
Mercian Corp 1 223 687 0,07 %<br />
Message Co Ltd 27 209 705 1,70 %<br />
Michinoku <strong>Bank</strong> Ltd/The 4 113 203 0,17 %<br />
Micronics Japan Co Ltd 14 089 940 1,23 %<br />
MID Reit Inc 8 058 146 0,33 %<br />
Mie <strong>Bank</strong> Ltd/The 4 325 467 0,11 %<br />
Mikuni Coca-Cola Bottling Co Ltd 5 603 711 0,16 %<br />
Milbon Co Ltd 3 283 108 0,13 %<br />
Mimasu Semiconductor Industry Co Ltd 3 594 592 0,16 %<br />
Minato <strong>Bank</strong> Ltd/The 4 198 093 0,10 %<br />
Minebea Co Ltd 44 668 223 0,47 %<br />
Ministop Co Ltd 14 829 351 0,35 %<br />
Miraca <strong>Holding</strong>s Inc 21 037 947 0,24 %<br />
Miraial Co Ltd 2 982 362 0,44 %<br />
Misawa Homes Co Ltd 1 280 307 0,17 %<br />
MISUMI Group Inc 36 527 380 0,50 %<br />
Mito Securities Co Ltd 2 888 975 0,17 %<br />
Mitsuba Corp 1 970 166 0,17 %<br />
Mitsubishi Cable Industries Ltd 1 545 406 0,11 %<br />
Mitsubishi Chemical <strong>Holding</strong>s Corp 175 374 692 0,38 %<br />
Mitsubishi Corp 646 173 686 0,40 %<br />
Mitsubishi Electric Corp 417 767 981 0,46 %<br />
Mitsubishi Estate Co Ltd 1 099 448 141 0,71 %<br />
Mitsubishi Gas Chemical Co Inc 52 599 112 0,39 %<br />
Mitsubishi Heavy Industries Ltd 512 950 800 0,50 %<br />
Mitsubishi Kakoki Kaisha Ltd 2 513 109 0,17 %<br />
Mitsubishi Logistics Corp 56 056 505 0,37 %<br />
Mitsubishi Materials Corp 95 063 913 0,43 %<br />
Mitsubishi Motors Corp 196 684 400 0,38 %<br />
Mitsubishi Paper Mills Ltd 8 849 990 0,16 %<br />
Mitsubishi Pencil Co Ltd 3 272 186 0,11 %<br />
Mitsubishi Rayon Co Ltd 80 581 366 0,65 %<br />
Mitsubishi Steel Manufacturing Co Ltd 7 351 394 0,26 %<br />
Mitsubishi Tanabe Pharma Corp 80 636 153 0,14 %<br />
Mitsubishi UFJ Financial Group Inc 2 828 550 307 0,58 %<br />
Mitsubishi UFJ Lease & Finance Co Ltd 39 324 431 0,25 %<br />
Mitsuboshi Belting Co Ltd 4 836 817 0,17 %<br />
Mitsui & Co Ltd 583 012 966 0,46 %<br />
Mitsui Chemicals Inc 177 592 646 0,89 %<br />
Mitsui Engineering & Shipbuilding Co Ltd 33 960 276 0,36 %<br />
Mitsui Fudosan Co Ltd 698 721 212 0,70 %<br />
Mitsui High-Tec Inc 15 333 595 0,96 %<br />
Mitsui Home Co Ltd 2 041 693 0,09 %<br />
Mitsui Knowledge Industry Co Ltd 1 696 260 0,12 %<br />
Mitsui Matsushima Co Ltd 33 217 530 3,24 %<br />
Mitsui Mining & Smelting Co Ltd 36 046 548 0,44 %<br />
Mitsui Mining Co Ltd 5 118 446 0,17 %<br />
Mitsui OSK Lines Ltd 210 370 309 0,42 %<br />
Mitsui Sugar Co Ltd 9 087 513 0,24 %<br />
Mitsui Sumitomo Insurance Group <strong>Holding</strong>s Inc 776 732 671 0,86 %<br />
Mitsui-Soko Co Ltd 14 521 730 0,27 %<br />
Mitsumi Electric Co Ltd 52 352 133 0,51 %<br />
Mitsuuroko Co Ltd 2 139 174 0,07 %<br />
Miura Co Ltd 63 487 766 0,89 %<br />
Mixi Inc 85 433 653 1,32 %<br />
Miyazaki <strong>Bank</strong> Ltd/The 10 061 859 0,26 %<br />
Mizuho Financial Group Inc 1 101 813 874 0,50 %<br />
Mizuho Investors Securities Co Ltd 10 283 238 0,15 %<br />
Mizuho Trust & <strong>Bank</strong>ing Co Ltd 65 190 570 0,15 %<br />
Mizuno Corp 10 935 326 0,25 %<br />
Mochida Pharmaceutical Co Ltd 38 481 039 0,37 %<br />
Modec Inc 5 270 229 0,11 %<br />
Monex Group Inc 13 511 507 0,26 %<br />
Mori Seiki Co Ltd 19 155 243 0,37 %<br />
Morinaga & Co Ltd 10 568 266 0,26 %<br />
Morinaga Milk Industry Co Ltd 17 145 219 0,25 %<br />
Morita <strong>Holding</strong>s Corp 3 290 253 0,20 %<br />
Mory Industries Inc 776 913 0,11 %<br />
MOS Food Services Inc 6 205 104 0,19 %<br />
Moshi Moshi Hotline Inc 18 198 508 0,29 %<br />
Mr Max Corp 812 970 0,05 %<br />
MTI Ltd 19 735 649 1,84 %<br />
Murata Manufacturing Co Ltd 311 461 778 0,51 %<br />
Musashi Seimitsu Industry Co Ltd 4 454 293 0,24 %<br />
Musashino <strong>Bank</strong> Ltd/The 35 800 080 0,39 %<br />
Mutoh <strong>Holding</strong>s Co Ltd 23 616 272 2,64 %<br />
Nabtesco Corp 218 446 595 3,74 %<br />
Nachi-Fujikoshi Corp 7 591 466 0,23 %<br />
Nafco Co Ltd 12 841 249 0,50 %<br />
Nagaileben Co Ltd 5 004 590 0,18 %<br />
Nagano <strong>Bank</strong> Ltd/The 2 187 529 0,13 %<br />
Nagase & Co Ltd 15 205 023 0,16 %<br />
Nagatanien Co Ltd 1 104 347 0,04 %<br />
Nagoya Railroad Co Ltd 74 344 889 0,38 %<br />
Nakamuraya Co Ltd 1 575 762 0,07 %<br />
Nakanishi Inc 9 234 275 0,30 %<br />
Nakayama Steel Works Ltd 4 854 970 0,22 %<br />
Namco Bandai <strong>Holding</strong>s Inc 72 759 080 0,39 %<br />
Nanto <strong>Bank</strong> Ltd/The 56 136 836 0,50 %<br />
16<br />
GOVERNMENT PENSION FUND <strong>–</strong> GLOBAL ANNUAL REPORT 2008
<strong>Government</strong> <strong>Pension</strong> <strong>Fund</strong> <strong>–</strong> <strong>Global</strong> <strong>Holding</strong> <strong>of</strong> equities at 31 December 2008<br />
Market value<br />
Voting<br />
(per cent)<br />
NEC Capital Solutions Ltd 1 203 604 0,09 %<br />
NEC Corp 174 819 339 0,38 %<br />
NEC Electronics Corp 7 900 547 0,10 %<br />
NEC Fielding Ltd 3 485 493 0,07 %<br />
NEC Mobiling Ltd 1 638 916 0,10 %<br />
NEC Networks & System Integration Corp 7 274 460 0,17 %<br />
NEC Tokin Corp 9 434 335 0,30 %<br />
NET One Systems Co Ltd 21 405 733 0,28 %<br />
Neturen Co Ltd 1 475 052 0,07 %<br />
New Japan Radio Co Ltd 250 963 0,05 %<br />
NGK Insulators Ltd 97 841 837 0,38 %<br />
NGK Spark Plug Co Ltd 30 793 173 0,24 %<br />
NHK Spring Co Ltd 22 512 080 0,37 %<br />
Nice <strong>Holding</strong>s Inc 2 406 513 0,17 %<br />
Nichias Corp 66 506 664 3,09 %<br />
Nichicon Corp 14 096 243 0,41 %<br />
Nichiden Corp 3 170 063 0,10 %<br />
Nichiha Corp 1 384 044 0,09 %<br />
Nichii Gakkan Co 2 804 455 0,08 %<br />
Nichi-iko Pharmaceutical Co Ltd 14 511 495 0,22 %<br />
Nichirei Corp 38 770 315 0,38 %<br />
Nidec Copal Corp 2 062 626 0,07 %<br />
Nidec Copal Electronics Corp 2 224 451 0,09 %<br />
Nidec Corp 108 222 449 0,28 %<br />
Nidec Sankyo Corp 12 963 888 0,26 %<br />
Nidec-Tosok Corp 265 701 0,03 %<br />
Nifco Inc/Japan 9 492 345 0,25 %<br />
Nihon Dempa Kogyo Co Ltd 7 190 882 0,43 %<br />
Nihon Eslead Corp 666 146 0,11 %<br />
Nihon Kohden Corp 20 080 733 0,27 %<br />
Nihon Nohyaku Co Ltd 8 102 507 0,25 %<br />
Nihon Parkerizing Co Ltd 7 463 628 0,19 %<br />
Nihon Trim Co Ltd 11 793 498 1,50 %<br />
Nihon Unisys Ltd 12 540 595 0,20 %<br />
Nihon Yamamura Glass Co Ltd 2 387 687 0,14 %<br />
Nikkiso Co Ltd 4 884 863 0,17 %<br />
Nikon Corp 125 599 148 0,38 %<br />
Nintendo Co Ltd 1 988 307 124 0,54 %<br />
Nippo Corp 20 691 302 0,29 %<br />
Nippon Beet Sugar Manufacturing Co Ltd 8 041 949 0,28 %<br />
Nippon Carbon Co Ltd 10 725 997 0,44 %<br />
Nippon Ceramic Co Ltd 2 039 353 0,11 %<br />
Nippon Chemical Industrial Co Ltd 5 593 415 0,36 %<br />
Nippon Chemi-Con Corp 7 226 492 0,39 %<br />
Nippon Chemiphar Co Ltd 1 038 149 0,12 %<br />
Nippon Commercial Investment Corp 4 956 351 0,26 %<br />
Nippon Denko Co Ltd 8 911 398 0,23 %<br />
Nippon Densetsu Kogyo Co Ltd 26 077 319 0,49 %<br />
Nippon Denwa Shisetsu Co Ltd 1 051 821 0,08 %<br />
Nippon Electric Glass Co Ltd 45 024 254 0,25 %<br />
Nippon Express Co Ltd 127 412 620 0,42 %<br />
Nippon Filcon Co Ltd/Tokyo 473 007 0,06 %<br />
Nippon Flour Mills Co Ltd 14 576 418 0,22 %<br />
Nippon Gas Co Ltd 4 122 935 0,09 %<br />
Nippon Kanzai Co Ltd 2 529 083 0,09 %<br />
Nippon Kasei Chemical Co Ltd 906 527 0,07 %<br />
Nippon Kayaku Co Ltd 26 343 036 0,40 %<br />
Nippon Koei Co Ltd 2 402 110 0,17 %<br />
Nippon Konpo Unyu Soko Co Ltd 10 386 126 0,18 %<br />
Nippon Light Metal Co Ltd 12 409 127 0,33 %<br />
Nippon Meat Packers Inc 87 399 185 0,37 %<br />
Nippon Metal Industry Co Ltd 3 401 329 0,20 %<br />
Nippon Mining <strong>Holding</strong>s Inc 101 155 262 0,37 %<br />
Nippon Oil Corp 328 319 245 0,65 %<br />
Nippon Paint Co Ltd 26 412 565 0,36 %<br />
Nippon Paper Group Inc 97 919 560 0,32 %<br />
Nippon Parking Development Co Ltd 1 053 196 0,11 %<br />
Nippon Road Co Ltd/The 1 406 136 0,11 %<br />
Nippon Seiki Co Ltd 10 097 623 0,41 %<br />
Nippon Sharyo Ltd 1 371 886 0,04 %<br />
Nippon Sheet Glass Co Ltd 236 919 932 1,57 %<br />
Nippon Shinyaku Co Ltd 9 157 032 0,16 %<br />
Nippon Shokubai Co Ltd 72 418 232 0,73 %<br />
Nippon Signal Co Ltd 9 296 904 0,32 %<br />
Nippon Soda Co Ltd 17 659 350 0,42 %<br />
Nippon Steel Corp 477 788 409 0,31 %<br />
Nippon Steel Trading Co Ltd 537 458 0,04 %<br />
Nippon Suisan Kaisha Ltd 14 216 310 0,29 %<br />
Nippon Synthetic Chemical Industry Co Ltd/The 17 944 919 0,95 %<br />
Nippon Telegraph & Telephone Corp 1 448 740 901 0,25 %<br />
Nippon Television Network Corp 17 957 467 0,10 %<br />
Nippon Thompson Co Ltd 5 835 573 0,27 %<br />
Nippon Valqua Industries Ltd 2 843 633 0,17 %<br />
Nippon Yakin Kogyo Co Ltd 6 306 756 0,26 %<br />
Nippon Yusen KK 192 209 874 0,37 %<br />
Nipponkoa Insurance Co Ltd 224 902 753 0,52 %<br />
Nipro Corp 21 031 481 0,27 %<br />
NIS Group Co Ltd 1 189 816 0,15 %<br />
Nishimatsu Construction Co Ltd 8 150 576 0,28 %<br />
Nishimatsuya Chain Co Ltd 6 132 395 0,14 %<br />
Nishi-Nippon City <strong>Bank</strong> Ltd/The 60 844 889 0,38 %<br />
Market value<br />
Voting<br />
(per cent)<br />
Nishi-Nippon Railroad Co Ltd 45 706 604 0,39 %<br />
Nishio Rent All Co Ltd 15 976 220 1,17 %<br />
Nissan Chemical Industries Ltd 62 674 781 0,52 %<br />
Nissan Motor Co Ltd 140 372 626 0,13 %<br />
Nissan Shatai Co Ltd 7 353 557 0,11 %<br />
Nissay Dowa General Insurance Co Ltd 31 777 870 0,19 %<br />
Nissen <strong>Holding</strong>s Co Ltd 4 099 067 0,17 %<br />
Nissha Printing Co Ltd 88 862 713 0,72 %<br />
Nisshin Fudosan Co/Japan 332 254 0,09 %<br />
Nisshin Oillio Group Ltd/The 21 930 902 0,31 %<br />
Nisshin Seifun Group Inc 81 340 379 0,36 %<br />
Nisshin Steel Co Ltd 44 944 290 0,32 %<br />
Nisshinbo Industries Inc 39 449 669 0,41 %<br />
Nissho Electronics Corp 1 355 619 0,12 %<br />
Nissin Corp 2 126 352 0,11 %<br />
Nissin Electric Co Ltd 3 289 481 0,10 %<br />
Nissin Foods <strong>Holding</strong>s Co Ltd 111 293 301 0,36 %<br />
Nissin Kogyo Co Ltd 10 446 886 0,31 %<br />
Nitori Co Ltd 139 294 479 0,45 %<br />
Nitta Corp 31 801 198 1,15 %<br />
Nittetsu Mining Co Ltd 1 227 550 0,07 %<br />
Nitto Boseki Co Ltd 9 050 900 0,27 %<br />
Nitto Denko Corp 87 734 737 0,38 %<br />
Nitto Kogyo Corp 3 202 737 0,12 %<br />
Nitto Kohki Co Ltd 4 759 543 0,18 %<br />
Nitto Seiko Co Ltd 1 665 364 0,17 %<br />
Nittoku Engineering Co Ltd 5 968 091 0,88 %<br />
NOF Corp 13 839 517 0,25 %<br />
Nohmi Bosai Ltd 8 688 320 0,16 %<br />
NOK Corp 31 617 981 0,38 %<br />
Nomura Co Ltd 2 009 097 0,17 %<br />
Nomura <strong>Holding</strong>s Inc 1 003 866 563 0,91 %<br />
Nomura Real Estate <strong>Holding</strong>s Inc 39 651 738 0,20 %<br />
Nomura Research Institute Ltd 153 791 294 0,52 %<br />
Nomura TOPIX Exchange Traded <strong>Fund</strong> 20 450 149 0,00 %<br />
Noritake Co Ltd 4 518 730 0,11 %<br />
Noritsu Koki Co Ltd 1 654 388 0,09 %<br />
Noritz Corp 7 989 508 0,17 %<br />
Nosan Corp 803 330 0,04 %<br />
NPC Inc 3 379 160 0,11 %<br />
NS Solutions Corp 7 070 151 0,15 %<br />
NSD Co Ltd 7 076 331 0,26 %<br />
NSK Ltd 54 015 166 0,38 %<br />
NTN Corp 34 678 072 0,36 %<br />
NTT Data Corp 157 290 725 0,20 %<br />
NTT DoCoMo Inc 1 163 907 987 0,19 %<br />
NTT Urban Development Corp 55 498 112 0,23 %<br />
Obara Corp 921 033 0,11 %<br />
Obayashi Corp 111 279 105 0,38 %<br />
OBIC Business Consultants Ltd 4 084 236 0,07 %<br />
Obic Co Ltd 71 664 589 0,64 %<br />
Odakyu Electric Railway Co Ltd 169 233 955 0,38 %<br />
Oenon <strong>Holding</strong>s Inc 25 684 460 1,72 %<br />
Ogaki Kyoritsu <strong>Bank</strong> Ltd/The 57 674 286 0,59 %<br />
Ohara Inc 1 290 271 0,09 %<br />
Ohashi Technica Inc 792 886 0,09 %<br />
Oiles Corp 6 651 459 0,19 %<br />
Oita <strong>Bank</strong> Ltd/The 15 946 945 0,23 %<br />
OJI Paper Co Ltd 136 926 485 0,32 %<br />
Okamoto Industries Inc 6 066 684 0,19 %<br />
Okamura Corp 17 953 338 0,41 %<br />
Okasan Securities Group Inc 16 723 471 0,27 %<br />
Oki Electric Industry Co Ltd 11 112 831 0,37 %<br />
Okinawa Electric Power Co Inc/The 24 833 239 0,28 %<br />
OKUMA Corp 16 307 748 0,38 %<br />
Okumura Corp 37 519 129 0,47 %<br />
Okura Industrial Co Ltd 4 794 720 0,48 %<br />
Okuwa Co Ltd 4 307 083 0,09 %<br />
Olympic Corp 594 271 0,05 %<br />
Olympus Corp 139 444 001 0,38 %<br />
OMC Card Inc 5 047 290 0,14 %<br />
Omron Corp 110 790 459 0,50 %<br />
Ono Pharmaceutical Co Ltd 150 486 929 0,35 %<br />
Onoken Co Ltd 4 669 107 0,33 %<br />
Onward <strong>Holding</strong>s Co Ltd 35 392 391 0,38 %<br />
Optex Co Ltd 16 784 323 1,59 %<br />
Oracle Corp Japan 122 502 068 0,32 %<br />
Organo Corp 7 980 772 0,31 %<br />
Orient Corp 9 410 699 0,25 %<br />
Oriental Land Co Ltd 108 125 571 0,20 %<br />
Oriental Yeast Co Ltd 332 300 0,03 %<br />
Origin Electric Co Ltd 24 753 370 3,90 %<br />
ORIX Corp 446 133 064 1,26 %<br />
Orix JREIT Inc 34 780 624 0,42 %<br />
Osaka Gas Co Ltd 919 628 886 1,33 %<br />
Osaka Securities Exchange Co Ltd 224 273 594 2,72 %<br />
Osaka Steel Co Ltd 7 001 019 0,18 %<br />
OSAKA Titanium Technologies Co 9 997 284 0,16 %<br />
Osaki Electric Co Ltd 2 936 479 0,17 %<br />
OSG Corp 15 899 811 0,27 %<br />
Otsuka Corp 121 773 818 1,23 %<br />
17<br />
GOVERNMENT PENSION FUND <strong>–</strong> GLOBAL ANNUAL REPORT 2008
<strong>Government</strong> <strong>Pension</strong> <strong>Fund</strong> <strong>–</strong> <strong>Global</strong> <strong>Holding</strong> <strong>of</strong> equities at 31 December 2008<br />
Market value<br />
Voting<br />
(per cent)<br />
Otsuka Kagu Ltd 4 534 178 0,52 %<br />
Oyo Corp 4 982 158 0,17 %<br />
Pacifi c Golf Group International <strong>Holding</strong>s KK 3 133 519 0,11 %<br />
Pacifi c <strong>Holding</strong>s Co 1 346 535 0,12 %<br />
Pacifi c Industrial Co Ltd 1 192 481 0,11 %<br />
Pacifi c Metals Co Ltd 21 284 067 0,32 %<br />
Pack Corp/The 10 632 332 0,51 %<br />
Pal Co Ltd 529 062 0,07 %<br />
PanaHome Corp 13 060 989 0,19 %<br />
Panasonic Corp 1 104 221 155 0,52 %<br />
Panasonic Electric Works Co Ltd 68 964 598 0,15 %<br />
Panasonic Electric Works Information systems Co Ltd 682 583 0,05 %<br />
Paramount Bed Co Ltd 85 581 582 2,87 %<br />
Parco Co Ltd 10 489 123 0,20 %<br />
Paris Miki Inc 4 285 285 0,12 %<br />
Park24 Co Ltd 19 957 167 0,26 %<br />
Pasona Group Inc 1 089 207 0,07 %<br />
Pegasus Sewing Machine Manufacturing Co Ltd 3 870 605 1,05 %<br />
Penta-Ocean Construction Co Ltd 7 909 708 0,33 %<br />
Pigeon Corp 137 048 670 3,26 %<br />
Pilot Corp 4 467 749 0,17 %<br />
Piolax Inc 1 383 272 0,11 %<br />
Pioneer Corp 9 858 478 0,37 %<br />
Plenus Co Ltd 15 187 930 0,27 %<br />
Pocket Card Co Ltd 539 699 0,05 %<br />
Point Inc 263 470 662 2,66 %<br />
Press Kogyo Co Ltd 2 911 916 0,27 %<br />
Prima Meat Packers Ltd 10 582 170 0,34 %<br />
Privee <strong>Fund</strong> Group Co Ltd 128 0,00 %<br />
Promise Co Ltd 87 595 923 0,37 %<br />
Pronexus Inc 4 022 581 0,16 %<br />
QP Corp 52 434 521 0,35 %<br />
Radia <strong>Holding</strong>s Inc 382 249 0,27 %<br />
Raito Kogyo Co Ltd 2 958 169 0,41 %<br />
Rakuten Inc 481 316 784 0,84 %<br />
Rasa Industries Ltd 1 449 701 0,17 %<br />
Rengo Co Ltd 54 502 832 0,36 %<br />
Renown Inc 747 305 0,17 %<br />
Resona <strong>Holding</strong>s Inc 239 391 109 0,20 %<br />
Resort Solution Co Ltd 5 414 056 0,58 %<br />
Resorttrust Inc 28 064 417 0,70 %<br />
Rhythm Watch Co Ltd 1 538 685 0,17 %<br />
Ricoh Co Ltd 285 309 724 0,44 %<br />
Ricoh Leasing Co Ltd 4 441 023 0,11 %<br />
Right On Co Ltd 4 717 229 0,14 %<br />
Riken Corp 2 980 353 0,17 %<br />
Riken Technos Corp 509 496 0,05 %<br />
Ringer Hut Co Ltd 1 510 476 0,08 %<br />
Rinnai Corp 55 043 535 0,38 %<br />
Risa Partners Inc 24 123 134 2,49 %<br />
Riso Kagaku Corp 14 582 752 0,79 %<br />
Rock Field Co Ltd 1 835 160 0,15 %<br />
Rohm Co Ltd 210 157 430 0,51 %<br />
Rohto Pharmaceutical Co Ltd 24 963 471 0,22 %<br />
Roland Corp 4 050 636 0,17 %<br />
Roland DG Corp 1 658 026 0,09 %<br />
Rorze Corp 1 334 763 0,91 %<br />
Round One Corp 24 100 633 0,73 %<br />
Royal <strong>Holding</strong>s Co Ltd 3 094 426 0,10 %<br />
Russell/Nomura Small Cap Core Index Linked Exchange<br />
Traded <strong>Fund</strong> 650 496 0,00 %<br />
Ryobi Ltd 5 960 707 0,25 %<br />
Ryoden Trading Co Ltd 3 108 886 0,17 %<br />
Ryohin Keikaku Co Ltd 324 367 242 3,53 %<br />
Ryosan Co Ltd 19 186 526 0,32 %<br />
Ryoshoku Ltd 4 630 076 0,06 %<br />
Ryoyo Electro Corp 4 443 340 0,23 %<br />
Sagami Chain Co Ltd 2 210 702 0,12 %<br />
Sagami Railway Co Ltd 50 117 734 0,38 %<br />
Saibu Gas Co Ltd 12 749 770 0,18 %<br />
Saizeriya Co Ltd 23 345 009 0,45 %<br />
Sakai Chemical Industry Co Ltd 3 346 023 0,17 %<br />
Sakata INX Corp 1 738 514 0,11 %<br />
Sakata Seed Corp 11 868 270 0,23 %<br />
Sala Corp 1 438 733 0,08 %<br />
Samantha Thavasa Japan Ltd 7 863 470 1,31 %<br />
San-A Co Ltd 31 209 360 0,68 %<br />
San-Ai Oil Co Ltd 1 844 569 0,08 %<br />
Sanden Corp 5 434 062 0,25 %<br />
Sanei-International Co Ltd 1 104 934 0,09 %<br />
Sangetsu Co Ltd 16 341 735 0,24 %<br />
San-In Godo <strong>Bank</strong> Ltd/The 35 735 505 0,37 %<br />
Sankei Building Co Ltd/The 1 778 170 0,07 %<br />
Sanken Electric Co Ltd 13 359 682 0,40 %<br />
Sanki Engineering Co Ltd 9 635 322 0,26 %<br />
Sankyo Co Ltd 136 825 398 0,40 %<br />
Sankyo Seiko Co Ltd 2 140 410 0,28 %<br />
Sankyo-Tateyama <strong>Holding</strong>s Inc 4 353 738 0,21 %<br />
Sankyu Inc 23 035 789 0,28 %<br />
Sanoh Industrial Co Ltd 1 163 700 0,11 %<br />
Sanrio Co Ltd 8 226 405 0,14 %<br />
Market value<br />
Voting<br />
(per cent)<br />
Sanshin Electronics Co Ltd 3 373 985 0,17 %<br />
Santen Pharmaceutical Co Ltd 70 083 413 0,39 %<br />
Sanwa <strong>Holding</strong>s Corp 17 062 414 0,25 %<br />
Sanyo Chemical Industries Ltd 5 516 326 0,11 %<br />
Sanyo Denki Co Ltd 854 851 0,08 %<br />
Sanyo Electric Co Ltd 89 036 377 0,37 %<br />
Sanyo Shokai Ltd 6 863 371 0,18 %<br />
Sanyo Special Steel Co Ltd 7 169 718 0,21 %<br />
Sapporo Hokuyo <strong>Holding</strong>s Inc 41 191 659 0,38 %<br />
Sapporo <strong>Holding</strong>s Ltd 56 909 886 0,33 %<br />
Sasebo Heavy Industries Co Ltd 9 083 805 0,41 %<br />
Sato Corp 73 479 952 2,94 %<br />
Satori Electric Co Ltd 606 831 0,11 %<br />
Sawai Pharmaceutical Co Ltd 11 908 127 0,22 %<br />
SBI <strong>Holding</strong>s Inc/Japan 272 431 473 1,55 %<br />
SBS <strong>Holding</strong>s Inc 4 640 743 0,92 %<br />
Secom Co Ltd 308 870 564 0,37 %<br />
Secom Techno Service Co Ltd 20 781 522 0,88 %<br />
Sega Sammy <strong>Holding</strong>s Inc 54 906 633 0,24 %<br />
Seika Corp 2 396 858 0,17 %<br />
Seikagaku Corp 10 281 570 0,23 %<br />
Seiko Epson Corp 80 968 407 0,38 %<br />
Seiko <strong>Holding</strong>s Corp 5 045 915 0,28 %<br />
Seino <strong>Holding</strong>s Corp 33 945 007 0,43 %<br />
Seiren Co Ltd 3 460 374 0,17 %<br />
Sekisui Chemical Co Ltd 106 079 047 0,46 %<br />
Sekisui House Ltd 274 757 856 0,68 %<br />
Sekisui Jushi Corp 5 015 558 0,18 %<br />
Sekisui Plastics Co Ltd 2 066 411 0,09 %<br />
Senko Co Ltd 3 884 717 0,11 %<br />
Senshukai Co Ltd 4 439 872 0,17 %<br />
Septeni <strong>Holding</strong>s Co Ltd 10 838 440 1,37 %<br />
Seven & I <strong>Holding</strong>s Co Ltd 944 868 611 0,44 %<br />
Seven <strong>Bank</strong> Ltd 126 773 465 0,39 %<br />
SFCG Co Ltd 9 508 288 0,26 %<br />
Sharp Corp 207 367 841 0,38 %<br />
Shibaura Electronics Co Ltd 5 165 117 1,41 %<br />
Shibaura Mechatronics Corp 5 180 704 0,37 %<br />
Shibusawa Warehouse Co Ltd/The 5 171 435 0,17 %<br />
Shibuya Kogyo Co Ltd 375 402 0,02 %<br />
Shiga <strong>Bank</strong> Ltd/The 47 281 207 0,39 %<br />
Shikoku <strong>Bank</strong> Ltd/The 19 668 061 0,24 %<br />
Shikoku Chemicals Corp 1 576 689 0,09 %<br />
Shikoku Coca-Cola Bottling Co Ltd 789 588 0,05 %<br />
Shikoku Electric Power Co Inc 217 558 882 0,38 %<br />
Shima Seiki Manufacturing Ltd 18 172 987 0,37 %<br />
Shimachu Co Ltd 45 594 524 0,57 %<br />
Shimadzu Corp 68 624 056 0,54 %<br />
Shimamura Co Ltd 48 090 948 0,25 %<br />
Shimano Inc 100 044 676 0,38 %<br />
Shimizu <strong>Bank</strong> Ltd/The 5 345 850 0,17 %<br />
Shimizu Corp 118 655 296 0,37 %<br />
Shimojima Co Ltd 278 423 0,01 %<br />
Shindengen Electric Manufacturing Co Ltd 1 864 497 0,17 %<br />
Shin-Etsu Chemical Co Ltd 598 619 132 0,44 %<br />
Shin-Etsu Polymer Co Ltd 3 122 172 0,11 %<br />
Shinkawa Ltd 2 781 730 0,17 %<br />
Shin-Keisei Electric Railway Co Ltd 596 936 0,04 %<br />
Shinki Co Ltd 672 325 0,08 %<br />
Shinko Electric Co Ltd 3 898 003 0,11 %<br />
Shinko Electric Industries Co Ltd 17 994 207 0,24 %<br />
Shinko Plantech Co Ltd 6 993 325 0,26 %<br />
Shinko Securities Co Ltd 46 256 962 0,38 %<br />
Shinko Shoji Co Ltd 2 783 846 0,17 %<br />
Shin-Kobe Electric Machinery Co Ltd 5 334 264 0,17 %<br />
Shinmaywa Industries Ltd 3 813 344 0,17 %<br />
Shinsei <strong>Bank</strong> Ltd 125 968 119 0,57 %<br />
Shinwa Co Ltd/Nagoya 2 510 537 0,15 %<br />
Shinwa Kaiun Kaisha Ltd 6 562 586 0,22 %<br />
Shionogi & Co Ltd 829 146 136 1,33 %<br />
Shiroki Corp 942 368 0,07 %<br />
Shiseido Co Ltd 254 899 435 0,44 %<br />
Shizuoka <strong>Bank</strong> Ltd/The 215 600 459 0,38 %<br />
Shizuoka Gas Co Ltd 6 728 852 0,20 %<br />
SHO-BOND <strong>Holding</strong>s Co Ltd 11 639 885 0,28 %<br />
Shochiku Co Ltd 11 806 398 0,19 %<br />
Shoei Co Ltd/Chiyoda-ku 90 527 715 3,09 %<br />
Shoko Co Ltd 991 803 0,11 %<br />
Shonai <strong>Bank</strong> Ltd/The 2 588 885 0,19 %<br />
Showa Aircraft Industry Co Ltd 601 725 0,06 %<br />
Showa Corp 4 882 530 0,26 %<br />
Showa Denko KK 52 130 913 0,43 %<br />
Showa Sangyo Co Ltd 3 639 702 0,09 %<br />
Showa Shell Sekiyu KK 35 869 259 0,14 %<br />
Siix Corp 504 128 0,09 %<br />
Simplex Technology Inc 975 698 0,07 %<br />
Sinanen Co Ltd 1 831 592 0,08 %<br />
Sinko Industries Ltd 10 633 614 2,12 %<br />
Sintokogio Ltd 4 524 562 0,17 %<br />
SK Kaken Co Ltd 6 254 772 0,26 %<br />
SKY Perfect JSAT <strong>Holding</strong>s Inc 11 639 367 0,10 %<br />
18<br />
GOVERNMENT PENSION FUND <strong>–</strong> GLOBAL ANNUAL REPORT 2008
<strong>Government</strong> <strong>Pension</strong> <strong>Fund</strong> <strong>–</strong> <strong>Global</strong> <strong>Holding</strong> <strong>of</strong> equities at 31 December 2008<br />
Market value<br />
Voting<br />
(per cent)<br />
SMC Corp/Japan 535 217 328 1,06 %<br />
SMK Corp 4 955 309 0,31 %<br />
SMS Co Ltd 11 537 205 0,78 %<br />
Snow Brand Milk Products Co Ltd 36 350 361 0,45 %<br />
Sodick Co Ltd 2 396 626 0,41 %<br />
S<strong>of</strong>tbank Corp 1 462 916 793 1,09 %<br />
Sohgo Security Services Co Ltd 19 502 281 0,27 %<br />
Sojitz Corp 70 466 485 0,50 %<br />
Sompo Japan Insurance Inc 184 740 771 0,38 %<br />
So-net Entertainment Corp 6 894 446 0,16 %<br />
So-net M3 Inc 6 078 271 0,10 %<br />
Sony Corp 867 290 706 0,50 %<br />
Sony Financial <strong>Holding</strong>s Inc 114 197 338 0,20 %<br />
Sorun Corp 2 012 480 0,17 %<br />
Square Enix <strong>Holding</strong>s Co Ltd 58 294 510 0,23 %<br />
SRA <strong>Holding</strong>s 8 679 437 1,08 %<br />
SRI Sports Ltd 12 727 091 0,67 %<br />
SSP Co Ltd 3 192 540 0,06 %<br />
ST Corp 2 280 414 0,08 %<br />
St Marc <strong>Holding</strong>s Co Ltd 16 954 274 0,72 %<br />
Stanley Electric Co Ltd 256 936 425 1,89 %<br />
Star Micronics Co Ltd 15 876 916 0,43 %<br />
Start Today Co Ltd 44 706 072 1,54 %<br />
Starzen Co Ltd 1 179 891 0,07 %<br />
Stella Chemifa Corp 2 254 730 0,17 %<br />
Studio Alice Co Ltd 19 847 049 1,73 %<br />
Sugi <strong>Holding</strong>s Co Ltd 106 629 508 0,91 %<br />
Sumco Corp 44 248 699 0,20 %<br />
Sumida Corp 866 190 0,11 %<br />
Sumikin Bussan Corp 3 163 343 0,11 %<br />
Sumisho Computer Systems Corp 34 456 048 0,56 %<br />
Sumitomo Bakelite Co Ltd 27 764 466 0,38 %<br />
Sumitomo Chemical Co Ltd 164 068 811 0,42 %<br />
Sumitomo Corp 323 723 666 0,43 %<br />
Sumitomo Electric Industries Ltd 157 018 476 0,38 %<br />
Sumitomo Forestry Co Ltd 66 863 311 0,67 %<br />
Sumitomo Heavy Industries Ltd 61 991 565 0,38 %<br />
Sumitomo Light Metal Industries Ltd 2 432 235 0,10 %<br />
Sumitomo Metal Industries Ltd 380 702 048 0,47 %<br />
Sumitomo Metal Mining Co Ltd 174 804 919 0,41 %<br />
Sumitomo Mitsui Construction Co Ltd 1 234 617 0,09 %<br />
Sumitomo Mitsui Financial Group Inc 1 507 616 937 0,66 %<br />
Sumitomo Osaka Cement Co Ltd 97 278 429 1,30 %<br />
Sumitomo Precision Products Co Ltd 1 742 608 0,11 %<br />
Sumitomo Real Estate Sales Co Ltd 8 842 467 0,15 %<br />
Sumitomo Realty & Development Co Ltd 317 759 416 0,66 %<br />
Sumitomo Rubber Industries Inc 39 746 994 0,25 %<br />
Sumitomo Seika Chemicals Co Ltd 1 668 454 0,11 %<br />
Sumitomo Trust & <strong>Bank</strong>ing Co Ltd/The 320 482 030 0,48 %<br />
Sumitomo Warehouse Co Ltd/The 15 778 323 0,23 %<br />
Sun Frontier Fudousan Co Ltd 883 813 0,11 %<br />
Suncall Corp 516 912 0,08 %<br />
Sundrug Co Ltd 207 645 595 1,61 %<br />
Sunx Ltd 558 082 0,07 %<br />
Suruga <strong>Bank</strong> Ltd 70 193 252 0,39 %<br />
Suruga Corp 79 445 0,05 %<br />
Suzuken Co Ltd 43 887 757 0,23 %<br />
Suzuki Motor Corp 399 262 320 0,78 %<br />
SWCC Showa <strong>Holding</strong>s Co Ltd 3 579 606 0,32 %<br />
Sysmex Corp 213 710 812 1,66 %<br />
T Hasegawa Co Ltd 2 643 920 0,07 %<br />
T RAD Co Ltd 1 492 957 0,17 %<br />
T&D <strong>Holding</strong>s Inc 512 276 494 0,73 %<br />
Tachihi Enterprise Co Ltd 3 923 717 0,07 %<br />
Tachi-S Co Ltd 2 231 047 0,17 %<br />
Tadano Ltd 14 666 947 0,31 %<br />
Taihei Dengyo Kaisha Ltd 10 433 399 0,30 %<br />
Taihei Kogyo Co Ltd 1 502 690 0,09 %<br />
Taiheiyo Cement Corp 90 769 481 0,73 %<br />
Taiho Kogyo Co Ltd 834 474 0,09 %<br />
Taikisha Ltd 9 777 388 0,27 %<br />
Taisei Corp 97 410 010 0,49 %<br />
Taisei Lamick Co Ltd 760 074 0,08 %<br />
Taisho Pharmaceutical Co Ltd 163 601 115 0,35 %<br />
Taiyo Ink Manufacturing Co Ltd 3 419 025 0,09 %<br />
Taiyo Nippon Sanso Corp 83 455 229 0,39 %<br />
Taiyo Yuden Co Ltd 22 130 189 0,48 %<br />
Takagi Securities Co Ltd 590 911 0,15 %<br />
Takamatsu Construction Group Co Ltd 1 883 607 0,04 %<br />
Takano Co Ltd 356 122 0,06 %<br />
Takara <strong>Holding</strong>s Inc 31 526 366 0,36 %<br />
Takara Standard Co Ltd 12 256 572 0,19 %<br />
Takasago International Corp 5 542 975 0,11 %<br />
Takasago Thermal Engineering Co Ltd 12 571 338 0,25 %<br />
Takashimaya Co Ltd 65 259 857 0,38 %<br />
Takata Corp 9 390 870 0,24 %<br />
Take And Give Needs Co Ltd 1 276 349 0,55 %<br />
Takeda Pharmaceutical Co Ltd 1 009 335 383 0,35 %<br />
Takefuji Corp 16 156 531 0,20 %<br />
Takihyo Co Ltd 1 964 605 0,10 %<br />
Takiron Co Ltd 1 965 995 0,11 %<br />
Market value<br />
Voting<br />
(per cent)<br />
Takuma Co Ltd 1 795 905 0,17 %<br />
Tamron Co Ltd 6 364 720 0,37 %<br />
Tamura Corp 5 494 775 0,62 %<br />
TCM Corp 1 253 349 0,11 %<br />
TDK Corp 136 664 964 0,42 %<br />
Tecmo Ltd 1 764 645 0,12 %<br />
Teijin Ltd 74 911 001 0,39 %<br />
Teikoku Piston Ring Co Ltd 1 717 905 0,17 %<br />
Teikoku Tsushin Kogyo Co Ltd 1 283 551 0,17 %<br />
Tekken Corp 1 627 515 0,14 %<br />
Temp <strong>Holding</strong>s Co Ltd 3 887 652 0,11 %<br />
Tenma Corp 3 717 810 0,12 %<br />
Teraoka Seisakusho Co Ltd 8 279 240 1,15 %<br />
Terumo Corp 253 927 723 0,37 %<br />
T-GAIA Corp 51 787 369 1,08 %<br />
THK Co Ltd 182 168 958 1,89 %<br />
TKC 3 922 597 0,10 %<br />
Toa Corp/Hyogo 25 669 629 1,64 %<br />
Toa Corp/Tokyo 8 041 253 0,36 %<br />
Toa Oil Co Ltd 402 283 0,05 %<br />
Toagosei Co Ltd 17 099 182 0,31 %<br />
Tobishima Corp 1 122 190 0,17 %<br />
Tobu Railway Co Ltd 136 298 561 0,38 %<br />
TOC Co Ltd 11 920 950 0,25 %<br />
Tocalo Co Ltd 16 132 120 1,68 %<br />
Tochigi <strong>Bank</strong> Ltd/The 8 973 811 0,19 %<br />
Toda Corp 28 853 075 0,35 %<br />
Toda Kogyo Corp 1 410 462 0,17 %<br />
Toei Co Ltd 10 437 416 0,22 %<br />
Toenec Corp 2 707 067 0,07 %<br />
Tohcello Co Ltd 1 194 644 0,11 %<br />
Toho <strong>Bank</strong> Ltd/The 16 847 910 0,25 %<br />
Toho Co Ltd/Hyogo 686 152 0,05 %<br />
Toho Co Ltd/Tokyo 93 767 998 0,34 %<br />
Toho Gas Co Ltd 95 845 888 0,37 %<br />
Toho Pharmaceutical Co Ltd 20 527 655 0,35 %<br />
Toho Real Estate Co Ltd 38 396 975 1,43 %<br />
Toho Titanium Co Ltd 8 691 410 0,19 %<br />
Toho Zinc Co Ltd 6 476 846 0,29 %<br />
Tohoku Electric Power Co Inc 319 591 541 0,34 %<br />
Tohokushinsha Film Corp 30 158 049 1,30 %<br />
Tokai Carbon Co Ltd 23 349 860 0,36 %<br />
Tokai Corp 4 538 041 0,17 %<br />
Tokai Rika Co Ltd 10 949 353 0,19 %<br />
Tokai Rubber Industries Inc 8 351 416 0,14 %<br />
Tokai Tokyo Securities Co Ltd 13 889 880 0,26 %<br />
Token Corp 4 951 740 0,20 %<br />
Tokio Marine <strong>Holding</strong>s Inc 850 977 842 0,53 %<br />
Toko Inc 1 320 705 0,17 %<br />
Tokushima <strong>Bank</strong> Ltd/The 5 857 432 0,21 %<br />
Tokushu Tokai <strong>Holding</strong>s Co Ltd 3 527 853 0,11 %<br />
Tokuyama Corp 72 857 604 0,46 %<br />
Tokyo Broadcasting System Inc 18 630 033 0,09 %<br />
Tokyo Dome Corp 13 879 993 0,28 %<br />
Tokyo Electric Power Co Inc/The 1 188 191 872 0,38 %<br />
Tokyo Electron Device Ltd 635 866 0,07 %<br />
Tokyo Electron Ltd 251 550 076 0,58 %<br />
Tokyo Energy & Systems Inc 2 199 579 0,11 %<br />
Tokyo Gas Co Ltd 1 817 059 654 1,90 %<br />
Tokyo Kikai Seisakusho Ltd 2 405 818 0,20 %<br />
Tokyo Leasing Co Ltd 2 479 925 0,07 %<br />
Tokyo Ohka Kogyo Co Ltd 22 628 516 0,49 %<br />
Tokyo Rakutenchi Co Ltd 819 628 0,04 %<br />
Tokyo Rope Manufacturing Co Ltd 69 012 203 2,15 %<br />
Tokyo Seimitsu Co Ltd 7 761 880 0,33 %<br />
Tokyo Steel Manufacturing Co Ltd 34 303 570 0,31 %<br />
Tokyo Style Co Ltd 19 909 755 0,39 %<br />
Tokyo Tatemono Co Ltd 38 008 542 0,38 %<br />
Tokyo Tekko Co Ltd 13 788 382 1,81 %<br />
Tokyo Tomin <strong>Bank</strong> Ltd/The 35 059 974 0,79 %<br />
Tokyotokeiba Co Ltd 2 711 856 0,09 %<br />
Tokyu Community Corp 1 412 532 0,07 %<br />
Tokyu Construction Co Ltd 2 345 684 0,11 %<br />
Tokyu Corp 177 799 248 0,41 %<br />
Tokyu Land Corp 53 823 092 0,39 %<br />
Tokyu Livable Inc 1 091 972 0,07 %<br />
Toli Corp 1 196 189 0,13 %<br />
Tomato <strong>Bank</strong> Ltd 1 211 020 0,06 %<br />
Tomen Electronics Corp 1 432 036 0,10 %<br />
Tomoku Co Ltd 952 255 0,07 %<br />
Tomy Co Ltd 11 509 205 0,26 %<br />
Tonami <strong>Holding</strong>s Co Ltd 1 223 842 0,07 %<br />
TonenGeneral Sekiyu KK 96 993 044 0,25 %<br />
Topcon Corp 3 909 196 0,14 %<br />
Toppan Forms Co Ltd 15 088 595 0,15 %<br />
Toppan Printing Co Ltd 243 900 662 0,66 %<br />
Topre Corp 5 700 551 0,21 %<br />
Topy Industries Ltd 6 398 753 0,22 %<br />
Toray Industries Inc 184 660 768 0,38 %<br />
Toridoll.corp 8 898 422 0,46 %<br />
Torii Pharmaceutical Co Ltd 2 361 558 0,07 %<br />
19<br />
GOVERNMENT PENSION FUND <strong>–</strong> GLOBAL ANNUAL REPORT 2008
<strong>Government</strong> <strong>Pension</strong> <strong>Fund</strong> <strong>–</strong> <strong>Global</strong> <strong>Holding</strong> <strong>of</strong> equities at 31 December 2008<br />
Market value<br />
Voting<br />
(per cent)<br />
Torishima Pump Manufacturing Co Ltd 4 153 060 0,19 %<br />
Toshiba Corp 341 722 251 0,37 %<br />
Toshiba Machine Co Ltd 16 271 135 0,48 %<br />
Toshiba Plant Systems & Services Corp 10 566 876 0,15 %<br />
Toshiba TEC Corp 12 027 391 0,20 %<br />
Toshin Group Co Ltd 17 106 853 1,75 %<br />
Tosho Printing Co Ltd 757 911 0,05 %<br />
Tosoh Corp 46 731 853 0,46 %<br />
TOTO Ltd 60 984 724 0,38 %<br />
Tottori <strong>Bank</strong> Ltd/The 1 936 874 0,09 %<br />
Touei Housing Corp 327 241 0,09 %<br />
Towa <strong>Bank</strong> Ltd/The 1 860 017 0,14 %<br />
Towa Pharmaceutical Co Ltd 8 014 141 0,15 %<br />
Towa Real Estate Development Co Ltd 638 029 0,07 %<br />
Toyo Construction Co Ltd 1 703 214 0,16 %<br />
Toyo Corp/Chuo-ku 9 697 920 0,32 %<br />
Toyo Engineering Corp 18 455 574 0,45 %<br />
Toyo Ink Manufacturing Co Ltd 11 842 780 0,20 %<br />
Toyo Kanetsu K K 3 240 277 0,17 %<br />
Toyo Kohan Co Ltd 12 172 454 0,41 %<br />
Toyo Securities Co Ltd 2 120 790 0,17 %<br />
Toyo Seikan Kaisha Ltd 134 594 447 0,53 %<br />
Toyo Suisan Kaisha Ltd 78 120 726 0,35 %<br />
Toyo Tanso Co Ltd 15 442 469 0,28 %<br />
Toyo Tire & Rubber Co Ltd 6 006 435 0,21 %<br />
Toyo Wharf & Warehouse Co Ltd 1 016 521 0,12 %<br />
Toyobo Co Ltd 27 769 332 0,38 %<br />
Toyoda Gosei Co Ltd 126 564 599 1,21 %<br />
Toyota Auto Body Co Ltd 11 138 669 0,09 %<br />
Toyota Boshoku Corp 20 227 642 0,19 %<br />
Toyota Industries Corp 98 041 664 0,20 %<br />
Toyota Motor Corp 2 899 723 618 0,37 %<br />
Toyota Tsusho Corp 41 547 801 0,16 %<br />
Trancom Co Ltd 21 127 124 2,18 %<br />
transcosmos inc 6 894 438 0,29 %<br />
Trend Micro Inc 450 504 639 1,35 %<br />
Trusco Nakayama Corp 22 326 140 0,76 %<br />
TS Tech Co Ltd 4 542 111 0,17 %<br />
Tsubakimoto Chain Co 11 107 269 0,27 %<br />
Tsugami Corp 1 585 031 0,20 %<br />
Tsukishima Kikai Co Ltd 2 458 189 0,11 %<br />
Tsukui Corp 1 620 949 0,23 %<br />
Tsumura & Co 61 166 916 0,34 %<br />
Tsuruha <strong>Holding</strong>s Inc 7 626 071 0,12 %<br />
Tsurumi Manufacturing Co Ltd 1 044 329 0,07 %<br />
Tsutsumi Jewelry Co Ltd 3 376 773 0,11 %<br />
TV Asahi Corp 47 227 832 0,50 %<br />
TV Tokyo Corp 5 285 369 0,08 %<br />
Ube Industries Ltd/Japan 158 563 972 0,82 %<br />
Uchida Yoko Co Ltd 2 210 702 0,17 %<br />
Ulvac Inc 20 801 729 0,46 %<br />
Unicharm Corp 326 352 703 0,91 %<br />
Unicharm Petcare Corp 12 437 707 0,17 %<br />
Uniden Corp 1 546 101 0,23 %<br />
Unimat Life Corp 635 689 0,04 %<br />
Union Tool Co 6 256 857 0,17 %<br />
Unipres Corp 4 613 554 0,26 %<br />
United Arrows Ltd 2 313 126 0,10 %<br />
Unitika Ltd 6 683 549 0,28 %<br />
UNY Co Ltd 53 367 357 0,36 %<br />
USC Corp 945 851 0,11 %<br />
U-Shin Ltd 784 451 0,11 %<br />
Ushio Inc 90 915 297 0,72 %<br />
USJ Co Ltd 1 274 514 0,02 %<br />
USS Co Ltd 43 518 565 0,36 %<br />
UT <strong>Holding</strong>s Co Ltd 1 399 270 0,71 %<br />
Valor Co Ltd 10 979 007 0,27 %<br />
Village Vanguard Co Ltd 20 583 316 2,53 %<br />
Vital-net Inc 1 217 825 0,06 %<br />
VSN Inc 7 676 897 1,84 %<br />
Wacoal <strong>Holding</strong>s Corp 47 358 682 0,37 %<br />
Wacom Co Ltd/Japan 26 908 649 1,07 %<br />
Warabeya Nichiyo Co Ltd 3 160 253 0,15 %<br />
Watabe Wedding Corp 21 718 467 2,04 %<br />
WATAMI Co Ltd 11 558 679 0,15 %<br />
West Japan Railway Co 240 734 747 0,38 %<br />
Wood One Co Ltd 2 761 446 0,22 %<br />
Works Applications Co Ltd 14 596 378 0,77 %<br />
Wowow Inc 7 165 083 0,54 %<br />
Xebio Co Ltd 22 594 483 0,35 %<br />
Yachiyo <strong>Bank</strong> Ltd/The 10 610 904 0,31 %<br />
Yachiyo Industry Co Ltd 11 613 444 1,04 %<br />
Yahagi Construction Co Ltd 1 320 396 0,07 %<br />
Yahoo! Japan Corp 352 388 465 0,21 %<br />
Yakult Honsha Co Ltd 124 262 310 0,48 %<br />
YAMABIKO Corp 664 257 0,09 %<br />
Yamada Denki Co Ltd 696 098 719 1,51 %<br />
Yamagata <strong>Bank</strong> Ltd/The 18 419 192 0,23 %<br />
Yamaguchi Financial Group Inc 78 710 865 0,39 %<br />
Yamaha Corp 48 780 128 0,39 %<br />
Yamaha Motor Co Ltd 69 823 783 0,34 %<br />
Market value<br />
Voting<br />
(per cent)<br />
Yamanashi Chuo <strong>Bank</strong> Ltd/The 20 803 536 0,27 %<br />
Yamatake Corp 187 482 985 1,50 %<br />
Yamato <strong>Holding</strong>s Co Ltd 198 356 070 0,48 %<br />
Yamato Kogyo Co Ltd 42 099 112 0,32 %<br />
Yamazaki Baking Co Ltd 57 946 027 0,25 %<br />
Yamazen Corp 2 796 607 0,11 %<br />
Yaoko Co Ltd 2 679 645 0,06 %<br />
Yaskawa Electric Corp 65 377 084 0,94 %<br />
Yellow Hat Ltd 615 474 0,10 %<br />
Yodogawa Steel Works Ltd 11 551 264 0,22 %<br />
Yokogawa Bridge <strong>Holding</strong>s Corp 7 212 974 0,25 %<br />
Yokogawa Electric Corp 43 174 833 0,36 %<br />
Yokohama Reito Co Ltd 4 013 404 0,16 %<br />
Yokohama Rubber Co Ltd/The 46 333 896 0,39 %<br />
Yokowo Co Ltd 1 110 495 0,16 %<br />
Yomiuri Land Co Ltd 1 626 125 0,09 %<br />
Yonekyu Corp 4 699 093 0,20 %<br />
Yoshimoto Kogyo Co Ltd 15 161 018 0,42 %<br />
Yoshinoya <strong>Holding</strong>s Co Ltd 13 124 554 0,24 %<br />
Yuasa Trading Co Ltd 2 562 931 0,17 %<br />
Yuraku Real Estate Co Ltd 159 894 0,03 %<br />
Yurtec Corp 4 468 908 0,13 %<br />
Yusen Air & Sea Service Co Ltd 5 753 509 0,16 %<br />
Yushin Precision Equipment Co Ltd 15 678 608 1,40 %<br />
Yushiro Chemical Industry Co Ltd 3 324 688 0,24 %<br />
Zakkaya Bulldog Co Ltd 8 804 247 2,99 %<br />
Zappallas Inc 10 738 356 0,50 %<br />
Zenrin Co Ltd 24 222 940 0,75 %<br />
Zensho Co Ltd 9 089 915 0,19 %<br />
Zeon Corp 21 498 273 0,38 %<br />
Zephyr Co Ltd 3 055 0,17 %<br />
ZERIA Pharmaceutical Co Ltd 3 357 764 0,09 %<br />
Zuken Inc 2 111 027 0,17 %<br />
KAZAKHSTAN<br />
Kazkommertsbank 29 900 959 0,00 %<br />
KazMunaiGas Exploration Production 63 514 758 0,00 %<br />
KOREA REPUBLIC OF (SOUTH)<br />
Ahnlab Inc 624 445 0,14 %<br />
Amorepacifi c Corp 323 550 155 1,52 %<br />
Asiana Airlines 4 765 590 0,14 %<br />
Binggrae Co Ltd 2 798 716 0,12 %<br />
Bukwang Pharmaceutical Co Ltd 53 990 735 2,03 %<br />
Cheil Industries Inc 29 286 850 0,26 %<br />
Cheil Worldwide Inc 9 811 696 0,20 %<br />
Chong Kun Dang Pharm Corp 4 258 967 0,37 %<br />
CJ CGV Co Ltd 20 397 444 1,17 %<br />
CJ CheilJedang Corp 183 688 156 1,64 %<br />
CJ Corp 9 331 464 0,15 %<br />
CJ Home Shopping 20 399 184 0,85 %<br />
CJ Internet Corp 25 460 674 1,66 %<br />
Dae Han Flour Mills Co Ltd 1 251 845 0,12 %<br />
Daeduck Electronics Co 1 687 549 0,18 %<br />
Daeduck GDS Co Ltd 1 069 353 0,19 %<br />
Daegu <strong>Bank</strong> 13 637 131 0,28 %<br />
Daehan City Gas Co Ltd 3 661 422 0,29 %<br />
Daekyo Co Ltd 2 102 861 0,09 %<br />
Daelim Industrial Co 22 159 488 0,26 %<br />
Daesang Corp 2 979 942 0,28 %<br />
Daewoo Engineering & Construction Co Ltd 11 273 906 0,07 %<br />
Daewoo International Corp 80 614 629 0,65 %<br />
Daewoo Motor Sales 2 935 769 0,26 %<br />
Daewoo Securities Co Ltd 26 794 491 0,20 %<br />
Daewoo Shipbuilding & Marine Engineering Co Ltd 16 903 353 0,10 %<br />
Daewoong Co Ltd 327 215 0,06 %<br />
Daewoong Pharmaceutical Co Ltd 8 347 255 0,28 %<br />
Daishin Securities Co Ltd 8 419 184 0,04 %<br />
Daum Communications Corp 5 388 163 0,24 %<br />
DC Chemical Co Ltd 157 404 629 0,62 %<br />
Digitech Systems Co Ltd 18 301 552 2,07 %<br />
DMS Co Ltd 904 961 0,14 %<br />
Dong-A Pharmaceutical Co Ltd 41 075 159 0,75 %<br />
Dongbu Corp 1 811 750 0,27 %<br />
Dongbu HiTek Co Ltd 2 139 121 0,27 %<br />
Dongbu Insurance Co Ltd 75 528 643 1,32 %<br />
Dongbu Securities Co Ltd 3 304 171 0,31 %<br />
Dongbu Steel Co Ltd 2 635 078 0,23 %<br />
Dongkuk Steel Mill Co Ltd 5 997 559 0,06 %<br />
Dongsuh Co Inc 2 685 556 0,06 %<br />
Doosan Construction & Engineering Co Ltd 6 948 481 0,29 %<br />
Doosan Corp 33 385 199 0,25 %<br />
Doosan Heavy Industries and Construction Co Ltd 112 441 223 0,31 %<br />
Doosan Infracore Co Ltd 17 484 420 0,13 %<br />
E1 Corp 7 785 761 0,29 %<br />
Eugene Investment & Securities Co Ltd 6 971 238 0,22 %<br />
Forhuman Co Ltd 2 116 775 0,26 %<br />
GIIR Inc 830 546 0,09 %<br />
Glovis Co Ltd 62 782 176 0,64 %<br />
Green Cross Corp/South Korea 26 508 768 0,57 %<br />
GS Engineering & Construction Corp 106 694 070 0,65 %<br />
GS <strong>Holding</strong>s Corp 16 916 119 0,12 %<br />
GS Home Shopping Inc 1 556 147 0,09 %<br />
20<br />
GOVERNMENT PENSION FUND <strong>–</strong> GLOBAL ANNUAL REPORT 2008
<strong>Government</strong> <strong>Pension</strong> <strong>Fund</strong> <strong>–</strong> <strong>Global</strong> <strong>Holding</strong> <strong>of</strong> equities at 31 December 2008<br />
Market value<br />
Voting<br />
(per cent)<br />
Halla Climate Control Corp 18 850 300 0,44 %<br />
Halla Engineering & Construc 842 968 0,18 %<br />
Hana Financial Group Inc 101 940 386 0,44 %<br />
Hana Tour Service Inc 22 186 856 1,47 %<br />
Hanbit S<strong>of</strong>t Inc 555 434 0,13 %<br />
Handsome Co Ltd 2 062 023 0,19 %<br />
Hanil Cement Manufacturing 7 387 431 0,27 %<br />
Hanjin Heavy Industries & Construction Co Ltd 13 094 532 0,17 %<br />
Hanjin Heavy Industries & Construction <strong>Holding</strong>s Co Ltd 6 729 032 0,34 %<br />
Hanjin Shipping Co Ltd 19 699 105 0,22 %<br />
Hanjin Transportation Co Ltd 7 189 300 0,30 %<br />
Hankook Tire Co Ltd 67 974 956 0,53 %<br />
Hankuk Electric Glass Co Ltd 744 022 0,07 %<br />
Hanmi Pharm Co Ltd 130 180 910 2,37 %<br />
Hansol LCD Inc 1 962 845 0,43 %<br />
Hansol Paper Co 5 478 049 0,22 %<br />
Hanssem Co Ltd 797 079 0,09 %<br />
Hanwha Chem Corp 5 188 042 0,11 %<br />
Hanwha Non-Life Insurance Co Ltd 1 222 073 0,11 %<br />
Hanwha Securities Co 49 742 191 2,67 %<br />
Hite Brewery Co Ltd 36 839 787 0,42 %<br />
Hite <strong>Holding</strong>s Co Ltd 891 470 0,08 %<br />
Honam Petrochemical Corp 12 091 957 0,13 %<br />
Hotel Shilla Co Ltd 21 330 735 0,76 %<br />
Huchems Fine Chemical Corp 30 698 781 1,19 %<br />
Humax Co Ltd 4 044 722 0,32 %<br />
Hynix Semiconductor Inc 94 458 056 0,55 %<br />
Hyosung Corp 44 133 015 0,59 %<br />
Hyundai Autonet Co Ltd 4 804 990 0,15 %<br />
Hyundai Cement Co 391 124 0,07 %<br />
Hyundai Department Store Co Ltd 28 884 996 0,36 %<br />
Hyundai Development Co 34 992 370 0,26 %<br />
Hyundai Elevator Co Ltd 11 034 860 0,43 %<br />
Hyundai Engineering & Construction Co Ltd 211 443 484 0,60 %<br />
Hyundai H&S Co Ltd 4 505 932 0,26 %<br />
Hyundai Heavy Industries 409 474 536 0,49 %<br />
Hyundai Hysco 3 000 182 0,09 %<br />
Hyundai Marine & Fire Insurance Co Ltd 39 099 136 0,56 %<br />
Hyundai Merchant Marine Co Ltd 37 242 170 0,13 %<br />
Hyundai Mipo Dockyard 28 976 536 0,19 %<br />
Hyundai Mobis 290 062 140 0,94 %<br />
Hyundai Motor Co 331 419 739 0,69 %<br />
Hyundai Securities Co 24 185 763 0,26 %<br />
Hyundai Steel Co 22 829 842 0,13 %<br />
Hyunjin Materials Co Ltd 4 314 214 0,26 %<br />
IHQ Inc 399 293 0,12 %<br />
Ilyang Pharmaceutical Co Ltd 1 711 902 0,13 %<br />
Industrial <strong>Bank</strong> Of Korea 13 722 977 0,07 %<br />
Insun ENT Co Ltd 3 126 749 0,48 %<br />
Interpark Corp 1 910 302 0,15 %<br />
INTOPS Co Ltd 919 689 0,14 %<br />
Jahwa Electronics Co Ltd 600 287 0,17 %<br />
Jeonbuk <strong>Bank</strong> 4 878 472 0,33 %<br />
Jusung Engineering Co Ltd 2 853 608 0,20 %<br />
Kangwon Land Inc 32 156 562 0,20 %<br />
KB Financial Group Inc 187 929 253 0,14 %<br />
KCC Corp 21 639 007 0,13 %<br />
Keangnam Enterprises Ltd 1 901 652 0,27 %<br />
KEC Corp 183 656 0,11 %<br />
KH Vatec Co Ltd 325 026 0,06 %<br />
Kia Motors Corp 25 044 075 0,20 %<br />
KISCO Corp 2 176 769 0,14 %<br />
KISCO <strong>Holding</strong>s Co Ltd 752 941 0,14 %<br />
KIWOOM Securities Co Ltd 6 184 382 0,15 %<br />
Kolon Engineering & Construction Co Ltd 2 531 603 0,33 %<br />
Kolon Industries Inc 27 564 431 1,18 %<br />
Komipharm International Co Ltd 3 718 648 0,17 %<br />
Korea Development Corp 361 126 0,09 %<br />
Korea Electric Power Corp 441 671 597 0,42 %<br />
Korea Electric Terminal Co Ltd 893 012 0,14 %<br />
Korea Exchange <strong>Bank</strong> 23 974 448 0,11 %<br />
Korea Express Co Ltd 58 741 507 0,30 %<br />
Korea Gas Corp 44 822 905 0,18 %<br />
Korea Information Service 317 640 0,08 %<br />
Korea Investment <strong>Holding</strong>s Co Ltd 18 514 993 0,26 %<br />
Korea Kumho Petrochemical 5 123 197 0,20 %<br />
Korea Line Corp 8 131 775 0,19 %<br />
Korea Plant Service & Engineering Co Ltd 67 656 947 1,08 %<br />
Korea Zinc Co Ltd 12 612 350 0,16 %<br />
Korean Air Lines Co Ltd 36 195 979 0,24 %<br />
Korean Reinsurance Co 50 311 252 0,74 %<br />
KP Chemical Corp 3 096 892 0,13 %<br />
KT Corp 190 342 355 0,27 %<br />
KT Freetel Co Ltd 106 931 426 0,33 %<br />
KT&G Corp 114 873 735 0,19 %<br />
KTB Securities Co Ltd 3 137 706 0,29 %<br />
Kumho Electric Co Ltd 3 584 868 0,41 %<br />
Kumho Industrial Co Ltd 6 140 349 0,18 %<br />
Kumho Tire Co Inc 3 092 898 0,18 %<br />
Kwang Dong Pharmaceutical Co Ltd 1 148 113 0,15 %<br />
Kyeryong Construction Industrial Co Ltd 1 107 216 0,14 %<br />
Market value<br />
Voting<br />
(per cent)<br />
Kyobo Securities Co 2 397 022 0,16 %<br />
LG Chem Ltd 162 935 679 0,55 %<br />
LG Corp 85 004 884 0,21 %<br />
LG Dacom Corp 38 875 867 0,42 %<br />
LG Display Co Ltd 119 710 510 0,29 %<br />
LG Electronics Inc 126 461 002 0,21 %<br />
LG Fashion Corp 10 686 548 0,31 %<br />
LG Household & Health Care Ltd 334 837 414 2,03 %<br />
LG Innotek Co Ltd 24 655 364 0,00 %<br />
LG International Corp 7 477 679 0,24 %<br />
LG Life Sciences Ltd 3 378 586 0,09 %<br />
LG Micron Ltd 2 274 849 0,20 %<br />
LG Telecom Ltd 18 234 853 0,12 %<br />
LIG Insurance Co Ltd 8 294 949 0,21 %<br />
Lotte Chilsung Beverage Co Ltd 40 332 146 0,61 %<br />
Lotte Confectionery Co Ltd 45 407 580 0,44 %<br />
Lotte Midopa Co Ltd 1 127 513 0,05 %<br />
Lotte Shopping Co Ltd 26 863 815 0,08 %<br />
LS Corp 36 227 726 0,27 %<br />
LS Industrial Systems Co Ltd 33 980 437 0,41 %<br />
Macquarie Korea Infrastructure <strong>Fund</strong> 17 597 134 0,20 %<br />
Maeil Dairy Industry Co Ltd 787 184 0,11 %<br />
MegaStudy Co Ltd 165 930 218 2,59 %<br />
Meritz Fire & Marine Insurance Co Ltd 5 798 263 0,23 %<br />
Meritz Securities Co Ltd 3 701 148 0,28 %<br />
Mirae Asset Securities Co Ltd 17 134 119 0,11 %<br />
MtekVision Co Ltd 196 736 0,11 %<br />
Namhae Chemical 6 710 186 0,13 %<br />
NCS<strong>of</strong>t Corp 11 447 436 0,19 %<br />
Neowiz Games Corp 1 349 032 0,13 %<br />
NEPES Corp 476 825 0,18 %<br />
NH Investment & Securities Co Ltd 5 146 181 0,28 %<br />
NHN Corp 446 576 154 1,28 %<br />
Nong Shim Co Ltd 17 546 252 0,21 %<br />
ON*Media Corp 2 215 696 0,18 %<br />
Orion Corp 12 401 925 0,21 %<br />
Osstem Implant Co Ltd 2 730 602 0,35 %<br />
Ottogi Corp 11 729 306 0,43 %<br />
Pacifi c Corp 8 928 532 0,19 %<br />
Paradise Co Ltd 13 863 348 1,03 %<br />
POSCO 901 922 959 0,49 %<br />
Posdata Co Ltd 4 357 855 0,22 %<br />
Pusan <strong>Bank</strong> 12 533 844 0,26 %<br />
Pyeong San Co Ltd 2 946 085 0,12 %<br />
ReignCom Ltd 261 815 0,08 %<br />
S&T Daewoo Co Ltd 1 826 547 0,32 %<br />
S&T Dynamics Co Ltd 29 491 395 1,87 %<br />
S1 Corp/Korea 63 676 632 0,56 %<br />
Sam Young Electronics Co Ltd 1 698 849 0,18 %<br />
Samchully Co Ltd 9 348 514 0,26 %<br />
Samsung C&T Corp 116 521 721 0,34 %<br />
Samsung Card Co 19 104 910 0,08 %<br />
Samsung Electro-Mechanics Co Ltd 26 693 611 0,19 %<br />
Samsung Electronics Co Ltd 2 271 287 418 0,62 %<br />
Samsung Engineering Co Ltd 24 898 115 0,26 %<br />
Samsung Fine Chemicals Co Ltd 9 892 635 0,18 %<br />
Samsung Fire & Marine Insurance Co Ltd 320 877 297 0,64 %<br />
Samsung Heavy Industries Co Ltd 121 750 097 0,42 %<br />
Samsung SDI Co Ltd 40 472 977 0,29 %<br />
Samsung Securities Co Ltd 63 084 421 0,27 %<br />
Samsung Techwin Co Ltd 31 401 821 0,26 %<br />
Samyang Corp 2 851 884 0,17 %<br />
Seah Besteel Corp 30 830 154 0,93 %<br />
Seoul Semiconductor Co Ltd 35 043 374 1,40 %<br />
Sewon Cellontech Co Ltd 3 439 460 0,29 %<br />
SFA Engineering Corp 6 012 333 0,36 %<br />
Shinhan Financial Group Co Ltd 661 774 880 1,01 %<br />
Shinsegae Co Ltd 316 702 645 0,63 %<br />
Shinsung ENG Co Ltd 220 868 0,16 %<br />
Shinsung FA Co Ltd 210 465 0,16 %<br />
Shinsung <strong>Holding</strong>s Co Ltd 936 290 0,16 %<br />
Sindo Ricoh Co Ltd 2 495 620 0,08 %<br />
SK Broadband Co Ltd 47 581 444 0,65 %<br />
SK Chemicals Co Ltd 8 353 250 0,27 %<br />
SK Communications Co Ltd 1 905 239 0,15 %<br />
SK Energy Co Ltd 142 290 834 0,37 %<br />
SK Gas Co Ltd 3 677 153 0,16 %<br />
SK <strong>Holding</strong>s Co Ltd 66 682 057 0,27 %<br />
SK Networks Co Ltd 26 952 306 0,24 %<br />
SK Securities Co Ltd 4 741 429 0,20 %<br />
SK Telecom Co Ltd 227 396 248 0,24 %<br />
SKC Co Ltd 2 151 091 0,07 %<br />
SODIFF Advanced Materials Co Ltd 6 005 111 0,19 %<br />
S-Oil Corp 77 293 069 0,20 %<br />
Solborn Inc 388 718 0,18 %<br />
Ssangyong Cement Industrial Co Ltd 4 036 630 0,15 %<br />
Ssangyong Motor Co 1 897 246 0,29 %<br />
SSCP Co Ltd 2 365 132 0,26 %<br />
STX Corp Co Ltd 9 229 606 0,25 %<br />
STX Engine Co Ltd 4 908 825 0,19 %<br />
STX Shipbuilding Co Ltd 9 563 179 0,19 %<br />
21<br />
GOVERNMENT PENSION FUND <strong>–</strong> GLOBAL ANNUAL REPORT 2008
<strong>Government</strong> <strong>Pension</strong> <strong>Fund</strong> <strong>–</strong> <strong>Global</strong> <strong>Holding</strong> <strong>of</strong> equities at 31 December 2008<br />
Market value<br />
Voting<br />
(per cent)<br />
Sung Kwang Bend Co Ltd 4 099 012 0,21 %<br />
Sungshin Cement Co Ltd 770 415 0,18 %<br />
Taekwang Industrial Co Ltd 18 566 664 0,29 %<br />
Taewoong Co Ltd 160 508 711 2,29 %<br />
Taeyoung Engineering & Construction 4 108 199 0,23 %<br />
Taihan Electric Wire Co Ltd 12 266 587 0,25 %<br />
Technosemichem Co Ltd 13 632 714 1,72 %<br />
TK Corp 6 277 057 0,24 %<br />
Tong Yang Major Corp 2 668 530 0,23 %<br />
Tong Yang Securities Inc 10 209 293 0,26 %<br />
Union Steel 295 394 0,04 %<br />
Unison Co Ltd/South Korea 1 465 680 0,08 %<br />
Webzen Inc 426 004 0,14 %<br />
Woongjin Chemical Co Ltd 4 215 445 0,27 %<br />
Woongjin Coway Co Ltd 63 096 832 0,57 %<br />
Woongjin <strong>Holding</strong>s Co Ltd 5 395 511 0,25 %<br />
Woongjin Thinkbig Co Ltd 11 730 695 0,57 %<br />
Wooree ETI Co Ltd 542 182 0,13 %<br />
Woori Finance <strong>Holding</strong>s Co Ltd 41 647 094 0,15 %<br />
Woori Investment & Securities Co Ltd 18 312 719 0,20 %<br />
Yedang Entertainment Co Ltd 367 420 0,16 %<br />
Youlchon Chemical Co Ltd 1 323 999 0,14 %<br />
Youngone Corp 9 315 842 0,53 %<br />
Yuhan Corp 51 749 886 0,42 %<br />
Yungjin Pharmaceutical Co Ltd 283 920 0,06 %<br />
LUXEMBOURG<br />
Luxempart SA 44 457 685 0,95 %<br />
Millicom International Cellular SA 5 440 233 0,02 %<br />
Orifl ame Cosmetics SA 133 378 983 1,19 %<br />
Reinet Investments SCA 56 013 106 0,70 %<br />
Variopartner SICAV - MIV <strong>Global</strong> Medtech <strong>Fund</strong> 2 991 991 0,00 %<br />
MALAYSIA<br />
Aeon Co M BhD 22 949 079 0,77 %<br />
AirAsia BhD 8 405 671 0,20 %<br />
Alliance Financial Group BhD 33 444 798 0,59 %<br />
AMMB <strong>Holding</strong>s BhD 65 108 881 0,48 %<br />
Asiatic Development BhD 43 796 387 0,81 %<br />
Astro All Asia Networks PLC 6 618 763 0,08 %<br />
Batu Kawan BhD 2 876 143 0,04 %<br />
Berjaya Land BhD 801 688 0,01 %<br />
Berjaya Sports Toto BhD 58 085 993 0,44 %<br />
Boustead <strong>Holding</strong>s BhD 9 882 019 0,22 %<br />
British American Tobacco Malaysia BhD 65 776 837 0,26 %<br />
Bumiputra-Commerce <strong>Holding</strong>s BhD 211 791 588 0,50 %<br />
Bursa Malaysia BhD 10 193 955 0,19 %<br />
CB Industrial Product <strong>Holding</strong> BhD 13 025 120 2,75 %<br />
Dialog Group BhD 7 579 037 0,33 %<br />
Digi.Com BhD 78 691 988 0,23 %<br />
Evergreen Fibreboard BhD 13 320 192 2,38 %<br />
Freight Management <strong>Holding</strong>s BhD 354 585 0,26 %<br />
Gamuda BhD 33 079 185 0,43 %<br />
Genting BhD 56 717 050 0,20 %<br />
Guinness Anchor BhD 17 169 311 0,56 %<br />
Hiap Teck Venture BhD 10 641 516 2,36 %<br />
Hong Leong <strong>Bank</strong> BhD 93 944 970 0,58 %<br />
IGB Corp BhD 50 491 993 1,21 %<br />
IJM Corp BhD 62 223 737 1,17 %<br />
IJM Land BhD 2 504 303 0,17 %<br />
IJM Plantations BhD 11 362 725 0,45 %<br />
IOI Corp BhD 168 068 104 0,38 %<br />
Kim Loong Resources BhD 8 782 273 0,96 %<br />
KLCC Property <strong>Holding</strong>s BhD 12 697 357 0,24 %<br />
KNM Group BhD 29 483 993 0,91 %<br />
Kuala Lumpur Kepong BhD 50 868 982 0,26 %<br />
Kulim Malaysia BhD 3 900 259 0,14 %<br />
Lion Diversifi ed <strong>Holding</strong>s BhD 7 934 939 1,52 %<br />
Malayan <strong>Bank</strong>ing BhD 148 028 118 0,29 %<br />
Malaysian Airline System BhD 13 468 924 0,13 %<br />
Malaysian Bulk Carriers BhD 3 311 212 0,07 %<br />
Malaysian Resources Corp BhD 15 145 293 1,17 %<br />
MISC BhD 102 014 607 0,08 %<br />
MMC Corp BhD 6 159 970 0,10 %<br />
Muhibbah Engineering M BhD 5 465 924 0,69 %<br />
Oriental <strong>Holding</strong>s BhD 16 995 270 0,33 %<br />
Parkson <strong>Holding</strong>s BhD 22 972 467 0,28 %<br />
Petronas Dagangan BhD 77 381 381 0,53 %<br />
Petronas Gas BhD 109 812 761 0,28 %<br />
PLUS Expressways BhD 77 127 358 0,26 %<br />
POS Malaysia BhD 18 600 087 0,85 %<br />
PPB Group BhD 46 323 323 0,21 %<br />
Public <strong>Bank</strong> BhD 212 468 454 0,17 %<br />
Ranhill BhD 2 513 774 0,28 %<br />
Resorts World BhD 118 465 146 0,44 %<br />
RHB Capital BhD 29 899 311 0,18 %<br />
SapuraCrest Petroleum BhD 5 460 942 0,30 %<br />
Sarawak Oil Palms BhD 7 758 367 0,46 %<br />
Scomi Group BhD 5 969 205 0,86 %<br />
Selangor Properties BhD 6 288 048 0,33 %<br />
Sime Darby BhD 179 629 243 0,28 %<br />
SP Setia BhD 37 109 976 0,58 %<br />
Star Publications Malaysia BhD 24 981 712 0,52 %<br />
Market value<br />
Voting<br />
(per cent)<br />
Sunrise BhD 16 339 137 1,14 %<br />
Ta Ann <strong>Holding</strong>s BhD 22 482 084 1,44 %<br />
TA Enterprise BhD 17 691 139 0,96 %<br />
TAN Chong Motor <strong>Holding</strong>s BhD 6 243 947 0,40 %<br />
Tanjong Plc 128 597 290 1,18 %<br />
Telekom Malaysia BhD 65 361 357 0,29 %<br />
Tenaga Nasional BhD 145 460 533 0,27 %<br />
TM International BhD 77 398 829 0,28 %<br />
Top Glove Corp BhD 4 596 191 0,22 %<br />
TSH Resources BhD 19 952 585 1,77 %<br />
UEM Land <strong>Holding</strong>s BhD 6 496 168 0,25 %<br />
UMW <strong>Holding</strong>s BhD 53 831 710 0,47 %<br />
Unisem M BhD 10 109 636 1,51 %<br />
United Malacca BhD 13 963 725 0,90 %<br />
United Plantations BhD 63 262 759 1,46 %<br />
WCT Berhad 45 831 246 1,93 %<br />
YTL Corp BhD 65 967 644 0,28 %<br />
YTL Power International BhD 88 012 431 0,39 %<br />
Zelan BhD 9 946 754 0,99 %<br />
MEXICO<br />
Alfa SAB de CV 20 334 456 0,24 %<br />
America Movil SAB de CV 1 411 762 329 0,45 %<br />
Axtel SAB de CV 12 179 775 0,26 %<br />
Carso <strong>Global</strong> Telecom SAB de CV 128 876 993 0,13 %<br />
Carso Infraestructura y Construccion SAB de CV 13 943 916 0,15 %<br />
Cemex SAB de CV 260 421 052 0,50 %<br />
Coca-Cola Femsa SAB de CV 21 448 645 0,26 %<br />
Consorcio ARA SAB de CV 12 967 724 0,36 %<br />
Controladora Comercial Mexicana SAB de CV 2 558 651 0,44 %<br />
Corp GEO SAB de CV 18 404 639 0,44 %<br />
Desarrolladora Homex SAB de CV 35 207 029 0,40 %<br />
Empresas ICA SAB de CV 19 198 948 0,34 %<br />
Fomento Economico Mexicano SAB de CV 210 731 169 0,47 %<br />
Gruma SAB de CV 2 183 149 0,11 %<br />
Grupo Aeroportuario del Centro Norte SAB de CV 8 291 677 0,00 %<br />
Grupo Aeroportuario del Pacifi co SAB de CV 38 807 346 0,37 %<br />
Grupo Aeroportuario del Sureste SAB de CV 31 773 782 0,44 %<br />
Grupo Bimbo SAB de CV 51 603 824 0,15 %<br />
Grupo Carso SAB de CV 62 205 249 0,14 %<br />
Grupo Continental SAB de CV 5 492 731 0,06 %<br />
Grupo Elektra SA de CV 106 314 182 0,15 %<br />
Grupo Famsa SAB de CV 2 309 387 0,16 %<br />
Grupo Industrial Saltillo SAB de CV 966 604 0,13 %<br />
Grupo Mexico SAB de CV 146 449 949 0,43 %<br />
Grupo Modelo SAB de CV 66 944 626 0,48 %<br />
Grupo Simec SAB de CV 3 674 151 0,07 %<br />
Grupo Televisa SA 224 619 048 0,45 %<br />
Impulsora Del Desarrollo Y El Empleo en America<br />
Latina SAB de CV 18 586 351 0,13 %<br />
Industrias CH SAB de CV 10 802 895 0,14 %<br />
Industrias Penoles SAB de CV 215 106 618 0,63 %<br />
Kimberly-Clark de Mexico SAB de CV 48 551 343 0,37 %<br />
Megacable <strong>Holding</strong>s SAB de CV 51 010 360 0,64 %<br />
Mexichem SAB de CV 18 945 655 0,18 %<br />
Organizacion Soriana SAB de CV 24 089 670 0,09 %<br />
Promotora y Operadora de Infraestructura SAB de CV 12 125 063 0,35 %<br />
Sare <strong>Holding</strong> SAB de CV 2 784 611 0,49 %<br />
Telefonos de Mexico SAB de CV 98 581 537 0,00 %<br />
Telmex Internacional SAB de CV 118 416 793 0,30 %<br />
TV Azteca SA de CV 10 908 825 0,13 %<br />
Urbi Desarrollos Urbanos SAB de CV 24 476 174 0,26 %<br />
Vitro SAB de CV 3 476 031 0,24 %<br />
MONACO<br />
Societe des Bains de Mer et du Cercle des Etrangers a<br />
Monaco 106 416 228 1,66 %<br />
MOROCCO<br />
Attijariwafa <strong>Bank</strong> 21 582 895 0,50 %<br />
Banque Marocaine du Commerce Exterieur 22 636 959 0,60 %<br />
Compagnie Generale Immobiliere 14 909 884 0,04 %<br />
Douja Promotion Groupe Addoha SA 21 621 249 0,00 %<br />
Maroc Telecom 48 759 311 0,04 %<br />
ONA SA 7 200 968 0,00 %<br />
Sonasid 3 358 691 0,04 %<br />
NETHERLANDS<br />
Advanced Metallurgical Group NV 24 076 627 1,34 %<br />
Aegon NV 984 360 268 1,44 %<br />
Akzo Nobel NV 1 228 796 668 1,85 %<br />
Arcadis NV 43 029 668 0,76 %<br />
ASM International NV 46 218 170 1,42 %<br />
ASML <strong>Holding</strong> NV 1 194 510 685 1,77 %<br />
Beter BED <strong>Holding</strong> NV 14 497 178 0,80 %<br />
Binck<strong>Bank</strong> NV 46 768 662 1,14 %<br />
Brunel International 7 359 496 0,39 %<br />
Chicago Bridge & Iron Co NV 3 518 555 0,05 %<br />
CNH <strong>Global</strong> NV 32 769 828 0,13 %<br />
Corio NV 261 696 990 1,22 %<br />
Crucell NV 116 709 531 1,71 %<br />
CSM 114 843 303 1,65 %<br />
Draka <strong>Holding</strong> 32 114 244 1,24 %<br />
Eurocastle Investment Ltd 1 276 453 0,98 %<br />
Eurocommercial Properties NV 115 633 820 1,38 %<br />
22<br />
GOVERNMENT PENSION FUND <strong>–</strong> GLOBAL ANNUAL REPORT 2008
<strong>Government</strong> <strong>Pension</strong> <strong>Fund</strong> <strong>–</strong> <strong>Global</strong> <strong>Holding</strong> <strong>of</strong> equities at 31 December 2008<br />
Market value<br />
Voting<br />
(per cent)<br />
Exact <strong>Holding</strong> NV 37 030 733 1,18 %<br />
Fugro NV 165 273 083 1,08 %<br />
Grontmij 39 780 816 1,31 %<br />
Heijmans NV 8 339 499 1,05 %<br />
Heineken <strong>Holding</strong> NV 286 194 825 0,59 %<br />
Heineken NV 761 266 375 0,73 %<br />
Hunter Douglas NV 49 380 004 0,61 %<br />
Imtech NV 118 496 803 1,26 %<br />
ING Groep NV 1 916 920 028 1,30 %<br />
Kardan NV 5 037 867 0,30 %<br />
KAS <strong>Bank</strong> NV 6 148 114 0,41 %<br />
Koninklijke Ahold NV 1 463 361 725 1,44 %<br />
Koninklijke BAM Groep NV 91 590 839 1,09 %<br />
Koninklijke Boskalis Westminster NV 138 253 204 1,00 %<br />
Koninklijke DSM NV 390 267 145 1,21 %<br />
Koninklijke KPN NV 2 757 944 157 1,59 %<br />
Koninklijke Philips Electronics NV 1 674 615 055 1,28 %<br />
Koninklijke Vopak NV 90 158 737 0,55 %<br />
Koninklijke Wessanen NV 45 930 320 1,48 %<br />
Macintosh Retail Group NV 11 137 835 0,79 %<br />
Nieuwe Steen Investments <strong>Fund</strong>s NV 42 605 693 1,09 %<br />
Nutreco <strong>Holding</strong> NV 112 311 276 1,41 %<br />
OCE NV 34 309 152 1,29 %<br />
OPG Groep NV 70 734 119 1,34 %<br />
Ordina NV 12 892 833 1,12 %<br />
Pharming Group NV 6 658 780 1,09 %<br />
ProLogis European Properties 16 502 349 0,28 %<br />
Randstad <strong>Holding</strong> NV 203 929 778 0,85 %<br />
Reed Elsevier NV 736 935 354 1,36 %<br />
SBM Offshore NV 155 858 901 1,18 %<br />
Schuitema NV 37 439 024 0,45 %<br />
Sligro Food Group NV 30 276 006 0,48 %<br />
Smit Internationale NV 66 451 135 1,09 %<br />
SNS Reaal 60 327 211 0,60 %<br />
Super De Boer NV 23 606 501 0,77 %<br />
Telegraaf Media Groep NV 2 889 761 0,05 %<br />
Ten Cate NV 41 418 184 1,11 %<br />
TKH Group NV 18 867 905 0,68 %<br />
TNT NV 606 191 848 1,26 %<br />
TomTom NV 31 583 224 0,51 %<br />
Unilever NV 3 695 890 944 1,28 %<br />
Unit 4 Agresso NV 21 040 033 1,04 %<br />
USG People NV 60 434 383 1,04 %<br />
Van der Moolen <strong>Holding</strong> NV 14 079 517 1,59 %<br />
Vastned Offi ces/Industrial 16 487 040 1,19 %<br />
Vastned Retail NV 76 833 462 1,34 %<br />
Wavin NV 25 886 033 1,41 %<br />
Wegener NV 22 371 0,00 %<br />
Wereldhave NV 173 126 699 1,36 %<br />
Wolters Kluwer NV 775 058 192 2,05 %<br />
Aalberts Industries NV 75 295 556 1,50 %<br />
NEW ZEALAND<br />
Air New Zealand Ltd 7 134 301 0,17 %<br />
AMP NZ Offi ce Trust 10 320 150 0,37 %<br />
Auckland International Airport Ltd 41 393 619 0,51 %<br />
Briscoe Group Ltd 7 468 0,00 %<br />
Contact Energy Ltd 51 503 778 0,30 %<br />
Fisher & Paykel Appliances <strong>Holding</strong>s Ltd 9 347 716 0,59 %<br />
Fisher & Paykel Healthcare Corp Ltd 38 362 131 0,58 %<br />
Fletcher Building Ltd 74 794 484 0,63 %<br />
Freightways Ltd 8 025 493 0,48 %<br />
Goodman Property Trust 14 266 425 0,44 %<br />
Hellaby <strong>Holding</strong>s Ltd 107 582 0,04 %<br />
Infratil Ltd 14 798 752 0,43 %<br />
Kiwi Income Property Trust 19 283 052 0,64 %<br />
Mainfreight Ltd 4 640 700 0,24 %<br />
Nuplex Industries Ltd 4 531 887 0,45 %<br />
Port <strong>of</strong> Tauranga Ltd 8 538 860 0,24 %<br />
Pumpkin Patch Ltd 2 611 188 0,40 %<br />
Sky City Entertainment Group Ltd 41 119 743 0,68 %<br />
Sky Network Television Ltd 17 095 109 0,29 %<br />
Steel & Tube <strong>Holding</strong>s Ltd 235 950 0,02 %<br />
Telecom Corp <strong>of</strong> New Zealand Ltd 104 203 433 0,60 %<br />
Tower Ltd 3 426 807 0,28 %<br />
Vector Ltd 14 615 295 0,18 %<br />
Warehouse Group Ltd/The 11 684 214 0,26 %<br />
PAPUA NEW GUINEA<br />
ihir Gold Ltd 581 575 282 1,81 %<br />
New Britain Palm Oil Ltd 136 230 0,01 %<br />
PERU<br />
Cia de Minas Buenaventura SA 125 076 288 0,00 %<br />
Credicorp Ltd 69 299 173 0,21 %<br />
Sociedad Minera Cerro Verde SA 3 899 055 0,02 %<br />
Volcan Cia Minera SAA 6 859 492 0,31 %<br />
PHILIPPINES<br />
Aboitiz Power Corp 9 848 590 0,24 %<br />
Alliance <strong>Global</strong> Group Inc 5 882 745 0,23 %<br />
Ayala Corp 30 234 248 0,20 %<br />
Ayala Land Inc 51 063 176 0,42 %<br />
Banco de Oro Unibank Inc 12 161 124 0,15 %<br />
<strong>Bank</strong> <strong>of</strong> the Philippine Islands 64 072 202 0,35 %<br />
Market value<br />
Voting<br />
(per cent)<br />
Energy Development Corp 17 953 252 0,43 %<br />
First Philippine <strong>Holding</strong>s Corp 3 026 052 0,23 %<br />
Jollibee Foods Corp 35 599 523 0,57 %<br />
Manila Electric Co 20 818 105 0,21 %<br />
Manila Water Co Inc 12 140 725 0,31 %<br />
Megaworld Corp 10 771 280 0,54 %<br />
Metropolitan <strong>Bank</strong> & Trust 50 375 434 0,82 %<br />
Philippine Long Distance Telephone Co 65 750 183 0,11 %<br />
Robinsons Land Corp 5 009 807 0,25 %<br />
SM Investments Corp 23 892 208 0,14 %<br />
SM Prime <strong>Holding</strong>s Inc 19 923 956 0,14 %<br />
Vista Land & Lifescapes Inc 2 562 760 0,21 %<br />
POLAND<br />
Agora SA 13 913 680 0,00 %<br />
AmRest <strong>Holding</strong>s NV 2 496 652 0,15 %<br />
Asseco Poland SA 77 501 959 0,89 %<br />
<strong>Bank</strong> Handlowy w Warszawie SA 23 342 841 0,16 %<br />
<strong>Bank</strong> Millennium SA 14 969 605 0,26 %<br />
<strong>Bank</strong> Pekao SA 402 878 778 0,52 %<br />
<strong>Bank</strong> Zachodni WBK SA 93 510 225 0,49 %<br />
Bioton SA 21 536 353 1,49 %<br />
BRE <strong>Bank</strong> SA 71 278 126 0,52 %<br />
Cersanit Krasnystaw SA 9 530 326 0,20 %<br />
Ciech SA 1 311 012 0,08 %<br />
Getin <strong>Holding</strong> SA 28 183 715 0,34 %<br />
Globe Trade Centre SA 59 846 847 0,76 %<br />
Grupa Kety SA 6 471 897 0,49 %<br />
Grupa Lotos SA 28 504 629 0,89 %<br />
KGHM Polska Miedz SA 98 484 015 0,74 %<br />
Orbis SA 1 999 728 0,06 %<br />
PBG SA 56 242 474 0,90 %<br />
Polimex Mostostal SA 32 884 777 0,98 %<br />
Polnord SA 3 229 066 0,26 %<br />
Polski Koncern Naftowy Orlen 248 843 073 0,96 %<br />
Polskie Gornictwo Naftowe I Gazownictwo SA 133 389 713 0,27 %<br />
Powszechna Kasa Oszczednosci <strong>Bank</strong> Polski SA 537 575 224 0,64 %<br />
Synthos SA 1 726 565 0,13 %<br />
Telekomunikacja Polska SA 399 242 967 0,64 %<br />
TVN SA 75 783 272 0,68 %<br />
PORTUGAL<br />
Altri SGPS SA 29 356 009 1,40 %<br />
Banco BPI SA 69 388 547 0,45 %<br />
Banco Comercial Portugues SA 344 502 993 0,93 %<br />
Banco Espirito Santo SA 101 381 243 0,31 %<br />
BANIF SA 17 405 453 0,47 %<br />
BRISA 271 542 370 0,87 %<br />
Cimpor Cimentos de Portugal SGPS SA 83 684 772 0,37 %<br />
Energias de Portugal SA 1 761 311 209 1,84 %<br />
F. Ramada Investimentos SGPS SA 1 036 155 0,66 %<br />
Galp Energia SGPS SA 250 571 330 0,43 %<br />
Grupo Media Capital SGPS 17 515 0,00 %<br />
Impresa SGPS 4 266 855 0,31 %<br />
Jeronimo Martins SGPS SA 147 674 317 0,61 %<br />
Mota Engil SGPS SA 28 257 990 0,60 %<br />
Portucel Empresa Produtora de Pasta e Papel SA 17 531 721 0,15 %<br />
Portugal Telecom SGPS SA 572 337 784 1,08 %<br />
SAG GEST-Solucoes Automovel Globais SGPS SA 2 730 431 0,17 %<br />
Semapa-Sociedade de Investimento e Gestao 45 585 924 0,62 %<br />
Sonae Capital SGPS SA 4 758 890 0,44 %<br />
Sonae Industria SGPS SA 17 727 649 0,85 %<br />
Sonae SGPS SA 69 772 045 0,82 %<br />
SONAECOM - SGPS SA 25 222 821 0,70 %<br />
Teixeira Duarte - Engenharia Construcoes SA 1 957 398 0,08 %<br />
Zon Multimedia Servicos de Telecomunicacoes e<br />
Multimedia SGPS SA 132 037 147 1,18 %<br />
RUSSIAN FEDERATION<br />
Aer<strong>of</strong>l ot - Russian International Airlines 23 038 757 0,32 %<br />
AK Transneft OAO 95 923 588 0,00 %<br />
Bashneft 61 089 981 0,08 %<br />
Central Telecommunication Co 10 414 546 0,00 %<br />
Comstar United Telesystems OJSC 7 015 527 0,06 %<br />
Dixy Group OJSC 10 050 204 0,00 %<br />
GAZ Auto Plant 12 747 265 1,02 %<br />
Gazprom OAO 3 370 422 406 0,34 %<br />
Gazpromneft OAO 21 661 993 0,03 %<br />
<strong>Holding</strong> MRSK OAO 11 946 796 0,00 %<br />
Inter-Regional Distribution Network Co Center and<br />
Privolzhya OJSC 69 001 280 3,00 %<br />
Inter-Regional Distribution Network Co North-West OJSC 14 859 541 1,25 %<br />
Inter-Regional Distribution Network Co Urala OAO 10 580 292 0,00 %<br />
Inter-Regional Distribution Network Co Volga OAO 2 319 446 0,07 %<br />
Kuzbassenergo JSC 10 129 422 0,00 %<br />
LUKOIL 1 570 381 466 0,54 %<br />
M Video 17 147 807 1,63 %<br />
MAGNIT OJSC 184 560 920 0,00 %<br />
Magnitogorsk Iron & Steel Works 66 244 772 0,00 %<br />
MMC Norilsk Nickel 328 602 491 0,32 %<br />
Mobile Telesystems OJSC 332 540 701 0,28 %<br />
Mosenergo OAO 20 273 061 0,23 %<br />
OGK-2 OAO 17 791 424 0,48 %<br />
OGK-4 OJSC 3 834 128 0,07 %<br />
23<br />
GOVERNMENT PENSION FUND <strong>–</strong> GLOBAL ANNUAL REPORT 2008
<strong>Government</strong> <strong>Pension</strong> <strong>Fund</strong> <strong>–</strong> <strong>Global</strong> <strong>Holding</strong> <strong>of</strong> equities at 31 December 2008<br />
Market value<br />
Voting<br />
(per cent)<br />
OGK-6 11 274 529 0,00 %<br />
Pharmstandard 28 182 637 0,00 %<br />
Polyus Gold Co 121 611 362 0,36 %<br />
RAO Energy System <strong>of</strong> East OAO 4 921 117 0,86 %<br />
Rosneft Oil Co 479 812 828 0,15 %<br />
Rostelecom 47 690 622 0,05 %<br />
Sberbank 677 956 728 0,59 %<br />
Severstal 34 877 475 0,18 %<br />
Sistema JSFC 108 024 628 0,00 %<br />
Surgutneftegaz 855 630 551 0,44 %<br />
Tatneft 115 734 766 0,30 %<br />
TNK-BP <strong>Holding</strong> 75 241 578 0,09 %<br />
Uralkali 23 083 823 0,00 %<br />
Uralsvyazinform 18 246 149 0,78 %<br />
URSA <strong>Bank</strong> 4 678 004 1,04 %<br />
Vimpel-Communications 153 427 549 0,00 %<br />
Volga Territorial Generating Co 6 916 694 0,47 %<br />
Volgatelecom Pub JT STK Co Sponsored ADR 2 902 934 0,00 %<br />
VTB <strong>Bank</strong> OJSC 130 135 457 0,06 %<br />
Wimm-Bill-Dann Foods OJSC 55 267 575 0,00 %<br />
Yenisei Territorial Generating Co 4 172 608 0,37 %<br />
SINGAPORE<br />
Allgreen Properties Ltd 9 913 044 0,30 %<br />
Ascendas India Trust 5 375 713 0,32 %<br />
Ascendas Real Estate Investment Trust 52 034 242 0,59 %<br />
Banyan Tree <strong>Holding</strong>s Ltd 4 957 239 0,32 %<br />
Beyonics Technology Ltd 1 243 101 0,39 %<br />
Biosensors International Group Ltd 6 924 096 0,45 %<br />
Bio-Treat Technology Ltd 718 071 0,33 %<br />
Bukit Sembawang Estates Ltd 12 574 182 0,59 %<br />
Cambridge Industrial Trust 4 445 234 0,42 %<br />
CapitaCommercial Trust 24 806 969 0,41 %<br />
CapitaLand Ltd 176 791 665 0,41 %<br />
CapitaMall Trust 54 061 315 0,42 %<br />
CapitaRetail China Trust 8 153 200 0,45 %<br />
CDL Hospitality Trusts 12 419 526 0,42 %<br />
Celestial Nutrifoods Ltd 5 186 050 0,45 %<br />
Cerebos Pacifi c Ltd 3 112 854 0,07 %<br />
CH Offshore Ltd 3 093 317 0,35 %<br />
Chartered Semiconductor Manufacturing Ltd 5 072 137 0,23 %<br />
China Energy Ltd 2 980 904 0,33 %<br />
China Fishery Group Ltd 8 401 791 0,35 %<br />
China Flexible Packaging <strong>Holding</strong>s Ltd 1 043 936 0,23 %<br />
China Hongxing Sports Ltd 9 444 221 0,41 %<br />
China Milk Products Group Ltd 6 873 844 0,50 %<br />
China Sky Chemical Fibre Co Ltd 1 826 961 0,16 %<br />
China Sun Bio-chem Technology Group Co Ltd 2 191 100 0,43 %<br />
China XLX Fertiliser Ltd 7 095 048 0,39 %<br />
Chuan Hup <strong>Holding</strong>s Ltd 1 938 232 0,21 %<br />
City Developments Ltd 85 608 145 0,30 %<br />
Cityspring Infrastructure Trust 24 300 191 2,04 %<br />
ComfortDelgro Corp Ltd 104 063 134 0,71 %<br />
Cosco Corp Singapore Ltd 22 540 371 0,22 %<br />
Creative Technology Ltd 7 229 553 0,40 %<br />
CSE <strong>Global</strong> Ltd 4 514 368 0,48 %<br />
DBS Group <strong>Holding</strong>s Ltd 353 375 752 0,38 %<br />
Elec & Eltek International Co Ltd 538 812 0,05 %<br />
Ezra <strong>Holding</strong>s Ltd 8 179 444 0,42 %<br />
FerroChina Ltd 10 096 924 0,48 %<br />
FibreChem Technologies Ltd 4 452 354 0,47 %<br />
First Ship Lease Trust 4 379 429 0,37 %<br />
FJ Benjamin <strong>Holding</strong>s Ltd 5 613 344 1,23 %<br />
Fortune Real Estate Investment Trust 4 652 457 0,32 %<br />
Fraser and Neave Ltd 131 739 928 0,66 %<br />
Frasers Centrepoint Trust 3 992 619 0,21 %<br />
Frasers Commercial Trust 5 493 544 0,67 %<br />
Fu Yu Corp Ltd 87 092 0,04 %<br />
Gallant Venture Ltd 1 687 794 0,12 %<br />
<strong>Global</strong> Voice Group Ltd 658 960 0,43 %<br />
Golden Agri-Resources Ltd 45 228 657 0,40 %<br />
Goodpack Ltd 5 901 496 0,31 %<br />
Guocoland Ltd 3 213 457 0,07 %<br />
Haw Par Corp Ltd 11 722 433 0,34 %<br />
Hi-P International Ltd 1 516 332 0,12 %<br />
Hong Leong Asia Ltd 1 578 929 0,14 %<br />
Hong Leong Finance Ltd 41 278 151 0,94 %<br />
Hotel Properties Ltd 4 641 752 0,17 %<br />
HTL International <strong>Holding</strong>s Ltd 499 077 0,27 %<br />
Huan Hsin <strong>Holding</strong>s Ltd 243 852 0,06 %<br />
Hyfl ux Ltd 18 512 469 0,41 %<br />
Ind<strong>of</strong>ood Agri Resources Ltd 5 975 903 0,16 %<br />
Jardine Cycle & Carriage Ltd 37 267 147 0,23 %<br />
Jaya <strong>Holding</strong>s Ltd 3 504 331 0,33 %<br />
Jurong Technologies Industrial Corp Ltd 915 748 0,39 %<br />
K1 Ventures Ltd 2 518 180 0,17 %<br />
Keppel Corp Ltd 160 761 122 0,48 %<br />
Keppel Land Ltd 16 938 885 0,28 %<br />
Keppel Telecommunications & Transportation Ltd 2 576 258 0,12 %<br />
Kim Eng <strong>Holding</strong>s Ltd 7 284 594 0,23 %<br />
K-REIT Asia 4 634 921 0,21 %<br />
KS Energy Services Ltd 4 821 061 0,29 %<br />
Market value<br />
Voting<br />
(per cent)<br />
Macquarie International Infrastructure <strong>Fund</strong> Ltd 8 618 038 0,46 %<br />
Mapletree Logistics Trust 14 286 811 0,43 %<br />
Metro <strong>Holding</strong>s Ltd 3 868 906 0,35 %<br />
MFS Technology Ltd 168 546 0,03 %<br />
Midas <strong>Holding</strong>s Ltd 3 731 319 0,19 %<br />
MobileOne Ltd 18 005 878 0,28 %<br />
Neptune Orient Lines Ltd/Singapore 17 676 855 0,22 %<br />
Noble Group Ltd 27 264 021 0,17 %<br />
Olam International Ltd 38 516 332 0,40 %<br />
OSIM International Ltd 97 298 0,05 %<br />
Oversea-Chinese <strong>Bank</strong>ing Corp Ltd 275 398 709 0,36 %<br />
Pacifi c Century Regional Developments Ltd 2 352 161 0,11 %<br />
Parkway <strong>Holding</strong>s Ltd 28 714 889 0,42 %<br />
Peoples Food <strong>Holding</strong>s Ltd 5 701 602 0,15 %<br />
Pine Agritech Ltd 3 341 616 0,18 %<br />
Raffl es Education Corp Ltd 26 500 889 0,42 %<br />
SembCorp Industries Ltd 57 227 445 0,28 %<br />
SembCorp Marine Ltd 49 799 899 0,29 %<br />
SIA Engineering Co Ltd 11 372 489 0,11 %<br />
Singapore Airlines Ltd 207 708 339 0,32 %<br />
Singapore Airport Terminal Services Ltd 20 017 525 0,27 %<br />
Singapore Exchange Ltd 181 883 818 0,69 %<br />
Singapore Food Industries Ltd 1 038 104 0,05 %<br />
Singapore Land Ltd 15 601 889 0,22 %<br />
Singapore Petroleum Co Ltd 36 307 255 0,64 %<br />
Singapore Post Ltd 51 592 391 0,69 %<br />
Singapore Press <strong>Holding</strong>s Ltd 117 338 796 0,49 %<br />
Singapore Telecommunications Ltd 330 491 511 0,17 %<br />
SMRT Corp Ltd 32 405 034 0,27 %<br />
StarHub Ltd 50 849 467 0,32 %<br />
STATS ChipPAC Ltd 3 707 286 0,07 %<br />
Straits Asia Resources Ltd (17 528 039) 0,00 %<br />
Straits Trading Co Ltd 310 556 0,00 %<br />
STX Pan Ocean Co Ltd 83 367 742 0,82 %<br />
Sunningdale Tech Ltd 305 441 0,15 %<br />
Suntec Real Estate Investment Trust 31 200 570 0,59 %<br />
Swiber <strong>Holding</strong>s Ltd 4 812 021 0,42 %<br />
Synear Food <strong>Holding</strong>s Ltd 8 903 323 0,50 %<br />
Tat Hong <strong>Holding</strong>s Ltd 5 895 105 0,36 %<br />
Total Access Communication PCL 10 819 045 0,07 %<br />
United Engineers Ltd 3 838 215 0,30 %<br />
United Fiber System Ltd 1 405 912 0,30 %<br />
United Food <strong>Holding</strong>s Ltd 195 374 0,07 %<br />
United Industrial Corp Ltd 26 258 504 0,37 %<br />
United Overseas <strong>Bank</strong> Ltd 334 850 644 0,35 %<br />
UOB-Kay Hian <strong>Holding</strong>s Ltd 6 182 212 0,18 %<br />
UOL Group Ltd 35 366 196 0,41 %<br />
Venture Corp Ltd 45 706 376 0,78 %<br />
WBL Corp Ltd 36 554 777 1,16 %<br />
Wheelock Properties S Ltd 26 641 234 0,44 %<br />
Wilmar International Ltd 94 523 320 0,11 %<br />
Wing Tai <strong>Holding</strong>s Ltd 14 729 948 0,46 %<br />
Yangzijiang Shipbuilding <strong>Holding</strong>s Ltd 22 991 067 0,28 %<br />
Yanlord Land Group Ltd 61 335 601 0,78 %<br />
SOUTH AFRICA<br />
ABSA Group Ltd 149 055 727 0,27 %<br />
Adcock Ingram <strong>Holding</strong>s Ltd 32 024 015 0,63 %<br />
Aeci Ltd 40 133 546 0,87 %<br />
Afgri Ltd 8 313 064 0,36 %<br />
African <strong>Bank</strong> Investments Ltd 55 543 820 0,35 %<br />
African Oxygen Ltd 11 795 884 0,21 %<br />
African Rainbow Minerals Ltd 14 055 182 0,08 %<br />
Allied Electronics Corp Ltd 19 721 413 0,49 %<br />
Allied Technologies Ltd 7 326 655 0,17 %<br />
Anglo Platinum Ltd 96 476 990 0,10 %<br />
AngloGold Ashanti Ltd 626 710 642 0,37 %<br />
ApexHi Properties Ltd 18 485 289 0,19 %<br />
ArcelorMittal South Africa Ltd 38 094 876 0,13 %<br />
Aspen Pharmacare <strong>Holding</strong>s Ltd 18 382 889 0,18 %<br />
Astral Foods Ltd 29 433 269 0,96 %<br />
Astrapak Ltd 2 692 755 0,38 %<br />
Aveng Ltd 27 210 360 0,30 %<br />
AVI Ltd 19 430 442 0,36 %<br />
Avusa Ltd 5 275 247 0,00 %<br />
Barloworld Ltd 23 466 014 0,33 %<br />
Bidvest Group Ltd 143 776 578 0,54 %<br />
Business Connexion Group Ltd 2 284 819 0,32 %<br />
City Lodge Hotels Ltd 19 950 209 0,86 %<br />
Coronation <strong>Fund</strong> Managers Ltd 2 699 974 0,24 %<br />
DataTec Ltd 9 325 414 0,43 %<br />
Discovery <strong>Holding</strong>s Ltd 32 172 747 0,30 %<br />
ElementOne Ltd 2 939 661 0,31 %<br />
Eqstra <strong>Holding</strong>s Ltd 5 230 902 0,00 %<br />
Exxaro Resources Ltd 16 903 374 0,09 %<br />
FirstRand Ltd 392 469 578 0,57 %<br />
Foschini Ltd 29 303 082 0,39 %<br />
FOUNTAINHEAD PROPERTY TRUST 15 781 387 0,37 %<br />
Freeworld Coatings Ltd 4 388 294 0,44 %<br />
Gold Fields Ltd 526 574 285 0,55 %<br />
Gold Reef Resorts Ltd 4 201 892 0,11 %<br />
Grindrod Ltd 11 772 378 0,21 %<br />
24<br />
GOVERNMENT PENSION FUND <strong>–</strong> GLOBAL ANNUAL REPORT 2008
<strong>Government</strong> <strong>Pension</strong> <strong>Fund</strong> <strong>–</strong> <strong>Global</strong> <strong>Holding</strong> <strong>of</strong> equities at 31 December 2008<br />
Market value<br />
Voting<br />
(per cent)<br />
Group Five Ltd/South Africa 8 836 805 0,27 %<br />
Growthpoint Properties Ltd 42 480 476 0,29 %<br />
Harmony Gold Mining Co Ltd 62 211 244 0,20 %<br />
Highveld Steel and Vanadium Corp Ltd 8 664 630 0,18 %<br />
Hudaco Industries Ltd 4 377 302 0,27 %<br />
Hulamin Ltd 1 838 897 0,09 %<br />
Iliad Africa Ltd 3 909 015 0,56 %<br />
Illovo Sugar Ltd 13 877 003 0,23 %<br />
Impala Platinum <strong>Holding</strong>s Ltd 293 625 914 0,47 %<br />
Imperial <strong>Holding</strong>s Ltd 28 477 297 0,30 %<br />
Investec Ltd 20 785 670 0,25 %<br />
JD Group Ltd 12 856 886 0,26 %<br />
JSE Ltd 9 987 285 0,42 %<br />
Kumba Iron Ore Ltd 28 483 697 0,07 %<br />
Lewis Group Ltd 9 314 300 0,26 %<br />
Liberty <strong>Holding</strong>s Ltd 34 217 702 0,25 %<br />
Massmart <strong>Holding</strong>s Ltd 62 147 894 0,48 %<br />
Medi-Clinic Corp Ltd 21 841 663 0,25 %<br />
Merafe Resources Ltd 2 235 966 0,14 %<br />
Metorex Ltd 2 179 281 0,36 %<br />
Metropolitan <strong>Holding</strong>s Ltd 15 521 070 0,35 %<br />
Mondi Ltd 8 813 804 0,24 %<br />
Mr Price Group Ltd 15 089 756 0,33 %<br />
MTN Group Ltd 559 340 405 0,36 %<br />
Murray & Roberts <strong>Holding</strong>s Ltd 79 848 171 0,66 %<br />
Mvelaphanda Group Ltd 3 506 342 0,21 %<br />
Mvelaphanda Resources Ltd 13 184 098 0,35 %<br />
Nampak Ltd 25 681 199 0,39 %<br />
Naspers Ltd 229 961 644 0,45 %<br />
Nedbank Group Ltd 45 111 501 0,13 %<br />
Netcare Ltd 26 800 619 0,23 %<br />
New Clicks <strong>Holding</strong>s Ltd 15 631 055 0,37 %<br />
Northam Platinum Ltd 4 569 960 0,08 %<br />
Omnia <strong>Holding</strong>s Ltd 5 577 542 0,33 %<br />
Palabora Mining Co Ltd 2 432 657 0,10 %<br />
Pangbourne Properties Ltd 2 507 454 0,08 %<br />
Peregrine <strong>Holding</strong>s Ltd 3 491 673 0,24 %<br />
Pickn Pay <strong>Holding</strong>s Ltd 8 886 753 0,15 %<br />
Pickn Pay Stores Ltd 22 930 742 0,17 %<br />
Pretoria Portland Cement Co Ltd 65 895 994 0,47 %<br />
PSG Group Ltd 3 585 114 0,21 %<br />
Remgro Ltd 135 012 381 0,48 %<br />
Reunert Ltd 51 311 779 0,68 %<br />
RMB <strong>Holding</strong>s Ltd 52 204 072 0,22 %<br />
Sanlam Ltd 101 254 972 0,35 %<br />
Santam Ltd 13 399 732 0,19 %<br />
Sappi Ltd 39 027 852 0,26 %<br />
Sasol Ltd 612 877 988 0,45 %<br />
Sentula Mining Ltd 1 559 887 0,15 %<br />
Shoprite <strong>Holding</strong>s Ltd 178 263 323 0,82 %<br />
Simmer & Jack Mines Ltd 45 935 723 2,79 %<br />
Spar Group Ltd/The 64 476 590 0,88 %<br />
Standard <strong>Bank</strong> Group Ltd 418 282 554 0,44 %<br />
Steinh<strong>of</strong>f International <strong>Holding</strong>s Ltd 60 918 703 0,47 %<br />
Sun International Ltd 32 701 533 0,43 %<br />
Super Group Ltd 1 982 160 0,37 %<br />
Telkom SA Ltd 175 722 688 0,38 %<br />
Tiger Brands Ltd 124 911 346 0,66 %<br />
Tiger Wheels Ltd 4 252 0,00 %<br />
Tongaat Hulett Ltd 6 592 261 0,13 %<br />
Trans Hex Group Ltd 595 015 0,23 %<br />
Trencor Ltd 28 205 322 1,01 %<br />
Truworths International Ltd 58 730 688 0,50 %<br />
Wilson Bayly Holmes-Ovcon Ltd 29 610 157 0,55 %<br />
Woolworths <strong>Holding</strong>s Ltd/South Africa 28 456 184 0,37 %<br />
SPAIN<br />
Abengoa SA 79 569 988 0,77 %<br />
Abertis Infraestructuras SA 438 094 711 0,53 %<br />
Acciona SA 373 004 212 0,68 %<br />
Acerinox SA 308 860 101 1,10 %<br />
ACS Actividades de Construccion y Servicios SA 962 446 442 0,90 %<br />
Adolfo Dominguez SA 3 126 439 0,52 %<br />
Afi rma Grupo Inmobiliario SA 7 286 953 0,62 %<br />
Antena 3 de Television SA 47 532 300 0,54 %<br />
Avanzit SA 16 603 160 0,93 %<br />
Banco Bilbao Vizcaya Argentaria SA 3 954 748 395 1,25 %<br />
Banco de Sabadell SA 704 819 854 1,24 %<br />
Banco de Valencia SA 213 525 110 0,63 %<br />
Banco Espanol de Credito SA 79 765 827 0,15 %<br />
Banco Guipuzcoano SA 11 744 648 0,14 %<br />
Banco Pastor SA 129 148 524 1,01 %<br />
Banco Popular Espanol SA 797 065 665 1,11 %<br />
Banco Santander SA 6 724 891 547 1,28 %<br />
<strong>Bank</strong>inter SA 226 226 701 0,91 %<br />
Baron de Ley 28 858 843 1,28 %<br />
Bolsas y Mercados Espanoles 190 981 408 1,28 %<br />
Camp<strong>of</strong>rio Alimentacion SA 25 572 708 0,65 %<br />
Cementos Portland Valderrivas SA 24 632 590 0,37 %<br />
Cia Espanola de Petroleos SA 168 081 488 0,10 %<br />
Cie Automotive SA 9 138 597 0,24 %<br />
Cintra Concesiones de Infraestructuras de Transporte SA 143 953 866 0,51 %<br />
Market value<br />
Voting<br />
(per cent)<br />
Construcciones y Auxiliar de Ferrocarriles SA 109 905 474 1,32 %<br />
Corp Dermoestetica 9 045 527 0,69 %<br />
Corp Financiera Alba 132 513 162 0,80 %<br />
Criteria Caixacorp SA 498 760 239 0,55 %<br />
Duro Felguera SA 12 120 130 0,33 %<br />
Ebro Puleva SA 147 475 606 1,00 %<br />
EDP Renovaveis SA 48 283 051 0,11 %<br />
Enagas 897 238 971 2,48 %<br />
Endesa SA 62 496 078 0,02 %<br />
Ercros SA 18 591 382 1,19 %<br />
FAES FARMA SA 47 781 431 1,02 %<br />
Fomento de Construcciones y Contratas SA 142 151 232 0,49 %<br />
Gamesa Corp Tecnologica SA 270 041 956 0,90 %<br />
Gas Natural SDG SA 950 621 803 1,13 %<br />
General de Alquiler de Maquinaria 10 993 641 0,67 %<br />
Gestevision Telecinco SA 73 088 630 0,40 %<br />
Grifols SA 467 610 471 1,83 %<br />
Grupo Catalana Occidente SA 110 545 328 0,65 %<br />
Grupo Empresarial Ence SA 32 036 092 0,75 %<br />
Grupo Ferrovial SA 159 582 299 0,60 %<br />
Iberdrola Renovables SA 424 420 872 0,34 %<br />
Iberdrola SA 4 008 091 240 1,26 %<br />
Iberia Lineas Aereas de Espana 180 111 109 0,98 %<br />
Inditex SA 916 900 024 0,48 %<br />
Indra Sistemas SA 313 500 016 1,21 %<br />
Inmobiliaria Colonial SA 9 264 303 0,34 %<br />
La Seda de Barcelona SA 26 615 611 1,28 %<br />
Laboratorios Almirall SA 183 168 733 2,06 %<br />
Mapfre SA 147 494 528 0,23 %<br />
Mecalux SA 16 250 174 0,38 %<br />
Miquel y Costas & Miquel SA 6 879 771 0,63 %<br />
Natraceutical SA 8 056 875 0,50 %<br />
NH Hoteles SA 60 169 613 1,13 %<br />
Obrascon Huarte Lain SA 91 882 346 1,08 %<br />
Papeles y Cartones de Europa SA 12 627 259 0,59 %<br />
Parquesol Inmobiliaria y Proyectos SA 8 101 721 0,35 %<br />
Pescanova SA 18 205 018 0,53 %<br />
Promotora de Informaciones SA 21 626 384 0,45 %<br />
Prosegur Cia de Seguridad SA 90 928 304 0,65 %<br />
Red Electrica Corp SA 116 298 758 0,25 %<br />
Renta Corp Real Estate SA 4 331 434 0,97 %<br />
Repsol YPF SA 2 245 493 851 1,25 %<br />
Sacyr Vallehermoso SA 94 171 231 0,50 %<br />
Sociedad General de Aguas de Barcelona SA 914 308 0,00 %<br />
Sol Melia SA 40 890 246 0,53 %<br />
Solaria Energia y Medio Ambiente SA 12 302 071 0,65 %<br />
SOS Cuetara SA 146 830 805 0,97 %<br />
Tecnicas Reunidas SA 73 558 367 0,73 %<br />
Telefonica SA 8 906 004 794 1,23 %<br />
Tubacex SA 40 338 600 1,33 %<br />
Tubos Reunidos SA 25 973 380 0,73 %<br />
Union Fenosa SA 1 201 776 886 0,76 %<br />
Uralita SA 21 282 705 0,26 %<br />
Vidrala SA 23 458 424 0,68 %<br />
Visc<strong>of</strong>an SA 92 016 560 1,44 %<br />
Vocento SA 28 402 195 0,69 %<br />
Zardoya Otis SA 186 241 775 0,48 %<br />
Zeltia SA 87 008 859 1,20 %<br />
SWEDEN<br />
Academedia AB 653 020 0,08 %<br />
Alfa Laval AB 240 494 111 0,94 %<br />
Assa Abloy AB 326 424 720 1,20 %<br />
Atlas Copco AB 522 216 156 0,49 %<br />
Avanza <strong>Bank</strong> <strong>Holding</strong> AB 13 849 726 0,80 %<br />
Axfood AB 57 270 915 0,74 %<br />
Axis Communications AB 28 219 117 0,80 %<br />
BE Group AB 9 539 709 1,10 %<br />
Betsson AB 60 720 821 2,96 %<br />
Bilia AB 1 561 718 0,54 %<br />
Billerud AB 10 681 822 1,11 %<br />
Black Earth Farming Ltd 2 614 813 0,13 %<br />
Boliden AB 50 264 266 1,17 %<br />
Brostrom AB 49 793 738 1,64 %<br />
Bure Equity AB 5 610 277 0,31 %<br />
Cardo AB 23 947 129 0,79 %<br />
Castellum AB 130 200 249 1,41 %<br />
Cision AB 318 306 0,21 %<br />
Clas Ohlson AB 15 897 983 0,53 %<br />
D Carnegie AB 17 902 993 1,46 %<br />
Electrolux AB 148 834 274 0,84 %<br />
Elekta AB 63 899 730 1,05 %<br />
Eniro AB 22 524 899 1,47 %<br />
Fabege AB 65 720 410 1,46 %<br />
Getinge AB 221 917 954 1,09 %<br />
Gunnebo AB 4 741 481 0,76 %<br />
Hakon Invest AB 40 845 071 0,66 %<br />
Haldex AB 5 438 948 1,05 %<br />
Hennes & Mauritz AB 1 100 641 272 0,56 %<br />
Hexagon AB 85 811 879 1,01 %<br />
Hexpol AB 2 689 346 0,70 %<br />
Hoganas AB 24 237 203 1,12 %<br />
25<br />
GOVERNMENT PENSION FUND <strong>–</strong> GLOBAL ANNUAL REPORT 2008
<strong>Government</strong> <strong>Pension</strong> <strong>Fund</strong> <strong>–</strong> <strong>Global</strong> <strong>Holding</strong> <strong>of</strong> equities at 31 December 2008<br />
Market value<br />
Voting<br />
(per cent)<br />
Holmen AB 122 759 095 1,15 %<br />
HQ AB 8 806 792 0,63 %<br />
Hufvudstaden AB 50 220 156 0,50 %<br />
Husqvarna AB 235 543 413 0,55 %<br />
Industrivarden AB 208 702 802 1,05 %<br />
Indutrade AB 14 263 742 0,61 %<br />
Intrum Justitia AB 46 532 538 0,85 %<br />
Investor AB 580 547 090 0,17 %<br />
JM AB 40 387 019 1,27 %<br />
KappAhl <strong>Holding</strong> AB 10 093 553 0,65 %<br />
Kinnevik Investment AB 165 464 763 1,38 %<br />
Klovern AB 29 148 083 1,09 %<br />
Kungsleden AB 94 186 836 1,44 %<br />
Lindab International AB 37 410 936 1,11 %<br />
Loomis AB 34 372 594 1,14 %<br />
Lundbergforetagen AB 35 145 367 0,34 %<br />
Lundin Petroleum AB 127 292 124 1,10 %<br />
Malka Oil AB 3 543 494 1,78 %<br />
Meda AB 146 246 630 1,04 %<br />
Mekonomen AB 9 490 491 0,50 %<br />
Micronic Laser Systems AB 1 589 067 0,79 %<br />
Modern Times Group AB 104 728 208 1,38 %<br />
Munters AB 24 307 841 0,95 %<br />
NCC AB 44 540 070 0,19 %<br />
New Wave Group AB 2 467 425 0,98 %<br />
Nibe Industrier AB 13 885 159 0,44 %<br />
Niscayah Group AB 22 996 085 1,12 %<br />
Nobia AB 14 895 758 0,57 %<br />
Nordea <strong>Bank</strong> AB 1 540 167 116 1,22 %<br />
Nordnet AB 4 109 490 0,33 %<br />
Oresund Investment AB 20 554 346 0,59 %<br />
Peab AB 32 273 091 0,66 %<br />
Q-Med AB 11 749 100 0,55 %<br />
Ratos AB 186 976 537 1,35 %<br />
Rezidor Hotel Group AB 22 327 998 0,89 %<br />
rnb Retail and Brands AB 1 786 349 0,60 %<br />
Sandvik AB 423 474 525 0,82 %<br />
SAS AB 34 818 237 0,63 %<br />
Scania AB 356 243 566 0,19 %<br />
Sectra AB 2 478 797 0,23 %<br />
Securitas AB 248 292 138 1,25 %<br />
Skandinaviska Enskilda <strong>Bank</strong>en AB 501 971 896 1,41 %<br />
Skanska AB 360 466 903 1,33 %<br />
SKF AB (2 011 265) 0,00 %<br />
SkiStar AB 8 771 544 0,41 %<br />
Ssab Svenskt Stal AB 188 525 112 1,09 %<br />
Svenska Cellulosa AB 404 040 970 1,15 %<br />
Svenska Handelsbanken AB 800 095 213 1,17 %<br />
Swedbank AB 186 293 180 0,92 %<br />
Swedish Match AB 523 059 285 2,07 %<br />
Saab AB 34 096 846 0,52 %<br />
Tele2 AB 271 281 039 1,09 %<br />
Teleca AB 1 141 019 0,51 %<br />
Telefonaktiebolaget LM Ericsson 1 844 574 740 0,62 %<br />
TeliaSonera AB 757 855 041 0,49 %<br />
TradeDoubler AB 9 858 283 1,05 %<br />
Trelleborg AB 55 488 616 1,61 %<br />
Volvo AB 943 713 315 1,19 %<br />
Vostok Gas Ltd 1 452 871 0,06 %<br />
Vostok Nafta Investment Ltd 7 414 481 0,68 %<br />
Wallenstam Byggnads AB 14 738 172 0,44 %<br />
Wihlborgs Fastigheter AB 52 305 610 1,59 %<br />
AarhusKarlshamn AB 36 631 658 0,94 %<br />
SWITZERLAND<br />
ABB Ltd 3 183 409 328 1,32 %<br />
Absolute Private Equity AG 19 529 187 0,00 %<br />
ACE Ltd 30 114 089 0,03 %<br />
Actelion Ltd 354 878 157 0,73 %<br />
Adecco SA 389 716 016 0,87 %<br />
AFG Arbonia-Forster Hldg 8 517 168 0,71 %<br />
Allreal <strong>Holding</strong> AG 62 187 727 0,78 %<br />
Arpida Ltd 1 441 559 1,44 %<br />
Aryzta AG 238 903 887 1,35 %<br />
Ascom <strong>Holding</strong> AG 17 413 376 0,90 %<br />
Bachem <strong>Holding</strong> AG 15 145 213 0,42 %<br />
Baloise <strong>Holding</strong> AG 534 422 863 2,07 %<br />
<strong>Bank</strong> Sarasin & Cie AG 82 321 210 0,79 %<br />
Banque Cantonale Vaudoise 97 696 936 0,54 %<br />
Barry Callebaut AG 136 508 708 0,58 %<br />
Basilea Pharmaceutica 188 816 389 2,02 %<br />
Basler Kantonalbank 26 018 662 0,58 %<br />
BB Biotech AG 108 475 650 0,94 %<br />
BB Medtech AG 33 387 584 0,00 %<br />
Belimo <strong>Holding</strong> AG 22 484 547 0,74 %<br />
Bell <strong>Holding</strong> AG 4 584 078 0,13 %<br />
Bellevue Group AG/Switzerland 9 593 222 0,37 %<br />
BKW FMB Energie AG 137 420 892 0,39 %<br />
Bucher Industries AG 101 670 906 1,39 %<br />
Burckhardt Compression <strong>Holding</strong> AG 40 653 626 1,21 %<br />
Charles Voegele <strong>Holding</strong> AG 18 248 978 1,15 %<br />
Ciba <strong>Holding</strong> AG 385 704 478 0,02 %<br />
Market value<br />
Voting<br />
(per cent)<br />
Clariant AG 210 165 960 1,95 %<br />
Coltene <strong>Holding</strong> AG 14 346 026 1,20 %<br />
Compagnie Financiere Richemont SA 790 858 155 1,14 %<br />
Conzzeta AG 8 682 512 0,21 %<br />
Credit Suisse Group AG 2 727 368 824 1,28 %<br />
Credit Suisse Real Estate <strong>Fund</strong> Siat 110 145 157 1,06 %<br />
Cytos Biotechnology AG 6 596 849 0,76 %<br />
Daetwyler <strong>Holding</strong> AG 8 264 810 0,23 %<br />
Dufry Group 14 823 114 0,41 %<br />
Edipresse SA 19 722 850 1,65 %<br />
EFG International AG 402 328 330 2,23 %<br />
Emmi AG 10 123 108 0,29 %<br />
EMS-Chemie <strong>Holding</strong> AG 119 358 010 0,88 %<br />
Energiedienst <strong>Holding</strong> AG 1 752 212 0,02 %<br />
Financiere Tradition 8 129 962 0,32 %<br />
Flughafen Zuerich AG 57 358 718 0,57 %<br />
Forbo <strong>Holding</strong> AG 43 998 168 1,26 %<br />
Galenica AG 149 402 014 1,02 %<br />
Geberit AG 380 508 730 1,19 %<br />
Georg Fischer AG 99 173 684 1,53 %<br />
Givaudan SA 594 402 246 1,50 %<br />
Gurit <strong>Holding</strong> AG 17 351 143 1,40 %<br />
Helvetia <strong>Holding</strong> AG 123 993 951 0,95 %<br />
Holcim Ltd 986 381 468 0,94 %<br />
Huber & Suhner AG 40 954 407 0,83 %<br />
Imm<strong>of</strong>onds 46 551 054 1,03 %<br />
Implenia AG 23 330 016 0,66 %<br />
Jelmoli <strong>Holding</strong> AG 65 798 688 1,02 %<br />
Julius Baer <strong>Holding</strong> AG 1 328 887 538 2,39 %<br />
Kaba <strong>Holding</strong> AG 71 702 524 1,10 %<br />
Kudelski SA 53 360 265 1,52 %<br />
Kuehne + Nagel International AG 443 358 705 0,83 %<br />
Kuoni Reisen <strong>Holding</strong> AG 76 834 092 1,14 %<br />
Liechtenstein Landesbank 45 435 728 0,44 %<br />
Lindt & Spruengli AG 394 465 953 1,23 %<br />
Logitech International SA 258 266 432 1,25 %<br />
Lonza Group AG 436 492 171 1,35 %<br />
Luzerner Kantonalbank AG 1 303 594 0,01 %<br />
Meyer Burger Technology AG 43 632 872 1,83 %<br />
Micronas Semiconductor <strong>Holding</strong> AG 6 968 150 1,15 %<br />
Mobimo <strong>Holding</strong> AG 19 916 480 0,49 %<br />
Nestle SA 14 901 136 528 1,42 %<br />
Nobel Biocare <strong>Holding</strong> AG 203 457 760 1,16 %<br />
Novartis AG 10 350 119 052 1,13 %<br />
OC Oerlikon Corp AG 62 804 979 0,98 %<br />
Panalpina Welttransport <strong>Holding</strong> AG 105 453 626 1,09 %<br />
Pargesa <strong>Holding</strong> SA 221 323 924 0,62 %<br />
Partners Group <strong>Holding</strong> AG 83 957 603 0,64 %<br />
Petroplus <strong>Holding</strong>s AG 116 110 765 1,22 %<br />
Phoenix Mecano AG 12 402 266 0,56 %<br />
PSP Swiss Property AG 221 668 161 1,36 %<br />
PubliGroupe AG 6 358 671 0,61 %<br />
Rieter <strong>Holding</strong> AG 71 630 052 1,49 %<br />
Roche <strong>Holding</strong> AG 9 997 165 935 0,28 %<br />
Schindler <strong>Holding</strong> AG 245 210 136 0,72 %<br />
Schmolz + Bickenbach AG 21 744 423 0,69 %<br />
Schroder ImmoPLUS 3 427 740 0,00 %<br />
Schulthess Group 35 937 973 1,22 %<br />
Schweizerische National-Versicherungs-Gesellschaft 17 938 297 0,43 %<br />
SGS SA 493 371 907 0,87 %<br />
Siegfried <strong>Holding</strong> AG 4 498 982 0,27 %<br />
Sika AG 121 709 636 0,96 %<br />
Solvalor 61 39 949 587 0,00 %<br />
Sonova <strong>Holding</strong> AG 241 747 113 0,87 %<br />
St Galler Kantonalbank 54 440 530 0,39 %<br />
Straumann <strong>Holding</strong> AG 112 912 535 0,59 %<br />
Sulzer AG 193 934 914 1,35 %<br />
Swatch Group AG/The 648 616 026 1,05 %<br />
Swiss Life <strong>Holding</strong> AG 212 383 064 1,27 %<br />
Swiss Prime Site AG 95 509 926 1,11 %<br />
Swiss Reinsurance 1 616 980 068 1,38 %<br />
Swisscom AG 645 527 168 0,54 %<br />
Syngenta AG 1 652 759 082 1,29 %<br />
Synthes Inc 569 569 045 0,55 %<br />
Tecan Group AG 45 006 237 1,45 %<br />
Temenos Group AG 62 620 280 1,15 %<br />
UBS AG 3 858 895 772 1,35 %<br />
Valartis Group AG 1 895 272 0,40 %<br />
Valora <strong>Holding</strong> AG 40 356 964 1,21 %<br />
Verwalt & Privat-<strong>Bank</strong> AG 40 756 860 0,83 %<br />
Von Roll <strong>Holding</strong> AG 46 097 151 0,50 %<br />
Vontobel <strong>Holding</strong> AG 58 910 098 0,63 %<br />
Ypsomed <strong>Holding</strong> AG 13 429 085 0,23 %<br />
Zehnder Group AG 12 409 930 0,90 %<br />
Zueblin Immobilien <strong>Holding</strong> AG 9 359 519 0,63 %<br />
Zurich Financial Services AG 4 028 897 449 1,90 %<br />
TAIWAN<br />
Ability Enterprise Co Ltd 8 254 632 0,44 %<br />
AcBel Polytech Inc 3 907 833 0,30 %<br />
Accton Technology Corp 4 785 327 0,47 %<br />
Acer Inc 32 456 953 0,14 %<br />
26<br />
GOVERNMENT PENSION FUND <strong>–</strong> GLOBAL ANNUAL REPORT 2008
<strong>Government</strong> <strong>Pension</strong> <strong>Fund</strong> <strong>–</strong> <strong>Global</strong> <strong>Holding</strong> <strong>of</strong> equities at 31 December 2008<br />
Market value<br />
Voting<br />
(per cent)<br />
Action Electronics Co Ltd 2 373 149 0,52 %<br />
A-DATA Technology Co Ltd 162 345 0,03 %<br />
Advanced International Multitech Co Ltd 6 149 934 0,76 %<br />
Advanced Semiconductor Engineering Inc 28 172 824 0,20 %<br />
Advantech Co Ltd 8 205 935 0,16 %<br />
AGV Products Corp 43 901 0,01 %<br />
ALI Corp 4 838 870 0,37 %<br />
Altek Corp 14 107 697 0,70 %<br />
Ambassador Hotel/The 5 871 721 0,22 %<br />
AmTRAN Technology Co Ltd 650 373 0,05 %<br />
Ardentec Corp 6 767 863 0,61 %<br />
Arima Communications Corp 1 148 289 0,29 %<br />
Arima Photovoltaic & Optical Corp 1 639 501 0,49 %<br />
Asia Cement Corp 20 342 206 0,12 %<br />
Asia Optical Co Inc 1 587 220 0,07 %<br />
Asia Polymer 2 841 976 0,34 %<br />
Asia Vital Components Co Ltd 1 614 789 0,22 %<br />
Asustek Computer Inc 154 181 339 0,46 %<br />
Aten International Co Ltd 3 724 874 0,37 %<br />
AU Optronics Corp 98 575 952 0,22 %<br />
Audix Corp 1 245 655 0,35 %<br />
AV TECH Corp 7 725 727 0,44 %<br />
Avermedia Technologies 4 632 332 0,42 %<br />
Avision Inc 1 314 445 0,37 %<br />
<strong>Bank</strong> <strong>of</strong> Kaohsiung 2 160 088 0,28 %<br />
Basso Industry Corp 348 206 0,05 %<br />
BES Engineering Corp 12 919 117 0,62 %<br />
Bright Led Electronics Corp 237 409 0,03 %<br />
Capital Securities Corp 6 556 850 0,24 %<br />
Career Technology Co Ltd 2 327 188 0,42 %<br />
Catcher Technology Co Ltd 8 186 209 0,12 %<br />
Cathay Financial <strong>Holding</strong> Co Ltd 81 397 666 0,11 %<br />
Cathay Real Estate Development Co Ltd 3 315 460 0,13 %<br />
Central Reinsurance Co Ltd 3 082 057 0,34 %<br />
Chang Hwa Commercial <strong>Bank</strong> 38 364 571 0,29 %<br />
Cheng Loong Corp 8 647 118 0,56 %<br />
Cheng Shin Rubber Industry Co Ltd 16 054 852 0,18 %<br />
Cheng Uei Precision Industry Co Ltd 3 426 248 0,10 %<br />
Chi Mei Optoelectronics Corp 34 593 611 0,21 %<br />
Chia Hsin Cement Corp 3 938 875 0,20 %<br />
Chicony Electronics Co Ltd 14 902 367 0,40 %<br />
China Airlines 13 531 970 0,18 %<br />
China Bills Finance Corp 3 958 322 0,23 %<br />
China Development Financial <strong>Holding</strong> Corp 57 735 183 0,33 %<br />
China General Plastics Corp 2 008 266 0,30 %<br />
China Life Insurance Co Ltd/Taiwan 19 990 719 0,67 %<br />
China Manmade Fibers Corp 7 502 945 0,57 %<br />
China Metal Products 3 512 251 0,34 %<br />
China Motor Corp 2 709 404 0,10 %<br />
China Petrochemical Development Corp 14 121 767 0,59 %<br />
China Steel Chemical Corp 15 026 553 0,59 %<br />
China Steel Corp 17 549 940 0,03 %<br />
China Synthetic Rubber Corp 19 951 120 0,66 %<br />
Chinatrust Financial <strong>Holding</strong> Co Ltd 59 757 462 0,22 %<br />
Chin-Poon Industrial Co 4 682 796 0,55 %<br />
Chipbond Technology Corp 237 758 0,04 %<br />
Chong Hong Construction Co 2 825 989 0,27 %<br />
Chroma ATE Inc 4 805 420 0,33 %<br />
Chun Yuan Steel 3 555 345 0,31 %<br />
Chung Hsin Electric & Machinery Manufacturing Corp 10 197 296 0,65 %<br />
Chung Hung Steel Corp 10 124 092 0,36 %<br />
Chung Hwa Pulp Corp 5 014 475 0,43 %<br />
Chunghwa Picture Tubes 10 127 146 0,15 %<br />
Chunghwa Telecom Co Ltd 241 021 086 0,18 %<br />
Clevo Co 23 939 568 0,71 %<br />
CMC Magnetics Corp 3 171 339 0,10 %<br />
C-Media Electronics Inc 2 410 994 0,45 %<br />
Compal Communications Inc 1 729 002 0,07 %<br />
Compal Electronics Inc 30 275 238 0,21 %<br />
Compeq Manufacturing Co 2 589 162 0,23 %<br />
Concord Securities Corp 3 942 731 0,40 %<br />
Continental Engineering Corp 6 070 222 0,38 %<br />
Coretronic Corp 5 196 501 0,20 %<br />
Cosmos <strong>Bank</strong> Taiwan 66 075 0,01 %<br />
Creative Sensor Inc 963 574 0,43 %<br />
CTCI Corp 17 211 934 0,56 %<br />
Cyberlink Corp 12 051 311 0,43 %<br />
CyberTAN Technology Inc 961 629 0,06 %<br />
Delta Electronics Inc 59 111 442 0,20 %<br />
Depo Auto Parts Ind Co Ltd 5 370 567 0,38 %<br />
D-Link Corp 2 163 452 0,08 %<br />
E.Sun Financial <strong>Holding</strong> Co Ltd 15 143 927 0,23 %<br />
Eastern Media International Corp 2 817 292 0,23 %<br />
Elan Microelectronics Corp 1 086 875 0,06 %<br />
Elite Semiconductor Memory Technology Inc 6 747 951 0,65 %<br />
Elitegroup Computer Systems Co Ltd 703 219 0,04 %<br />
Emerging Display Technologies Corp 731 581 0,47 %<br />
Epistar Corp 3 966 919 0,10 %<br />
Eternal Chemical Co Ltd 4 573 287 0,15 %<br />
E-Ton Solar Tech Co Ltd 665 877 0,03 %<br />
Etron Technology Inc 4 891 641 0,71 %<br />
Market value<br />
Voting<br />
(per cent)<br />
Eva Airways Corp 1 133 592 0,02 %<br />
Evergreen International Storage & Transport Corp 9 493 736 0,23 %<br />
Evergreen Marine Corp Taiwan Ltd 2 524 849 0,03 %<br />
Everlight Chemical Industrial Corp 2 624 074 0,33 %<br />
Everlight Electronics Co Ltd 731 451 0,02 %<br />
Everskill Technology Co Ltd 514 326 0,35 %<br />
Far Eastern Department Stores Co Ltd 5 969 995 0,13 %<br />
Far Eastern International <strong>Bank</strong> 4 331 993 0,19 %<br />
Far Eastern Textile Co Ltd 27 527 195 0,13 %<br />
Far EasTone Telecommunications Co Ltd 128 227 172 0,49 %<br />
Faraday Technology Corp 744 414 0,04 %<br />
Farglory Land Development Co Ltd 792 051 0,02 %<br />
Federal Corp 3 615 931 0,48 %<br />
Feng Hsin Iron & Steel Co 16 145 905 0,41 %<br />
Feng TAY Enterprise Co Ltd 10 629 460 0,66 %<br />
Firich Enterprises Co Ltd 3 414 594 0,18 %<br />
First Financial <strong>Holding</strong> Co Ltd 95 922 864 0,42 %<br />
First Steamship Co Ltd 2 976 906 0,19 %<br />
Forhouse Corp 850 303 0,20 %<br />
Formosa Chemicals & Fibre Corp 76 830 776 0,16 %<br />
Formosa International Hotels Corp 306 046 0,01 %<br />
Formosa Petrochemical Corp 73 734 343 0,06 %<br />
Formosa Plastics Corp 55 823 796 0,10 %<br />
Formosa Taffeta Co Ltd 6 658 455 0,11 %<br />
Formosan Rubber Group Inc 8 985 701 0,68 %<br />
Foxconn Technology Co Ltd 23 624 927 0,17 %<br />
FSP Technology Inc 1 563 205 0,22 %<br />
Fubon Financial <strong>Holding</strong> Co Ltd 69 483 475 0,18 %<br />
Gemtek Technology Corp 8 947 608 0,36 %<br />
Genius Electronic Optical Co Ltd 146 665 0,04 %<br />
GeoVision Inc 7 788 551 0,65 %<br />
Giant Manufacturing Co Ltd 4 934 509 0,11 %<br />
Giantplus Technology Co Ltd 2 170 469 0,24 %<br />
Gigabyte Technology Co Ltd 2 808 776 0,17 %<br />
<strong>Global</strong> Brands Manufacture Ltd 1 642 575 0,22 %<br />
<strong>Global</strong> Mixed Mode Technology Inc 5 805 055 0,38 %<br />
<strong>Global</strong> Unichip Corp 3 384 060 0,11 %<br />
Globe Union Industrial Corp 2 510 962 0,32 %<br />
Gloria Material Technology Corp 89 036 0,01 %<br />
Gold Circuit Electronics Ltd 401 381 0,05 %<br />
Goldsun Development & Construction Co Ltd 6 985 188 0,28 %<br />
Grand Pacifi c Petrochemical 2 040 462 0,29 %<br />
Great Taipei Gas Co Ltd 3 177 381 0,24 %<br />
Great Wall Enterprise Co 5 359 296 0,22 %<br />
Greatek Electronics Inc 11 559 589 0,55 %<br />
HannStar Display Corp 11 048 913 0,22 %<br />
Harvatek Corp 1 103 680 0,18 %<br />
Highwealth Construction Corp 5 355 789 0,31 %<br />
Ho Tung Chemical Corp 3 604 701 0,36 %<br />
Holtek Semiconductor Inc 3 649 719 0,36 %<br />
Holystone Enterprise Co Ltd 5 911 390 0,54 %<br />
HON HAI Precision Industry Co Ltd 344 718 020 0,34 %<br />
Hsin Kuang Steel Co Ltd 90 150 0,01 %<br />
Hsing TA Cement Co 1 312 532 0,18 %<br />
HTC Corp 44 579 470 0,08 %<br />
HUA ENG Wire & Cable 3 302 517 0,48 %<br />
Hua Nan Financial <strong>Holding</strong>s Co Ltd 60 049 163 0,25 %<br />
Huaku Development Co Ltd 2 523 913 0,15 %<br />
Huang Hsiang Construction Co 285 292 0,04 %<br />
Hung Poo Real Estate Development Corp 3 526 145 0,24 %<br />
Hung Sheng Construction Co Ltd 5 397 194 0,56 %<br />
Ichia Technologies Inc 1 644 106 0,33 %<br />
ICP Electronics Inc 3 772 704 0,36 %<br />
Infortrend Technology Inc 9 164 469 0,64 %<br />
InnoLux Display Corp 24 043 145 0,15 %<br />
Inotera Memories Inc 2 608 776 0,05 %<br />
International Games System Co Ltd 8 259 672 0,47 %<br />
International Semiconductor Technology Ltd 1 244 379 0,36 %<br />
Inventec Appliances Corp 3 071 533 0,13 %<br />
Inventec Co Ltd 13 922 606 0,28 %<br />
Jenn Feng Industrial Co Ltd 1 164 058 0,17 %<br />
Jih Sun Financial <strong>Holding</strong>s Co Ltd 4 013 715 0,29 %<br />
Johnson Health Tech Co Ltd 192 373 0,02 %<br />
Kaulin Manufacturing Co Ltd 724 646 0,16 %<br />
Kenda Rubber Industrial Co Ltd 8 118 310 0,51 %<br />
KGI Securities Co Ltd 18 801 257 0,33 %<br />
Kindom Construction Co 2 740 190 0,36 %<br />
King Slide Works Co Ltd 2 502 122 0,17 %<br />
King Yuan Electronics Co Ltd 11 169 107 0,57 %<br />
Kings Town <strong>Bank</strong> 8 598 079 0,64 %<br />
Kings Town Construction Co Ltd 6 231 935 0,68 %<br />
Kinik Co 1 597 346 0,27 %<br />
Kinko Optical Co Ltd 798 979 0,32 %<br />
Kinpo Electronics 7 973 377 0,42 %<br />
Kinsus Interconnect Technology Corp 2 073 786 0,07 %<br />
Kuoyang Construction Co Ltd 5 429 519 0,66 %<br />
KYE Systems Corp 4 245 381 0,46 %<br />
L&K Engineering Co Ltd 5 059 983 0,71 %<br />
Largan Precision Co Ltd 7 883 255 0,14 %<br />
Lealea Enterprise Co Ltd 3 147 169 0,48 %<br />
LEE Chang Yung Chem IND Corp 18 026 392 0,58 %<br />
27<br />
GOVERNMENT PENSION FUND <strong>–</strong> GLOBAL ANNUAL REPORT 2008
<strong>Government</strong> <strong>Pension</strong> <strong>Fund</strong> <strong>–</strong> <strong>Global</strong> <strong>Holding</strong> <strong>of</strong> equities at 31 December 2008<br />
Market value<br />
Voting<br />
(per cent)<br />
Li Peng Enterprise Co Ltd 2 108 725 0,48 %<br />
Lien Hwa Industrial Corp 11 383 456 0,58 %<br />
LITE-ON IT Corp 1 554 497 0,06 %<br />
Lite-On Semiconductor Corp 3 105 967 0,34 %<br />
Lite-On Technology Corp 27 158 448 0,27 %<br />
Long Bon Development Co Ltd 3 444 979 0,51 %<br />
Long Chen Paper Co Ltd 3 274 042 0,46 %<br />
Macronix International 24 509 313 0,43 %<br />
Makalot Industrial Co Ltd 362 303 0,05 %<br />
Marketech International Corp 866 419 0,33 %<br />
Masterlink Securities Corp 12 391 763 0,51 %<br />
MediaTek Inc 20 924 938 0,04 %<br />
Mega Financial <strong>Holding</strong> Co Ltd 63 425 639 0,23 %<br />
Meiloon Industrial Co 1 457 808 0,36 %<br />
Mercuries & Associates Ltd 4 346 753 0,36 %<br />
Merry Electronics Co Ltd 1 537 740 0,20 %<br />
Microelectronics Technology 2 384 358 0,22 %<br />
Microlife Corp 1 861 728 0,22 %<br />
Micro-Star International Co Ltd 1 981 540 0,06 %<br />
MIN AIK Technology Co Ltd 3 113 964 0,48 %<br />
Mitac International 4 512 928 0,12 %<br />
Mitac Technology Corp 2 639 069 0,16 %<br />
Mosel Vitelic Inc 6 614 325 0,40 %<br />
Motech Industries Inc 950 424 0,02 %<br />
Nan Kang Rubber Tire Co Ltd 11 029 654 0,55 %<br />
Nan Ya Plastics Corp 71 021 319 0,12 %<br />
Nan Ya Printed Circuit Board Corp 12 076 797 0,13 %<br />
Nanya Technology Corp 5 434 048 0,09 %<br />
Nien Hsing Textile Co Ltd 3 691 292 0,36 %<br />
Novatek Microelectronics Corp Ltd 6 406 380 0,16 %<br />
Optimax Technology Corp 432 985 0,48 %<br />
Opto Technology Corp 5 747 956 0,47 %<br />
Orient Semiconductor Electronics Ltd 1 008 143 0,27 %<br />
Oriental Union Chemical Corp 3 388 848 0,14 %<br />
O-TA Precision Industry Co Ltd 2 924 701 0,36 %<br />
Pacifi c Electric Wire & Cable Co Ltd 134 651 0,04 %<br />
Pan-International Industrial 10 066 667 0,44 %<br />
Phihong Technology Co Ltd 3 018 095 0,48 %<br />
Phison Electronics Corp 771 908 0,04 %<br />
Phoenix Precision Technology Corp 1 774 000 0,14 %<br />
Pihsiang Machinery Manufacturing Co Ltd 3 748 144 0,23 %<br />
Pixart Imaging Inc 5 174 619 0,17 %<br />
Polaris Securities Co Ltd 16 797 330 0,32 %<br />
POU Chen Corp 26 544 081 0,30 %<br />
Powerchip Semiconductor Corp 6 387 094 0,10 %<br />
Powertech Technology Inc 33 134 034 0,45 %<br />
President Chain Store Corp 15 780 099 0,10 %<br />
President Securities Corp 6 298 421 0,22 %<br />
Prime View International Co Ltd 638 030 0,03 %<br />
Prince Housing Development Corp 2 913 823 0,30 %<br />
Princeton Technology Corp 610 220 0,25 %<br />
Prodisc Technology Inc 1 915 718 0,47 %<br />
ProMOS Technologies Inc 1 619 271 0,04 %<br />
Qisda Corp 2 010 567 0,08 %<br />
Quanta Computer Inc 12 519 261 0,05 %<br />
Quanta Storage Inc 4 835 412 0,33 %<br />
Radiant Opto-Electronics Corp 9 845 291 0,56 %<br />
Radium Life Tech Co Ltd 3 723 251 0,35 %<br />
Realtek Semiconductor Corp 8 004 164 0,25 %<br />
Rechi Precision Co Ltd 1 392 252 0,34 %<br />
Richtek Technology Corp 6 832 886 0,18 %<br />
Ritek Corp 4 840 105 0,21 %<br />
Ruentex Development Co Ltd 7 974 431 0,28 %<br />
Ruentex Industries Ltd 1 140 151 0,04 %<br />
Sampo Corp 3 653 476 0,48 %<br />
San Shing Fastech Corp 2 554 770 0,33 %<br />
Sanyang Industry Co Ltd 7 072 732 0,64 %<br />
Sanyo Electric Taiwan Co Ltd 2 861 435 0,24 %<br />
Senao International Co Ltd 7 900 117 0,48 %<br />
Sheng Yu Steel Co Ltd 2 371 770 0,18 %<br />
Shih Wei Navigation Co Ltd 4 805 241 0,19 %<br />
Shihlin Electric & Engineering Corp 15 184 516 0,43 %<br />
Shihlin Paper Corp 4 715 120 0,44 %<br />
Shin Kong Financial <strong>Holding</strong> Co Ltd 6 590 411 0,06 %<br />
Shin Zu Shing Co Ltd 2 189 633 0,10 %<br />
Shining Building Business Co Ltd 1 453 076 0,15 %<br />
Shinkong Synthetic Fibers Corp 6 451 094 0,46 %<br />
Shinkong Textile Co Ltd 4 010 728 0,46 %<br />
Sigurd Microelectronics Corp 1 678 592 0,36 %<br />
Silicon Integrated Systems Corp 3 608 180 0,25 %<br />
Siliconware Precision Industries Co 50 418 828 0,27 %<br />
Silitech Technology Corp 1 928 872 0,13 %<br />
Simplo Technology Co Ltd 4 691 107 0,13 %<br />
Sinbon Electronics Co Ltd 1 461 305 0,49 %<br />
Sincere Navigation 10 626 526 0,29 %<br />
Sino-American Silicon Products Inc 13 439 553 0,42 %<br />
SinoPac Financial <strong>Holding</strong>s Co Ltd 26 479 894 0,24 %<br />
Sintek Photronic Corp 2 584 310 0,47 %<br />
Sinyi Realty Co 3 433 488 0,22 %<br />
Sitronix Technology Corp 2 568 609 0,36 %<br />
S<strong>of</strong>t-World International Corp 8 592 475 0,37 %<br />
Market value<br />
Voting<br />
(per cent)<br />
Solar Applied Materials Technology Co 13 858 071 0,64 %<br />
Sonix Technology Co Ltd 6 999 659 0,57 %<br />
Southeast Cement Co Ltd 4 098 590 0,36 %<br />
Spirox Corp 561 563 0,20 %<br />
Springs<strong>of</strong>t Inc 4 624 506 0,64 %<br />
Stark Technology Inc 1 352 851 0,47 %<br />
Sunplus Technology Co Ltd 604 478 0,04 %<br />
Sunrex Technology Corp 1 188 144 0,10 %<br />
Synnex Technology International Corp 6 361 507 0,07 %<br />
Systex Corp 3 952 085 0,36 %<br />
T JOIN Transportation Co 8 676 220 0,58 %<br />
TA Chen Stainless Pipe 5 208 147 0,43 %<br />
Ta Chong <strong>Bank</strong> Co Ltd 12 697 949 0,49 %<br />
Ta Ya Electric Wire & Cable 3 267 829 0,46 %<br />
Taichung Commercial <strong>Bank</strong> 10 527 825 0,53 %<br />
Tainan Enterprises Co Ltd 1 390 105 0,27 %<br />
Tainan Spinning Co Ltd 8 627 595 0,42 %<br />
Taishin Financial <strong>Holding</strong> Co Ltd 19 195 343 0,27 %<br />
Taiwan Acceptance Corp 1 398 094 0,17 %<br />
Taiwan Business <strong>Bank</strong> 8 225 860 0,14 %<br />
Taiwan Cement Corp 31 139 728 0,17 %<br />
Taiwan Cogeneration Corp 2 091 834 0,16 %<br />
Taiwan Cooperative <strong>Bank</strong> 45 371 770 0,23 %<br />
Taiwan Fertilizer Co Ltd 26 718 800 0,24 %<br />
Taiwan Fire & Marine Insurance Co 5 342 627 0,57 %<br />
Taiwan FU Hsing Industrial Co Ltd 2 222 929 0,48 %<br />
Taiwan Glass Industrial Corp 23 092 978 0,30 %<br />
Taiwan Hon Chuan Enterprise Co Ltd 8 462 152 0,70 %<br />
Taiwan Life Insurance Co Ltd 3 901 476 0,15 %<br />
Taiwan Mask Corp 2 899 242 0,45 %<br />
Taiwan Mobile Co Ltd 48 394 808 0,12 %<br />
Taiwan Navigation Co Ltd 4 623 108 0,13 %<br />
Taiwan Paiho Ltd 2 990 552 0,51 %<br />
Taiwan Secom Co Ltd 12 758 096 0,28 %<br />
Taiwan Semiconductor Co Ltd 4 545 690 0,61 %<br />
Taiwan Semiconductor Manufacturing Co Ltd 1 424 432 501 0,51 %<br />
Taiwan Sogo Shin Kong SEC 104 0,00 %<br />
Taiwan Styrene Monomer 460 231 0,05 %<br />
Taiwan TEA Corp 11 674 334 0,58 %<br />
Taiyen Biotech Co Ltd 2 733 247 0,34 %<br />
Tatung Co Ltd 13 251 606 0,22 %<br />
Teco Electric and Machinery Co Ltd 12 096 161 0,30 %<br />
Tecom Co Ltd 2 172 469 0,29 %<br />
Test-Rite International Co 10 465 216 0,69 %<br />
Ton Yi Industrial Corp 8 073 044 0,26 %<br />
Tong Yang Industry Co Ltd 3 099 901 0,28 %<br />
Topco Scientifi c Co Ltd 3 061 630 0,47 %<br />
Transcend Information Inc 5 836 522 0,11 %<br />
Tripod Technology Corp 18 438 029 0,58 %<br />
Tsann Kuen Enterprise Co Ltd 3 075 479 0,36 %<br />
TSRC Corp 24 019 712 0,71 %<br />
Tung Ho Steel Enterprise Corp 9 928 567 0,23 %<br />
TXC Corp 2 514 936 0,21 %<br />
TYC Brother Industrial Co Ltd 978 677 0,16 %<br />
U-Ming Marine Transport Corp 1 822 311 0,03 %<br />
Unimicron Technology Corp 7 117 782 0,22 %<br />
Uni-President Enterprises Corp 44 755 226 0,19 %<br />
Unitech Printed Circuit Board Corp 2 452 229 0,33 %<br />
United Integrated Services Co Ltd 2 795 250 0,47 %<br />
United Microelectronics Corp 25 521 077 0,12 %<br />
Universal Scientifi c Industrial Co Ltd 6 837 621 0,38 %<br />
UPC Technology Corp 6 910 622 0,39 %<br />
USI Corp 6 839 100 0,42 %<br />
Vanguard International Semiconductor Corp 2 174 055 0,08 %<br />
Via Technologies Inc 843 089 0,04 %<br />
Wafer Works Corp 11 678 832 0,53 %<br />
Waffer Technology Co Ltd 1 005 980 0,33 %<br />
Wah Hong Industrial Corp 856 019 0,39 %<br />
Wah Lee Industrial Corp 6 386 039 0,63 %<br />
Walsin Lihwa Corp 13 273 984 0,30 %<br />
Walsin Technology Corp 5 205 022 0,57 %<br />
Wan Hai Lines Ltd 3 449 600 0,05 %<br />
Waterland Financial <strong>Holding</strong>s 7 864 930 0,33 %<br />
Wei Chuan Food Corp 16 377 207 0,69 %<br />
Wellypower Optronics Corp 1 463 747 0,27 %<br />
Weltrend Semiconductor 3 849 191 0,58 %<br />
Winbond Electronics Corp 3 522 518 0,14 %<br />
Wintek Corp 1 983 898 0,13 %<br />
Wistron Corp 18 503 656 0,23 %<br />
Wistron NeWeb Corp 2 589 219 0,23 %<br />
WPG <strong>Holding</strong>s Co Ltd 15 952 511 0,62 %<br />
WUS Printed Circuit Co Ltd 1 813 597 0,49 %<br />
XAC Automation Corp 1 227 739 0,48 %<br />
Ya Hsin Industrial Co Ltd 473 681 0,04 %<br />
Yageo Corp 4 922 612 0,25 %<br />
Yang Ming Marine Transport Corp 3 285 401 0,06 %<br />
Yeun Chyang Industrial Co Ltd 6 097 785 0,69 %<br />
Yieh Phui Enterprise 5 859 294 0,21 %<br />
Yosun Industrial Corp 3 176 764 0,36 %<br />
Yuanta Financial <strong>Holding</strong> Co Ltd 27 046 813 0,10 %<br />
Yuen Foong Yu Paper Manufacturing Co Ltd 3 844 921 0,16 %<br />
28<br />
GOVERNMENT PENSION FUND <strong>–</strong> GLOBAL ANNUAL REPORT 2008
<strong>Government</strong> <strong>Pension</strong> <strong>Fund</strong> <strong>–</strong> <strong>Global</strong> <strong>Holding</strong> <strong>of</strong> equities at 31 December 2008<br />
Market value<br />
Voting<br />
(per cent)<br />
Yulon Motor Co Ltd 4 670 352 0,10 %<br />
Yung Chi Paint & Varnish Manufacturing Co Ltd 3 263 998 0,33 %<br />
Yung Shin Pharmaceutical Industrial Co Ltd 6 294 422 0,41 %<br />
Yungtay Engineering Co Ltd 5 286 076 0,49 %<br />
Zig Sheng Industrial Co Ltd 1 432 400 0,35 %<br />
Zinwell Corp 2 590 347 0,11 %<br />
Zyxel Communications Corp 3 075 292 0,16 %<br />
THAILAND<br />
Advanced Info Service PCL 66 699 200 0,07 %<br />
Airports <strong>of</strong> Thailand PCL 5 002 471 0,05 %<br />
Amata Corp PCL 4 840 393 0,28 %<br />
Asian Property Development PCL 5 781 911 0,26 %<br />
Bangkok <strong>Bank</strong> PCL 197 117 973 0,23 %<br />
<strong>Bank</strong> <strong>of</strong> Ayudhya PCL 12 538 224 0,00 %<br />
Banpu PCL 27 814 040 0,07 %<br />
BEC World PCL 20 354 163 0,13 %<br />
Bumrungrad Hospital PCL 8 536 200 0,00 %<br />
CalComp Electronics Thailand PCL 1 405 574 0,05 %<br />
Central Pattana PCL 15 672 451 0,12 %<br />
Charoen Pokphand Foods PCL 13 225 946 0,14 %<br />
CP ALL PCL 35 541 144 0,16 %<br />
Electricity Generating PCL 19 007 058 0,06 %<br />
Glow Energy PCL 11 825 556 0,09 %<br />
Hana Microelectronics PCL 15 659 095 0,47 %<br />
IRPC PCL 22 456 134 0,13 %<br />
Italian-Thai Development PCL 5 072 635 0,13 %<br />
Kasikornbank PCL 89 133 331 0,14 %<br />
Krung Thai <strong>Bank</strong> PCL 51 585 820 0,30 %<br />
Land and Houses PCL 17 360 648 0,01 %<br />
Minor International PCL 9 856 787 0,09 %<br />
Precious Shipping PCL 11 063 363 0,24 %<br />
PTT Aromatics & Refi ning PCL 28 118 062 0,24 %<br />
PTT Chemical PCL 16 969 704 0,09 %<br />
PTT Exploration & Production PCL 200 731 041 0,14 %<br />
PTT PCL 161 778 105 0,08 %<br />
Quality House PCL 9 205 523 0,29 %<br />
Ratchaburi Electricity Generating <strong>Holding</strong> PCL 14 530 631 0,06 %<br />
Regional Container Lines PCL 7 255 569 0,44 %<br />
Samart Corp PCL 7 945 600 0,37 %<br />
Siam Cement PCL 62 778 558 0,10 %<br />
Siam City <strong>Bank</strong> PCL 4 412 600 0,07 %<br />
Siam City Cement PCL 12 139 926 0,00 %<br />
Siam Commercial <strong>Bank</strong> PCL 63 402 022 0,13 %<br />
Siam Makro PCL 23 102 098 0,35 %<br />
Tata Steel Thailand PCL 2 755 645 0,06 %<br />
Thai Airways International PCL 4 343 018 0,08 %<br />
Thai Oil PCL 24 960 856 0,13 %<br />
Thai Union Frozen Products PCL 6 897 296 0,10 %<br />
Thanachart Capital PCL 11 293 441 0,30 %<br />
Thoresen Thai Agencies PCL 12 410 218 0,29 %<br />
Tisco <strong>Bank</strong> PCL 12 898 247 0,66 %<br />
TMB <strong>Bank</strong> PCL 16 360 787 0,17 %<br />
TPI Polene PCL 2 976 726 0,12 %<br />
True Corp PCL 2 364 945 0,09 %<br />
TURKEY<br />
Akbank TAS 242 241 108 0,37 %<br />
Akcansa Cimento AS 7 864 918 0,38 %<br />
Akenerji Elektrik Uretim AS 6 019 919 0,33 %<br />
Aksigorta AS 35 653 258 0,90 %<br />
Alarko <strong>Holding</strong> AS 3 324 061 0,20 %<br />
Anadolu Efes Biracilik Ve Malt Sanayii AS 90 908 205 0,43 %<br />
Arcelik 13 377 943 0,36 %<br />
Aselsan Elektronik Sanayi Ve Ticaret AS 1 956 214 0,12 %<br />
Asya Katilim <strong>Bank</strong>asi AS 27 731 181 0,59 %<br />
Aygaz AS 6 270 054 0,23 %<br />
BIM Birlesik Magazalar AS 64 980 495 0,59 %<br />
Coca-Cola Icecek AS 45 287 066 0,62 %<br />
Dogan Sirketler Grubu <strong>Holding</strong>s 32 631 648 0,47 %<br />
Dogan Yayin <strong>Holding</strong> 20 496 052 1,11 %<br />
EIS Eczacibasi Ilac ve Sinai ve Finansal Yatirimlar Sanayi ve Tic 9 716 988 0,44 %<br />
Enka Insaat ve Sanayi AS 75 207 556 0,26 %<br />
Eregli Demir ve Celik Fabrikalari TAS 126 288 595 0,59 %<br />
Ford Otomotiv Sanayi AS 12 690 220 0,18 %<br />
Fortis <strong>Bank</strong> AS 6 391 125 0,18 %<br />
Haci Omer Sabanci <strong>Holding</strong> AS 77 253 201 0,27 %<br />
Hurriyet Gazetecilik AS 18 378 993 1,35 %<br />
Ihlas <strong>Holding</strong> 13 070 027 3,31 %<br />
Is Gayrimenkul Yatirim Ortakligi AS 9 849 633 0,69 %<br />
Kardemir Karabuk Demir Celik Sanayi ve Ticaret AS 25 854 130 3,03 %<br />
KOC <strong>Holding</strong> AS 121 535 522 0,51 %<br />
Migros Turk TAS 5 522 042 0,05 %<br />
Petkim Petrokimya <strong>Holding</strong> 36 889 202 0,86 %<br />
Sekerbank TAS 24 212 286 1,22 %<br />
TAV Havalimanlari <strong>Holding</strong> AS 24 508 242 0,67 %<br />
T<strong>of</strong>as Turk Otomobil Fabrikasi AS 14 101 461 0,54 %<br />
Trakya Cam Sanayi AS 10 134 359 0,45 %<br />
Tupras Turkiye Petrol Rafi ne 87 311 051 0,47 %<br />
Turk Ekonomi <strong>Bank</strong>asi AS 29 075 459 0,71 %<br />
Turk Hava Yollari 60 359 905 1,33 %<br />
Turk Sise ve Cam Fabrikalari AS 35 954 287 0,72 %<br />
Turk Telekomunikasyon AS 101 250 609 0,18 %<br />
Market value<br />
Voting<br />
(per cent)<br />
Turkcell Iletisim Hizmet AS 212 460 419 0,24 %<br />
Turkiye Garanti <strong>Bank</strong>asi AS 184 391 480 0,37 %<br />
Turkiye Halk <strong>Bank</strong>asi AS 369 275 373 1,42 %<br />
Turkiye Is <strong>Bank</strong>asi 190 607 687 0,37 %<br />
Turkiye Vakifl ar <strong>Bank</strong>asi Tao 50 870 195 0,38 %<br />
Ulker Biskuvi Sanayi AS 2 252 725 0,11 %<br />
Yapi ve Kredi <strong>Bank</strong>asi AS 103 711 714 0,25 %<br />
Yazicilar <strong>Holding</strong> AS 4 124 370 0,12 %<br />
Zorlu Enerji Elektrik Uretim AS 2 147 183 0,28 %<br />
UNITED ARAB EMIRATES<br />
Depa Ltd 535 661 0,00 %<br />
UNITED KINGDOM<br />
3i Group PLC 138 453 676 1,32 %<br />
3i Infrastructure PLC 180 595 066 2,70 %<br />
888 <strong>Holding</strong>s PLC 20 168 018 0,59 %<br />
Aberdeen Asset Management PLC 123 028 005 1,42 %<br />
Aberforth Smaller Companies Trust PLC 46 346 019 1,35 %<br />
Admiral Group PLC 204 352 812 0,84 %<br />
Aegis Group Plc 203 183 525 2,34 %<br />
Aga Rangemaster Group PLC 4 539 854 0,90 %<br />
Aggreko Plc 132 619 685 1,09 %<br />
Alizyme Plc 791 805 0,51 %<br />
Allergy Therapeutics PLC 2 492 063 2,88 %<br />
Alliance Trust PLC/The 294 374 439 1,53 %<br />
AMEC PLC 207 929 287 1,26 %<br />
Amlin PLC 189 127 062 1,12 %<br />
Anglo American PLC 2 698 005 802 1,32 %<br />
Ant<strong>of</strong>agasta PLC 204 203 654 0,48 %<br />
Aquarius Platinum Ltd 50 484 378 0,88 %<br />
Arena Leisure Plc 2 040 549 0,22 %<br />
Aricom PLC 150 544 0,02 %<br />
ARM <strong>Holding</strong>s Plc 116 446 211 1,07 %<br />
Arriva Plc 180 690 459 1,50 %<br />
Ashmore Group PLC 40 829 442 0,43 %<br />
Ashtead Group PLC 28 247 235 1,30 %<br />
Associated British Foods PLC 218 733 223 0,38 %<br />
Assura Group Ltd 8 262 467 0,61 %<br />
AstraZeneca PLC 5 587 531 222 1,23 %<br />
Atkins WS PLC 165 369 351 2,45 %<br />
Autonomy Corp PLC 243 158 812 1,18 %<br />
Aveva Group PLC 70 646 354 1,82 %<br />
Avis Europe PLC 4 725 463 1,30 %<br />
Aviva PLC 1 152 711 940 1,10 %<br />
Babcock International Group 215 608 482 1,97 %<br />
Balfour Beatty PLC 246 691 979 1,56 %<br />
<strong>Bank</strong>ers Investment Trust PLC/The 42 062 239 1,18 %<br />
Barclays PLC 1 700 077 237 1,31 %<br />
Baring Emerging Europe PLC 25 618 567 1,57 %<br />
Barratt Developments PLC 36 422 877 1,49 %<br />
BBA Aviation PLC 47 805 866 1,67 %<br />
Beazley Group PLC 57 028 642 1,20 %<br />
Bellway PLC 114 028 073 1,64 %<br />
Berkeley Group <strong>Holding</strong>s PLC 126 077 696 1,19 %<br />
BG Group PLC 4 300 092 093 1,32 %<br />
BHP Billiton PLC 5 757 266 725 1,96 %<br />
Big Yellow Group PLC 24 920 068 0,90 %<br />
BlackRock World Mining Trust PLC 65 176 508 0,00 %<br />
Bloomsbury Publishing Plc 7 963 022 0,67 %<br />
BlueBay Asset Management PLC 6 178 232 0,45 %<br />
Bodycote PLC 48 372 522 2,08 %<br />
Bovis Homes Group PLC 126 835 768 2,60 %<br />
BowLeven PLC 939 699 0,37 %<br />
BP PLC 13 151 267 159 1,31 %<br />
Brewin Dolphin <strong>Holding</strong>s Plc 12 386 718 0,55 %<br />
Brit Insurance <strong>Holding</strong>s Plc 82 463 310 1,19 %<br />
British Airways PLC 141 217 559 0,68 %<br />
British American Tobacco PLC 4 777 801 401 1,30 %<br />
British Assets Trust PLC 36 546 377 0,00 %<br />
British Empire Securities and General Trust PLC 62 745 040 1,17 %<br />
British Energy Group PLC 1 108 688 825 1,36 %<br />
British Land Co PLC 427 948 329 1,51 %<br />
British Sky Broadcasting Group PLC 845 111 483 1,00 %<br />
Britvic PLC 68 429 506 1,16 %<br />
Brixton PLC 45 336 134 1,26 %<br />
BSS Group PLC 75 090 231 2,41 %<br />
BT Group PLC 1 313 622 028 1,25 %<br />
BTG PLC 19 030 000 0,53 %<br />
Bunzl PLC 248 151 530 1,28 %<br />
Burberry Group PLC 132 411 236 1,37 %<br />
Business Post Group Plc 18 015 352 1,44 %<br />
Cable & Wireless PLC 613 716 812 1,55 %<br />
Cadbury PLC 1 301 226 496 1,57 %<br />
Cairn Energy Plc 336 539 061 1,27 %<br />
Caledonia Investments PLC/fund 96 751 517 1,12 %<br />
Candover Investments PLC/fund 28 387 876 1,56 %<br />
Capita Group PLC/The 568 593 759 1,24 %<br />
Capital & Regional PLC 2 796 144 0,83 %<br />
Care UK PLC 13 170 213 0,77 %<br />
Carillion PLC 231 048 293 2,34 %<br />
Carnival PLC 496 461 565 1,53 %<br />
Carpetright PLC 19 679 523 0,83 %<br />
29<br />
GOVERNMENT PENSION FUND <strong>–</strong> GLOBAL ANNUAL REPORT 2008
<strong>Government</strong> <strong>Pension</strong> <strong>Fund</strong> <strong>–</strong> <strong>Global</strong> <strong>Holding</strong> <strong>of</strong> equities at 31 December 2008<br />
Market value<br />
Voting<br />
(per cent)<br />
Carphone Warehouse Group PLC 50 742 454 0,61 %<br />
Catlin Group Ltd 125 234 233 1,12 %<br />
Cattles PLC 12 751 815 1,30 %<br />
Centrica PLC 1 370 459 627 1,00 %<br />
Charter International PLC 65 697 944 1,19 %<br />
Chaucer <strong>Holding</strong>s Plc 16 802 187 0,96 %<br />
Chemring Group Plc 78 491 917 1,14 %<br />
Chesnara PLC 9 762 100 0,72 %<br />
Chloride Group 44 347 209 1,17 %<br />
Chrysalis Group PLC 3 579 168 0,95 %<br />
City <strong>of</strong> London Investment Trust PLC/The 45 938 067 0,00 %<br />
Climate Exchange PLC 8 572 513 0,21 %<br />
Clinton Cards Plc 64 538 0,06 %<br />
Clipper Windpower PLC 1 429 552 0,15 %<br />
Close Brothers Group Plc 103 348 258 1,35 %<br />
CLS <strong>Holding</strong>s Plc 20 919 617 1,10 %<br />
Cobham PLC 302 009 180 1,28 %<br />
Collins Stewart PLC 13 424 158 0,92 %<br />
Colt Telecom Group SA 19 665 813 0,43 %<br />
Compass Group PLC 826 676 328 1,29 %<br />
Computacenter PLC 8 880 319 0,64 %<br />
Connaught Plc 40 208 493 0,94 %<br />
Cookson Group PLC 46 321 327 1,71 %<br />
Cranswick PLC 14 338 218 0,53 %<br />
Croda International 85 466 843 1,17 %<br />
CSR PLC 48 184 565 2,13 %<br />
Daejan <strong>Holding</strong>s PLC 5 542 531 0,15 %<br />
Daily Mail & General Trust 117 032 208 0,00 %<br />
Dairy Crest Group PLC 56 156 314 1,97 %<br />
Dana Petroleum Plc 132 611 107 1,53 %<br />
Davis Service Group PLC 53 695 354 1,15 %<br />
De La Rue PLC 119 189 695 1,35 %<br />
Debenhams PLC 15 978 342 0,74 %<br />
Dechra Pharmaceuticals Plc 4 304 333 0,18 %<br />
Delta PLC 10 426 528 0,81 %<br />
Derwent London PLC 101 605 232 1,38 %<br />
Development Securities PLC 9 305 572 0,84 %<br />
Dexion Absolute Ltd 83 253 701 1,34 %<br />
Diageo PLC 3 001 667 022 1,24 %<br />
Dignity PLC 48 015 740 1,25 %<br />
Dimension Data <strong>Holding</strong>s PLC 58 993 353 0,90 %<br />
Domino Printing Sciences 24 523 868 1,10 %<br />
Drax Group PLC 39 420 816 0,21 %<br />
DS Smith PLC 32 241 881 1,07 %<br />
Dsg International Plc 52 655 775 1,69 %<br />
DTZ <strong>Holding</strong>s PLC 1 439 979 0,85 %<br />
Dunelm Group Plc 5 129 916 0,20 %<br />
eaga PLC 9 210 708 0,25 %<br />
Earthport plc 3 941 203 0,88 %<br />
easyJet PLC 137 182 948 1,15 %<br />
Edinburgh Dragon Trust PLC 32 315 605 0,00 %<br />
Edinburgh Investment Trust PLC/The 78 835 097 1,22 %<br />
Edinburgh UK Tracker Trust PLC 10 107 035 0,00 %<br />
Edinburgh US Tracker Trust PLC 21 238 603 0,00 %<br />
Eidos PLC 1 866 441 0,45 %<br />
Electra Private Equity PLC 31 476 349 1,56 %<br />
Electric and General Investment Trust PLC 30 424 134 1,43 %<br />
Electrocomponents PLC 79 443 770 1,28 %<br />
Elementis Plc 36 566 011 2,18 %<br />
Enterprise Inns Plc 56 799 244 2,01 %<br />
Erinaceous Group PLC 236 482 1,33 %<br />
Eurasian Natural Resources Corp 154 538 791 0,36 %<br />
Euromoney Institutional Investor PLC 4 067 799 0,17 %<br />
Eurotunnel PLC 33 768 0,00 %<br />
Evolution Group PLC 17 046 756 0,88 %<br />
Experian PLC 614 005 471 1,38 %<br />
F&C Asset Management PLC 12 232 879 0,43 %<br />
F&C Commercial Property Trust Ltd 17 198 362 0,00 %<br />
F&C <strong>Global</strong> Smaller Companies PLC 5 387 465 0,42 %<br />
Falkland Oil & Gas Ltd 78 695 0,01 %<br />
Fenner Plc 11 023 329 0,88 %<br />
Ferrexpo PLC 7 750 146 0,44 %<br />
Fiberweb PLC 7 663 948 2,54 %<br />
Fidelity European Values PLC 96 561 770 0,00 %<br />
Fidelity Special Values PLC 33 551 800 0,00 %<br />
Fidessa Group PLC 11 542 135 0,66 %<br />
Filtrona PLC 26 901 829 0,95 %<br />
Findel PLC 18 023 711 2,15 %<br />
Finsbury Worldwide Pharmaceutical Trust PLC/<strong>Fund</strong> 32 961 657 1,36 %<br />
Firstgroup Plc 236 401 493 1,12 %<br />
Foreign & Colonial Eurotrust PLC 30 830 185 1,38 %<br />
Foreign & Colonial Investment Trust PLC 208 915 810 1,34 %<br />
Forth Ports Plc 63 720 924 1,51 %<br />
French Connection Group PLC 13 218 141 2,69 %<br />
Friends Provident PLC 265 976 451 1,32 %<br />
Future PLC 1 902 302 0,32 %<br />
G4S PLC 359 558 937 1,24 %<br />
Galiform PLC 8 240 066 0,85 %<br />
Galliford Try Plc 13 275 549 1,10 %<br />
Game Group Plc 55 596 799 1,26 %<br />
Gartmore European Investment Trust PLC 20 022 837 1,28 %<br />
Market value<br />
Voting<br />
(per cent)<br />
Gem Diamonds Ltd 17 284 530 1,07 %<br />
Genus PLC 15 539 482 0,39 %<br />
GKN PLC 90 843 671 1,32 %<br />
GlaxoSmithKline PLC 8 449 166 780 1,24 %<br />
Go-Ahead Group Plc 53 377 670 1,19 %<br />
Grainger Plc 26 372 577 1,41 %<br />
Graphite Enterprise Trust PLC 12 941 566 0,00 %<br />
Great Portland Estates PLC 59 242 227 1,25 %<br />
Greene King PLC 65 262 336 1,22 %<br />
Greggs Plc 72 950 558 2,07 %<br />
Gulfsands Petroleum Plc 32 089 421 2,11 %<br />
Halfords Group PLC 86 133 500 1,68 %<br />
Halma PLC 163 146 681 2,14 %<br />
Hammerson PLC 231 498 913 1,48 %<br />
Havelock Europa Plc 2 562 790 1,97 %<br />
Hays PLC 157 023 052 1,63 %<br />
HBOS PLC 493 335 299 1,31 %<br />
Headlam Group Plc 24 550 195 1,39 %<br />
Helical Bar Plc 25 971 425 0,96 %<br />
Helphire Plc 42 596 807 2,40 %<br />
Henderson Group PLC 42 240 295 0,99 %<br />
Henderson Smaller Companies Investment Trust PLC/The 10 889 811 1,20 %<br />
Henderson TR Pacifi c Investment Trust PLC 13 789 397 0,84 %<br />
Herald Investment Trust PLC 22 802 453 1,48 %<br />
Heritage Oil Ltd 36 561 942 0,69 %<br />
Hikma Pharmaceuticals PLC 84 287 618 1,26 %<br />
Hiscox Ltd 153 607 557 1,22 %<br />
HMV Group PLC 95 256 240 2,17 %<br />
Hochschild Mining PLC 10 352 968 0,30 %<br />
Holidaybreak PLC 8 231 182 0,86 %<br />
Home Retail Group PLC 60 674 189 0,32 %<br />
Homeserve PLC 107 836 522 1,67 %<br />
HSBC <strong>Holding</strong>s PLC 10 561 520 852 1,31 %<br />
HSBC Infrastructure Co Ltd 50 619 400 1,30 %<br />
Hunting PLC 93 468 121 1,68 %<br />
ICAP PLC 188 235 684 1,00 %<br />
IG Group <strong>Holding</strong>s PLC 150 500 276 1,63 %<br />
Imagination Technologies Group Plc 7 235 850 0,50 %<br />
IMI Plc 101 038 855 1,15 %<br />
Imperial Energy Corp PLC 219 708 469 0,00 %<br />
Imperial Tobacco Group PLC 2 426 963 580 1,28 %<br />
Inchcape Plc 30 712 982 1,80 %<br />
Informa PLC 276 341 011 2,62 %<br />
ING UK Real Estate Income Trust Ltd 5 985 836 0,80 %<br />
Inmarsat PLC 233 388 978 1,07 %<br />
Intercontinental Hotels Group PLC 207 331 409 1,28 %<br />
Intermediate Capital Group PLC 68 271 534 1,23 %<br />
International Ferro Metals Ltd 11 367 002 1,42 %<br />
International Personal Finance Plc 46 652 608 1,30 %<br />
International Power PLC 470 356 197 1,28 %<br />
Interserve PLC 51 821 829 1,81 %<br />
Intertek Group PLC 135 885 422 1,09 %<br />
Invensys PLC 214 689 124 1,53 %<br />
Investec PLC 189 338 631 1,55 %<br />
Invista Foundation Property Trust Ltd 5 692 550 1,03 %<br />
ITE Group PLC 30 306 728 2,00 %<br />
ITV PLC 166 565 382 1,07 %<br />
J Sainsbury PLC 770 214 816 1,33 %<br />
James Fisher & Sons PLC 16 487 796 0,94 %<br />
Jardine Lloyd Thompson Group PLC 81 926 782 0,87 %<br />
JJB Sports PLC 1 084 028 1,05 %<br />
JKX Oil & Gas PLC 27 621 798 0,89 %<br />
John Wood Group PLC 96 828 923 0,97 %<br />
Johnson Matthey PLC 298 208 299 1,26 %<br />
Johnson Service Group PLC 745 332 0,30 %<br />
Johnston Press PLC 9 942 191 1,29 %<br />
JPMorgan American Investment Trust PLC 35 745 760 1,33 %<br />
JPMorgan Asian Investment Trust PLC 42 174 531 1,98 %<br />
JPMorgan Emerging Markets Investment Trust PLC 53 056 194 1,54 %<br />
JPMorgan Eur Fledgeling Investment Trust plc 43 535 460 1,75 %<br />
JPMorgan European Investment Trust Plc 27 177 047 1,26 %<br />
JPMorgan Indian Investment Trust PLC 34 402 975 0,00 %<br />
JPMorgan Japanese Investment Trust PLC 34 120 940 0,00 %<br />
JPMorgan Overseas Investment Trust PLC 8 505 538 0,68 %<br />
JPMorgan Russian Securities PLC 12 997 461 1,19 %<br />
Just Retirement PLC 15 834 0,00 %<br />
Kazakhmys PLC 59 730 335 0,48 %<br />
Kcom Group PLC 4 278 197 0,61 %<br />
Keller Group PLC 42 679 821 1,15 %<br />
Kesa Electricals PLC 57 641 184 1,23 %<br />
Kier Group PLC 86 550 297 2,57 %<br />
Kingfi sher PLC 761 106 272 2,37 %<br />
Ladbrokes PLC 142 302 797 1,27 %<br />
Laird PLC 51 605 441 2,08 %<br />
Land Securities Group PLC 567 717 263 1,32 %<br />
Law Debenture Corp PLC/fund 21 356 317 0,00 %<br />
Legal & General Group PLC 568 806 728 1,26 %<br />
Liberty International PLC 235 538 564 1,34 %<br />
Lloyds TSB Group PLC 952 390 440 1,26 %<br />
Logica PLC 182 429 405 1,64 %<br />
London Scottish <strong>Bank</strong> Plc 119 270 0,32 %<br />
30<br />
GOVERNMENT PENSION FUND <strong>–</strong> GLOBAL ANNUAL REPORT 2008
<strong>Government</strong> <strong>Pension</strong> <strong>Fund</strong> <strong>–</strong> <strong>Global</strong> <strong>Holding</strong> <strong>of</strong> equities at 31 December 2008<br />
Market value<br />
Voting<br />
(per cent)<br />
London Stock Exchange Group PLC 116 913 261 0,84 %<br />
Lonmin Plc 194 351 579 1,34 %<br />
Lookers Plc 1 987 074 0,48 %<br />
Lowland Investment Company PLC 6 725 902 0,57 %<br />
Luminar Group <strong>Holding</strong>s PLC 20 339 400 2,46 %<br />
Man Group PLC 543 812 867 1,34 %<br />
Mapeley Ltd 967 657 0,31 %<br />
Marks & Spencer Group PLC 534 698 234 1,57 %<br />
Marshalls PLC 10 033 672 0,79 %<br />
Marstons PLC 50 987 670 1,59 %<br />
Mcbride Plc 15 836 438 0,72 %<br />
Meggitt PLC 175 467 163 1,64 %<br />
Melrose PLC 55 097 119 1,27 %<br />
Melrose Resources PLC 13 327 355 0,64 %<br />
Mercantile Investment Trust PLC 81 767 408 1,32 %<br />
Merchants Trust PLC/The 32 727 514 1,09 %<br />
Michael Page International Plc 78 186 521 1,13 %<br />
Micro Focus International PLC 48 408 411 0,85 %<br />
Microgen Plc 3 722 138 0,97 %<br />
Millennium & Copthorne Hotels PLC 72 564 159 1,07 %<br />
Minerva PLC 1 813 659 0,83 %<br />
Misys PLC 65 423 448 1,20 %<br />
Mitchells & Butlers PLC 77 055 153 1,18 %<br />
Mitie Group 73 497 381 1,10 %<br />
Mondi PLC 656 749 535 8,71 %<br />
Moneysupermarket.com Group PLC 5 360 821 0,20 %<br />
Monks Investment Trust PLC/<strong>Fund</strong> 75 712 970 1,31 %<br />
Morgan Crucible Co 36 054 863 1,19 %<br />
Morgan Sindall PLC 18 529 811 0,79 %<br />
Morse PLC 471 352 0,54 %<br />
Mothercare PLC 29 399 716 1,00 %<br />
Mouchel Group PLC 66 168 972 1,71 %<br />
Mucklow A & J Group Plc 3 017 497 0,23 %<br />
Murray Income Trust PLC 26 184 265 0,89 %<br />
Murray International Trust PLC 62 318 604 1,17 %<br />
N Brown Group PLC 46 430 252 0,83 %<br />
National Express Group PLC 117 398 713 1,54 %<br />
National Grid PLC 1 114 675 872 0,65 %<br />
Nds Group PLC 100 334 953 1,52 %<br />
Nestor Healthcare Group PLC 1 923 287 0,83 %<br />
New Star Asset Management Group PLC 347 627 0,68 %<br />
Next PLC 331 655 732 1,55 %<br />
Northern Foods PLC 24 992 211 0,85 %<br />
Northgate Plc 5 081 039 0,94 %<br />
Northumbrian Water Group PLC 106 095 779 0,86 %<br />
Novae Group PLC 14 242 414 0,62 %<br />
Old Mutual PLC 349 016 925 1,15 %<br />
Paragon Group <strong>of</strong> Cos PLC 16 040 493 0,68 %<br />
PartyGaming PLC 27 839 275 0,35 %<br />
PayPoint PLC 17 522 284 0,51 %<br />
Pearson PLC 594 014 437 1,14 %<br />
Pendragon Plc 3 690 964 3,39 %<br />
Pennon Group PLC 220 978 100 1,24 %<br />
Perpetual Income and Growth Investment Trust PLC 45 880 552 0,00 %<br />
Persimmon PLC 92 316 585 1,33 %<br />
Petr<strong>of</strong>ac Ltd 118 944 826 0,99 %<br />
Photo-Me International PLC 7 709 479 1,94 %<br />
Polar Capital Technology Trust PLC 52 842 343 0,00 %<br />
Premier Farnell PLC 60 531 338 1,18 %<br />
Premier Foods PLC 62 739 539 2,42 %<br />
Premier Oil PLC 156 368 318 1,99 %<br />
Provident Financial Plc 154 094 867 1,35 %<br />
Prudential PLC 1 590 194 234 1,52 %<br />
Psion Plc 4 287 390 0,60 %<br />
Punch Taverns PLC 24 829 231 1,59 %<br />
PV Crystalox Solar PLC 51 453 532 1,23 %<br />
PZ Cussons PLC 43 999 889 0,63 %<br />
QinetiQ Group PLC 115 337 894 1,09 %<br />
Quintain Estates & Development Plc 8 033 486 1,67 %<br />
RAB Capital PLC 2 487 379 0,45 %<br />
Randgold Resources Ltd 230 311 104 1,01 %<br />
Rank Group PLC 34 080 490 1,28 %<br />
Rathbone Brothers 66 304 045 1,85 %<br />
Raymarine PLC 690 795 0,65 %<br />
Reckitt Benckiser Group PLC 2 818 293 326 1,53 %<br />
Record PLC 4 375 065 0,26 %<br />
Redrow PLC 47 845 728 1,82 %<br />
Reed Elsevier PLC 590 603 669 1,05 %<br />
Regus PLC 39 108 028 0,83 %<br />
Renishaw Plc 26 357 080 0,73 %<br />
Renovo Group PLC 428 370 0,11 %<br />
Rensburg Sheppards PLC 6 031 686 0,34 %<br />
Rentokil Initial PLC 103 746 902 1,29 %<br />
Restaurant Group PLC 45 578 943 2,16 %<br />
Rexam PLC 330 510 912 1,46 %<br />
Rightmove PLC 15 576 595 0,75 %<br />
RIT Capital Partners PLC 182 358 336 1,32 %<br />
Robert Walters PLC 5 371 687 0,68 %<br />
Robert Wiseman Dairies Plc 10 565 293 0,49 %<br />
ROK PLC 3 981 115 1,09 %<br />
Rolls-Royce Group PLC 943 638 910 1,52 %<br />
Market value<br />
Voting<br />
(per cent)<br />
Rotork Plc 123 891 926 1,80 %<br />
Royal <strong>Bank</strong> <strong>of</strong> Scotland Group PLC 1 308 503 655 0,67 %<br />
Royal Dutch Shell PLC 15 262 997 409 1,37 %<br />
RPS Group Plc 33 554 698 1,12 %<br />
RSA Insurance Group PLC 590 180 339 1,28 %<br />
RT Group PLC 81 065 0,00 %<br />
SABMiller PLC 1 873 451 765 1,06 %<br />
Safestore <strong>Holding</strong>s Plc 12 215 371 1,17 %<br />
Sage Group PLC/The 327 538 088 1,46 %<br />
Savills PLC 37 196 315 1,25 %<br />
Schroder UK Growth <strong>Fund</strong> PLC 5 523 256 0,50 %<br />
Schroders PLC 148 749 608 0,53 %<br />
Scottish & Southern Energy PLC 1 222 583 152 1,14 %<br />
Scottish Investment Trust PLC/fund 57 599 347 1,20 %<br />
Scottish Mortgage Investment Trust PLC 149 579 881 1,51 %<br />
SDL PLC 17 144 718 0,98 %<br />
Securities Trust <strong>of</strong> Scotland 4 468 884 0,52 %<br />
Segro PLC 140 466 747 1,29 %<br />
Senior Plc 16 917 734 1,08 %<br />
Severfi eld-Rowen PLC 12 565 764 0,70 %<br />
Severn Trent PLC 366 619 823 1,29 %<br />
Shaftesbury Plc 66 219 754 1,34 %<br />
Shanks Group Plc 55 845 087 2,14 %<br />
Shire PLC 695 965 541 1,22 %<br />
SIG Plc 49 206 740 2,02 %<br />
Skyepharma PLC 1 736 535 0,56 %<br />
Smith & Nephew PLC 516 594 612 1,29 %<br />
Smiths Group PLC 462 310 874 1,33 %<br />
Smiths News PLC 6 543 535 0,50 %<br />
Soco International PLC 95 328 311 1,15 %<br />
Southern Cross Healthcare Ltd 36 029 086 2,24 %<br />
Spectris PLC 73 866 955 1,19 %<br />
Speedy Hire PLC 21 493 014 2,99 %<br />
Spirax-Sarco Engineering Plc 101 078 503 1,46 %<br />
Spirent Communications PLC 25 285 206 1,03 %<br />
Sports Direct International PLC 31 879 160 1,31 %<br />
SSL International PLC 203 706 521 2,13 %<br />
St Ives Group PLC 6 911 478 0,80 %<br />
St Jamess Place PLC 33 395 907 0,39 %<br />
ST Modwen Properties PLC 19 678 072 1,38 %<br />
Stagecoach Group PLC 115 523 988 1,14 %<br />
Standard Chartered PLC 2 204 244 722 1,32 %<br />
Standard Life PLC 554 095 959 1,25 %<br />
Sthree PLC 15 751 768 0,88 %<br />
STV Group PLC 2 635 186 0,94 %<br />
SVG Capital PLC/fund 16 311 174 1,31 %<br />
Talvivaara Mining Co PLC 6 255 048 0,23 %<br />
Tate & Lyle PLC 243 081 874 1,31 %<br />
Taylor Wimpey PLC 27 816 542 1,94 %<br />
Telecity Group PLC 85 066 364 2,42 %<br />
Temple Bar Investment Trust PLC 45 829 034 1,30 %<br />
Templeton Emerging Markets Investment Trust PLC 120 519 505 1,34 %<br />
Tesco PLC 3 617 534 110 1,27 %<br />
Third Advance Value Realisation Co Ltd 813 799 0,80 %<br />
Thomas Cook Group PLC 104 358 057 0,68 %<br />
Thomson Reuters PLC 293 801 632 1,07 %<br />
Throgmorton Trust PLC/The 8 846 292 0,85 %<br />
Tomkins Plc 146 167 995 1,34 %<br />
Topps Tiles PLC 1 943 569 0,54 %<br />
TR European Growth Trust PLC 17 061 694 0,92 %<br />
TR Property Investment Trust PLC 31 907 646 0,83 %<br />
Travis Perkins PLC 51 562 719 1,23 %<br />
Tribal Group Plc 2 097 424 0,31 %<br />
Trinity Mirror Plc 18 763 427 1,30 %<br />
TT electronics PLC 3 778 300 0,69 %<br />
TUI Travel PLC 151 848 692 0,58 %<br />
Tullett Prebon PLC 38 494 789 1,30 %<br />
Tullow Oil PLC 627 874 638 1,29 %<br />
UK Coal PLC 28 879 561 1,81 %<br />
UK Commercial Property Trust Ltd/fund 7 637 438 0,16 %<br />
Ultra Electronics <strong>Holding</strong>s 147 797 642 1,90 %<br />
Unibet Group PLC 65 519 103 2,54 %<br />
Unilever PLC 2 596 645 976 1,27 %<br />
Uniq PLC 333 222 0,69 %<br />
Unite Group Plc 19 579 123 1,07 %<br />
United Business Media Ltd 195 886 844 1,57 %<br />
United Utilities Group PLC 110 957 489 0,26 %<br />
UTV Media PLC 9 811 583 0,92 %<br />
Venture Production PLC 126 363 634 1,97 %<br />
Victrex Plc 93 060 563 2,32 %<br />
Vodafone Group PLC 10 353 818 491 1,38 %<br />
VT Group PLC 109 985 458 1,10 %<br />
Warner Estate <strong>Holding</strong>s Plc 473 638 0,35 %<br />
Weir Group Plc/The 74 084 911 1,13 %<br />
Wellstream <strong>Holding</strong>s PLC 63 130 242 1,77 %<br />
Wetherspoon (J.D.) Plc 96 279 257 2,22 %<br />
WH Smith PLC 73 019 997 1,29 %<br />
Whitbread PLC 206 645 751 1,28 %<br />
William Hill PLC 114 483 919 1,52 %<br />
Wincanton Plc 21 442 056 0,98 %<br />
Witan Investment Trust PLC 117 223 004 1,55 %<br />
31<br />
GOVERNMENT PENSION FUND <strong>–</strong> GLOBAL ANNUAL REPORT 2008
<strong>Government</strong> <strong>Pension</strong> <strong>Fund</strong> <strong>–</strong> <strong>Global</strong> <strong>Holding</strong> <strong>of</strong> equities at 31 December 2008<br />
Market value<br />
Voting<br />
(per cent)<br />
WM Morrison Supermarkets PLC 1 170 421 888 1,58 %<br />
Wolfson Microelectronics PLC 6 639 335 0,71 %<br />
Wolseley PLC 358 521 690 1,40 %<br />
Woolworths Group PLC 1 602 976 0,89 %<br />
Workspace Group PLC 11 605 675 1,07 %<br />
WPP PLC 1 169 217 869 2,30 %<br />
WSP Group PLC 13 767 025 1,07 %<br />
Xchanging PLC 18 173 736 0,35 %<br />
Xstrata PLC 608 200 625 0,97 %<br />
Yell Group PLC 52 698 886 1,58 %<br />
Yule Catto & Co Plc 3 282 332 0,41 %<br />
UNITED STATES<br />
1st Source Corp 10 225 074 0,26 %<br />
3Com Corp 24 222 463 0,37 %<br />
3M Co 1 351 935 763 0,48 %<br />
99 Cents Only Stores 40 504 300 0,76 %<br />
Abbott Laboratories 2 407 770 330 0,42 %<br />
Abercrombie & Fitch Co 21 622 890 0,15 %<br />
Abiomed Inc 12 018 398 0,29 %<br />
AbitibiBowater Inc 1 092 046 0,63 %<br />
ABM Industries Inc 16 992 286 0,25 %<br />
Abraxis Bioscience Inc 4 800 877 0,03 %<br />
Acadia Realty Trust 10 002 089 0,31 %<br />
Accenture Ltd 1 069 767 668 0,77 %<br />
ACCO Brands Corp 6 658 872 0,51 %<br />
Accuray Inc 5 920 074 0,29 %<br />
ACE Ltd 640 904 126 0,52 %<br />
Achillion Pharmaceuticals Inc 4 647 822 3,87 %<br />
ACI Worldwide Inc 18 336 609 0,47 %<br />
Acme Packet Inc 1 999 116 0,10 %<br />
Acorda Therapeutics Inc 94 487 779 1,74 %<br />
Actel Corp 8 346 217 0,39 %<br />
Activision Blizzard Inc 185 001 388 0,23 %<br />
Actuant Corp 35 782 520 0,48 %<br />
Acuity Brands Inc 47 393 647 0,48 %<br />
Acxiom Corp 19 329 851 0,44 %<br />
Adaptec Inc 9 836 250 0,35 %<br />
ADC Telecommunications Inc 16 574 624 0,45 %<br />
Administaff Inc 16 323 952 0,42 %<br />
Adobe Systems Inc 538 986 766 0,68 %<br />
Adtran Inc 23 445 010 0,36 %<br />
Advance America Cash Advance Centers Inc 3 493 860 0,43 %<br />
Advance Auto Parts Inc 212 195 730 0,95 %<br />
Advanced Analogic Technologies Inc 3 750 177 0,39 %<br />
Advanced Energy Industries Inc 8 873 982 0,30 %<br />
Advanced Medical Optics Inc 7 786 337 0,27 %<br />
Advanced Micro Devices Inc 33 254 378 0,36 %<br />
Advanta Corp 2 144 866 0,25 %<br />
Advent S<strong>of</strong>tware Inc 16 111 156 0,43 %<br />
Advisory Board Co/The 9 609 276 0,39 %<br />
Aecom Technology Corp 85 222 886 0,38 %<br />
AerCap <strong>Holding</strong>s NV 2 765 909 0,15 %<br />
Aeropostale Inc 31 395 126 0,42 %<br />
Aerovironment Inc 18 250 055 0,34 %<br />
AES Corp/The 430 327 899 1,13 %<br />
Aetna Inc 461 997 417 0,50 %<br />
AFC Enterprises Inc 2 212 355 0,27 %<br />
Affi liated Computer Services Inc 114 117 047 0,39 %<br />
Affi liated Managers Group Inc 47 993 301 0,40 %<br />
Affymetrix Inc 6 866 116 0,47 %<br />
Afl ac Inc 594 475 966 0,40 %<br />
AGCO Corp 425 697 404 2,81 %<br />
Agilent Technologies Inc 180 633 847 0,47 %<br />
Agilysys Inc 3 079 539 0,45 %<br />
AGL Resources Inc 37 541 598 0,22 %<br />
Air Products & Chemicals Inc 340 307 906 0,46 %<br />
Aircastle Ltd 6 814 332 0,26 %<br />
Airgas Inc 77 983 386 0,35 %<br />
Airtran <strong>Holding</strong>s Inc 78 260 098 2,15 %<br />
AK Steel <strong>Holding</strong> Corp 26 580 289 0,36 %<br />
Akamai Technologies Inc 77 931 518 0,44 %<br />
Akorn Inc 2 224 496 0,15 %<br />
Alaska Air Group Inc 26 233 886 0,35 %<br />
Alaska Communications Systems Group Inc 12 288 737 0,43 %<br />
Albany International Corp 9 417 395 0,39 %<br />
Albany Molecular Research Inc 1 736 452 0,08 %<br />
Albemarle Corp 48 776 366 0,34 %<br />
Alberto-Culver Co 69 922 363 0,42 %<br />
Alcoa Inc 358 254 253 0,57 %<br />
Alcon Inc 293 084 095 0,16 %<br />
Alexander & Baldwin Inc 64 134 543 0,88 %<br />
Alexanders Inc 9 979 014 0,11 %<br />
Alexandria Real Estate Equities Inc 70 550 594 0,52 %<br />
Alexion Pharmaceuticals Inc 237 812 154 1,20 %<br />
Alico Inc 5 136 440 0,24 %<br />
Align Technology Inc 12 992 204 0,32 %<br />
Alkermes Inc 41 118 233 0,58 %<br />
Alleghany Corp 54 739 645 0,34 %<br />
Allegheny Energy Inc 349 447 396 0,87 %<br />
Allegheny Technologies Inc 67 023 484 0,39 %<br />
Allegiant Travel Co 17 712 331 0,26 %<br />
Market value<br />
Voting<br />
(per cent)<br />
Allergan Inc/United States 420 926 041 0,48 %<br />
Allete Inc 17 306 105 0,24 %<br />
Alliance Data Systems Corp 112 653 230 0,54 %<br />
Alliance Imaging Inc 5 030 419 0,18 %<br />
Alliance One International Inc 6 543 727 0,36 %<br />
Alliant Energy Corp 114 811 804 0,51 %<br />
Allied Capital Corp 14 474 424 0,43 %<br />
Allied World Assurance Co <strong>Holding</strong>s Ltd 62 297 419 0,45 %<br />
Allis-Chalmers Energy Inc 4 071 480 0,30 %<br />
Allos Therapeutics Inc 4 081 220 0,12 %<br />
Allscripts-Misys Healthcare Solutions Inc 21 157 839 0,21 %<br />
Allstate Corp/The 570 554 853 0,46 %<br />
Alnylam Pharmaceuticals Inc 14 017 112 0,20 %<br />
Alon USA Energy Inc 3 008 242 0,10 %<br />
Alpha Natural Resources Inc 31 439 805 0,39 %<br />
Altera Corp 247 824 973 0,71 %<br />
Altria Group Inc 916 297 967 0,42 %<br />
AM Castle & Co 5 188 628 0,30 %<br />
AMAG Pharmaceuticals Inc 13 706 985 0,32 %<br />
Amazon.com Inc 1 302 824 682 0,85 %<br />
AMB Property Corp 176 334 616 1,09 %<br />
AMBAC Financial Group Inc 11 145 474 0,43 %<br />
Ambassadors Group Inc 4 907 271 0,40 %<br />
AMCOL International Corp 11 780 701 0,26 %<br />
Amcore Financial Inc 2 323 158 0,40 %<br />
Amdocs Ltd 170 650 259 0,65 %<br />
Amedisys Inc 28 278 013 0,36 %<br />
Amerco Inc 14 396 214 0,30 %<br />
Ameren Corp 4 208 785 0,01 %<br />
American Apparel Inc 2 222 613 0,23 %<br />
American Axle & Manufacturing <strong>Holding</strong>s Inc 3 250 216 0,30 %<br />
American Campus Communities Inc 21 818 768 0,36 %<br />
American Capital Ltd 21 039 447 0,45 %<br />
American Commercial Lines Inc 1 152 242 0,07 %<br />
American Eagle Outfi tters Inc 43 807 165 0,32 %<br />
American Ecology Corp 9 158 116 0,35 %<br />
American Electric Power Co Inc 1 100 212 166 1,17 %<br />
American Equity Investment Life <strong>Holding</strong> Co 10 417 633 0,40 %<br />
American Express Co 697 272 876 0,46 %<br />
American Financial Group Inc/OH 41 947 914 0,23 %<br />
American Greetings Corp 10 909 250 0,49 %<br />
American International Group Inc 133 490 803 0,09 %<br />
American Medical Systems <strong>Holding</strong>s Inc 9 320 903 0,20 %<br />
American National Insurance Co 17 707 884 0,13 %<br />
American Oriental Bioengineering Inc 18 016 517 0,48 %<br />
American Public Education Inc 15 745 315 0,34 %<br />
American Railcar Industries Inc 2 729 342 0,17 %<br />
American Reprographics Co 5 340 974 0,24 %<br />
American Science & Engineering Inc 19 329 178 0,42 %<br />
American States Water Co 7 710 266 0,19 %<br />
American Superconductor Corp 23 340 037 0,47 %<br />
American Tower Corp 928 705 271 1,14 %<br />
American Water Works Co Inc 75 931 115 0,32 %<br />
American Woodmark Corp 4 816 297 0,27 %<br />
AmeriCredit Corp 28 759 099 0,41 %<br />
AMERIGROUP Corp 43 380 340 0,40 %<br />
Ameriprise Financial Inc 259 811 780 0,73 %<br />
AmerisourceBergen Corp 146 700 989 0,38 %<br />
Ameristar Casinos Inc 5 889 071 0,17 %<br />
Ameron International Corp 15 902 892 0,39 %<br />
Ametek Inc 102 662 467 0,45 %<br />
Amgen Inc 2 751 217 609 0,64 %<br />
Amkor Technology Inc 7 366 227 0,26 %<br />
AMN Healthcare Services Inc 6 548 083 0,34 %<br />
Amphenol Corp 133 647 074 0,45 %<br />
AMR Corp 129 798 836 0,62 %<br />
Amsurg Corp 18 054 820 0,35 %<br />
Amtrust Financial Services Inc 9 329 105 0,19 %<br />
Amylin Pharmaceuticals Inc 160 623 789 1,54 %<br />
Anadarko Petroleum Corp 597 708 654 0,48 %<br />
Analog Devices Inc 222 730 002 0,57 %<br />
Analogic Corp 4 805 613 0,19 %<br />
Andersons Inc/The 9 620 448 0,46 %<br />
Angiodynamics Inc 16 203 675 0,69 %<br />
Anixter International Inc 35 856 084 0,48 %<br />
Annaly Capital Management Inc 311 046 194 0,52 %<br />
AnnTaylor Stores Corp 8 206 397 0,36 %<br />
Ansys Inc 79 467 215 0,45 %<br />
Anthracite Capital Inc 2 468 088 0,21 %<br />
Anworth Mortgage Asset Corp 12 152 744 0,30 %<br />
AO Smith Corp 14 843 270 0,33 %<br />
AON Corp 421 711 489 0,49 %<br />
Apache Corp 868 467 289 0,50 %<br />
Apartment Investment & Management Co 21 657 074 0,26 %<br />
Apex Silver Mines Ltd 20 092 902 4,96 %<br />
Apogee Enterprises Inc 8 232 982 0,41 %<br />
Apollo Group Inc 615 854 750 0,00 %<br />
Apollo Investment Corp 41 301 948 0,45 %<br />
Apple Inc 2 650 319 516 0,50 %<br />
Applied Industrial Technologies Inc 25 349 202 0,45 %<br />
Applied Materials Inc 412 816 888 0,44 %<br />
32<br />
GOVERNMENT PENSION FUND <strong>–</strong> GLOBAL ANNUAL REPORT 2008
<strong>Government</strong> <strong>Pension</strong> <strong>Fund</strong> <strong>–</strong> <strong>Global</strong> <strong>Holding</strong> <strong>of</strong> equities at 31 December 2008<br />
Market value<br />
Voting<br />
(per cent)<br />
Applied Micro Circuits Corp 6 905 706 0,38 %<br />
Aptargroup Inc 77 569 835 0,47 %<br />
Aqua America Inc 44 372 054 0,23 %<br />
Arbitron Inc 8 856 352 0,36 %<br />
Arch Capital Group Ltd 102 462 392 0,35 %<br />
Arch Chemicals Inc 20 478 600 0,45 %<br />
Arch Coal Inc 143 987 928 0,88 %<br />
Archer-Daniels-Midland Co 568 826 173 0,44 %<br />
ArcSight Inc 40 903 894 2,32 %<br />
Arena Pharmaceuticals Inc 27 827 321 1,29 %<br />
Arena Resources Inc 34 942 192 0,47 %<br />
Ares Capital Corp 18 728 807 0,43 %<br />
Argo Group International <strong>Holding</strong>s Ltd 32 284 902 0,44 %<br />
Argon ST Inc 8 789 359 0,31 %<br />
Ariba Inc 17 847 759 0,41 %<br />
Arkansas Best Corp 17 941 486 0,34 %<br />
Armstrong World Industries Inc 14 706 638 0,17 %<br />
Arqule Inc 9 954 687 0,76 %<br />
Array Biopharma Inc 28 709 101 2,13 %<br />
Arris Group Inc 25 470 408 0,37 %<br />
Arrow Electronics Inc 72 594 413 0,46 %<br />
Arrow Financial Corp 5 123 082 0,28 %<br />
Arthrocare Corp 2 827 779 0,32 %<br />
Arthur J Gallagher & Co 79 367 919 0,46 %<br />
Aruba Networks Inc 2 852 750 0,19 %<br />
ArvinMeritor Inc 4 879 139 0,33 %<br />
Asbury Automotive Group Inc 4 187 947 0,41 %<br />
Ascent Media Corp 7 190 727 0,35 %<br />
Ashford Hospitality Trust Inc 2 110 836 0,28 %<br />
Ashland Inc 26 920 715 0,50 %<br />
Aspen Insurance <strong>Holding</strong>s Ltd 370 060 061 2,67 %<br />
Asset Acceptance Capital Corp 2 437 813 0,22 %<br />
Associated Banc-Corp 72 121 399 0,39 %<br />
Assurant Inc 869 052 057 3,52 %<br />
Assured Guaranty Ltd 23 654 787 0,33 %<br />
Astec Industries Inc 21 355 137 0,43 %<br />
Astoria Financial Corp 41 609 680 0,38 %<br />
AT&T Inc 5 195 672 205 0,44 %<br />
ATC Technology Corp/IL 6 914 134 0,33 %<br />
Athenahealth Inc 28 638 650 0,33 %<br />
Atheros Communications Inc 123 222 416 2,04 %<br />
Atlas Air Worldwide <strong>Holding</strong>s Inc 6 356 408 0,22 %<br />
Atlas America Inc 20 679 154 0,51 %<br />
Atmel Corp 37 914 554 0,39 %<br />
ATMI Inc 15 211 938 0,44 %<br />
Atmos Energy Corp 33 065 824 0,22 %<br />
ATP Oil & Gas Corp 4 511 340 0,31 %<br />
Atwood Oceanics Inc 31 604 072 0,46 %<br />
Autodesk Inc 251 273 846 0,81 %<br />
Autoliv Inc 40 758 498 0,39 %<br />
Automatic Data Processing Inc 773 968 408 0,55 %<br />
AutoNation Inc 35 164 228 0,29 %<br />
Autozone Inc 53 545 063 0,10 %<br />
Auxilium Pharmaceuticals Inc 64 244 865 0,76 %<br />
AvalonBay Communities Inc 138 755 033 0,42 %<br />
Avatar <strong>Holding</strong>s Inc 2 151 099 0,14 %<br />
Avery Dennison Corp 111 236 023 0,46 %<br />
Avid Technology Inc 15 696 146 0,55 %<br />
Avis Budget Group Inc 2 226 022 0,45 %<br />
Avista Corp 18 452 445 0,25 %<br />
Avnet Inc 115 889 818 0,60 %<br />
Avocent Corp 19 468 654 0,35 %<br />
Avon Products Inc 413 866 054 0,58 %<br />
AVX Corp 16 743 439 0,18 %<br />
Axis Capital <strong>Holding</strong>s Ltd 132 480 288 0,46 %<br />
Axsys Technologies Inc 14 184 961 0,33 %<br />
AZZ Inc 8 960 225 0,42 %<br />
Badger Meter Inc 13 247 482 0,44 %<br />
Baker Hughes Inc 483 579 980 0,70 %<br />
Baldor Electric Co 28 888 607 0,50 %<br />
Baldwin & Lyons Inc 4 083 807 0,00 %<br />
Ball Corp 128 433 836 0,47 %<br />
Bally Technologies Inc 42 481 056 0,46 %<br />
Bancfi rst Corp 7 781 574 0,14 %<br />
Bancorpsouth Inc 53 733 580 0,40 %<br />
<strong>Bank</strong> Mutual Corp 8 052 061 0,21 %<br />
<strong>Bank</strong> <strong>of</strong> America Corp 2 134 305 418 0,43 %<br />
<strong>Bank</strong> <strong>of</strong> Hawaii Corp 59 385 328 0,39 %<br />
<strong>Bank</strong> <strong>of</strong> New York Mellon Corp/The 972 373 532 0,43 %<br />
<strong>Bank</strong> <strong>of</strong> the Ozarks Inc 9 752 825 0,28 %<br />
<strong>Bank</strong>Atlantic Bancorp Inc 1 208 578 0,29 %<br />
<strong>Bank</strong>rate Inc 16 969 771 0,34 %<br />
Banner Corp 3 878 798 0,35 %<br />
Bare Escentuals Inc 6 259 112 0,19 %<br />
Barnes & Noble Inc 15 601 274 0,27 %<br />
Barnes Group Inc 18 120 241 0,33 %<br />
Basic Energy Services Inc 17 916 974 0,47 %<br />
Baxter International Inc 1 177 690 453 0,51 %<br />
BB&T Corp 414 455 663 0,39 %<br />
BE Aerospace Inc 32 305 966 0,60 %<br />
Beacon Ro<strong>of</strong>i ng Supply Inc 17 915 750 0,41 %<br />
Market value<br />
Voting<br />
(per cent)<br />
Beazer Homes USA Inc 2 598 607 0,60 %<br />
Bebe Stores Inc 25 772 058 0,55 %<br />
Beckman Coulter Inc 140 278 251 0,73 %<br />
Becton Dickinson & Co 533 806 170 0,46 %<br />
Bed Bath & Beyond Inc 423 679 249 0,92 %<br />
Belden Inc 27 558 987 0,47 %<br />
Belo Corp 3 797 018 0,39 %<br />
Bemis Co Inc 77 026 909 0,47 %<br />
Benchmark Electronics Inc 25 514 642 0,44 %<br />
Benefi cial Mutual Bancorp Inc 9 720 665 0,15 %<br />
Berkshire Hathaway Inc 3 957 591 317 0,36 %<br />
Berry Petroleum Co 9 985 612 0,44 %<br />
Best Buy Co Inc 182 301 080 0,22 %<br />
BGC Partners Inc 2 538 385 0,27 %<br />
Big 5 Sporting Goods Corp 2 816 256 0,36 %<br />
Big Lots Inc 33 612 623 0,40 %<br />
Bill Barrett Corp 63 047 797 0,94 %<br />
BioForm Medical Inc 2 593 400 0,88 %<br />
Biogen Idec Inc 509 723 045 0,52 %<br />
BioMarin Pharmaceutical Inc 89 698 656 0,72 %<br />
BioMed Realty Trust Inc 24 772 352 0,38 %<br />
Bio-Rad Laboratories Inc 26 892 681 0,23 %<br />
BJ Services Co 209 963 138 0,88 %<br />
BJs Restaurants Inc 8 004 220 0,40 %<br />
BJs Wholesale Club Inc 57 249 493 0,41 %<br />
Black & Decker Corp 114 772 476 0,65 %<br />
Black Box Corp 15 605 869 0,49 %<br />
Black Hills Corp 14 367 599 0,20 %<br />
Blackbaud Inc 4 885 792 0,12 %<br />
Blackboard Inc 18 603 069 0,32 %<br />
BlackRock Inc 5 729 923 0,01 %<br />
BlackRock Kelso Capital Corp 17 001 274 0,44 %<br />
Blockbuster Inc 5 290 111 0,23 %<br />
Blount International Inc 14 627 941 0,46 %<br />
Blue Coat Systems Inc 8 771 710 0,38 %<br />
Blue Nile Inc 24 073 420 0,97 %<br />
Bluegreen Corp 1 790 277 0,25 %<br />
Blyth Inc 5 169 326 0,26 %<br />
BMC S<strong>of</strong>tware Inc 237 647 284 0,67 %<br />
Bob Evans Farms Inc 18 357 121 0,42 %<br />
BOK Financial Corp 22 081 142 0,12 %<br />
Borders Group Inc 696 983 0,41 %<br />
BorgWarner Inc 187 376 422 1,06 %<br />
Boston Private Financial <strong>Holding</strong>s Inc 13 232 494 0,43 %<br />
Boston Properties Inc 215 832 975 0,46 %<br />
Boston Scientifi c Corp 451 783 984 0,56 %<br />
Bowne & Co Inc 3 993 800 0,36 %<br />
Boyd Gaming Corp 9 745 573 0,34 %<br />
BPZ Resources Inc 11 003 358 0,31 %<br />
Brady Corp 40 011 949 0,00 %<br />
Brandywine Realty Trust 19 187 556 0,40 %<br />
BRE Properties Inc 31 571 132 0,32 %<br />
Briggs & Stratton Corp 27 210 163 0,44 %<br />
Brigham Exploration Co 4 084 185 0,39 %<br />
Brightpoint Inc 6 052 322 0,24 %<br />
Brinker International Inc 32 247 990 0,43 %<br />
Brinks Co/The 33 888 936 0,39 %<br />
Brinks Home Security <strong>Holding</strong>s Inc 27 635 621 0,00 %<br />
Bristol-Myers Squibb Co 1 636 965 466 0,51 %<br />
Bristow Group Inc 36 585 511 0,67 %<br />
Broadcom Corp 329 172 443 0,62 %<br />
Broadridge Financial Solutions Inc 47 428 679 0,38 %<br />
Brocade Communications Systems Inc 38 111 870 0,52 %<br />
Bronco Drilling Co Inc 1 967 298 0,16 %<br />
Brookdale Senior Living Inc 16 618 569 0,42 %<br />
Brookfi eld Homes Corp 1 404 676 0,17 %<br />
Brookline Bancorp Inc 15 591 888 0,36 %<br />
Brooks Automation Inc 9 858 355 0,38 %<br />
Brown & Brown Inc 93 891 752 0,45 %<br />
Brown Shoe Co Inc 8 911 707 0,36 %<br />
Brown-Forman Corp 136 715 279 0,09 %<br />
Bruker Corp 5 032 465 0,11 %<br />
Brunswick Corp/DE 11 328 689 0,44 %<br />
Brush Engineered Materials Inc 6 936 070 0,38 %<br />
Buckeye Technologies Inc 2 677 401 0,27 %<br />
Buckle Inc/The 12 225 769 0,17 %<br />
Bucyrus International Inc 150 828 352 1,55 %<br />
Buffalo Wild Wings Inc 10 209 761 0,32 %<br />
Builders FirstSource Inc 529 136 0,14 %<br />
Bunge Ltd 223 757 771 0,51 %<br />
Burger King <strong>Holding</strong>s Inc 76 446 139 0,34 %<br />
Burlington Northern Santa Fe Corp 655 525 703 0,36 %<br />
CA Inc 224 839 037 0,33 %<br />
Cabelas Inc 7 099 111 0,26 %<br />
Cablevision Systems Corp 278 486 965 1,01 %<br />
Cabot Corp 31 269 940 0,45 %<br />
Cabot Microelectronics Corp 15 929 767 0,38 %<br />
Cabot Oil & Gas Corp 84 446 390 0,45 %<br />
CACI International Inc 35 543 970 0,38 %<br />
Cadence Design Systems Inc 31 358 549 0,48 %<br />
Cal Dive International Inc 7 160 283 0,15 %<br />
33<br />
GOVERNMENT PENSION FUND <strong>–</strong> GLOBAL ANNUAL REPORT 2008
<strong>Government</strong> <strong>Pension</strong> <strong>Fund</strong> <strong>–</strong> <strong>Global</strong> <strong>Holding</strong> <strong>of</strong> equities at 31 December 2008<br />
Market value<br />
Voting<br />
(per cent)<br />
Calamos Asset Management Inc 3 826 992 0,38 %<br />
Calgon Carbon Corp 25 114 312 0,43 %<br />
California Pizza Kitchen Inc 8 500 679 0,47 %<br />
California Water Service Group 16 107 451 0,24 %<br />
Callaway Golf Co 17 981 961 0,43 %<br />
Cal-Maine Foods Inc 13 681 777 0,32 %<br />
Calpine Corp 60 014 379 0,27 %<br />
Camden Property Trust 97 940 642 0,84 %<br />
Cameron International Corp 162 938 587 0,52 %<br />
Campbell Soup Co 137 328 443 0,18 %<br />
Capella Education Co 25 505 788 0,37 %<br />
Capital City <strong>Bank</strong> Group Inc 7 126 133 0,22 %<br />
Capital One Financial Corp 861 918 708 0,99 %<br />
Capital Southwest Corp 10 444 574 0,37 %<br />
Capital Trust Inc/NY 1 352 058 0,24 %<br />
CapitalSource Inc 57 429 455 0,63 %<br />
Capitol Bancorp Ltd 2 049 152 0,22 %<br />
Capitol Federal Financial 29 185 868 0,12 %<br />
Capstead Mortgage Corp 12 843 674 0,29 %<br />
CARBO Ceramics Inc 21 313 378 0,35 %<br />
Cardinal Health Inc 404 299 618 0,47 %<br />
CardioNet Inc 11 995 132 0,30 %<br />
Career Education Corp 52 638 328 0,47 %<br />
Carlisle Cos Inc 41 715 310 0,47 %<br />
Carmax Inc 109 201 065 0,90 %<br />
Carnival Corp 307 290 750 0,29 %<br />
Carpenter Technology Corp 24 499 120 0,39 %<br />
Carrizo Oil & Gas Inc 17 171 839 0,50 %<br />
Carters Inc 18 695 569 0,25 %<br />
Cascade Bancorp 4 567 988 0,34 %<br />
Cascade Corp 9 417 503 0,42 %<br />
Caseys General Stores Inc 32 938 259 0,41 %<br />
Cash America International Inc 27 948 595 0,50 %<br />
Catalyst Health Solutions Inc 26 690 930 0,36 %<br />
Caterpillar Inc 1 048 410 034 0,56 %<br />
Cathay General Bancorp 30 825 844 0,37 %<br />
Cato Corp/The 10 074 646 0,34 %<br />
Cavium Networks Inc 10 849 090 0,36 %<br />
CB Richard Ellis Group Inc 12 488 541 0,16 %<br />
Cbeyond Inc 7 520 814 0,24 %<br />
CBIZ Inc 12 860 681 0,34 %<br />
CBL & Associates Properties Inc 7 803 998 0,26 %<br />
CBS Corp 91 210 032 0,00 %<br />
CDC Corp 2 771 166 0,32 %<br />
CDI Corp 4 964 820 0,29 %<br />
CEC Entertainment Inc 17 644 693 0,46 %<br />
Cedar Shopping Centers Inc 4 909 250 0,22 %<br />
Celadon Group Inc 52 996 577 4,02 %<br />
Celanese Corp 154 852 459 1,24 %<br />
Celera Corp 60 816 321 0,97 %<br />
Celgene Corp 1 351 012 444 0,76 %<br />
Centene Corp 22 188 919 0,37 %<br />
Centennial Communications Corp 9 333 990 0,15 %<br />
Centerpoint Energy Inc 64 761 865 0,21 %<br />
Centex Corp 41 649 716 0,45 %<br />
Central European Distribution Corp 24 481 972 0,38 %<br />
Central European Media Enterprises Ltd 91 282 393 1,67 %<br />
Central Garden and Pet Co 10 418 897 0,38 %<br />
Central Pacifi c Financial Corp 6 884 796 0,34 %<br />
Central Vermont Public Service Corp 4 751 975 0,25 %<br />
Century Aluminum Co 9 906 781 0,29 %<br />
CenturyTel Inc 19 716 391 0,10 %<br />
Cenveo Inc 4 505 392 0,27 %<br />
Cephalon Inc 411 046 548 1,11 %<br />
Cepheid Inc 11 276 726 0,27 %<br />
Ceradyne Inc 15 748 629 0,42 %<br />
Cerner Corp 104 025 375 0,48 %<br />
CF Industries <strong>Holding</strong>s Inc 89 582 720 0,46 %<br />
CH Energy Group Inc 12 714 153 0,22 %<br />
CH Robinson Worldwide Inc 343 792 862 0,53 %<br />
Champion Enterprises Inc 1 215 980 0,40 %<br />
Charles River Laboratories International Inc 22 885 463 0,18 %<br />
Charles Schwab Corp/The 586 336 262 0,45 %<br />
Charlotte Russe <strong>Holding</strong> Inc 3 719 197 0,39 %<br />
Charming Shoppes Inc 7 686 956 0,40 %<br />
Chart Industries Inc 8 862 508 0,42 %<br />
Charter Communications Inc 725 311 0,31 %<br />
Chattem Inc 18 892 447 0,20 %<br />
Check Point S<strong>of</strong>tware Technologies 133 959 973 0,47 %<br />
Checkpoint Systems Inc 10 864 188 0,41 %<br />
Cheesecake Factory/The 18 788 150 0,44 %<br />
Chemed Corp 31 353 612 0,50 %<br />
Chemical Financial Corp 20 667 202 0,44 %<br />
Chemtura Corp 9 883 236 0,42 %<br />
Chesapeake Energy Corp 358 352 239 0,53 %<br />
Chevron Corp 4 658 525 186 0,44 %<br />
Chicos FAS Inc 27 328 404 0,53 %<br />
Childrens Place Retail Stores Inc/The 23 071 860 0,52 %<br />
Chimera Investment Corp 37 151 427 0,87 %<br />
China Yuchai International Ltd 3 798 638 0,38 %<br />
Chipotle Mexican Grill Inc 61 318 572 0,47 %<br />
Market value<br />
Voting<br />
(per cent)<br />
Chiquita Brands International Inc 18 047 285 0,39 %<br />
Choice Hotels International Inc 59 476 217 0,45 %<br />
Christopher & <strong>Bank</strong>s Corp 5 998 262 0,43 %<br />
Chubb Corp 445 408 258 0,35 %<br />
Church & Dwight Co Inc 85 508 022 0,31 %<br />
Churchill Downs Inc 4 045 841 0,10 %<br />
Ciber Inc 7 014 858 0,35 %<br />
Ciena Corp 16 044 424 0,38 %<br />
Cigna Corp 213 333 386 0,67 %<br />
Cimarex Energy Co 70 264 960 0,45 %<br />
Cincinnati Bell Inc 12 110 443 0,39 %<br />
Cincinnati Financial Corp 133 300 492 0,40 %<br />
Cinemark <strong>Holding</strong>s Inc 7 015 549 0,12 %<br />
Cintas Corp 74 303 833 0,30 %<br />
CIRCOR International Inc 9 997 021 0,31 %<br />
Cirrus Logic Inc 5 701 842 0,47 %<br />
Cisco Systems Inc 3 319 523 773 0,50 %<br />
CIT Group Inc 54 916 738 0,46 %<br />
Citigroup Inc 1 114 379 148 0,44 %<br />
Citizens Inc/TX 13 873 279 0,47 %<br />
Citizens Republic Bancorp Inc 19 368 415 0,74 %<br />
Citrix Systems Inc 207 264 192 0,69 %<br />
City <strong>Bank</strong>/Lynnwood WA 1 657 352 0,29 %<br />
City <strong>Holding</strong> Co 17 334 438 0,44 %<br />
City National Corp/CA 61 835 988 0,38 %<br />
CKE Restaurants Inc 11 824 343 0,36 %<br />
CKX Inc 5 952 694 0,24 %<br />
Clarcor Inc 52 617 793 0,45 %<br />
Clayton Williams Energy Inc 7 359 716 0,19 %<br />
Clean Energy Fuels Corp 1 957 390 0,09 %<br />
Clean Harbors Inc 48 907 876 0,46 %<br />
Clear Channel Outdoor <strong>Holding</strong>s Inc 60 899 747 3,47 %<br />
Clearwater Paper Corp 1 869 878 0,00 %<br />
Clearwire Corp 281 652 0,01 %<br />
Cleco Corp 23 351 409 0,24 %<br />
Cliffs Natural Resources Inc 95 301 803 0,47 %<br />
Clorox Co 218 968 515 0,41 %<br />
CME Group Inc 412 790 322 0,42 %<br />
CMS Energy Corp 238 164 921 1,49 %<br />
CNA Financial Corp 12 140 553 0,04 %<br />
CNA Surety Corp 9 603 610 0,16 %<br />
CNX Gas Corp 24 456 669 0,08 %<br />
Coach Inc 235 185 065 0,49 %<br />
CoBiz Financial Inc 3 409 614 0,21 %<br />
Coca-Cola Co/The 2 759 238 041 0,38 %<br />
Coca-Cola Enterprises Inc 157 872 214 0,38 %<br />
Cogent Communications Group Inc 99 830 549 4,90 %<br />
Cogent Inc 11 883 583 0,14 %<br />
Cognex Corp 22 110 209 0,54 %<br />
Cognizant Technology Solutions Corp 141 984 177 0,39 %<br />
Cogo Group Inc 3 651 884 0,30 %<br />
Cohen & Steers Inc 3 383 165 0,11 %<br />
Coherent Inc 15 911 718 0,44 %<br />
Cohu Inc 7 179 608 0,36 %<br />
Coinstar Inc 13 526 809 0,35 %<br />
Coldwater Creek Inc 5 971 130 0,33 %<br />
Colfax Corp 10 578 842 0,33 %<br />
Colgate-Palmolive Co 882 243 208 0,36 %<br />
Collective Brands Inc 90 733 589 1,73 %<br />
Colonial BancGroup Inc/The 10 207 050 0,35 %<br />
Colonial Properties Trust 7 855 255 0,28 %<br />
Columbia <strong>Bank</strong>ing System Inc 5 340 229 0,35 %<br />
Columbia Sportswear Co 17 887 305 0,21 %<br />
Comcast Corp 2 132 125 704 0,56 %<br />
Comerica Inc 91 327 822 0,44 %<br />
Comfort Systems USA Inc 9 930 199 0,34 %<br />
Commerce Bancshares Inc/Kansas City MO 90 848 911 0,39 %<br />
Commercial Metals Co 34 820 749 0,37 %<br />
Commercial Vehicle Group Inc 2 754 556 1,96 %<br />
CommScope Inc 32 406 687 0,42 %<br />
Community <strong>Bank</strong> System Inc 21 832 842 0,39 %<br />
Community Health Systems Inc 36 914 742 0,39 %<br />
Community Trust Bancorp Inc 16 608 668 0,43 %<br />
Commvault Systems Inc 17 033 126 0,44 %<br />
Compass Minerals International Inc 36 627 202 0,28 %<br />
Complete Production Services Inc 12 619 365 0,30 %<br />
CompuCredit Corp 4 265 960 0,23 %<br />
Computer Programs & Systems Inc 3 060 299 0,15 %<br />
Computer Sciences Corp 142 082 041 0,38 %<br />
Compuware Corp 54 669 431 0,47 %<br />
Comstock Resources Inc 69 331 771 0,46 %<br />
Comtech Telecommunications Corp 28 980 494 0,37 %<br />
Comverse Technology Inc 30 683 202 0,34 %<br />
ConAgra Foods Inc 216 505 002 0,42 %<br />
Conceptus Inc 8 044 052 0,25 %<br />
Concho Resources Inc/Midland TX 44 115 048 0,33 %<br />
Concur Technologies Inc 49 413 744 0,44 %<br />
Conexant Systems Inc 731 725 0,31 %<br />
Conmed Corp 14 657 424 0,30 %<br />
Conns Inc 4 674 043 0,35 %<br />
ConocoPhillips 2 502 108 434 0,46 %<br />
34<br />
GOVERNMENT PENSION FUND <strong>–</strong> GLOBAL ANNUAL REPORT 2008
<strong>Government</strong> <strong>Pension</strong> <strong>Fund</strong> <strong>–</strong> <strong>Global</strong> <strong>Holding</strong> <strong>of</strong> equities at 31 December 2008<br />
Market value<br />
Voting<br />
(per cent)<br />
Conseco Inc 28 695 923 0,43 %<br />
Consol Energy Inc 379 808 583 1,05 %<br />
Consolidated Edison Inc (317 495 520) 0,00 %<br />
Consolidated Graphics Inc 5 637 239 0,32 %<br />
Constellation Brands Inc 86 874 393 0,40 %<br />
Constellation Energy Group Inc 1 524 330 001 4,36 %<br />
Contango Oil & Gas Co 30 297 642 0,46 %<br />
Continental Airlines Inc 52 826 281 0,38 %<br />
Continental Resources Inc/OK 34 213 033 0,14 %<br />
Convergys Corp 20 432 163 0,37 %<br />
Con-way Inc 29 274 206 0,34 %<br />
Cooper Cos Inc/The 43 518 463 0,84 %<br />
Cooper Industries Ltd 160 014 748 0,45 %<br />
Cooper Tire & Rubber Co 8 894 486 0,35 %<br />
Copa <strong>Holding</strong>s SA 22 142 424 0,00 %<br />
Copano Energy LLC 28 823 648 0,73 %<br />
Copart Inc 58 067 494 0,37 %<br />
Core Laboratories NV 77 823 622 0,81 %<br />
Corinthian Colleges Inc 44 625 333 0,45 %<br />
Corn Products International Inc 67 727 685 0,45 %<br />
Corning Inc 650 447 932 0,63 %<br />
Corporate Executive Board Co/The 21 045 882 0,40 %<br />
Corporate Offi ce Properties Trust SBI MD 34 947 419 0,32 %<br />
Corrections Corp <strong>of</strong> America 57 880 879 0,40 %<br />
Corus <strong>Bank</strong>shares Inc 932 991 0,22 %<br />
Corvel Corp 5 857 822 0,28 %<br />
CoStar Group Inc 26 796 590 0,59 %<br />
Costco Wholesale Corp 561 489 734 0,35 %<br />
Cougar Biotechnology Inc 29 316 252 0,78 %<br />
Courier Corp 5 287 492 0,36 %<br />
Cousins Properties Inc 10 659 165 0,21 %<br />
Covance Inc 89 630 260 0,44 %<br />
Covanta <strong>Holding</strong> Corp 81 304 603 0,34 %<br />
Covenant Transportation Group Inc 6 573 365 3,99 %<br />
Coventry Health Care Inc 103 293 849 0,67 %<br />
Covidien Ltd 791 810 904 0,62 %<br />
Cox Radio Inc 4 652 739 0,49 %<br />
CR Bard Inc 178 017 419 0,30 %<br />
CRA International Inc 7 655 613 0,37 %<br />
Cracker Barrel Old Country Store Inc 14 801 546 0,46 %<br />
Crane Co 35 342 083 0,49 %<br />
Crawford & Co 9 547 607 0,36 %<br />
Credit Acceptance Corp 2 925 732 0,10 %<br />
Cree Inc 91 478 279 0,93 %<br />
CROCS Inc 778 074 0,11 %<br />
Cross Country Healthcare Inc 6 759 560 0,36 %<br />
Crosstex Energy Inc 3 981 671 0,31 %<br />
Crown Castle International Corp 395 045 214 1,11 %<br />
Crown <strong>Holding</strong>s Inc 98 529 697 0,45 %<br />
Crown Media <strong>Holding</strong>s Inc 842 182 0,06 %<br />
CSG Systems International Inc 20 565 073 0,48 %<br />
CSS Industries Inc 3 387 777 0,28 %<br />
CSX Corp 321 974 433 0,36 %<br />
CTC Media Inc 5 572 014 0,11 %<br />
CTS Corp 5 423 141 0,42 %<br />
Cubic Corp 18 437 011 0,36 %<br />
Cubist Pharmaceuticals Inc 11 164 592 0,12 %<br />
Cullen/Frost <strong>Bank</strong>ers Inc 80 933 322 0,38 %<br />
Cummins Inc 213 810 917 0,57 %<br />
Curtiss-Wright Corp 49 314 056 0,47 %<br />
CV Therapeutics Inc 18 008 648 0,46 %<br />
CVB Financial Corp 27 602 236 0,40 %<br />
CVR Energy Inc 4 047 466 0,17 %<br />
CVS/Caremark Corp 1 691 964 500 0,59 %<br />
Cyberonics Inc 7 310 838 0,23 %<br />
Cybersource Corp 21 955 119 0,38 %<br />
Cymer Inc 18 960 531 0,42 %<br />
Cypress Semiconductor Corp 20 914 657 0,46 %<br />
Cytec Industries Inc 31 120 591 0,44 %<br />
Daktronics Inc 10 638 528 0,40 %<br />
Danaher Corp 609 737 665 0,48 %<br />
Darden Restaurants Inc 149 445 994 0,55 %<br />
Darling International Inc 13 925 098 0,44 %<br />
Data Domain Inc 21 510 286 0,27 %<br />
Datascope Corp 11 473 726 0,20 %<br />
DaVita Inc 158 872 604 0,44 %<br />
Dawson Geophysical Co 3 549 671 0,37 %<br />
DCT Industrial Trust Inc 17 975 126 0,29 %<br />
DealerTrack <strong>Holding</strong>s Inc 11 498 677 0,35 %<br />
Dean Foods Co 199 194 493 1,03 %<br />
Deckers Outdoor Corp 32 570 052 0,45 %<br />
Deere & Co 920 952 600 0,81 %<br />
Deerfi eld Capital Corp 94 525 0,06 %<br />
Del Monte Foods Co 43 191 225 0,44 %<br />
Delek US <strong>Holding</strong>s Inc 1 977 958 0,10 %<br />
Dell Inc 710 591 589 0,51 %<br />
Delphi Financial Group Inc 22 128 367 0,42 %<br />
Delta Air Lines Inc 895 060 207 1,65 %<br />
Delta Petroleum Corp 10 419 757 0,30 %<br />
Deltic Timber Corp 14 291 920 0,36 %<br />
Deluxe Corp 22 703 927 0,42 %<br />
Market value<br />
Voting<br />
(per cent)<br />
Denbury Resources Inc 114 539 102 0,61 %<br />
Dendreon Corp 6 432 781 0,21 %<br />
Dentsply International Inc 94 456 704 0,32 %<br />
Developers Diversifi ed Realty Corp 11 501 432 0,28 %<br />
Devon Energy Corp 889 557 146 0,44 %<br />
DeVry Inc 192 801 507 0,67 %<br />
Diamond Offshore Drilling Inc 127 048 793 0,22 %<br />
DiamondRock Hospitality Co 13 895 557 0,43 %<br />
Diana Shipping Inc 16 402 642 0,25 %<br />
Dicks Sporting Goods Inc 282 402 641 3,33 %<br />
Diebold Inc 47 634 139 0,37 %<br />
Digital Realty Trust Inc 50 781 751 0,30 %<br />
Digital River Inc 27 639 507 0,43 %<br />
Dillards Inc 6 348 695 0,33 %<br />
Dime Community Bancshares 10 255 900 0,32 %<br />
DineEquity Inc 6 199 279 0,44 %<br />
Diodes Inc 4 227 657 0,24 %<br />
Dionex Corp 25 150 543 0,45 %<br />
DIRECTV Group Inc/The 562 308 150 0,33 %<br />
Discover Financial Services 238 480 922 0,74 %<br />
Discovery Communications Inc 218 589 237 0,90 %<br />
DISH Network Corp 151 936 658 0,94 %<br />
DivX Inc 1 782 893 0,15 %<br />
Dolan Media Co 14 304 590 1,03 %<br />
Dolby Laboratories Inc 58 556 078 0,49 %<br />
Dollar Financial Corp 6 544 461 0,38 %<br />
Dollar Tree Inc 168 017 420 0,63 %<br />
Dominion Resources Inc/VA (539 436 872) 0,00 %<br />
Dominos Pizza Inc 5 464 339 0,29 %<br />
Domtar Corp 64 952 001 1,13 %<br />
Donaldson Co Inc 82 738 197 0,46 %<br />
Douglas Emmett Inc 110 664 645 0,99 %<br />
Dover Corp 198 193 826 0,46 %<br />
Dow Chemical Co/The 455 068 411 0,47 %<br />
DPL Inc 21 115 129 0,11 %<br />
DR Horton Inc 70 729 902 0,45 %<br />
Dr Pepper Snapple Group Inc 135 073 021 0,47 %<br />
DreamWorks Animation SKG Inc 41 512 811 0,30 %<br />
Dress Barn Inc 23 763 180 0,53 %<br />
Dresser-Rand Group Inc 43 871 610 0,44 %<br />
Drew Industries Inc 5 928 902 0,33 %<br />
Dril-Quip Inc 17 640 137 0,31 %<br />
DryShips Inc 7 394 523 0,23 %<br />
DSP Group Inc 7 339 812 0,49 %<br />
DST Systems Inc 156 980 250 1,19 %<br />
DSW Inc 4 939 791 0,35 %<br />
DTE Energy Co (172 682 461) 0,00 %<br />
DTS Inc/CA 10 304 138 0,46 %<br />
Duke Energy Corp (330 152 045) 0,00 %<br />
Duke Realty Corp 90 932 953 0,80 %<br />
Dun & Bradstreet Corp 117 753 349 0,40 %<br />
Dycom Industries Inc 7 625 129 0,34 %<br />
Dynamic Materials Corp 6 343 133 0,37 %<br />
DynCorp International Inc 16 081 139 0,27 %<br />
Dynegy Inc 31 739 189 0,45 %<br />
E*Trade Financial Corp 16 145 100 0,37 %<br />
Eagle Bulk Shipping Inc 7 631 093 0,34 %<br />
Eagle Materials Inc 24 553 877 0,44 %<br />
Earthlink Inc 22 333 599 0,44 %<br />
East West Bancorp Inc 25 730 149 0,36 %<br />
EastGroup Properties Inc 22 775 896 0,36 %<br />
Eastman Chemical Co 78 283 663 0,49 %<br />
Eastman Kodak Co 63 618 405 0,51 %<br />
Eaton Corp 259 052 277 0,45 %<br />
Eaton Vance Corp 68 166 505 0,00 %<br />
eBay Inc 540 235 250 0,43 %<br />
Echelon Corp 7 396 697 0,32 %<br />
EchoStar Corp 18 195 705 0,42 %<br />
Eclipsys Corp 26 375 854 0,49 %<br />
Ecolab Inc 267 777 296 0,46 %<br />
Edison International 1 290 919 970 1,76 %<br />
Edwards Lifesciences Corp 67 230 827 0,31 %<br />
eHealth Inc 35 925 034 1,54 %<br />
EI Du Pont de Nemours & Co 731 686 715 0,46 %<br />
El Paso Corp 351 384 428 0,92 %<br />
El Paso Electric Co 13 359 293 0,24 %<br />
Electro Rent Corp 4 388 379 0,23 %<br />
Electro Scientifi c Industries Inc 5 178 901 0,40 %<br />
Electronic Arts Inc 303 099 254 0,85 %<br />
Electronics for Imaging Inc 11 775 362 0,34 %<br />
Eli Lilly & Co 2 154 015 560 0,67 %<br />
Elizabeth Arden Inc 11 211 181 0,44 %<br />
Embarq Corp 198 986 442 0,56 %<br />
EMC Corp/Massachusetts 773 719 902 0,52 %<br />
EMCOR Group Inc 44 060 643 0,43 %<br />
Emeritus Corp 7 624 776 0,28 %<br />
Emerson Electric Co 905 951 154 0,46 %<br />
Empire District Electric Co/The 8 347 579 0,20 %<br />
Employers <strong>Holding</strong>s Inc 27 428 619 0,49 %<br />
Emulex Corp 26 394 026 0,66 %<br />
Enbridge Energy Management LLC 12 009 261 0,48 %<br />
35<br />
GOVERNMENT PENSION FUND <strong>–</strong> GLOBAL ANNUAL REPORT 2008
<strong>Government</strong> <strong>Pension</strong> <strong>Fund</strong> <strong>–</strong> <strong>Global</strong> <strong>Holding</strong> <strong>of</strong> equities at 31 December 2008<br />
Market value<br />
Voting<br />
(per cent)<br />
Enbridge Energy Partners LP 8 927 678 0,08 %<br />
Encore Acquisition Co 33 720 553 0,36 %<br />
Encore Capital Group Inc 5 719 999 0,49 %<br />
Encore Wire Corp 12 665 950 0,41 %<br />
Endo Pharmaceuticals <strong>Holding</strong>s Inc 67 549 279 0,32 %<br />
Endurance Specialty <strong>Holding</strong>s Ltd 463 811 584 3,81 %<br />
Energen Corp 83 653 600 0,57 %<br />
Energizer <strong>Holding</strong>s Inc 89 079 815 0,40 %<br />
Energy Conversion Devices Inc 35 172 902 0,44 %<br />
Energy Partners Ltd 1 199 073 0,40 %<br />
EnergySolutions Inc 17 481 716 0,50 %<br />
EnerNOC Inc 1 678 521 0,16 %<br />
EnerSys 15 699 387 0,42 %<br />
Ennis Inc 7 453 942 0,34 %<br />
EnPro Industries Inc 12 256 511 0,40 %<br />
ENSCO International Inc 115 425 006 0,41 %<br />
Enstar Group Ltd 16 744 717 0,30 %<br />
Entegris Inc 8 320 829 0,48 %<br />
Entergy Corp 699 011 394 0,63 %<br />
Entertainment Properties Trust 19 317 356 0,28 %<br />
Enzo Biochem Inc 1 292 296 0,10 %<br />
Enzon Pharmaceuticals Inc 2 926 016 0,16 %<br />
EOG Resources Inc 753 959 325 0,65 %<br />
Epicor S<strong>of</strong>tware Corp 8 545 296 0,42 %<br />
EPIQ Systems Inc 19 547 105 0,47 %<br />
Equifax Inc 147 668 557 0,63 %<br />
Equinix Inc 68 291 655 0,49 %<br />
Equitable Resources Inc 223 750 222 0,73 %<br />
Equity Lifestyle Properties Inc 18 874 024 0,28 %<br />
Equity One Inc 16 933 783 0,18 %<br />
Equity Residential 269 321 139 0,47 %<br />
eResearchTechnology Inc 8 545 437 0,36 %<br />
Erie Indemnity Co 25 604 019 0,00 %<br />
ESCO Technologies Inc 34 402 298 0,46 %<br />
Essex Property Trust Inc 44 730 344 0,31 %<br />
Estee Lauder Cos Inc/The 286 221 257 1,12 %<br />
Esterline Technologies Corp 38 140 108 0,48 %<br />
Ethan Allen Interiors Inc 12 397 412 0,43 %<br />
Euronet Worldwide Inc 16 146 934 0,39 %<br />
ev3 Inc 10 353 927 0,23 %<br />
Everest Re Group Ltd 521 574 490 1,59 %<br />
Evergreen Solar Inc 16 382 092 0,44 %<br />
EW Scripps Co 1 578 584 0,00 %<br />
Exar Corp 8 305 934 0,41 %<br />
Excel Maritime Carriers Ltd 5 319 647 0,24 %<br />
EXCO Resources Inc 42 256 799 0,32 %<br />
Exelixis Inc 30 838 484 0,83 %<br />
Exelon Corp 914 998 580 0,36 %<br />
Exide Technologies 9 326 951 0,33 %<br />
ExlService <strong>Holding</strong>s Inc 6 280 077 0,36 %<br />
Expedia Inc 197 934 929 1,31 %<br />
Expeditors International <strong>of</strong> Washington Inc 522 032 544 1,06 %<br />
Express Scripts Inc 455 230 014 0,48 %<br />
Exterran <strong>Holding</strong>s Inc 45 692 129 0,47 %<br />
Extra Space Storage Inc 16 424 211 0,27 %<br />
Extreme Networks 2 034 957 0,14 %<br />
Exxon Mobil Corp 12 216 867 795 0,43 %<br />
Ezcorp Inc 18 263 272 0,00 %<br />
F5 Networks Inc 50 407 816 0,40 %<br />
Facet Biotech Corp 2 940 975 0,18 %<br />
Factset Research Systems Inc 46 050 530 0,32 %<br />
Fair Isaac Corp 28 444 270 0,50 %<br />
Fairchild Semiconductor International Inc 14 665 347 0,35 %<br />
Fairpoint Communications Inc 7 848 980 0,38 %<br />
FalconStor S<strong>of</strong>tware Inc 2 904 926 0,29 %<br />
Family Dollar Stores Inc (104 164 596) 0,00 %<br />
Farmer Bros Co 4 402 133 0,16 %<br />
FARO Technologies Inc 7 585 650 0,38 %<br />
Fastenal Co 16 163 608 0,04 %<br />
FBL Financial Group Inc 6 281 289 0,20 %<br />
FBR Capital Markets Corp 42 561 919 2,04 %<br />
FCStone Group Inc 1 189 311 0,14 %<br />
Federal Mogul Corp 3 905 220 0,00 %<br />
Federal Realty Investment Trust 76 930 632 0,30 %<br />
Federal Signal Corp 13 173 431 0,48 %<br />
Federated Investors Inc 36 355 013 0,00 %<br />
FedEx Corp 915 399 370 0,65 %<br />
FEI Co 24 162 550 0,49 %<br />
FelCor Lodging Trust Inc 2 422 914 0,30 %<br />
Ferro Corp 9 296 281 0,43 %<br />
FiberTower Corp 529 860 0,31 %<br />
Fidelity National Financial Inc 228 674 044 0,87 %<br />
Fidelity National Information Services Inc 83 030 895 0,38 %<br />
Fifth Third Bancorp 142 255 637 0,43 %<br />
Financial Federal Corp 18 989 384 0,45 %<br />
Finisar Corp 4 224 057 0,34 %<br />
Finish Line/The 7 675 075 0,39 %<br />
First American Corp 88 574 183 0,47 %<br />
First Bancorp/Puerto Rico 28 812 348 0,40 %<br />
First Bancorp/Troy NC 6 365 964 0,30 %<br />
First Busey Corp 14 665 893 0,32 %<br />
Market value<br />
Voting<br />
(per cent)<br />
First Cash Financial Services Inc 17 072 340 0,44 %<br />
First Citizens BancShares Inc/NC 25 827 890 0,28 %<br />
First Commonwealth Financial Corp 26 692 699 0,37 %<br />
First Community Bancshares Inc/VA 8 776 936 0,33 %<br />
First Financial Bancorp 8 072 301 0,25 %<br />
First Financial <strong>Bank</strong>shares Inc 32 760 066 0,41 %<br />
First Financial Corp/IN 8 254 008 0,22 %<br />
First Financial <strong>Holding</strong>s Inc 5 492 172 0,33 %<br />
First Horizon National Corp 53 868 371 0,35 %<br />
First Industrial Realty Trust Inc 6 573 076 0,28 %<br />
First Marblehead Corp/The 1 433 355 0,16 %<br />
First Merchants Corp 9 246 397 0,33 %<br />
First Midwest Bancorp Inc/IL 25 957 422 0,38 %<br />
First Niagara Financial Group Inc 52 188 205 0,39 %<br />
First Solar Inc 196 057 468 0,25 %<br />
FirstEnergy Corp 74 193 758 0,07 %<br />
FirstMerit Corp 46 457 952 0,40 %<br />
Fiserv Inc 172 532 396 0,42 %<br />
Fisher Communications Inc 3 323 748 0,26 %<br />
Flagstar Bancorp Inc 989 212 0,24 %<br />
Flextronics International Ltd 67 271 946 0,46 %<br />
Flir Systems Inc 135 670 434 0,45 %<br />
Flotek Industries Inc 1 478 799 0,37 %<br />
Flowers Foods Inc 122 624 286 0,78 %<br />
Flowserve Corp 94 183 997 0,46 %<br />
Fluor Corp 254 718 264 0,45 %<br />
Flushing Financial Corp 6 490 749 0,36 %<br />
FMC Corp 108 357 912 0,47 %<br />
FMC Technologies Inc 111 492 877 0,53 %<br />
FNB Corp/PA 33 752 847 0,42 %<br />
Foot Locker Inc 31 141 304 0,39 %<br />
Ford Motor Co 117 422 586 0,32 %<br />
Forest City Enterprises Inc 40 257 855 0,28 %<br />
Forest Laboratories Inc 429 376 569 0,80 %<br />
Forest Oil Corp 69 780 125 0,62 %<br />
Forestar Group Inc 5 528 313 0,23 %<br />
Formfactor Inc 20 869 469 0,42 %<br />
Forrester Research Inc 11 573 041 0,25 %<br />
Fortune Brands Inc 196 909 010 0,45 %<br />
Forward Air Corp 18 301 962 0,37 %<br />
Fossil Inc 16 740 425 0,21 %<br />
Foster Wheeler Ltd 129 897 439 0,59 %<br />
Foundation Coal <strong>Holding</strong>s Inc 17 023 367 0,39 %<br />
FPL Group Inc 746 179 614 0,52 %<br />
Franklin Electric Co Inc 15 306 213 0,34 %<br />
Franklin Resources Inc 402 633 910 0,39 %<br />
Franklin Street Properties Corp 20 745 740 0,28 %<br />
Freds Inc 10 737 601 0,36 %<br />
FreightCar America Inc 6 374 287 0,42 %<br />
Fresh Del Monte Produce Inc 33 214 385 0,33 %<br />
Frontier Communications Corp 8 004 255 0,04 %<br />
Frontier Financial Corp 4 804 862 0,33 %<br />
Frontier Oil Corp 32 834 978 0,36 %<br />
Frozen Food Express Industries 26 479 951 3,97 %<br />
FTI Consulting Inc 61 847 760 0,39 %<br />
Fuel Systems Solutions Inc 7 551 479 0,21 %<br />
FuelCell Energy Inc 7 178 585 0,38 %<br />
Fulton Financial Corp 44 992 237 0,38 %<br />
Furniture Brands International Inc 3 538 694 0,47 %<br />
G&K Services Inc 11 004 072 0,41 %<br />
GAMCO Investors Inc 5 259 530 0,37 %<br />
GameStop Corp 38 847 901 0,16 %<br />
Gannett Co Inc (20 870 011) 0,00 %<br />
Gap Inc/The 505 472 990 0,76 %<br />
Gardner Denver Inc 39 171 320 0,46 %<br />
Garmin Ltd 94 670 855 0,35 %<br />
Gartner Inc 21 690 620 0,18 %<br />
Gasco Energy Inc 2 080 065 0,71 %<br />
GATX Corp 43 009 293 0,41 %<br />
Gaylord Entertainment Co 13 612 250 0,44 %<br />
Genco Shipping & Trading Ltd 10 497 828 0,32 %<br />
Genentech Inc 1 853 872 990 0,30 %<br />
General Cable Corp 27 533 933 0,42 %<br />
General Communication Inc 9 466 222 0,33 %<br />
General Electric Co 5 836 186 568 0,49 %<br />
General Growth Properties Inc 12 802 058 0,53 %<br />
General Maritime Corp 12 261 613 0,28 %<br />
General Mills Inc 480 921 252 0,34 %<br />
General Motors Corp 52 842 126 0,39 %<br />
Genesco Inc 8 108 228 0,36 %<br />
Genesee & Wyoming Inc 26 645 959 0,39 %<br />
Genomic Health Inc 4 349 279 0,11 %<br />
Genoptix Inc 8 306 765 0,21 %<br />
Gen-Probe Inc 28 155 481 0,17 %<br />
Gentex Corp 33 639 117 0,39 %<br />
Gentiva Health Services Inc 21 078 613 0,36 %<br />
Genuine Parts Co 183 512 482 0,43 %<br />
Genworth Financial Inc 38 050 930 0,44 %<br />
Genzyme Corp 1 053 268 702 0,84 %<br />
Geo Group Inc/The 25 032 426 0,39 %<br />
Geovic Mining Corp 8 567 859 2,94 %<br />
36<br />
GOVERNMENT PENSION FUND <strong>–</strong> GLOBAL ANNUAL REPORT 2008
<strong>Government</strong> <strong>Pension</strong> <strong>Fund</strong> <strong>–</strong> <strong>Global</strong> <strong>Holding</strong> <strong>of</strong> equities at 31 December 2008<br />
Market value<br />
Voting<br />
(per cent)<br />
Geron Corp 4 567 149 0,18 %<br />
Getty Realty Corp 7 304 493 0,20 %<br />
GFI Group Inc 5 552 261 0,19 %<br />
Gibraltar Industries Inc 8 163 785 0,33 %<br />
GigaMedia Ltd 5 702 524 0,27 %<br />
Gilead Sciences Inc 1 942 127 087 0,60 %<br />
Glacier Bancorp Inc 30 633 651 0,38 %<br />
Glatfelter 13 276 765 0,45 %<br />
Glimcher Realty Trust 1 877 770 0,25 %<br />
<strong>Global</strong> Cash Access <strong>Holding</strong>s Inc 3 647 462 0,28 %<br />
<strong>Global</strong> Crossing Ltd 3 573 087 0,11 %<br />
<strong>Global</strong> Industries Ltd 8 013 440 0,29 %<br />
<strong>Global</strong> Payments Inc 71 370 117 0,39 %<br />
<strong>Global</strong> Traffi c Network Inc 19 452 450 2,62 %<br />
GMX Resources Inc 14 453 117 0,43 %<br />
Gold Reserve Inc 8 110 308 2,23 %<br />
Goldman Sachs Group Inc/The 1 658 095 111 0,64 %<br />
Goodrich Corp 145 321 354 0,46 %<br />
Goodrich Petroleum Corp 25 070 547 0,32 %<br />
Goodyear Tire & Rubber Co/The 107 673 554 1,07 %<br />
Google Inc 2 871 836 325 0,56 %<br />
Gorman-Rupp Co/The 16 569 741 0,46 %<br />
Graco Inc 47 206 175 0,48 %<br />
GrafTech International Ltd 33 331 838 0,48 %<br />
Granite Construction Inc 55 122 016 0,47 %<br />
Graphic Packaging <strong>Holding</strong> Co 3 282 376 0,12 %<br />
Great Atlantic & Pacifi c Tea Co 4 714 893 0,19 %<br />
Great Plains Energy Inc 55 324 284 0,34 %<br />
Greatbatch Inc 27 062 276 0,64 %<br />
Green Mountain C<strong>of</strong>fee Roasters Inc 21 551 140 0,32 %<br />
Greenbrier Cos Inc 3 326 614 0,42 %<br />
Greenhill & Co Inc 41 583 251 0,32 %<br />
Greif Inc 23 982 687 0,00 %<br />
Griffon Corp 13 749 005 0,36 %<br />
Group 1 Automotive Inc 6 647 924 0,38 %<br />
GSI Commerce Inc 10 638 132 0,30 %<br />
GT Solar International Inc 3 942 270 0,00 %<br />
GTx Inc 1 510 496 0,04 %<br />
Guaranty Bancorp 2 136 201 0,29 %<br />
Guess ? Inc 39 633 537 0,39 %<br />
Gulf Island Fabrication Inc 6 139 680 0,43 %<br />
Gulfmark Offshore Inc 19 027 762 0,45 %<br />
Gulfport Energy Corp 3 568 694 0,30 %<br />
Gymboree Corp 38 422 813 0,72 %<br />
H&E Equipment Services Inc 2 879 084 0,15 %<br />
H&R Block Inc 243 434 903 0,45 %<br />
Haemonetics Corp 29 949 519 0,30 %<br />
Hain Celestial Group Inc 22 340 817 0,41 %<br />
Halliburton Co 546 076 086 0,48 %<br />
Halozyme Therapeutics Inc 4 051 986 0,13 %<br />
Hancock <strong>Holding</strong> Co 39 750 280 0,39 %<br />
Hanesbrands Inc 37 223 059 0,45 %<br />
Hanger Orthopedic Group Inc 6 861 181 0,22 %<br />
Hanmi Financial Corp 1 438 336 0,22 %<br />
Hanover Insurance Group Inc/The 72 624 967 0,47 %<br />
Hansen Medical Inc 1 893 392 0,15 %<br />
Hansen Natural Corp 22 883 577 0,11 %<br />
Harley-Davidson Inc 108 281 288 0,39 %<br />
Harleysville Group Inc 32 769 387 0,48 %<br />
Harleysville National Corp 16 524 359 0,52 %<br />
Harman International Industries Inc 30 690 853 0,45 %<br />
Harmonic Inc 13 710 324 0,37 %<br />
Harris Corp 132 797 190 0,37 %<br />
Harsco Corp 72 150 543 0,45 %<br />
Harte-Hanks Inc 6 882 800 0,25 %<br />
Hartford Financial Services Group Inc 156 063 258 0,45 %<br />
Harvest Natural Resources Inc 4 374 842 0,44 %<br />
Hasbro Inc 132 807 844 0,47 %<br />
Hatteras Financial Corp 14 450 102 0,21 %<br />
Hawaiian Electric Industries Inc 20 326 919 0,15 %<br />
Haynes International Inc 5 942 687 0,29 %<br />
HB Fuller Co 26 592 714 0,49 %<br />
HCC Insurance <strong>Holding</strong>s Inc 100 292 529 0,47 %<br />
HCP Inc 145 749 319 0,30 %<br />
Headwaters Inc 9 203 895 0,46 %<br />
Health Care REIT Inc 95 947 519 0,31 %<br />
Health Management Associates Inc 10 309 343 0,34 %<br />
Health Net Inc 28 782 942 0,36 %<br />
Healthcare Realty Trust Inc 30 533 932 0,32 %<br />
Healthcare Services Group 18 986 146 0,40 %<br />
Healthsouth Corp 49 394 414 0,73 %<br />
Healthspring Inc 23 593 983 0,29 %<br />
Healthways Inc 9 423 107 0,35 %<br />
Hearst-Argyle Television Inc 2 543 630 0,11 %<br />
Heartland Express Inc 31 096 289 0,29 %<br />
Heartland Payment Systems Inc 6 780 939 0,15 %<br />
Heckmann Corp 22 779 722 0,00 %<br />
Hecla Mining Co 11 027 190 0,33 %<br />
HEICO Corp 21 241 021 0,33 %<br />
Heidrick & Struggles International Inc 8 592 815 0,35 %<br />
Helen <strong>of</strong> Troy Ltd 10 540 525 0,29 %<br />
Market value<br />
Voting<br />
(per cent)<br />
Helix Energy Solutions Group Inc 22 282 469 0,48 %<br />
Helmerich & Payne Inc 117 858 689 0,70 %<br />
Henry Schein Inc 68 548 710 0,30 %<br />
Herbalife Ltd 23 917 113 0,25 %<br />
Hercules Offshore Inc 11 686 192 0,40 %<br />
Herman Miller Inc 21 919 776 0,45 %<br />
Hershey Co/The 143 311 262 0,35 %<br />
Hertz <strong>Global</strong> <strong>Holding</strong>s Inc 50 192 874 0,44 %<br />
Hess Corp 550 014 863 0,45 %<br />
Hewitt Associates Inc 76 802 541 0,41 %<br />
Hewlett-Packard Co 3 193 561 604 0,52 %<br />
Hexcel Corp 21 205 624 0,43 %<br />
Hibbett Sports Inc 12 917 431 0,41 %<br />
Highwoods Properties Inc 37 501 095 0,31 %<br />
Hill International Inc 6 782 124 0,34 %<br />
Hillenbrand Inc 34 356 776 0,48 %<br />
Hill-Rom <strong>Holding</strong>s Inc 46 674 987 0,65 %<br />
Hilltop <strong>Holding</strong>s Inc 10 784 811 0,28 %<br />
Hittite Microwave Corp 8 976 562 0,14 %<br />
HJ Heinz Co 362 287 119 0,44 %<br />
HLTH Corp 28 282 751 0,38 %<br />
HMS <strong>Holding</strong>s Corp 20 358 601 0,37 %<br />
HNI Corp 21 882 743 0,45 %<br />
Holly Corp 20 443 255 0,32 %<br />
Hologic Inc 72 407 689 0,31 %<br />
Home Bancshares Inc/Conway AR 10 500 578 0,28 %<br />
Home Depot Inc 1 725 577 295 0,63 %<br />
Home Properties Inc 26 170 448 0,29 %<br />
Horace Mann Educators Corp 10 048 014 0,40 %<br />
Horizon Lines Inc 1 395 811 0,19 %<br />
Hormel Foods Corp 108 674 442 0,37 %<br />
Hornbeck Offshore Services Inc 13 221 718 0,45 %<br />
Hospira Inc 130 398 818 0,44 %<br />
Hospitality Properties Trust 27 995 178 0,29 %<br />
Host Hotels & Resorts Inc 251 381 103 0,91 %<br />
HOT Topic Inc 9 876 430 0,35 %<br />
Hovnanian Enterprises Inc 2 285 878 0,31 %<br />
HRPT Properties Trust 13 750 725 0,26 %<br />
HSN Inc 10 628 511 0,37 %<br />
HUB Group Inc 115 212 267 1,68 %<br />
Hubbell Inc 51 895 816 0,12 %<br />
Hudson City Bancorp Inc 222 786 669 0,38 %<br />
Hughes Communications Inc 4 186 733 0,17 %<br />
Human Genome Sciences Inc 33 197 375 1,65 %<br />
Humana Inc 518 909 398 1,18 %<br />
Huntington Bancshares Inc/OH 76 645 538 0,39 %<br />
Huntsman Corp 18 806 486 0,33 %<br />
Huron Consulting Group Inc 32 929 760 0,39 %<br />
Hutchinson Technology Inc 1 962 348 0,35 %<br />
IAC/InterActiveCorp 62 139 725 0,40 %<br />
Iberiabank Corp 15 471 728 0,30 %<br />
Iconix Brand Group Inc 17 410 834 0,44 %<br />
ICU Medical Inc 5 807 273 0,17 %<br />
Idacorp Inc 92 634 073 0,99 %<br />
IDEX Corp 46 580 483 0,33 %<br />
Idexx Laboratories Inc 48 035 912 0,32 %<br />
IHS Inc 37 468 919 0,30 %<br />
II-VI Inc 17 116 589 0,43 %<br />
Illinois Tool Works Inc 390 202 671 0,31 %<br />
Illumina Inc 67 061 090 0,30 %<br />
Imation Corp 14 938 428 0,42 %<br />
Immucor Inc 41 259 085 0,31 %<br />
IMS Health Inc 75 004 870 0,39 %<br />
Incyte Corp Ltd 31 390 319 1,22 %<br />
Independent <strong>Bank</strong> Corp/Rockland MA 13 010 916 0,44 %<br />
Infi nera Corp 21 361 187 0,36 %<br />
Infi nity Property & Casualty Corp 23 558 004 0,50 %<br />
infoGROUP Inc 4 782 241 0,25 %<br />
Informatica Corp 41 232 600 0,49 %<br />
Infospace Inc 6 858 129 0,38 %<br />
Ingersoll-Rand Co Ltd 176 163 592 0,45 %<br />
Ingram Micro Inc 92 694 902 0,60 %<br />
Inland Real Estate Corp 16 863 949 0,28 %<br />
Innerworkings Inc 5 325 332 0,24 %<br />
Innophos <strong>Holding</strong>s Inc 10 871 522 0,37 %<br />
Innospec Inc 3 820 611 0,39 %<br />
Insight Enterprises Inc 8 604 811 0,39 %<br />
Insituform Technologies Inc 15 785 442 0,41 %<br />
Inspire Pharmaceuticals Inc 3 668 986 0,26 %<br />
Insulet Corp 2 563 994 0,17 %<br />
Integra LifeSciences <strong>Holding</strong>s Corp 14 954 841 0,22 %<br />
Integrated Device Technology Inc 24 195 731 0,36 %<br />
Integrys Energy Group Inc 127 805 148 0,56 %<br />
Intel Corp 2 746 051 210 0,48 %<br />
Interactive Brokers Group Inc 22 666 415 0,45 %<br />
Interactive Data Corp 28 438 352 0,18 %<br />
IntercontinentalExchange Inc 131 341 249 0,31 %<br />
InterDigital Inc/PA 30 870 088 0,37 %<br />
Interface Inc 8 999 757 0,49 %<br />
Interline Brands Inc 7 035 269 0,29 %<br />
Intermec Inc 15 254 105 0,27 %<br />
37<br />
GOVERNMENT PENSION FUND <strong>–</strong> GLOBAL ANNUAL REPORT 2008
<strong>Government</strong> <strong>Pension</strong> <strong>Fund</strong> <strong>–</strong> <strong>Global</strong> <strong>Holding</strong> <strong>of</strong> equities at 31 December 2008<br />
Market value<br />
Voting<br />
(per cent)<br />
InterMune Inc 15 566 896 0,53 %<br />
International Bancshares Corp 31 923 331 0,30 %<br />
International Business Machines Corp 3 121 478 292 0,39 %<br />
International Coal Group Inc 9 513 993 0,39 %<br />
International Flavors & Fragrances Inc 75 577 385 0,46 %<br />
International Game Technology 162 101 005 0,66 %<br />
International Paper Co 164 433 145 0,47 %<br />
International Rectifi er Corp 25 217 044 0,37 %<br />
International Speedway Corp 28 391 974 0,52 %<br />
Interpublic Group <strong>of</strong> Cos Inc 53 132 112 0,40 %<br />
Intersil Corp 38 496 904 0,49 %<br />
Interval Leisure Group Inc 30 815 410 1,45 %<br />
Interwoven Inc 17 729 195 0,44 %<br />
Intrepid Potash Inc 19 662 043 0,18 %<br />
Intuit Inc 368 994 599 0,69 %<br />
Intuitive Surgical Inc 151 679 170 0,44 %<br />
Invacare Corp 10 360 302 0,31 %<br />
inVentiv Health Inc 9 898 438 0,37 %<br />
Inverness Medical Innovations Inc 33 447 620 0,32 %<br />
Invesco Ltd 325 600 723 0,84 %<br />
Investment Technology Group Inc 30 976 446 0,45 %<br />
Investors Bancorp Inc 21 132 735 0,21 %<br />
Investors Real Estate Trust 14 701 828 0,33 %<br />
ION Geophysical Corp 10 339 982 0,43 %<br />
Iowa Telecommunications Services Inc 11 063 792 0,35 %<br />
IPC <strong>Holding</strong>s Ltd 47 437 212 0,48 %<br />
iPCS Inc 2 653 565 0,32 %<br />
IPG Photonics Corp 5 530 524 0,13 %<br />
Iron Mountain Inc 134 605 524 0,39 %<br />
iShares MSCI EAFE Index <strong>Fund</strong> 7 256 847 0,00 %<br />
iShares MSCI Japan Index <strong>Fund</strong> 5 130 271 0,01 %<br />
Isis Pharmaceuticals Inc 17 437 668 0,18 %<br />
Isle <strong>of</strong> Capri Casinos Inc 1 191 410 0,17 %<br />
iStar Financial Inc 5 528 519 0,27 %<br />
ITC <strong>Holding</strong>s Corp 190 146 490 1,25 %<br />
Itron Inc 71 130 824 0,46 %<br />
ITT Corp 264 819 201 0,45 %<br />
ITT Educational Services Inc 305 037 501 1,19 %<br />
Ixia 4 544 414 0,18 %<br />
J Crew Group Inc 14 402 503 0,27 %<br />
J&J Snack Foods Corp 12 995 400 0,28 %<br />
j2 <strong>Global</strong> Communications Inc 27 895 890 0,45 %<br />
Jabil Circuit Inc 43 712 036 0,44 %<br />
Jack Henry & Associates Inc 47 475 532 0,41 %<br />
Jack in the Box Inc 38 920 137 0,44 %<br />
Jackson Hewitt Tax Service Inc 13 883 051 0,44 %<br />
Jacobs Engineering Group Inc 186 022 607 0,45 %<br />
Jakks Pacifi c Inc 17 837 819 0,45 %<br />
James River Coal Co 14 217 473 0,48 %<br />
Janus Capital Group Inc 36 092 136 0,41 %<br />
Jarden Corp 30 010 948 0,49 %<br />
JB Hunt Transport Services Inc 135 959 759 0,59 %<br />
JC Penney Co Inc 64 949 004 0,21 %<br />
JDA S<strong>of</strong>tware Group Inc 12 435 752 0,44 %<br />
JDS Uniphase Corp 19 396 683 0,35 %<br />
Jefferies Group Inc 50 661 240 0,31 %<br />
JetBlue Airways Corp 70 966 493 0,53 %<br />
JM Smucker Co/The 149 438 576 0,42 %<br />
Jo-Ann Stores Inc 8 641 427 0,31 %<br />
John Bean Technologies Corp 6 508 916 0,41 %<br />
John Wiley & Sons Inc 50 325 462 0,41 %<br />
Johnson & Johnson 4 226 056 030 0,36 %<br />
Johnson Controls Inc 93 462 502 0,12 %<br />
Jones Apparel Group Inc 15 630 067 0,46 %<br />
Jones Lang LaSalle Inc 19 328 707 0,29 %<br />
JOS A <strong>Bank</strong> Clothiers Inc 11 493 679 0,34 %<br />
Journal Communications Inc 2 946 225 0,43 %<br />
Joy <strong>Global</strong> Inc 206 705 978 1,26 %<br />
JPMorgan Chase & Co 3 663 457 155 0,44 %<br />
Juniper Networks Inc 641 129 687 0,99 %<br />
Kaiser Aluminum Corp 8 160 475 0,26 %<br />
Kaman Corp 14 306 413 0,44 %<br />
Kansas City Life Insurance Co 3 788 192 0,11 %<br />
Kansas City Southern 44 941 094 0,37 %<br />
Kaydon Corp 36 645 712 0,44 %<br />
KB Home 38 175 575 0,45 %<br />
KBR Inc 83 966 909 0,49 %<br />
KBW Inc 8 649 904 0,16 %<br />
Kearny Financial Corp 5 568 787 0,09 %<br />
Kellogg Co 456 107 640 0,39 %<br />
Kelly Services Inc 9 878 320 0,00 %<br />
Kendle International Inc 8 731 678 0,33 %<br />
Kenexa Corp 6 864 516 0,54 %<br />
Kennametal Inc 51 475 335 0,45 %<br />
Keryx Biopharmaceuticals Inc 39 293 0,05 %<br />
Key Energy Services Inc 17 355 009 0,46 %<br />
Keycorp 121 804 652 0,41 %<br />
KHD Humboldt Wedag International Ltd 6 794 090 0,28 %<br />
Kilroy Realty Corp 21 524 481 0,28 %<br />
Kimball International Inc 5 285 999 0,00 %<br />
Kimberly-Clark Corp 661 394 940 0,43 %<br />
Market value<br />
Voting<br />
(per cent)<br />
Kimco Realty Corp 354 668 045 1,04 %<br />
Kinder Morgan Management LLC 98 248 012 0,46 %<br />
Kindred Healthcare Inc 10 128 509 0,29 %<br />
Kinetic Concepts Inc 43 581 783 0,45 %<br />
King Pharmaceuticals Inc 54 408 517 0,30 %<br />
Kirby Corp 94 574 893 0,92 %<br />
Kla-Tencor Corp 95 929 872 0,37 %<br />
Knight Capital Group Inc 41 113 014 0,41 %<br />
Knight Transportation Inc 24 164 711 0,25 %<br />
Knightsbridge Tankers Ltd 5 540 900 0,32 %<br />
Knoll Inc 12 917 898 0,43 %<br />
Knology Inc 4 116 964 0,32 %<br />
Knot Inc/The 37 784 340 2,01 %<br />
Kohls Corp 589 339 351 0,76 %<br />
Kopin Corp 3 015 698 0,31 %<br />
Koppers <strong>Holding</strong>s Inc 13 821 033 0,45 %<br />
Korn/Ferry International 16 389 898 0,46 %<br />
Kraft Foods Inc 1 048 594 896 0,38 %<br />
Kroger Co/The 560 727 469 0,46 %<br />
K-Swiss Inc 8 996 078 0,42 %<br />
KV Pharmaceutical Co 2 390 766 0,04 %<br />
L-1 Identity Solutions Inc 16 026 616 0,39 %<br />
Laboratory Corp <strong>of</strong> America <strong>Holding</strong>s 201 838 835 0,41 %<br />
LaBranche & Co Inc 7 514 717 0,37 %<br />
Laclede Group Inc/The 13 555 018 0,19 %<br />
Ladish Co Inc 5 431 702 0,35 %<br />
Lakeland Bancorp Inc 6 067 965 0,33 %<br />
Lam Research Corp 132 263 862 0,71 %<br />
Lamar Advertising Co 102 826 463 1,53 %<br />
Lancaster Colony Corp 24 062 355 0,36 %<br />
Lance Inc 21 508 916 0,42 %<br />
LandAmerica Financial Group Inc 1 188 0,01 %<br />
Landauer Inc 22 017 567 0,46 %<br />
Landrys Restaurants Inc 3 174 004 0,24 %<br />
Landstar System Inc 52 785 370 0,37 %<br />
Las Vegas Sands Corp 58 434 963 0,26 %<br />
LaSalle Hotel Properties 7 756 277 0,24 %<br />
Lattice Semiconductor Corp 4 655 378 0,38 %<br />
Lawson Products 3 565 235 0,26 %<br />
Lawson S<strong>of</strong>tware Inc 18 130 909 0,34 %<br />
Layne Christensen Co 10 023 340 0,31 %<br />
Lazard Ltd 61 187 880 0,39 %<br />
La-Z-Boy Inc 3 419 824 0,44 %<br />
Leap Wireless International Inc 247 372 834 1,89 %<br />
Leapfrog Enterprises Inc 3 846 870 0,43 %<br />
Lear Corp 2 571 788 0,34 %<br />
LECG Corp 4 166 408 0,35 %<br />
Legg Mason Inc 86 297 273 0,40 %<br />
Leggett & Platt Inc 77 650 993 0,47 %<br />
Lender Processing Services Inc 76 712 456 0,39 %<br />
Lennar Corp 34 996 162 0,16 %<br />
Lennox International Inc 54 765 185 0,44 %<br />
Leucadia National Corp 97 517 021 0,30 %<br />
Level 3 Communications Inc (4 265 176) 0,00 %<br />
Lexicon Pharmaceuticals Inc 1 640 973 0,12 %<br />
Lexington Realty Trust 11 411 567 0,35 %<br />
Lexmark International Inc 54 081 292 0,37 %<br />
LHC Group Inc 12 626 467 0,28 %<br />
Liberty <strong>Global</strong> Inc 142 570 560 0,37 %<br />
Liberty Media Corp - Capital 13 339 640 0,44 %<br />
Liberty Media Corp - Entertainment 302 548 016 0,50 %<br />
Liberty Media Corp - Interactive 48 402 390 0,39 %<br />
Liberty Property Trust 88 497 997 0,56 %<br />
Life Technologies Corp 98 908 562 0,35 %<br />
Life Time Fitness Inc 8 067 550 0,22 %<br />
LifePoint Hospitals Inc 34 121 431 0,40 %<br />
Ligand Pharmaceuticals Inc 2 672 077 0,15 %<br />
Lincare <strong>Holding</strong>s Inc 53 136 169 0,38 %<br />
Lincoln Electric <strong>Holding</strong>s Inc 71 425 740 0,47 %<br />
Lincoln National Corp 156 476 391 0,46 %<br />
Lindsay Corp 11 536 522 0,42 %<br />
Linear Technology Corp 207 051 125 0,60 %<br />
Linn Energy LLC 55 034 818 0,46 %<br />
Littelfuse Inc 10 422 199 0,41 %<br />
Live Nation Inc 13 216 353 0,42 %<br />
Liz Claiborne Inc 5 033 864 0,29 %<br />
LKQ Corp 41 336 113 0,36 %<br />
Loews Corp 396 497 715 0,46 %<br />
Loral Space & Communications Inc 6 883 865 0,33 %<br />
Lorillard Inc 292 038 569 0,44 %<br />
Louisiana-Pacifi c Corp 4 748 283 0,42 %<br />
Lowes Cos Inc 931 547 912 0,42 %<br />
LSI Corp 53 154 005 0,36 %<br />
LTC Properties Inc 12 118 785 0,37 %<br />
Ltd Brands Inc 122 736 835 0,54 %<br />
Lubrizol Corp 79 976 600 0,47 %<br />
Lufkin Industries Inc 17 717 648 0,49 %<br />
Lululemon Athletica Inc 17 324 094 0,62 %<br />
Luminex Corp 26 383 689 0,43 %<br />
M&F Worldwide Corp 6 192 471 0,30 %<br />
M&T <strong>Bank</strong> Corp 169 576 904 0,38 %<br />
38<br />
GOVERNMENT PENSION FUND <strong>–</strong> GLOBAL ANNUAL REPORT 2008
<strong>Government</strong> <strong>Pension</strong> <strong>Fund</strong> <strong>–</strong> <strong>Global</strong> <strong>Holding</strong> <strong>of</strong> equities at 31 December 2008<br />
Market value<br />
Voting<br />
(per cent)<br />
Macerich Co/The 26 741 610 0,28 %<br />
Mack-Cali Realty Corp 35 941 058 0,32 %<br />
Macrovision Solutions Corp 71 764 202 0,79 %<br />
Macys Inc 119 548 432 0,39 %<br />
Magellan Health Services Inc 43 818 614 0,40 %<br />
Maguire Properties Inc 1 415 036 0,29 %<br />
Manhattan Associates Inc 7 874 651 0,30 %<br />
Manitowoc Co Inc/The 68 012 396 0,86 %<br />
MannKind Corp 1 072 224 0,04 %<br />
Manpower Inc 176 773 620 0,95 %<br />
Mantech International Corp 38 679 742 0,48 %<br />
Marathon Oil Corp 628 071 172 0,46 %<br />
Marcus Corp 9 684 862 0,41 %<br />
Marine Products Corp 2 070 102 0,14 %<br />
Mariner Energy Inc 27 148 424 0,43 %<br />
Markel Corp 96 970 563 0,47 %<br />
MarketAxess <strong>Holding</strong>s Inc 3 248 075 0,18 %<br />
Marriott International Inc/DE 352 441 751 0,74 %<br />
Marsh & McLennan Cos Inc 519 709 047 0,59 %<br />
Marshall & Ilsley Corp 93 805 343 0,38 %<br />
Martek Biosciences Corp 30 860 895 0,44 %<br />
Martha Stewart Living Omnimedia 691 116 0,13 %<br />
Martin Marietta Materials Inc 128 176 955 0,46 %<br />
Marvel Entertainment Inc 60 756 821 0,36 %<br />
Marvell Technology Group Ltd 459 101 276 1,60 %<br />
Masco Corp 128 471 451 0,46 %<br />
Masimo Corp 36 149 797 0,30 %<br />
Massey Energy Co 69 769 159 0,85 %<br />
MasTec Inc 14 411 765 0,26 %<br />
Mastercard Inc 430 183 232 0,44 %<br />
Matrix Service Co 6 342 584 0,45 %<br />
Mattel Inc 262 603 285 0,65 %<br />
Matthews International Corp 36 711 001 0,47 %<br />
Max Capital Group Ltd 229 329 621 3,30 %<br />
Maxim Integrated Products Inc 74 158 597 0,29 %<br />
MAXIMUS Inc 17 992 811 0,41 %<br />
MB Financial Inc 28 441 170 0,42 %<br />
MBIA Inc 36 270 414 0,47 %<br />
McAfee Inc 175 659 501 0,48 %<br />
McClatchy Co 9 909 0,00 %<br />
McCormick & Co Inc/MD 113 574 213 0,00 %<br />
McDermott International Inc 128 738 385 0,82 %<br />
McDonalds Corp 1 986 873 898 0,41 %<br />
MCG Capital Corp 1 554 471 0,41 %<br />
Mcgrath Rentcorp 14 332 501 0,40 %<br />
McGraw-Hill Cos Inc/The 342 628 148 0,67 %<br />
McKesson Corp 457 746 292 0,61 %<br />
McMoRan Exploration Co 23 070 239 0,48 %<br />
MDC <strong>Holding</strong>s Inc 132 906 724 1,35 %<br />
MDU Resources Group Inc 126 466 991 0,46 %<br />
MeadWestvaco Corp 60 756 008 0,45 %<br />
Medarex Inc 7 089 993 0,14 %<br />
MedAssets Inc 18 636 649 0,34 %<br />
Medcath Corp 4 051 674 0,28 %<br />
Medco Health Solutions Inc 962 848 646 0,65 %<br />
Media General Inc 1 031 306 0,38 %<br />
Mediacom Communications Corp 6 773 087 0,33 %<br />
Medical Properties Trust Inc 9 695 528 0,33 %<br />
Medicines Co/The 36 622 251 0,68 %<br />
Medicis Pharmaceutical Corp 18 803 708 0,34 %<br />
Medivation Inc 6 626 034 0,22 %<br />
Medtronic Inc 1 590 896 697 0,65 %<br />
MEMC Electronic Materials Inc 68 110 580 0,30 %<br />
Mens Wearhouse Inc/The 17 139 184 0,35 %<br />
Mentor Corp 21 697 995 0,30 %<br />
Mentor Graphics Corp 14 883 838 0,45 %<br />
MercadoLibre Inc 39 161 738 0,77 %<br />
Merck & Co Inc/NJ 2 250 746 678 0,50 %<br />
Mercury General Corp 41 047 118 0,23 %<br />
Meredith Corp 12 990 717 0,30 %<br />
Meridian Bioscience Inc 14 460 090 0,20 %<br />
Merit Medical Systems Inc 10 222 718 0,29 %<br />
Meritage Homes Corp 11 771 762 0,45 %<br />
Merrill Lynch & Co Inc 506 489 073 0,40 %<br />
Metavante Technologies Inc 38 831 252 0,29 %<br />
Methode Electronics Inc 7 052 789 0,39 %<br />
MetLife Inc 908 236 402 0,47 %<br />
MetroPCS Communications Inc 284 609 293 0,78 %<br />
Mettler Toledo International Inc 74 926 855 0,47 %<br />
MFA Mortgage Investments Inc 25 812 155 0,30 %<br />
MGE Energy Inc 13 111 334 0,25 %<br />
MGIC Investment Corp 12 497 968 0,41 %<br />
MGM Mirage 94 645 544 0,36 %<br />
Micrel Inc 9 333 035 0,27 %<br />
Microchip Technology Inc 94 090 030 0,38 %<br />
Micron Technology Inc 68 294 620 0,48 %<br />
Micros Systems Inc 49 168 905 0,54 %<br />
Microsemi Corp 27 025 031 0,38 %<br />
Micros<strong>of</strong>t Corp 6 237 285 247 0,52 %<br />
MicroStrategy Inc 9 389 466 0,40 %<br />
Mid-America Apartment Communities Inc 20 809 338 0,28 %<br />
Market value<br />
Voting<br />
(per cent)<br />
Middleby Corp 16 730 036 0,52 %<br />
Millicom International Cellular SA 136 542 920 0,40 %<br />
Millipore Corp 111 176 460 0,56 %<br />
Mine Safety Appliances Co 20 560 039 0,34 %<br />
Minerals Technologies Inc 23 737 094 0,44 %<br />
Mirant Corp 74 367 575 0,36 %<br />
MKS Instruments Inc 17 694 546 0,35 %<br />
Mobile Mini Inc 13 990 139 0,40 %<br />
Modine Manufacturing Co 3 567 463 0,32 %<br />
ModusLink <strong>Global</strong> Solutions Inc 3 471 740 0,38 %<br />
Mohawk Industries Inc 94 442 696 0,46 %<br />
Molex Inc 59 802 931 0,36 %<br />
Molina Healthcare Inc 4 623 519 0,14 %<br />
Molson Coors Brewing Co 255 550 698 0,48 %<br />
Momenta Pharmaceuticals Inc 16 523 959 0,51 %<br />
Monolithic Power Systems Inc 8 868 322 0,30 %<br />
Monsanto Co 1 507 726 399 0,56 %<br />
Monster Worldwide Inc 41 321 904 0,41 %<br />
Montpelier Re <strong>Holding</strong>s Ltd 48 995 087 0,46 %<br />
Moodys Corp 150 272 785 0,45 %<br />
Moog Inc 47 208 731 0,48 %<br />
Morgan Stanley 532 605 529 0,45 %<br />
Morgans Hotel Group Co 4 386 683 0,46 %<br />
Morningstar Inc 12 263 177 0,11 %<br />
Mosaic Co/The 636 064 580 0,59 %<br />
Motorola Inc 274 917 072 0,39 %<br />
Movado Group Inc 5 411 202 0,46 %<br />
Move Inc 3 935 819 0,23 %<br />
MPS Group Inc 17 940 274 0,37 %<br />
MSC Industrial Direct Co 51 334 023 0,45 %<br />
MSC.S<strong>of</strong>tware Corp 7 575 709 0,36 %<br />
MSCI Inc 145 954 428 1,62 %<br />
MTS Systems Corp 16 474 482 0,52 %<br />
Mueller Industries Inc 30 055 054 0,46 %<br />
Mueller Water Products Inc 29 937 991 0,44 %<br />
Multi-Fineline Electronix Inc 2 767 830 0,13 %<br />
Murphy Oil Corp 394 579 834 0,67 %<br />
Myers Industries Inc 6 089 866 0,31 %<br />
Mylan Inc/PA 214 386 115 1,02 %<br />
Myriad Genetics Inc 115 740 176 0,54 %<br />
Nabi Biopharmaceuticals 1 466 370 0,12 %<br />
Nabors Industries Ltd 103 790 631 0,44 %<br />
NACCO Industries Inc 7 890 153 0,45 %<br />
Nalco <strong>Holding</strong> Co 53 322 068 0,48 %<br />
NAM TAI Electronics Inc 5 108 750 0,30 %<br />
Nara Bancorp Inc 6 486 737 0,36 %<br />
NASDAQ OMX Group Inc/The 267 467 966 0,77 %<br />
Nash Finch Co 16 543 829 0,41 %<br />
NATCO Group Inc 9 135 468 0,42 %<br />
National CineMedia Inc 10 155 812 0,34 %<br />
National City Corp 106 816 734 0,41 %<br />
National Financial Partners Corp 3 069 092 0,36 %<br />
National Fuel Gas Co 29 811 196 0,17 %<br />
National Health Investors Inc 15 110 535 0,28 %<br />
National Healthcare Corp 12 631 075 0,27 %<br />
National Instruments Corp 47 491 786 0,35 %<br />
National Interstate Corp 2 467 640 0,10 %<br />
National Oilwell Varco Inc 362 943 526 0,51 %<br />
National Penn Bancshares Inc 29 956 188 0,37 %<br />
National Presto Industries Inc 11 938 658 0,32 %<br />
National Retail Properties Inc 24 937 930 0,26 %<br />
National Semiconductor Corp 62 378 180 0,39 %<br />
Nationwide Financial Services 77 801 562 0,46 %<br />
Nationwide Health Properties Inc 59 552 037 0,30 %<br />
Natus Medical Inc 7 615 252 0,30 %<br />
Navigant Consulting Inc 21 091 319 0,39 %<br />
Navigators Group Inc 22 018 705 0,34 %<br />
Navistar International Corp 39 396 341 0,37 %<br />
NBT Bancorp Inc 25 480 404 0,40 %<br />
NBTY Inc 23 395 503 0,35 %<br />
NCI Building Systems Inc 9 191 914 0,41 %<br />
NCR Corp 78 784 390 0,50 %<br />
Neenah Paper Inc 3 280 253 0,36 %<br />
Nektar Therapeutics 4 603 787 0,13 %<br />
Nelnet Inc 8 622 826 0,23 %<br />
Net 1 UEPS Technologies Inc 13 169 389 0,24 %<br />
NetApp Inc 260 467 657 0,81 %<br />
Netezza Corp 1 113 483 0,04 %<br />
NetFlix Inc 51 123 735 0,42 %<br />
Netgear Inc 6 882 066 0,24 %<br />
Netlogic Microsystems Inc 9 593 581 0,29 %<br />
NetSuite Inc 4 912 498 0,14 %<br />
NeuStar Inc 89 007 345 0,84 %<br />
Neutral Tandem Inc 9 599 166 0,26 %<br />
New Jersey Resources Corp 18 284 621 0,16 %<br />
New York & Co Inc 1 328 896 0,14 %<br />
New York Community Bancorp Inc 110 923 421 0,38 %<br />
New York Times Co/The (10 893 661) 0,00 %<br />
NewAlliance Bancshares Inc 37 432 807 0,38 %<br />
Newcastle Investment Corp 772 987 0,25 %<br />
Newell Rubbermaid Inc 88 704 964 0,47 %<br />
39<br />
GOVERNMENT PENSION FUND <strong>–</strong> GLOBAL ANNUAL REPORT 2008
<strong>Government</strong> <strong>Pension</strong> <strong>Fund</strong> <strong>–</strong> <strong>Global</strong> <strong>Holding</strong> <strong>of</strong> equities at 31 December 2008<br />
Market value<br />
Voting<br />
(per cent)<br />
Newfi eld Exploration Co 165 376 137 0,90 %<br />
NewMarket Corp 16 364 991 0,44 %<br />
Newmont Mining Corp 1 058 935 330 0,84 %<br />
Newpark Resources 8 703 275 0,38 %<br />
Newport Corp 7 046 744 0,41 %<br />
News Corp 1 076 410 991 0,14 %<br />
Nicor Inc 21 845 332 0,20 %<br />
Nighthawk Radiology <strong>Holding</strong>s Inc 2 130 189 0,22 %<br />
NII <strong>Holding</strong>s Inc 85 763 456 0,41 %<br />
Nike Inc 592 425 680 0,43 %<br />
NiSource Inc 47 662 566 0,23 %<br />
NL Industries Inc 3 158 443 0,07 %<br />
Noble Corp 199 173 693 0,49 %<br />
Noble Energy Inc 535 505 477 0,90 %<br />
Nordic American Tanker Shipping 30 816 951 0,38 %<br />
Nordson Corp 27 168 139 0,36 %<br />
Nordstrom Inc 119 553 866 0,60 %<br />
Norfolk Southern Corp 527 755 901 0,43 %<br />
Northeast Utilities 340 264 639 1,30 %<br />
Northern Trust Corp 319 136 775 0,39 %<br />
NorthStar Realty Finance Corp 3 717 824 0,22 %<br />
Northwest Bancorp Inc 7 970 438 0,11 %<br />
Northwest Natural Gas Co 17 977 943 0,22 %<br />
NorthWestern Corp 15 271 721 0,26 %<br />
Novatel Wireless Inc 911 012 0,09 %<br />
Novell Inc 41 976 960 0,45 %<br />
Novellus Systems Inc 31 072 776 0,37 %<br />
Noven Pharmaceuticals Inc 5 321 449 0,28 %<br />
NRG Energy Inc 284 617 106 0,75 %<br />
NSTAR 86 662 483 0,32 %<br />
NTELOS <strong>Holding</strong>s Corp 20 730 457 0,28 %<br />
Nu Skin Enterprises Inc 16 026 778 0,34 %<br />
Nuance Communications Inc 309 236 366 1,77 %<br />
Nucor Corp 377 050 011 0,37 %<br />
NutriSystem Inc 11 334 621 0,37 %<br />
NuVasive Inc 63 158 345 0,72 %<br />
NV Energy Inc 182 704 373 1,13 %<br />
Nvidia Corp 172 331 327 0,57 %<br />
NVR Inc 100 361 756 0,58 %<br />
NYSE Euronext 203 281 541 0,41 %<br />
Occidental Petroleum Corp 1 678 379 870 0,49 %<br />
Oceaneering International Inc 105 480 728 0,95 %<br />
OCharleys Inc 1 071 601 0,36 %<br />
Ocwen Financial Corp 20 453 602 0,51 %<br />
Odyssey HealthCare Inc 6 395 657 0,30 %<br />
Odyssey Re <strong>Holding</strong>s Corp 44 462 895 0,20 %<br />
Offi ce Depot Inc 20 124 379 0,35 %<br />
Offi ceMax Inc 58 134 739 1,43 %<br />
OGE Energy Corp 75 097 311 0,45 %<br />
Oil States International Inc 10 417 061 0,16 %<br />
Oilsands Quest Inc 4 515 666 0,37 %<br />
Old Dominion Freight Line Inc 26 652 672 0,36 %<br />
Old National Bancorp/IN 34 482 743 0,41 %<br />
Old Republic International Corp 91 047 747 0,47 %<br />
Old Second Bancorp Inc 3 407 768 0,30 %<br />
Olin Corp 43 312 710 0,44 %<br />
OM Group Inc 21 634 105 0,48 %<br />
Omega Healthcare Investors Inc 24 321 396 0,26 %<br />
Omnicare Inc 85 764 564 0,37 %<br />
Omnicell Inc 35 908 084 1,34 %<br />
Omnicom Group Inc (81 512 686) 0,00 %<br />
Omniture Inc 16 815 328 0,31 %<br />
Omnivision Technologies Inc 6 602 758 0,36 %<br />
ON Semiconductor Corp 85 400 901 0,87 %<br />
OneBeacon Insurance Group Ltd 7 522 188 0,44 %<br />
Oneok Inc 147 203 582 0,69 %<br />
ONEOK Partners LP 14 352 554 0,08 %<br />
Onyx Pharmaceuticals Inc 148 708 851 1,10 %<br />
Opnext Inc 687 443 0,09 %<br />
optionsXpress <strong>Holding</strong>s Inc 19 295 222 0,34 %<br />
Oracle Corp 3 116 097 659 0,50 %<br />
Orbital Sciences Corp 38 663 340 0,48 %<br />
Orbitz Worldwide Inc 5 102 178 0,23 %<br />
Orbotech Ltd 3 424 934 0,36 %<br />
OReilly Automotive Inc 130 216 713 0,45 %<br />
Oriental Financial Group Inc 3 692 588 0,36 %<br />
Orient-Express Hotels Ltd 11 471 150 0,42 %<br />
Oritani Financial Corp 5 548 263 0,12 %<br />
Ormat Technologies Inc 9 133 813 0,09 %<br />
Orth<strong>of</strong>i x International NV 4 289 072 0,23 %<br />
Oshkosh Corp 23 398 777 0,51 %<br />
OSI Pharmaceuticals Inc 79 542 464 0,50 %<br />
OSI Systems Inc 8 294 621 0,48 %<br />
Otter Tail Corp 13 866 075 0,24 %<br />
Overseas Shipholding Group Inc 30 964 263 0,37 %<br />
Overstock.com Inc 5 743 549 0,33 %<br />
Owens & Minor Inc 34 404 647 0,32 %<br />
Owens Corning 55 358 091 0,36 %<br />
Owens-Illinois Inc 405 597 831 1,27 %<br />
Oxford Industries Inc 3 811 989 0,39 %<br />
PACCAR Inc 182 242 262 0,25 %<br />
Market value<br />
Voting<br />
(per cent)<br />
Pacer International Inc 6 089 911 0,24 %<br />
Pacifi c Capital Bancorp NA 19 756 842 0,36 %<br />
Pacifi c Sunwear Of California 1 922 015 0,26 %<br />
Packaging Corp <strong>of</strong> America 35 320 763 0,37 %<br />
Pactiv Corp 103 032 259 0,45 %<br />
PacWest Bancorp 20 039 624 0,39 %<br />
PAETEC <strong>Holding</strong> Corp 3 606 143 0,25 %<br />
Pall Corp 107 964 657 0,46 %<br />
Palm Inc 26 325 968 1,12 %<br />
Palomar Medical Technologies Inc 2 668 104 0,18 %<br />
Panera Bread Co 45 999 153 0,43 %<br />
Pantry Inc/The 9 033 631 0,27 %<br />
Papa Johns International Inc 10 528 309 0,29 %<br />
Par Pharmaceutical Cos Inc 8 278 625 0,26 %<br />
Parallel Petroleum Corp 2 213 931 0,38 %<br />
Parametric Technology Corp 47 251 789 0,46 %<br />
Parexel International Corp 13 181 773 0,35 %<br />
Park Electrochemical Corp 10 905 953 0,40 %<br />
Park National Corp 29 351 252 0,42 %<br />
Parker Drilling Co 8 920 384 0,39 %<br />
Parker Hannifi n Corp 217 488 698 0,45 %<br />
Parkway Properties Inc/Md 4 799 141 0,25 %<br />
PartnerRe Ltd 333 971 817 1,22 %<br />
Patriot Coal Corp 14 749 661 0,44 %<br />
Patterson Cos Inc 47 910 513 0,30 %<br />
Patterson-UTI Energy Inc 57 860 973 0,46 %<br />
Paychex Inc 260 141 535 0,39 %<br />
PDL BioPharma Inc 9 476 176 0,18 %<br />
Peabody Energy Corp 367 947 594 0,87 %<br />
Pediatrix Medical Group Inc 103 985 123 1,03 %<br />
Penn National Gaming Inc 54 903 673 0,47 %<br />
Penn Virginia Corp 32 950 184 0,43 %<br />
PennantPark Investment Corp 15 407 621 2,89 %<br />
Pennsylvania Real Estate Investment Trust 7 147 685 0,35 %<br />
Penske Auto Group Inc 11 219 529 0,23 %<br />
Pentair Inc 74 791 534 0,46 %<br />
Peoples Bancorp Inc/OH 4 024 399 0,29 %<br />
Peoples United Financial Inc 165 263 432 0,38 %<br />
PEP Boys-Manny Moe & Jack 6 253 258 0,41 %<br />
Pepco <strong>Holding</strong>s Inc 68 386 937 0,25 %<br />
Pepsi Bottling Group Inc 150 167 806 0,45 %<br />
PepsiAmericas Inc 53 230 367 0,29 %<br />
PepsiCo Inc/NC 3 273 160 862 0,55 %<br />
Perfi cient Inc 3 891 394 0,36 %<br />
Pericom Semiconductor Corp 3 861 977 0,39 %<br />
Perini Corp 28 067 106 0,34 %<br />
PerkinElmer Inc 53 494 374 0,47 %<br />
Perot Systems Corp 34 756 324 0,30 %<br />
Perrigo Co 64 622 580 0,31 %<br />
PetroHawk Energy Corp 120 374 629 0,44 %<br />
Petroleum Development Corp 10 178 164 0,41 %<br />
Petroquest Energy Inc 12 987 557 0,54 %<br />
PetSmart Inc 63 237 116 0,39 %<br />
PF Changs China Bistro Inc 31 283 544 0,90 %<br />
Pfi zer Inc 3 105 887 454 0,37 %<br />
PG&E Corp 515 032 961 0,53 %<br />
Pharmaceutical Product Development Inc 92 459 508 0,39 %<br />
PharMerica Corp 11 966 819 0,36 %<br />
Phase Forward Inc 16 652 563 0,44 %<br />
PHH Corp 92 329 343 1,91 %<br />
PHI Inc 5 300 508 0,00 %<br />
Philip Morris International Inc 3 335 098 781 0,54 %<br />
Phillips-Van Heusen Corp 32 304 851 0,45 %<br />
Phoenix Cos Inc/The 11 319 524 0,43 %<br />
Pico <strong>Holding</strong>s Inc 10 571 937 0,30 %<br />
Piedmont Natural Gas Co 36 818 011 0,23 %<br />
Pier 1 Imports Inc 1 154 170 0,50 %<br />
Pike Electric Corp 4 917 440 0,17 %<br />
Pinnacle Entertainment Inc 13 914 519 0,43 %<br />
Pinnacle Financial Partners Inc 17 915 937 0,36 %<br />
Pinnacle West Capital Corp (27 638 708) 0,00 %<br />
Pioneer Drilling Co 7 451 391 0,38 %<br />
Pioneer Natural Resources Co 162 425 158 1,22 %<br />
Piper Jaffray Cos 21 646 429 0,41 %<br />
Pitney Bowes Inc 145 739 037 0,40 %<br />
Plains Exploration & Production Co 111 753 030 0,64 %<br />
PlanetOut Inc 148 192 1,18 %<br />
Plantronics Inc 15 220 073 0,34 %<br />
Platinum Underwriters <strong>Holding</strong>s Ltd 58 914 914 0,49 %<br />
Plexus Corp 23 436 844 0,50 %<br />
Plum Creek Timber Co Inc 125 316 381 0,31 %<br />
PMA Capital Corp 4 763 451 0,30 %<br />
PMC - Sierra Inc 26 753 323 0,36 %<br />
PMI Group Inc/The 4 588 459 0,41 %<br />
PNC Financial Services Group Inc 638 214 625 0,53 %<br />
PNM Resources Inc 51 582 270 0,85 %<br />
Polaris Industries Inc 32 017 382 0,49 %<br />
Polo Ralph Lauren Corp 10 384 749 0,06 %<br />
Polycom Inc 29 350 658 0,37 %<br />
PolyOne Corp 8 287 001 0,41 %<br />
Polypore International Inc 7 654 157 0,33 %<br />
40<br />
GOVERNMENT PENSION FUND <strong>–</strong> GLOBAL ANNUAL REPORT 2008
<strong>Government</strong> <strong>Pension</strong> <strong>Fund</strong> <strong>–</strong> <strong>Global</strong> <strong>Holding</strong> <strong>of</strong> equities at 31 December 2008<br />
Market value<br />
Voting<br />
(per cent)<br />
Pool Corp 26 511 527 0,44 %<br />
Popular Inc 253 167 323 2,48 %<br />
Portfolio Recovery Associates Inc 17 705 931 0,49 %<br />
Portland General Electric Co 21 240 761 0,25 %<br />
Post Properties Inc 14 179 914 0,28 %<br />
Potlatch Corp 20 289 593 0,28 %<br />
Powell Industries Inc 7 282 315 0,31 %<br />
Power Integrations Inc 14 529 600 0,36 %<br />
Powerwave Technologies Inc 1 891 565 0,41 %<br />
PPG Industries Inc 225 103 969 0,46 %<br />
PPL Corp 323 395 731 0,40 %<br />
Praxair Inc 842 596 925 0,66 %<br />
Precision Castparts Corp 286 947 689 0,49 %<br />
Premiere <strong>Global</strong> Services Inc 12 645 244 0,34 %<br />
Pre-Paid Legal Services Inc 10 753 223 0,35 %<br />
Presidential Life Corp 5 648 093 0,28 %<br />
Prestige Brands <strong>Holding</strong>s Inc 4 164 026 0,11 %<br />
priceline.com Inc 154 280 270 0,74 %<br />
Pricesmart Inc 17 155 342 0,40 %<br />
Pride International Inc 117 755 997 0,61 %<br />
Principal Financial Group Inc 191 425 800 0,47 %<br />
PrivateBancorp Inc 28 747 635 0,38 %<br />
ProAssurance Corp 58 111 319 0,47 %<br />
Procter & Gamble Co 5 395 598 963 0,42 %<br />
Progenics Pharmaceuticals Inc 14 928 800 0,68 %<br />
Progress Energy Inc (70 264 588) 0,00 %<br />
Progress S<strong>of</strong>tware Corp 25 725 709 0,46 %<br />
Progressive Corp/The 280 371 793 0,40 %<br />
Prologis 73 056 711 0,28 %<br />
Prosperity Bancshares Inc 26 418 655 0,28 %<br />
Protective Life Corp 57 326 530 0,82 %<br />
Provident <strong>Bank</strong>shares Corp 8 109 462 0,36 %<br />
Provident Financial Services Inc 23 302 417 0,36 %<br />
Provident New York Bancorp 11 773 264 0,34 %<br />
Prudential Financial Inc 442 636 169 0,50 %<br />
PS Business Parks Inc 39 561 734 0,62 %<br />
PSS World Medical Inc 26 398 733 0,33 %<br />
Psychiatric Solutions Inc 32 365 363 0,30 %<br />
Public Service Enterprise Group Inc 903 735 831 0,87 %<br />
Public Storage 211 331 928 0,22 %<br />
Puget Energy Inc 88 602 205 0,36 %<br />
Pulte Homes Inc 90 630 629 0,46 %<br />
QLogic Corp 44 318 856 0,37 %<br />
QUALCOMM Inc 2 726 710 638 0,66 %<br />
Quality Systems Inc 27 070 097 0,31 %<br />
Quanex Building Products Corp 10 975 384 0,00 %<br />
Quanta Services Inc 124 045 394 0,46 %<br />
Quest Diagnostics Inc/DE 199 323 166 0,28 %<br />
Quest S<strong>of</strong>tware Inc 22 823 261 0,24 %<br />
Questar Corp 571 287 308 1,44 %<br />
Questcor Pharmaceuticals Inc 12 337 905 0,29 %<br />
Quicksilver Resources Inc 10 559 358 0,16 %<br />
Quidel Corp 9 495 667 0,32 %<br />
Quiksilver Inc 14 144 434 0,86 %<br />
Qwest Communications International Inc 308 353 850 0,71 %<br />
Rackable Systems Inc 3 176 321 0,39 %<br />
Radian Group Inc 8 691 455 0,42 %<br />
Radio One Inc 302 954 0,00 %<br />
RadioShack Corp 44 558 662 0,43 %<br />
RAIT Financial Trust 2 772 564 0,24 %<br />
Ralcorp <strong>Holding</strong>s Inc 158 306 222 0,69 %<br />
Rambus Inc 91 408 772 0,78 %<br />
Ramco-Gershenson Properties Trust 2 041 792 0,25 %<br />
Range Resources Corp 222 942 641 0,60 %<br />
Raven Industries Inc 15 211 686 0,50 %<br />
Raymond James Financial Inc 59 621 665 0,41 %<br />
Rayonier Inc 52 696 313 0,30 %<br />
RBC Bearings Inc 13 386 584 0,43 %<br />
RC2 Corp 6 130 751 0,48 %<br />
RCN Corp 4 921 999 0,32 %<br />
RealNetworks Inc 12 115 438 0,36 %<br />
Realty Income Corp 50 545 428 0,30 %<br />
Red Hat Inc 88 684 730 0,50 %<br />
Red Robin Gourmet Burgers Inc 7 050 923 0,39 %<br />
Redwood Trust Inc 9 943 076 0,28 %<br />
Regal Entertainment Group 40 891 531 0,44 %<br />
Regal-Beloit Corp 39 176 324 0,46 %<br />
Regency Centers Corp 187 585 059 0,82 %<br />
Regeneron Pharmaceuticals Inc 59 987 094 0,60 %<br />
Regions Financial Corp 158 779 914 0,41 %<br />
Regis Corp 19 972 985 0,45 %<br />
RehabCare Group Inc 6 331 320 0,33 %<br />
Reinsurance Group <strong>of</strong> America Inc 80 419 182 0,36 %<br />
Reliance Steel & Aluminum Co 39 582 941 0,39 %<br />
Reliant Energy Inc 45 621 084 0,32 %<br />
Renaissance Learning Inc 2 226 502 0,12 %<br />
RenaissanceRe <strong>Holding</strong>s Ltd 100 529 407 0,45 %<br />
Renasant Corp 8 221 757 0,33 %<br />
Rent-A-Center Inc/TX 36 588 074 0,44 %<br />
Rentech Inc 3 097 566 0,39 %<br />
Republic Airways <strong>Holding</strong>s Inc 7 467 655 0,29 %<br />
Market value<br />
Voting<br />
(per cent)<br />
Republic Bancorp Inc/KY 8 560 857 0,25 %<br />
Republic Services Inc 427 625 998 0,65 %<br />
Resaca Exploitation Inc 765 112 0,00 %<br />
Res-Care Inc 7 603 587 0,25 %<br />
Resmed Inc 47 390 657 0,24 %<br />
Resources Connection Inc 20 776 087 0,40 %<br />
Rex Energy Corp 6 729 456 0,89 %<br />
Reynolds American Inc 251 436 677 0,31 %<br />
RF Micro Devices Inc 5 243 446 0,36 %<br />
RH Donnelley Corp 6 204 025 3,48 %<br />
Rigel Pharmaceuticals Inc 6 449 774 0,31 %<br />
Riskmetrics Group Inc 12 174 380 0,19 %<br />
Riverbed Technology Inc 7 163 018 0,13 %<br />
RLI Corp 41 352 097 0,45 %<br />
Robbins & Myers Inc 14 987 116 0,38 %<br />
Robert Half International Inc 87 084 198 0,39 %<br />
Rock-Tenn Co 30 510 254 0,33 %<br />
Rockwell Automation Inc/DE 148 247 840 0,46 %<br />
Rockwell Collins Inc 200 586 072 0,46 %<br />
Rockwood <strong>Holding</strong>s Inc 17 299 217 0,31 %<br />
R<strong>of</strong>i n-Sinar Technologies Inc 17 640 395 0,42 %<br />
Rogers Corp 10 939 468 0,31 %<br />
Rohm & Haas Co 295 805 151 0,35 %<br />
Rollins Inc 31 803 688 0,25 %<br />
Roper Industries Inc 123 628 603 0,45 %<br />
Rosetta Resources Inc 10 494 504 0,41 %<br />
Ross Stores Inc 2 259 087 0,01 %<br />
Rowan Cos Inc 54 273 469 0,43 %<br />
Royal Caribbean Cruises Ltd 68 667 249 0,33 %<br />
Royal Gold Inc (48 169 286) 0,00 %<br />
RPC Inc 10 569 678 0,16 %<br />
RPM International Inc 57 902 957 0,48 %<br />
RR Donnelley & Sons Co 79 548 487 0,41 %<br />
RSC <strong>Holding</strong>s Inc 18 284 965 0,30 %<br />
RTI Biologics Inc 3 513 778 0,34 %<br />
RTI International Metals Inc 7 888 249 0,34 %<br />
Ruby Tuesday Inc 2 217 359 0,38 %<br />
Ruddick Corp 25 127 036 0,27 %<br />
Rudolph Technologies Inc 2 105 108 0,28 %<br />
Rush Enterprises Inc 5 098 159 0,32 %<br />
Ryder System Inc 54 568 153 0,36 %<br />
Ryland Group Inc 24 510 587 0,46 %<br />
S&T Bancorp Inc 25 399 348 0,37 %<br />
S1 Corp 11 229 528 0,38 %<br />
Safety Insurance Group Inc 18 995 848 0,44 %<br />
Safeway Inc 199 739 385 0,28 %<br />
Saia Inc 40 302 687 3,92 %<br />
SAIC Inc 103 985 914 0,38 %<br />
Saks Inc 15 725 386 0,36 %<br />
Salesforce.com Inc 189 040 470 0,69 %<br />
Salix Pharmaceuticals Ltd 9 223 149 0,31 %<br />
Sally Beauty <strong>Holding</strong>s Inc 15 245 123 0,21 %<br />
Sanderson Farms Inc 14 499 953 0,30 %<br />
SanDisk Corp 75 466 057 0,50 %<br />
SandRidge Energy Inc 23 061 181 0,32 %<br />
Sandy Spring Bancorp Inc 8 307 715 0,33 %<br />
Sanmina-SCI Corp 7 022 940 0,40 %<br />
Santander BanCorp 2 367 178 0,06 %<br />
Sapient Corp 67 854 719 1,72 %<br />
Sara Lee Corp 213 271 346 0,44 %<br />
Sauer-Danfoss Inc 3 731 183 0,13 %<br />
Saul Centers Inc 35 679 201 0,72 %<br />
Savient Pharmaceuticals Inc 32 246 706 1,46 %<br />
SAVVIS Inc 6 781 966 0,26 %<br />
SBA Communications Corp 65 388 424 0,49 %<br />
SCANA Corp 86 202 453 0,29 %<br />
Scansource Inc 12 795 591 0,36 %<br />
Schawk Inc 3 085 946 0,15 %<br />
Schering-Plough Corp 2 085 002 984 1,08 %<br />
Schlumberger Ltd 1 900 724 295 0,54 %<br />
Schnitzer Steel Industries Inc 19 014 246 0,33 %<br />
Scholastic Corp 10 040 016 0,29 %<br />
School Specialty Inc 10 871 470 0,43 %<br />
Schulman A Inc 13 618 636 0,44 %<br />
Schweitzer-Mauduit International Inc 7 864 072 0,36 %<br />
Scientifi c Games Corp 38 952 464 0,34 %<br />
Scotts Miracle-Gro Co/The 41 339 752 0,30 %<br />
Scripps Networks Interactive Inc 60 321 719 0,31 %<br />
Seaboard Corp 11 395 372 0,11 %<br />
Seacoast <strong>Bank</strong>ing Corp <strong>of</strong> Florida 2 552 114 0,29 %<br />
SEACOR <strong>Holding</strong>s Inc 42 844 939 0,46 %<br />
Seagate Technology 55 688 924 0,37 %<br />
Sealed Air Corp 83 130 474 0,50 %<br />
Sealy Corp 3 562 736 0,22 %<br />
Sears <strong>Holding</strong>s Corp 102 469 352 0,30 %<br />
Seaspan Corp 12 302 827 0,33 %<br />
Seattle Genetics Inc 10 010 483 0,20 %<br />
SEI Investments Co 64 259 787 0,31 %<br />
Select Comfort Corp 276 362 0,35 %<br />
Selective Insurance Group 41 398 796 0,49 %<br />
Sempra Energy 374 405 265 0,51 %<br />
41<br />
GOVERNMENT PENSION FUND <strong>–</strong> GLOBAL ANNUAL REPORT 2008
<strong>Government</strong> <strong>Pension</strong> <strong>Fund</strong> <strong>–</strong> <strong>Global</strong> <strong>Holding</strong> <strong>of</strong> equities at 31 December 2008<br />
Market value<br />
Voting<br />
(per cent)<br />
Semtech Corp 16 562 322 0,35 %<br />
Senior Housing Properties Trust 44 961 647 0,31 %<br />
Sensient Technologies Corp 37 089 886 0,46 %<br />
Sepracor Inc 47 142 846 0,56 %<br />
Sequenom Inc 137 613 994 1,63 %<br />
Service Corp International/US 39 983 788 0,45 %<br />
Shaw Group Inc/The 216 542 173 1,81 %<br />
Shenandoah Telecommunications Co 19 021 220 0,41 %<br />
Sherwin-Williams Co/The 222 277 451 0,45 %<br />
Ship Finance International Ltd 13 741 791 0,24 %<br />
Shuffl e Master Inc 7 984 523 0,41 %<br />
Shutterfl y Inc 1 823 189 0,15 %<br />
Sigma Designs Inc 6 375 405 0,36 %<br />
Sigma-Aldrich Corp 170 542 897 0,46 %<br />
Signature <strong>Bank</strong>/New York NY 29 039 891 0,41 %<br />
Silgan <strong>Holding</strong>s Inc 45 033 649 0,35 %<br />
Silicon Image Inc 9 285 159 0,43 %<br />
Silicon Laboratories Inc 22 130 246 0,28 %<br />
Silicon Storage Technology Inc 5 647 412 0,37 %<br />
Simmons First National Corp 9 469 901 0,33 %<br />
Simon Property Group Inc 413 260 536 0,49 %<br />
Simpson Manufacturing Co Inc 32 350 380 0,34 %<br />
Sina Corp/China 40 800 870 0,45 %<br />
Sinclair Broadcast Group Inc 2 317 061 0,23 %<br />
Sirius XM Radio Inc 10 364 726 0,35 %<br />
Sirona Dental Systems Inc 2 894 416 0,07 %<br />
Six Flags Inc 712 820 0,34 %<br />
SJW Corp 6 200 188 0,16 %<br />
Skechers U.S.A. Inc 13 350 585 0,45 %<br />
Skyline Corp 5 377 024 0,46 %<br />
Skywest Inc 26 959 355 0,36 %<br />
Skyworks Solutions Inc 148 474 746 2,31 %<br />
SL Green Realty Corp 32 881 727 0,32 %<br />
SLM Corp 139 129 965 0,48 %<br />
Smart Modular Technologies WWH Inc 2 031 993 0,31 %<br />
Smith International Inc 182 939 625 0,52 %<br />
Smithfi eld Foods Inc 682 794 646 4,83 %<br />
Smurfi t-Stone Container Corp 6 984 765 1,53 %<br />
Snap-On Inc 72 344 681 0,46 %<br />
Sohu.com Inc 44 702 982 0,35 %<br />
Solera <strong>Holding</strong>s Inc 51 103 422 0,44 %<br />
Sonic Automotive Inc 3 530 670 0,45 %<br />
Sonic Corp 23 903 901 0,46 %<br />
SonicWALL Inc 6 218 350 0,42 %<br />
Sonoco Products Co 75 686 859 0,47 %<br />
SonoSite Inc 7 310 061 0,32 %<br />
Sonus Networks Inc 10 636 905 0,35 %<br />
Sothebys 20 728 433 0,49 %<br />
South Financial Group Inc/The 8 597 633 0,38 %<br />
South Jersey Industries Inc 100 693 491 1,21 %<br />
Southern Co (420 694 774) 0,00 %<br />
Southern Copper Corp 109 761 471 0,11 %<br />
Southern Union Co 44 854 935 0,40 %<br />
Southwest Airlines Co 343 139 612 0,77 %<br />
Southwest Gas Corp 14 675 052 0,19 %<br />
Southwestern Energy Co 368 162 301 0,53 %<br />
Sovereign Bancorp Inc 207 117 580 1,50 %<br />
Sovran Self Storage Inc 16 318 366 0,29 %<br />
Spansion Inc 505 676 0,24 %<br />
Spartan Stores Inc 13 194 356 0,37 %<br />
Spartech Corp 4 902 518 0,37 %<br />
SPDR S&P Retail ETF (153 547 398) 0,00 %<br />
Spectra Energy Corp 263 937 009 0,39 %<br />
Speedway Motorsports Inc 7 969 027 0,16 %<br />
Spherion Corp 3 196 968 0,40 %<br />
Spirit Aerosystems <strong>Holding</strong>s Inc 32 481 138 0,44 %<br />
Sprint Nextel Corp 205 582 747 0,58 %<br />
SPSS Inc 11 035 692 0,32 %<br />
SPX Corp 71 987 783 0,47 %<br />
SRA International Inc 14 621 897 0,29 %<br />
St Joe Co/The 47 475 448 0,30 %<br />
St Jude Medical Inc 480 138 501 0,60 %<br />
St Mary Land & Exploration Co 41 222 897 0,47 %<br />
Stage Stores Inc 6 358 334 0,29 %<br />
Stamps.com Inc 3 086 573 0,25 %<br />
StanCorp Financial Group Inc 68 017 448 0,48 %<br />
Standard Microsystems Corp 7 826 854 0,31 %<br />
Standard Pacifi c Corp 6 398 833 0,51 %<br />
Standard Register Co/The 3 255 685 0,22 %<br />
Standex International Corp 9 635 190 0,55 %<br />
Stanley Inc 10 677 997 0,18 %<br />
Stanley Works/The 142 585 571 0,76 %<br />
Staples Inc 630 078 400 0,70 %<br />
Starbucks Corp 228 145 996 0,47 %<br />
Starent Networks Corp 10 813 111 0,18 %<br />
Starwood Hotels & Resorts Worldwide Inc 106 820 590 0,47 %<br />
State Auto Financial Corp 35 677 311 0,43 %<br />
State Street Corp 743 592 497 0,63 %<br />
Steak N Shake Co/The 2 868 671 0,24 %<br />
STEC Inc 24 483 241 1,64 %<br />
Steel Dynamics Inc 42 662 147 0,30 %<br />
Market value<br />
Voting<br />
(per cent)<br />
Steelcase Inc 9 819 258 0,32 %<br />
Steiner Leisure Ltd 15 315 377 0,48 %<br />
Stepan Co 5 297 033 0,17 %<br />
Stericycle Inc 140 860 107 0,45 %<br />
STERIS Corp 31 507 889 0,32 %<br />
Sterling Bancorp/NY 5 116 115 0,29 %<br />
Sterling Bancshares Inc/TX 14 132 243 0,45 %<br />
Sterling Financial Corp/WA 11 275 011 0,35 %<br />
Steven Madden Ltd 11 079 916 0,42 %<br />
Stewart Enterprises Inc 8 064 960 0,43 %<br />
Stewart Information Services Corp 9 189 296 0,33 %<br />
Stifel Financial Corp 33 650 787 0,41 %<br />
Stillwater Mining Co 4 366 135 0,14 %<br />
Stone Energy Corp 12 875 288 0,42 %<br />
Strategic Hotels & Resorts Inc 2 025 221 0,23 %<br />
Strattec Security Corp 138 221 0,04 %<br />
Strayer Education Inc 99 307 831 0,46 %<br />
Stryker Corp 413 000 521 0,37 %<br />
Student Loan Corp/The 4 776 826 0,08 %<br />
SuccessFactors Inc 6 827 304 0,30 %<br />
Suffolk Bancorp 7 115 591 0,30 %<br />
Sun Bancorp Inc/NJ 2 684 120 0,23 %<br />
Sun Communities Inc 4 791 775 0,27 %<br />
Sun Healthcare Group Inc 9 519 738 0,35 %<br />
Sun Microsystems Inc 79 113 026 0,40 %<br />
Sunoco Inc 160 608 183 0,45 %<br />
Sunpower Corp 149 619 647 1,00 %<br />
Sunrise Senior Living Inc 2 155 455 0,36 %<br />
Sunstone Hotel Investors Inc 5 157 297 0,25 %<br />
SunTrust <strong>Bank</strong>s Inc 285 078 792 0,39 %<br />
Superior Energy Services Inc 29 469 223 0,34 %<br />
Superior Industries International Inc 6 646 457 0,34 %<br />
Superior Well Services Inc 5 443 713 0,33 %<br />
Supertex Inc 7 198 244 0,33 %<br />
SUPERVALU Inc 68 153 910 0,31 %<br />
SureWest Communications 3 176 249 0,28 %<br />
SurModics Inc 8 841 668 0,28 %<br />
Susquehanna Bancshares Inc 38 943 179 0,41 %<br />
SVB Financial Group 23 724 570 0,39 %<br />
Swift Energy Co 17 782 328 0,49 %<br />
SWS Group Inc 12 948 666 0,36 %<br />
SY Bancorp Inc 7 794 738 0,30 %<br />
Sybase Inc 63 921 708 0,45 %<br />
Sycamore Networks Inc 13 864 262 0,26 %<br />
SYKES Enterprises Inc 14 302 283 0,26 %<br />
Symantec Corp 429 306 673 0,54 %<br />
Symmetry Medical Inc 3 531 004 0,18 %<br />
Symyx Technologies 4 811 043 0,34 %<br />
Synaptics Inc 13 661 212 0,35 %<br />
Synchronoss Technologies Inc 2 185 305 0,10 %<br />
Syneron Medical Ltd 3 833 213 0,23 %<br />
Syniverse <strong>Holding</strong>s Inc 15 740 913 0,28 %<br />
SYNNEX Corp 3 297 271 0,13 %<br />
Synopsys Inc 81 564 392 0,44 %<br />
Synovus Financial Corp 73 826 862 0,38 %<br />
Syntel Inc 7 336 951 0,11 %<br />
SYSCO Corp 133 927 595 0,14 %<br />
Systemax Inc 2 517 273 0,09 %<br />
T Rowe Price Group Inc 249 200 891 0,39 %<br />
Take-Two Interactive S<strong>of</strong>tware Inc 19 782 454 0,48 %<br />
TAL International Group Inc 5 222 698 0,16 %<br />
Talbots Inc 1 044 399 0,11 %<br />
Taleo Corp 7 398 774 0,45 %<br />
Tanger Factory Outlet Centers 24 167 640 0,29 %<br />
Target Corp 992 558 802 0,55 %<br />
Taser International Inc 11 674 841 0,51 %<br />
Taubman Centers Inc 20 256 144 0,21 %<br />
TBS International Ltd 2 662 881 0,22 %<br />
TCF Financial Corp 48 004 832 0,38 %<br />
TD Ameritrade <strong>Holding</strong> Corp 215 284 468 0,36 %<br />
Team Inc 13 992 142 0,38 %<br />
Tech Data Corp 81 231 453 1,30 %<br />
Techne Corp 30 059 334 0,17 %<br />
Technitrol Inc 3 972 139 0,40 %<br />
TechTarget Inc 1 043 200 0,08 %<br />
TECO Energy Inc 189 093 036 1,03 %<br />
Tecumseh Products Co 3 808 657 0,01 %<br />
Teekay Corp 28 997 084 0,29 %<br />
Tejon Ranch Co 3 958 350 0,13 %<br />
Tekelec 21 238 554 0,34 %<br />
Teledyne Technologies Inc 52 601 794 0,47 %<br />
Telefl ex Inc 64 526 409 0,46 %<br />
Telephone & Data Systems Inc 48 905 000 0,20 %<br />
TeleTech <strong>Holding</strong>s Inc 13 830 846 0,36 %<br />
Tellabs Inc 44 769 329 0,39 %<br />
Temple-Inland Inc 15 256 321 0,43 %<br />
Tempur-Pedic International Inc 12 340 925 0,33 %<br />
Tenet Healthcare Corp 13 699 807 0,36 %<br />
Tennant Co 8 195 042 0,42 %<br />
Tenneco Inc 3 482 696 0,36 %<br />
Teradata Corp 71 023 604 0,39 %<br />
42<br />
GOVERNMENT PENSION FUND <strong>–</strong> GLOBAL ANNUAL REPORT 2008
<strong>Government</strong> <strong>Pension</strong> <strong>Fund</strong> <strong>–</strong> <strong>Global</strong> <strong>Holding</strong> <strong>of</strong> equities at 31 December 2008<br />
Market value<br />
Voting<br />
(per cent)<br />
Teradyne Inc 18 495 785 0,37 %<br />
Terex Corp 193 919 221 1,68 %<br />
Terra Industries Inc 36 615 467 0,31 %<br />
Tesoro Corp 209 414 587 1,64 %<br />
Tessera Technologies Inc 16 026 662 0,40 %<br />
Tetra Tech Inc 43 456 855 0,43 %<br />
Tetra Technologies Inc 10 553 413 0,41 %<br />
Texas Capital Bancshares Inc 12 061 619 0,42 %<br />
Texas Industries Inc 32 142 181 0,48 %<br />
Texas Instruments Inc 922 417 633 0,65 %<br />
Texas Roadhouse Inc 10 781 732 0,31 %<br />
TFS Financial Corp 46 217 481 0,16 %<br />
Theravance Inc 122 325 206 2,69 %<br />
Thermo Fisher Scientifi c Inc 407 756 314 0,41 %<br />
thinkorswim Group Inc 10 006 337 0,38 %<br />
Thomas & Betts Corp 46 373 469 0,49 %<br />
Thor Industries Inc 19 473 900 0,38 %<br />
Thoratec Corp 41 331 196 0,32 %<br />
THQ Inc 9 449 851 0,48 %<br />
TIBCO S<strong>of</strong>tware Inc 28 964 750 0,44 %<br />
Ticketmaster Entertainment Inc 13 261 142 0,52 %<br />
Tidewater Inc 66 079 612 0,45 %<br />
Tiffany & Co 80 196 128 0,39 %<br />
Tim Hortons Inc 162 729 765 0,44 %<br />
Timberland Co 12 223 335 0,33 %<br />
Time Warner Cable Inc 213 419 349 0,16 %<br />
Time Warner Inc 1 283 346 588 0,51 %<br />
Timken Co 61 741 303 0,47 %<br />
Titan International Inc 6 731 973 0,34 %<br />
Titanium Metals Corp 21 552 975 0,19 %<br />
TiVo Inc 24 189 052 0,47 %<br />
TJX Cos Inc (162 582 368) 0,00 %<br />
TNS Inc 5 567 029 0,34 %<br />
Toll Brothers Inc 80 092 158 0,33 %<br />
TomoTherapy Inc 17 139 517 2,05 %<br />
Tompkins Financial Corp 13 127 120 0,33 %<br />
Tootsie Roll Industries Inc 22 735 386 0,36 %<br />
Torchmark Corp 89 299 655 0,34 %<br />
Toreador Resources Corp 1 036 191 0,13 %<br />
Toro Co 38 378 069 0,47 %<br />
Total System Services Inc 75 994 450 0,39 %<br />
Tower Group Inc 21 595 082 0,47 %<br />
Tractor Supply Co 37 205 290 0,41 %<br />
TradeStation Group Inc 2 922 849 0,15 %<br />
Transatlantic <strong>Holding</strong>s Inc 35 336 227 0,19 %<br />
TransDigm Group Inc 24 730 715 0,22 %<br />
Transocean Ltd 504 121 250 0,48 %<br />
Travelers Cos Inc/The 756 121 556 0,41 %<br />
Tredegar Corp 17 489 497 0,41 %<br />
TreeHouse Foods Inc 25 564 126 0,43 %<br />
Triad Guaranty Inc 66 709 0,17 %<br />
Tri-Continental Corp 25 258 611 0,36 %<br />
Trimble Navigation Ltd 199 941 033 1,11 %<br />
Trinity Industries Inc 91 914 639 1,05 %<br />
TriQuint Semiconductor Inc 11 303 098 0,32 %<br />
Triumph Group Inc 21 025 407 0,43 %<br />
True Religion Apparel Inc 8 912 002 0,42 %<br />
TrueBlue Inc 10 288 127 0,35 %<br />
Trustco <strong>Bank</strong> Corp NY 21 144 380 0,42 %<br />
Trustmark Corp 32 852 971 0,38 %<br />
TRW Automotive <strong>Holding</strong>s Corp 83 265 209 3,26 %<br />
Tsakos Energy Navigation Ltd 14 383 737 0,30 %<br />
Tupperware Brands Corp 43 991 311 0,45 %<br />
tw telecom inc 46 083 159 0,53 %<br />
Tween Brands Inc 1 957 054 0,26 %<br />
Tyco Electronics Ltd 242 628 168 0,47 %<br />
Tyco International Ltd 325 056 225 0,45 %<br />
Tyler Technologies Inc 8 463 845 0,28 %<br />
Tyson Foods Inc 420 012 274 2,23 %<br />
UAL Corp 37 803 381 0,38 %<br />
UCBH <strong>Holding</strong>s Inc 22 076 663 0,41 %<br />
UDR Inc 38 269 985 0,29 %<br />
UGI Corp 41 437 514 0,22 %<br />
UIL <strong>Holding</strong>s Corp 12 683 251 0,24 %<br />
Ulta Salon Cosmetics & Fragrance Inc 4 638 655 0,14 %<br />
Ultimate S<strong>of</strong>tware Group Inc 10 887 156 0,44 %<br />
Ultra Petroleum Corp 132 555 636 0,36 %<br />
UMB Financial Corp 42 779 519 0,30 %<br />
Umpqua <strong>Holding</strong>s Corp 25 420 880 0,42 %<br />
Under Armour Inc 20 922 013 0,34 %<br />
Unifi rst Corp/MA 10 284 850 0,34 %<br />
Union Pacifi c Corp 863 131 030 0,51 %<br />
Unisource Energy Corp 18 516 945 0,25 %<br />
Unit Corp 73 892 487 0,84 %<br />
United America Indemnity Ltd 7 292 896 0,43 %<br />
United <strong>Bank</strong>shares Inc 37 784 665 0,37 %<br />
United Community <strong>Bank</strong>s Inc/GA 16 759 446 0,37 %<br />
United Fire & Casualty Co 17 877 167 0,31 %<br />
United Natural Foods Inc 19 297 702 0,36 %<br />
United Online Inc 12 246 487 0,35 %<br />
United Parcel Service Inc 1 043 608 070 0,40 %<br />
Market value<br />
Voting<br />
(per cent)<br />
United Rentals Inc 13 444 587 0,35 %<br />
United States Steel Corp 113 020 675 0,37 %<br />
United Stationers Inc 27 201 100 0,49 %<br />
United Therapeutics Corp 109 514 610 1,08 %<br />
UnitedHealth Group Inc 1 650 410 382 0,73 %<br />
Unitrin Inc 23 862 849 0,34 %<br />
Universal American Corp/NY 11 332 380 0,27 %<br />
Universal Corp/Richmond VA 20 897 286 0,39 %<br />
Universal Display Corp 9 667 414 0,41 %<br />
Universal Forest Products Inc 11 239 076 0,31 %<br />
Universal Health Realty Income Trust 5 930 120 0,22 %<br />
Universal Health Services Inc 44 711 979 0,36 %<br />
Universal Technical Institute Inc 26 424 124 0,88 %<br />
Unum Group 199 050 737 0,46 %<br />
Urban Outfi tters Inc 34 852 599 0,20 %<br />
URS Corp 96 265 233 0,40 %<br />
Urstadt Biddle Properties Inc 4 579 528 0,02 %<br />
US Airways Group Inc 194 626 297 3,15 %<br />
US Bancorp 1 184 456 056 0,39 %<br />
US Cellular Corp 49 549 350 0,30 %<br />
USA Mobility Inc 8 525 783 0,39 %<br />
USANA Health Sciences Inc 12 026 915 0,32 %<br />
USEC Inc 67 634 952 1,93 %<br />
USG Corp 18 541 041 0,33 %<br />
UST Inc 289 401 741 0,40 %<br />
U-Store-It Trust 4 319 371 0,24 %<br />
UTi Worldwide Inc 35 398 782 0,35 %<br />
Utstarcom Inc 5 531 620 0,34 %<br />
Vail Resorts Inc 12 748 655 0,19 %<br />
Valassis Communications Inc 1 390 972 0,31 %<br />
Valeant Pharmaceuticals International 41 066 268 0,31 %<br />
Valero Energy Corp 351 309 318 0,45 %<br />
Valhi Inc 8 140 251 0,10 %<br />
Valley National Bancorp 72 300 292 0,38 %<br />
Valmont Industries Inc 37 159 900 0,33 %<br />
Valspar Corp 59 792 991 0,47 %<br />
Valueclick Inc 16 759 483 0,40 %<br />
Varian Inc 23 387 310 0,34 %<br />
Varian Medical Systems Inc 159 384 387 0,52 %<br />
Varian Semiconductor Equipment Associates Inc 34 393 722 0,37 %<br />
VASCO Data Security International Inc 7 848 640 0,29 %<br />
VCA Antech Inc 55 420 949 0,47 %<br />
Vector Group Ltd 14 899 151 0,24 %<br />
Vectren Corp 23 118 800 0,16 %<br />
Veeco Instruments Inc 4 461 306 0,31 %<br />
Venoco Inc 1 579 688 0,16 %<br />
Ventas Inc 101 061 440 0,30 %<br />
Verenium Corp 1 019 096 0,25 %<br />
VeriFone <strong>Holding</strong>s Inc 7 075 296 0,24 %<br />
Verigy Ltd 19 720 373 0,50 %<br />
VeriSign Inc 164 738 770 0,64 %<br />
Verizon Communications Inc 2 385 912 542 0,35 %<br />
Vertex Pharmaceuticals Inc 349 628 580 1,09 %<br />
VF Corp 228 721 242 0,54 %<br />
Viacom Inc 671 258 955 0,00 %<br />
Viad Corp 12 322 855 0,35 %<br />
Viasat Inc 21 435 967 0,41 %<br />
Vicor Corp 4 152 266 0,30 %<br />
Vignette Corp 5 501 597 0,35 %<br />
Virgin Media Inc 281 743 775 2,46 %<br />
Virgin Mobile USA Inc 9 645 505 2,53 %<br />
Viropharma Inc 20 382 009 0,28 %<br />
Visa Inc 729 773 085 0,44 %<br />
Vishay Intertechnology Inc 17 440 924 0,42 %<br />
VistaPrint Ltd 34 164 435 0,59 %<br />
Vivus Inc 7 517 287 0,29 %<br />
VMware Inc 49 814 352 0,34 %<br />
Vocus Inc 9 259 393 0,38 %<br />
Volcano Corp 25 909 275 0,52 %<br />
Volcom Inc 21 686 691 1,17 %<br />
Volt Information Sciences Inc 3 423 072 0,31 %<br />
Vornado Realty Trust 325 631 293 0,50 %<br />
Vulcan Materials Co 316 891 527 0,59 %<br />
W&T Offshore Inc 12 905 460 0,17 %<br />
Wabash National Corp 3 941 486 0,41 %<br />
WABCO <strong>Holding</strong>s Inc 27 811 389 0,36 %<br />
Wabtec Corp 63 266 312 0,47 %<br />
Wachovia Corp 342 729 556 0,41 %<br />
Waddell & Reed Financial Inc 36 577 317 0,40 %<br />
Walgreen Co 681 281 940 0,40 %<br />
Walt Disney Co/The 789 377 721 0,27 %<br />
Walter Industries Inc 32 293 152 0,48 %<br />
Warnaco Group Inc/The 28 125 132 0,44 %<br />
Warner Chilcott Ltd 31 687 349 0,12 %<br />
Warner Music Group Corp 6 195 075 0,19 %<br />
Warren Resources Inc 10 117 148 1,23 %<br />
Washington Federal Inc 36 181 977 0,39 %<br />
Washington Post Co/The 28 385 932 0,13 %<br />
Washington Real Estate Investment Trust 33 117 593 0,32 %<br />
Washington Trust Bancorp Inc 5 345 242 0,24 %<br />
Waste Connections Inc 80 534 125 0,46 %<br />
43<br />
GOVERNMENT PENSION FUND <strong>–</strong> GLOBAL ANNUAL REPORT 2008
<strong>Government</strong> <strong>Pension</strong> <strong>Fund</strong> <strong>–</strong> <strong>Global</strong> <strong>Holding</strong> <strong>of</strong> equities at 31 December 2008<br />
Market value<br />
Voting<br />
(per cent)<br />
Waste Management Inc 518 157 229 0,46 %<br />
Waters Corp 102 670 033 0,41 %<br />
Waterstone Financial Inc 854 634 0,12 %<br />
Watsco Inc 30 380 017 0,46 %<br />
Watson Pharmaceuticals Inc 84 650 280 0,43 %<br />
Watson Wyatt Worldwide Inc 54 692 835 0,38 %<br />
Watts Water Technologies Inc 22 019 831 0,43 %<br />
Wausau Paper Corp 17 078 739 0,44 %<br />
WD-40 Co 12 124 458 0,37 %<br />
Weatherford International Ltd 257 841 681 0,50 %<br />
Websense Inc 23 225 915 0,49 %<br />
Webster Financial Corp 70 818 346 1,39 %<br />
Weight Watchers International Inc 36 348 808 0,23 %<br />
Weingarten Realty Investors 38 915 037 0,31 %<br />
Weis Markets Inc 10 552 593 0,17 %<br />
WellCare Health Plans Inc 6 408 555 0,17 %<br />
WellPoint Inc 845 832 897 0,56 %<br />
Wells Fargo & Co 4 061 494 090 0,52 %<br />
Wendys/Arbys Group Inc 72 815 850 0,45 %<br />
Werner Enterprises Inc 98 969 797 1,15 %<br />
WesBanco Inc 21 294 075 0,42 %<br />
Wesco Financial Corp 14 052 871 0,10 %<br />
WESCO International Inc 24 716 694 0,44 %<br />
West Coast Bancorp/OR 2 093 269 0,29 %<br />
West Marine Inc 1 684 786 0,26 %<br />
West Pharmaceutical Services Inc 28 535 975 0,33 %<br />
Westamerica Bancorporation 41 520 831 0,40 %<br />
Westar Energy Inc 70 753 134 0,45 %<br />
Western Alliance Bancorp 5 447 631 0,20 %<br />
Western Digital Corp 67 675 392 0,38 %<br />
Western Refi ning Inc 8 761 619 0,24 %<br />
Western Union Co/The 684 977 716 0,95 %<br />
Westlake Chemical Corp 9 702 644 0,13 %<br />
Weyerhaeuser Co 226 028 359 0,50 %<br />
WGL <strong>Holding</strong>s Inc 17 323 508 0,15 %<br />
Whirlpool Corp 226 375 533 1,06 %<br />
White Mountains Insurance Group Ltd 92 817 043 0,48 %<br />
Whiting Petroleum Corp 67 881 387 0,68 %<br />
Whitney <strong>Holding</strong> Corp/LA 29 863 933 0,42 %<br />
Whole Foods Market Inc 76 960 752 0,83 %<br />
Willbros Group Inc 9 513 799 0,41 %<br />
Williams Cos Inc 1 028 836 352 1,75 %<br />
Williams Partners LP 8 360 507 0,19 %<br />
Williams-Sonoma Inc (13 352 187) 0,00 %<br />
Willis Group <strong>Holding</strong>s Ltd 132 857 919 0,46 %<br />
Wilmington Trust Corp 41 755 780 0,39 %<br />
Wilshire Bancorp Inc 4 014 319 0,21 %<br />
Wind River Systems Inc 20 775 393 0,43 %<br />
Windstream Corp 103 073 940 0,36 %<br />
Winn-Dixie Stores Inc 21 956 713 0,36 %<br />
Winnebago Industries 5 150 996 0,42 %<br />
Wintrust Financial Corp 15 268 671 0,45 %<br />
Wisconsin Energy Corp 64 082 756 0,19 %<br />
WMS Industries Inc 31 483 411 0,33 %<br />
Wolverine World Wide Inc 35 469 476 0,49 %<br />
Woodward Governor Co 50 525 936 0,46 %<br />
World Acceptance Corp 9 352 822 0,42 %<br />
World Fuel Services Corp 29 342 622 0,39 %<br />
Worthington Industries Inc 22 226 843 0,37 %<br />
WP Carey & Co LLC 10 045 837 0,15 %<br />
WR Berkley Corp (31 512 860) 0,00 %<br />
WR Grace & Co 12 461 587 0,41 %<br />
Wright Express Corp 13 538 174 0,40 %<br />
Wright Medical Group Inc 8 447 131 0,16 %<br />
WSFS Financial Corp 7 574 470 0,36 %<br />
WW Grainger Inc 192 521 474 0,46 %<br />
Wyeth 2 487 789 460 0,71 %<br />
Wyndham Worldwide Corp 36 184 668 0,44 %<br />
Wynn Resorts Ltd 181 937 125 0,55 %<br />
Xcel Energy Inc 278 669 739 0,48 %<br />
XenoPort Inc 55 177 852 1,24 %<br />
Xerium Technologies Inc 288 763 0,14 %<br />
Xerox Corp 220 640 864 0,46 %<br />
Xilinx Inc 367 547 119 1,08 %<br />
XL Capital Ltd 49 045 948 0,57 %<br />
XTO Energy Inc 765 631 332 0,54 %<br />
Xyratex Ltd 550 653 0,09 %<br />
Yahoo! Inc 400 097 127 0,34 %<br />
YRC Worldwide Inc 3 627 594 0,30 %<br />
Yum! Brands Inc 596 441 528 0,58 %<br />
Zale Corp 3 328 827 0,45 %<br />
Zebra Technologies Corp 41 166 950 0,46 %<br />
Zenith National Insurance Corp 27 723 554 0,34 %<br />
Zep Inc 11 266 690 0,38 %<br />
Zimmer <strong>Holding</strong>s Inc 256 219 029 0,40 %<br />
Zions Bancorporation 70 692 085 0,36 %<br />
Zoll Medical Corp 8 495 813 0,30 %<br />
Zoltek Cos Inc 9 006 159 0,42 %<br />
Zoran Corp 10 765 929 0,44 %<br />
Zumiez Inc 4 779 312 0,31 %<br />
Zymogenetics Inc 636 176 0,04 %<br />
Market value<br />
Voting<br />
(per cent)<br />
AAON Inc 8 224 405 0,33 %<br />
AAR Corp 24 997 194 0,50 %<br />
Aaron Rents Inc 37 442 277 0,44 %<br />
VIRGIN ISLANDS (BRITISH)<br />
Jetion <strong>Holding</strong>s Ltd 2 808 768 1,23 %<br />
44<br />
GOVERNMENT PENSION FUND <strong>–</strong> GLOBAL ANNUAL REPORT 2008