Thinking Graphically - Biology Courses Server
Thinking Graphically - Biology Courses Server
Thinking Graphically - Biology Courses Server

You also want an ePaper? Increase the reach of your titles
YUMPU automatically turns print PDFs into web optimized ePapers that Google loves.
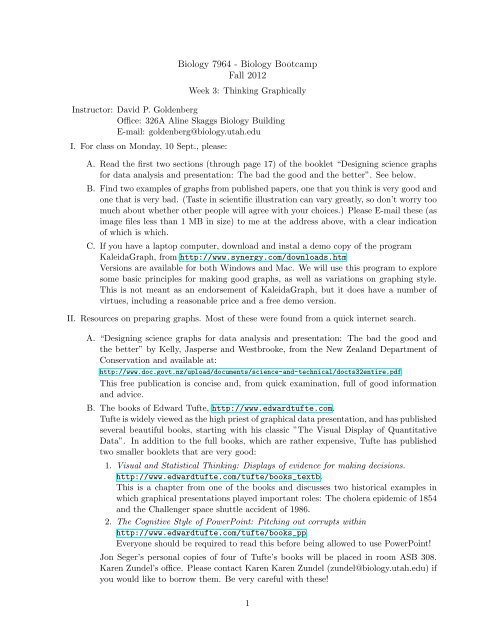
<strong>Biology</strong> 7964 - <strong>Biology</strong> Bootcamp<br />
Fall 2012<br />
Week 3: <strong>Thinking</strong> <strong>Graphically</strong><br />
Instructor: David P. Goldenberg<br />
Office: 326A Aline Skaggs <strong>Biology</strong> Building<br />
E-mail: goldenberg@biology.utah.edu<br />
I. For class on Monday, 10 Sept., please:<br />
A. Read the first two sections (through page 17) of the booklet “Designing science graphs<br />
for data analysis and presentation: The bad the good and the better”. See below.<br />
B. Find two examples of graphs from published papers, one that you think is very good and<br />
one that is very bad. (Taste in scientific illustration can vary greatly, so don’t worry too<br />
much about whether other people will agree with your choices.) Please E-mail these (as<br />
image files less than 1 MB in size) to me at the address above, with a clear indication<br />
of which is which.<br />
C. If you have a laptop computer, download and instal a demo copy of the program<br />
KaleidaGraph, from http://www.synergy.com/downloads.htm<br />
Versions are available for both Windows and Mac. We will use this program to explore<br />
some basic principles for making good graphs, as well as variations on graphing style.<br />
This is not meant as an endorsement of KaleidaGraph, but it does have a number of<br />
virtues, including a reasonable price and a free demo version.<br />
II. Resources on preparing graphs. Most of these were found from a quick internet search.<br />
A. “Designing science graphs for data analysis and presentation: The bad the good and<br />
the better” by Kelly, Jasperse and Westbrooke, from the New Zealand Department of<br />
Conservation and available at:<br />
http://www.doc.govt.nz/upload/documents/science-and-technical/docts32entire.pdf<br />
This free publication is concise and, from quick examination, full of good information<br />
and advice.<br />
B. The books of Edward Tufte, http://www.edwardtufte.com.<br />
Tufte is widely viewed as the high priest of graphical data presentation, and has published<br />
several beautiful books, starting with his classic ”The Visual Display of Quantitative<br />
Data”. In addition to the full books, which are rather expensive, Tufte has published<br />
two smaller booklets that are very good:<br />
1. Visual and Statistical <strong>Thinking</strong>: Displays of evidence for making decisions.<br />
http://www.edwardtufte.com/tufte/books_textb.<br />
This is a chapter from one of the books and discusses two historical examples in<br />
which graphical presentations played important roles: The cholera epidemic of 1854<br />
and the Challenger space shuttle accident of 1986.<br />
2. The Cognitive Style of PowerPoint: Pitching out corrupts within<br />
http://www.edwardtufte.com/tufte/books_pp<br />
Everyone should be required to read this before being allowed to use PowerPoint!<br />
Jon Seger’s personal copies of four of Tufte’s books will be placed in room ASB 308.<br />
Karen Zundel’s office. Please contact Karen Karen Zundel (zundel@biology.utah.edu) if<br />
you would like to borrow them. Be very careful with these!<br />
1
C. ”The Top Ten Worst Graphs” at http://www.biostat.wisc.edu/~kbroman/topten_<br />
worstgraphs/<br />
Do you agree? Do not use one of these for the class assignment!<br />
D. ”Visionlearning” http://www.visionlearning.com/library/module_viewer.php?mid=<br />
156&l=<br />
This page on graphing is part of an NSF-supported resource for science education. It’s<br />
not so clear what audience this is meant for, but it looks quite good.<br />
E. ”LabWrite Resources” http://www.ncsu.edu/labwrite/res/res-homepage.htm<br />
This also is an NSF-supported resource, directed towards students preparing lab reports.<br />
III. Software for scientific graphing and data analysis. There are many programs available for<br />
making graphs, both commercial and free. So far as I can tell, there is no free program that<br />
has all of the features and convenience of some of the commercial products, and different<br />
programs have different strengths. The following are programs that I am familiar with and<br />
that you may find useful. All of the commercial products are available as free trial versions.<br />
A. Microsoft Excel (Commercial, of course, but available free to students) Some would gag<br />
at the suggestion that Excel be used to make scientific graphs, and it is not something<br />
I do or encourage. But, Excel is ubiquitous, and with care it can be used to make<br />
graphs suitable for scientific publications. The booklet ”Designing science graphs for<br />
data analysis and presentation” includes an appendix describing how to turn Excel’s<br />
default charts into respectable graphs.<br />
B. KaleidaGraph (Commercial, about $140 for academic use). Available for both Windows<br />
and Mac computers. This program combines a relatively simple user interface with the<br />
ability generate and fine tune the various standard graph types. It also has moderately<br />
powerful data processing tools and excellent tools for curve fitting, including non-linear<br />
least-squares fitting to user-defined functions. A limitation is that KaleidaGraph cannot<br />
generate 3-dimensional graphs.<br />
http://www.synergy.com.<br />
C. Igor Pro (Commercial, $435 for academic use). Available for both Windows and Mac<br />
computers. This is a major step up from KaleidaGraph, in price, capabilities and complexity.<br />
The learning curve is somewhat steeper than for simpler programs, but this<br />
comes with more flexibility and more sophisticated data processing and analysis. Igor<br />
Pro has its own macro programming language, which is quite powerful, but I don’t find<br />
it particularly elegant or easy to work with.<br />
http://www.wavemetrics.com<br />
D. DeltaGraph (Commercial, $199 for academic use). Available for both Windows and Mac<br />
computers. I have not used this much, but it seems roughly comparable to KaleidaGraph,<br />
but with the ability to make 3-dimensional graphs and generally flashier graphics.<br />
http://www.redrocksw.com.<br />
E. Origin and Origin Pro (Commercial, a one-year student license is available for $69). For<br />
Windows only. I have relatively little experience with this program, but my impression<br />
is that it has capabilities similar to those of Igor Pro.<br />
http://www.originlab.com<br />
2
F. SigmaPlot (Commercial, $549 for academic use). For windows only. Again, I have<br />
limited experience with this program. Its capabilities seem similar to those of Kaleida-<br />
Graph.<br />
http://www.sigmaplot.com<br />
G. Plot (free). For the Mac only. This is a quite polished and capable program, though it<br />
does seem to have a slightly complicated interface. If I were not already a heavy user of<br />
other programs, I would give this a serious try.<br />
http://plot.micw.eu/<br />
H. MjoGraph (Free). For Windows and Mac. This is a simple, cleverly designed program<br />
that plots data from plain text files (which can be generated in a word processor or text<br />
editor, or from another data-handling program). Though not as feature laden as most<br />
other graphing programs, it has considerable flexibility for manipulating the appearance<br />
of the graphs. Unfortunately, it seems to be broken on my Mac with OS X 10.7.<br />
http://www.ochiailab.dnj.ynu.ac.jp/mjograph/<br />
I. GnuPlot (Free, open source) Can be compiled on almost any computer, and pre-compiled<br />
binaries are available from various sources. This program is run from a terminal command<br />
line or from scripts, making it somewhat less user-friendly than programs with<br />
graphical interfaces. However, GnuPlot produces excellent graphs, and working from<br />
a command line or scripts can, for some purposes, actually be more efficient than a<br />
graphical interface. The 3-dimensional surface and contour graphs are particularly nice.<br />
It also includes curve-fitting tools, though I have not used them.<br />
http://www.gnuplot.info/<br />
J. QtiPlot and SciDAVis (free, open source) Source code and binaries available for Windows,<br />
Mac and Linux systems. These are two ”branches” of an open source project that<br />
apparently suffered from conflicts between developers with different philosophies and<br />
motivations. They might be the closest thing available to a free, full featured graphing<br />
and analysis program with a graphical user interface. QtiPlot is, as I understand it, the<br />
original project. At some point, the author, Ion Vasilief, decided to provide the compiled<br />
binaries along with support for a fee. This is consistent with open-source licenses, but it<br />
apparently led to dispute with other developers, who started a new project, SciDAVis.<br />
QtiPlot binaires can be obtained from other sources. I have played with these a bit, and<br />
they seem quite promising. But, both are still buggy, and the development, at least for<br />
SciDAVis, is not very active. The compiled SciDAVis binary available at the site below,<br />
seems to work on my Mac with OS X 10.7 (Lion), but not on one running 10.6.8 (Snow<br />
Leopard). I don’t have experience with other versions or operating systems. Compiling<br />
these yourself is not for the faint of heart.<br />
QtiPlot: http://soft.proindependent.com/<br />
SciDAVis: http://scidavis.sourceforge.net/<br />
K. R (Free, open source) Available for all major operating systems. R is described by the<br />
developers as ”a free software environment for statistical computing and graphics”. It<br />
appears to be gaining rapid popularity among scientists who rely heavily on statistical<br />
methods, including ecologists in the <strong>Biology</strong> Department. It can produce excellent<br />
graphs, though perhaps not as easily as with dedicated graphing programs.<br />
http://www.r-project.org/<br />
L. MatPlotLib for Python (Free, open source). Available for all major operating systems.<br />
If you are using the Python computer language to generate, process or analyze data,<br />
3
MatPlotLib provides a means of directly generating very nice graphs directly from a<br />
Python program. The learning curve is pretty steep, however, and this is far from the<br />
easiest way to make a simple plot from a small data set. For a complete installation of<br />
Python and associated software for scientific computing, the best source is the Enthought<br />
Python Distribution, which is available free for academic use.<br />
http://www.enthought.com/products/epd.php<br />
IV. Un-graphing software. Every once in a while, it is useful to be able to extract numerical data<br />
from a graph; for instance, if you want to reanalyze published data. The first program that<br />
I heard about for doing this is called UnGraph and is still available, but expensive ($300).<br />
There are a number of other inexpensive or free alternatives, and these are just a few that I<br />
found with an internet search.<br />
A. GraphClick (Commercial, $8 for full-featured version). For Mac only. Nice interface and<br />
easy to use. This is the program I use for un-graphing.<br />
http://www.arizona-software.ch/graphclick/tour.html?page=4<br />
B. Enguage Digitizer (Free, open source). For Windows only. I haven’t tried it.<br />
http://digitizer.sourceforge.net/<br />
C. Plot Digitizer (Free, open source). Java program with executables for Mac, Windows<br />
and Linux. I haven’t tried it.<br />
http://plotdigitizer.sourceforge.net/<br />
D. WebPlotDigitizer (Free) As the name implies, this is a web application. I played with<br />
this just a little bit, and it looks pretty neat.<br />
http://arohatgi.info/WebPlotDigitizer/app/<br />
E. ImageJ (Free, open source) Java program with executables for Mac, Windows and Linux.<br />
ImageJ is a very powerful image analysis program that every scientist should be familiar<br />
with. Digitizing a graph is just one thing it can be used for. For this application, use<br />
the Figure Calibration plug-in.<br />
ImageJ: http://rsbweb.nih.gov/ij/<br />
Calibration plug-in:<br />
http://www.astro.physik.uni-goettingen.de/~hessman/ImageJ/Figure_Calibration/<br />
Step-by-step instructions:<br />
http://lukemiller.org/index.php/2011/09/digitizing-data-from-old-figures-with-imagej/<br />
4