

Objective Capital Research Report_Summary - Tinci Holdings Limited
Objective Capital Research Report_Summary - Tinci Holdings Limited
Objective Capital Research Report_Summary - Tinci Holdings Limited

Create successful ePaper yourself
Turn your PDF publications into a flip-book with our unique Google optimized e-Paper software.
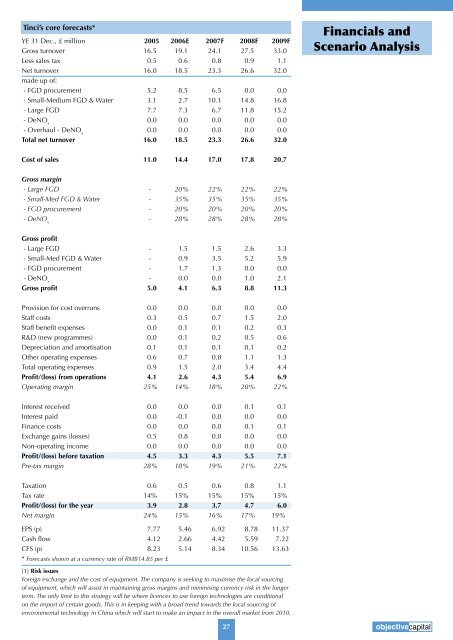
<strong>Tinci</strong>’s core forecasts*<br />
YE 31 Dec., £ million 2005 2006E 2007F 2008F 2009F<br />
Gross turnover 16.5 19.1 24.1 27.5 33.0<br />
Less sales tax 0.5 0.6 0.8 0.9 1.1<br />
Net turnover 16.0 18.5 23.3 26.6 32.0<br />
made up of:<br />
- FGD procurement 5.2 8.5 6.5 0.0 0.0<br />
- Small-Medium FGD & Water 3.1 2.7 10.1 14.8 16.8<br />
- Large FGD 7.7 7.3 6.7 11.8 15.2<br />
- DeNO x 0.0 0.0 0.0 0.0 0.0<br />
- Overhaul - DeNO x 0.0 0.0 0.0 0.0 0.0<br />
Total net turnover 16.0 18.5 23.3 26.6 32.0<br />
Cost of sales 11.0 14.4 17.0 17.8 20.7<br />
Gross margin<br />
- Large FGD - 20% 22% 22% 22%<br />
- Small-Med FGD & Water - 35% 35% 35% 35%<br />
- FGD procurement - 20% 20% 20% 20%<br />
- DeNO x - 28% 28% 28% 28%<br />
Gross profit<br />
- Large FGD - 1.5 1.5 2.6 3.3<br />
- Small-Med FGD & Water - 0.9 3.5 5.2 5.9<br />
- FGD procurement - 1.7 1.3 0.0 0.0<br />
- DeNO x - 0.0 0.0 1.0 2.1<br />
Gross profit 5.0 4.1 6.3 8.8 11.3<br />
Provision for cost overruns 0.0 0.0 0.0 0.0 0.0<br />
Staff costs 0.3 0.5 0.7 1.5 2.0<br />
Staff benefit expenses 0.0 0.1 0.1 0.2 0.3<br />
R&D (new programmes) 0.0 0.1 0.2 0.5 0.6<br />
Depreciation and amortisation 0.1 0.1 0.1 0.1 0.2<br />
Other operating expenses 0.6 0.7 0.8 1.1 1.3<br />
Total operating expenses 0.9 1.5 2.0 3.4 4.4<br />
Profit/(loss) from operations 4.1 2.6 4.3 5.4 6.9<br />
Operating margin 25% 14% 18% 20% 22%<br />
Interest received 0.0 0.0 0.0 0.1 0.1<br />
Interest paid 0.0 -0.1 0.0 0.0 0.0<br />
Finance costs 0.0 0.0 0.0 0.1 0.1<br />
Exchange gains (losses) 0.5 0.8 0.0 0.0 0.0<br />
Non-operating income 0.0 0.0 0.0 0.0 0.0<br />
Profit/(loss) before taxation 4.5 3.3 4.3 5.5 7.1<br />
Pre-tax margin 28% 18% 19% 21% 22%<br />
Taxation 0.6 0.5 0.6 0.8 1.1<br />
Tax rate 14% 15% 15% 15% 15%<br />
Profit/(loss) for the year 3.9 2.8 3.7 4.7 6.0<br />
Net margin 24% 15% 16% 17% 19%<br />
EPS (p) 7.77 5.46 6.92 8.78 11.37<br />
Cash flow 4.12 2.66 4.42 5.59 7.22<br />
CFS (p) 8.23 5.14 8.34 10.56 13.63<br />
* Forecasts shown at a currency rate of RMB14.85 per £<br />
[1] Risk issues<br />
Foreign exchange and the cost of equipment. The company is seeking to maximise the local sourcing<br />
of equipment, which will assist in maintaining gross margins and minimising currency risk in the longer<br />
term. The only limit to this strategy will be where licences to use foreign technologies are conditional<br />
on the import of certain goods. This is in keeping with a broad trend towards the local sourcing of<br />
environmental technology in China which will start to make an impact in the overall market from 2010.<br />
Financials and<br />
Scenario Analysis<br />
27 objectivecapital