

Objective Capital Research Report_Summary - Tinci Holdings Limited
Objective Capital Research Report_Summary - Tinci Holdings Limited
Objective Capital Research Report_Summary - Tinci Holdings Limited

You also want an ePaper? Increase the reach of your titles
YUMPU automatically turns print PDFs into web optimized ePapers that Google loves.
<strong>Tinci</strong> valuation scenarios<br />
<strong>Tinci</strong> emerges as a top 3 player in the consolidation period post 2010-2015<br />
Best Case Scenario RMB £<br />
Equity Value (m) 915.7 59.8<br />
Value per share 17.29 1.13<br />
- Implied Forecast P/Sales 1.4<br />
- Implied Forecast EV/EBIT 11.2<br />
- Implied Forecast PE 12.7<br />
Core Scenario RMB £<br />
Equity Value (m) 693.8 45.3<br />
Value per share 13.10 0.86<br />
- Implied Forecast P/Sales 2.0<br />
- Implied Forecast EV/EBIT 11.4<br />
- Implied Forecast PE 12.7<br />
Worst Case Scenario RMB £<br />
Equity Value (m) 640.3 41.8<br />
Value per share 12.09 0.79<br />
- Implied Forecast P/Sales 1.1<br />
- Implied Forecast EV/EBIT 9.1<br />
- Implied Forecast PE 10.1<br />
<strong>Tinci</strong> maintains it current share in the consolidation period post 2010-2015<br />
RMB £<br />
Equity Value (m) 499.1 32.6<br />
Value per share 9.43 0.62<br />
- Implied Forecast P/Sales 1.4<br />
- Implied Forecast EV/EBIT 7.1<br />
- Implied Forecast PE 7.9<br />
See page 29 for detailed assumptions for each scenario<br />
Comparatives<br />
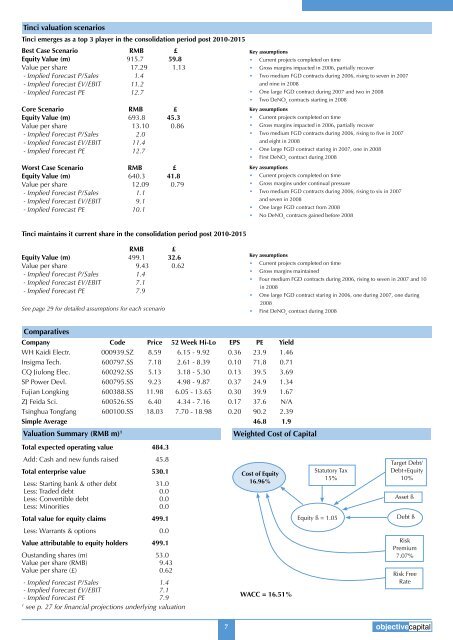
Valuation <strong>Summary</strong> (RMB m) 1<br />
Total expected operating value 484.3<br />
Add: Cash and new funds raised 45.8<br />
Total enterprise value 530.1<br />
Less: Starting bank & other debt 31.0<br />
Less: Traded debt 0.0<br />
Less: Convertible debt 0.0<br />
Less: Minorities 0.0<br />
Total value for equity claims 499.1<br />
Less: Warrants & options 0.0<br />
Value attributable to equity holders 499.1<br />
Oustanding shares (m) 53.0<br />
Value per share (RMB) 9.43<br />
Value per share (£) 0.62<br />
- Implied Forecast P/Sales 1.4<br />
- Implied Forecast EV/EBIT 7.1<br />
- Implied Forecast PE 7.9<br />
1 see p. 27 for financial projections underlying valuation<br />
Key assumptions<br />
Company Code Price 52 Week Hi-Lo EPS PE Yield<br />
WH Kaidi Electr. 000939.SZ 8.59 6.15 - 9.92 0.36 23.9 1.46<br />
Insigma Tech. 600797.SS 7.18 2.61 - 8.39 0.10 71.8 0.71<br />
CQ Jiulong Elec. 600292.SS 5.13 3.18 - 5.30 0.13 39.5 3.69<br />
SP Power Devl. 600795.SS 9.23 4.98 - 9.87 0.37 24.9 1.34<br />
Fujian Longking 600388.SS 11.98 6.05 - 13.65 0.30 39.9 1.67<br />
ZJ Feida Sci. 600526.SS 6.40 4.34 - 7.16 0.17 37.6 N/A<br />
Tsinghua Tongfang 600100.SS 18.03 7.70 - 18.98 0.20 90.2 2.39<br />
Simple Average 46.8 1.9<br />
• Current projects completed on time<br />
• Gross margins impacted in 2006, partially recover<br />
• Two medium FGD contracts during 2006, rising to seven in 2007<br />
and nine in 2008<br />
• One large FGD contract during 2007 and two in 2008<br />
• Two DeNO x contracts starting in 2008<br />
Key assumptions<br />
• Current projects completed on time<br />
• Gross margins impacted in 2006, partially recover<br />
• Two medium FGD contracts during 2006, rising to five in 2007<br />
and eight in 2008<br />
• One large FGD contract staring in 2007, one in 2008<br />
• First DeNO x contract during 2008<br />
Key assumptions<br />
• Current projects completed on time<br />
• Gross margins under continual pressure<br />
• Two medium FGD contracts during 2006, rising to six in 2007<br />
and seven in 2008<br />
• One large FGD contract from 2008<br />
• No DeNO x contracts gained before 2008<br />
Key assumptions<br />
• Current projects completed on time<br />
• Gross margins maintained<br />
• Four medium FGD contracts during 2006, rising to seven in 2007 and 10<br />
in 2008<br />
• One large FGD contract staring in 2006, one during 2007, one during<br />
2008<br />
• First DeNO x contract during 2008<br />
Weighted Cost of <strong>Capital</strong><br />
Cost of Equity<br />
16.96%<br />
WACC = 16.51%<br />
Statutory Tax<br />
15%<br />
Equity ß = 1.05<br />
Target Debt/<br />
Debt+Equity<br />
10%<br />
Asset ß<br />
Debt ß<br />
Risk<br />
Premium<br />
7.07%<br />
Risk Free<br />
Rate<br />
7 objectivecapital