CARBON DISCLOSURE PROJECT - EDP
CARBON DISCLOSURE PROJECT - EDP
CARBON DISCLOSURE PROJECT - EDP

You also want an ePaper? Increase the reach of your titles
YUMPU automatically turns print PDFs into web optimized ePapers that Google loves.
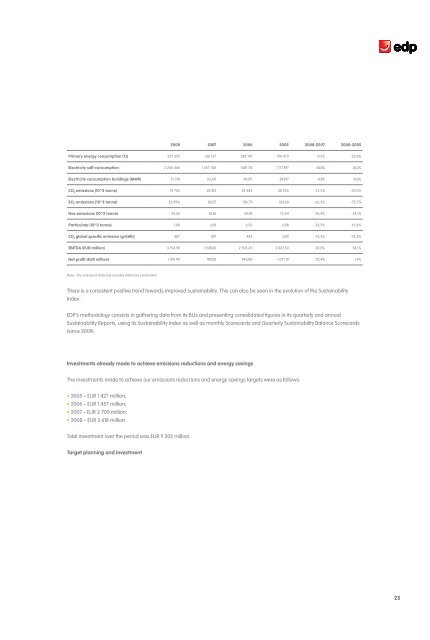
2008 2007 2006 2005 2008-2007 2008-2005<br />
primary energy consumption (TJ) 237 259 261 157 282 147 310 473 -9,2% -23,6%<br />
Electricity self-consumption 2 244 466 1 457 748 1 687 714 1 777 497 54,0% 26,3%<br />
Electricity consumption buildings (mWh) 31 138 33,411 24 597 28 297 -6,8% 10,0%<br />
CO 2 emissions (10^3 tonne) 19 783 23 422 24 484 28 255 -15,5% -30,0%<br />
SO 2 emissions (10^3 tonne) 33,99% 100,75 106,79 124,60 -66,3% -72,7%<br />
Nox emissions (10^3 tonne) 33,26 52,26 59,98 72,44 -36,4% -54,1%<br />
particulate (10^3 tonne) 1,68 3,69 4,03 4,88 -54,5% -65,6%<br />
CO 2 global specific emission (g/kWh) 387 457 485 600 -15,3% -35,5%<br />
EBITdA (Eur million) 3 154,90 2 628,30 2 305,40 2 047,50 20,0% 54,1%<br />
Net profit (Eur million) 1 091,90 907,30 940,80 1 071,10 20,4% 1,9%<br />
Note – The emissions data only includes stationary combustion.<br />
There is a consistent positive trend towards improved sustainability. This can also be seen in the evolution of the Sustainability<br />
Index.<br />
<strong>EDP</strong>’s methodology consists in gathering data from its BUs and presenting consolidated figures in its quarterly and annual<br />
Sustainability Reports, using its Sustainability Index as well as monthly Scorecards and Quarterly Sustainability Balance Scorecards<br />
(since 2009).<br />
Investments already made to achieve emissions reductions and energy savings<br />
The investments made to achieve our emissions reductions and energy savings targets were as follows:<br />
• 2005 – EUR 1 427 million;<br />
• 2006 – EUR 1 457 million;<br />
• 2007 – EUR 2 700 million;<br />
• 2008 – EUR 3 618 million.<br />
Total investment over the period was EUR 9 202 million.<br />
Target planning and investment<br />
25