- Page 1 and 2:
County of San Luis Obispo San Luis
- Page 3 and 4:
County of San Luis Obispo 2012-13 P
- Page 5 and 6:
County of San Luis Obispo 2012-13 P
- Page 7 and 8:
County of San Luis Obispo 2012-13 P
- Page 9 and 10:
The Budget Gap The budget gap for a
- Page 11 and 12:
All Funds Expenditure Comparison Fu
- Page 13 and 14:
Recommended Staffing The Proposed B
- Page 15 and 16:
proposed for elimination due to the
- Page 17 and 18:
ecommended to increase $845,260 or
- Page 19 and 20:
Social Services: The overall level
- Page 21 and 22:
Indigent Medical Care Funding for i
- Page 23 and 24:
Reprographics Reprographics is an I
- Page 25 and 26:
In total, at the end of FY 2011-12,
- Page 27 and 28:
County of San Luis Obispo 2012-13 P
- Page 29 and 30:
County of San Luis Obispo 2012-13 P
- Page 31 and 32:
County of San Luis Obispo 2012-13 P
- Page 33 and 34:
County of San Luis Obispo 2012-13 P
- Page 35 and 36:
County of San Luis Obispo 2012-13 P
- Page 37 and 38:
County of San Luis Obispo 2012-13 P
- Page 39 and 40:
County of San Luis Obispo 2012-13 P
- Page 41 and 42:
County of San Luis Obispo 2012-13 P
- Page 43 and 44:
County of San Luis Obispo 2012-13 P
- Page 45 and 46:
County of San Luis Obispo 2012-13 P
- Page 47 and 48:
County of San Luis Obispo 2012-13 P
- Page 49 and 50:
County of San Luis Obispo 2012-13 P
- Page 51 and 52:
County of San Luis Obispo 2012-13 P
- Page 53 and 54:
County of San Luis Obispo 2012-13 P
- Page 55 and 56:
County of San Luis Obispo 2012-13 P
- Page 57 and 58:
County of San Luis Obispo 2012-13 P
- Page 59 and 60:
County of San Luis Obispo 2012-13 P
- Page 61 and 62:
County of San Luis Obispo 2012-13 P
- Page 63 and 64:
County of San Luis Obispo 2012-13 P
- Page 65 and 66:
County of San Luis Obispo 2012-13 P
- Page 67 and 68:
County of San Luis Obispo 2012-13 P
- Page 69 and 70:
County of San Luis Obispo 2012-13 P
- Page 71 and 72:
County of San Luis Obispo 2012-13 P
- Page 73 and 74:
County of San Luis Obispo 2012-13 P
- Page 75 and 76:
County of San Luis Obispo 2012-13 P
- Page 77 and 78:
County of San Luis Obispo 2012-13 P
- Page 79 and 80:
County of San Luis Obispo 2012-13 P
- Page 81 and 82:
County of San Luis Obispo 2012-13 P
- Page 83 and 84:
County of San Luis Obispo 2012-13 P
- Page 85 and 86:
County of San Luis Obispo 2012-13 P
- Page 87 and 88:
County of San Luis Obispo 2012-13 P
- Page 89 and 90:
MAJOR COUNTY PAID EMPLOYEE BENEFITS
- Page 91 and 92:
County of San Luis Obispo 2012-13 P
- Page 93 and 94:
County of San Luis Obispo 2012-13 P
- Page 95 and 96:
County of San Luis Obispo 2012-13 P
- Page 97 and 98:
County of San Luis Obispo 2012-13 P
- Page 99 and 100:
County of San Luis Obispo 2012-13 P
- Page 101 and 102:
County of San Luis Obispo 2012-13 P
- Page 103 and 104:
County of San Luis Obispo 2012-13 P
- Page 105 and 106:
County of San Luis Obispo 2012-13 P
- Page 107 and 108:
County of San Luis Obispo 2012-13 P
- Page 109 and 110:
Agricultural Commissioner Fund Cent
- Page 111 and 112:
Agricultural Commissioner Fund Cent
- Page 113 and 114:
Agricultural Commissioner Fund Cent
- Page 115 and 116:
Agricultural Commissioner Fund Cent
- Page 117 and 118:
Planning and Building Fund Center 1
- Page 119 and 120:
Planning and Building Fund Center 1
- Page 121 and 122:
Planning and Building Fund Center 1
- Page 123 and 124:
Planning and Building Fund Center 1
- Page 125 and 126:
Planning and Building Fund Center 1
- Page 127 and 128:
Community Development Fund Center 2
- Page 129 and 130:
Community Development Fund Center 2
- Page 131 and 132:
Public Works Fund Center 405 Fiscal
- Page 133 and 134:
Public Works Fund Center 405 Fiscal
- Page 135 and 136:
Public Works Fund Center 405 Fiscal
- Page 137 and 138:
Public Works Fund Center 405 Fiscal
- Page 139 and 140:
Public Works Special Services Fund
- Page 141 and 142:
Public Works Special Services Fund
- Page 143 and 144:
Public Works Special Services Fund
- Page 145 and 146:
Employees Roads Fund Center 245 Fis
- Page 147 and 148:
Roads Fund Center 245 Fiscal Year 2
- Page 149 and 150:
Roads Fund Center 245 Fiscal Year 2
- Page 151 and 152:
Road Impact Fees Fund Center 248 Fi
- Page 153 and 154:
County of San Luis Obispo 2012-13 P
- Page 155 and 156:
Animal Services Fund Center 137 Fis
- Page 157 and 158:
Animal Services Fund Center 137 Fis
- Page 159 and 160:
Animal Services Fund Center 137 Fis
- Page 161 and 162:
Child Support Services Fund Center
- Page 163 and 164:
Child Support Services Fund Center
- Page 165 and 166:
Contributions to Court Operations F
- Page 167 and 168:
County Fire Fund Center 140 Fiscal
- Page 169 and 170:
County Fire Fund Center 140 Fiscal
- Page 171 and 172:
County Fire Fund Center 140 Fiscal
- Page 173 and 174:
County Fire Fund Center 140 Fiscal
- Page 175 and 176:
Employees District Attorney Fund Ce
- Page 177 and 178:
District Attorney Fund Center 132 F
- Page 179 and 180:
District Attorney Fund Center 132 F
- Page 181 and 182:
District Attorney Fund Center 132 F
- Page 183 and 184:
District Attorney Fund Center 132 F
- Page 185 and 186:
Emergency Services Fund Center 138
- Page 187 and 188:
Emergency Services Fund Center 138
- Page 189 and 190:
Emergency Services Fund Center 138
- Page 191 and 192:
Grand Jury Fund Center 131 Fiscal Y
- Page 193 and 194:
Probation Fund Center 139 Fiscal Ye
- Page 195 and 196:
Probation Fund Center 139 Fiscal Ye
- Page 197 and 198:
Probation Fund Center 139 Fiscal Ye
- Page 199 and 200:
Public Defender Fund Center 135 Fis
- Page 201 and 202:
Public Defender Fund Center 135 Fis
- Page 203 and 204:
Employees Sheriff - Coroner Fund Ce
- Page 205 and 206:
Sheriff - Coroner Fund Center 136 F
- Page 207 and 208:
Sheriff - Coroner Fund Center 136 F
- Page 209 and 210:
Sheriff - Coroner Fund Center 136 F
- Page 211 and 212:
Sheriff - Coroner Fund Center 136 F
- Page 213 and 214:
Employees Waste Management Fund Cen
- Page 215 and 216:
Waste Management Fund Center 130 Fi
- Page 217 and 218:
Waste Management Fund Center 130 Fi
- Page 219 and 220:
County of San Luis Obispo 2012-13 P
- Page 221 and 222:
Contributions to Other Agencies Fun
- Page 223 and 224:
Contributions to Other Agencies Fun
- Page 225 and 226:
Contributions to Other Agencies Fun
- Page 227 and 228:
Contributions to Other Agencies Fun
- Page 229 and 230:
Behavioral Health Fund Center 166 F
- Page 231 and 232:
Behavioral Health Fund Center 166 F
- Page 233 and 234:
Behavioral Health Fund Center 166 F
- Page 235 and 236:
Behavioral Health Fund Center 166 F
- Page 237 and 238:
Behavioral Health Fund Center 166 F
- Page 239 and 240:
County Medical Services Program (CM
- Page 241 and 242:
County Medical Services Program (CM
- Page 243 and 244:
Employees Driving Under the Influen
- Page 245 and 246:
Driving Under the Influence (DUI) P
- Page 247 and 248:
Driving Under the Influence (DUI) P
- Page 249 and 250:
Emergency Medical Services Fund Cen
- Page 251 and 252:
Law Enforcement Medical Care (LEMC)
- Page 253 and 254:
Law Enforcement Medical Care (LEMC)
- Page 255 and 256:
Medical Assistance Program Fund Cen
- Page 257 and 258:
Employees Public Health Fund Center
- Page 259 and 260:
Public Health Fund Center 160 Fisca
- Page 261 and 262: Public Health Fund Center 160 Fisca
- Page 263 and 264: Public Health Fund Center 160 Fisca
- Page 265 and 266: Public Health Fund Center 160 Fisca
- Page 267 and 268: Public Health Fund Center 160 Fisca
- Page 269 and 270: Social Services Fund Center 180 Fis
- Page 271 and 272: Social Services Fund Center 180 Fis
- Page 273 and 274: Social Services Fund Center 180 Fis
- Page 275 and 276: Social Services Fund Center 180 Fis
- Page 277 and 278: Social Services Fund Center 180 Fis
- Page 279 and 280: CalWORKS Fund Center 182 Fiscal Yea
- Page 281 and 282: Foster Care Fund Center 181 Fiscal
- Page 283 and 284: Foster Care Fund Center 181 Fiscal
- Page 285 and 286: General Assistance Fund Center 185
- Page 287 and 288: Veterans Services Fund Center 186 F
- Page 289 and 290: Veterans Services Fund Center 186 F
- Page 291 and 292: Veterans Services Fund Center 186 F
- Page 293 and 294: Airports Fund Center 425 Fiscal Yea
- Page 295 and 296: Airports Fund Center 425 Fiscal Yea
- Page 297 and 298: Airports Fund Center 425 Fiscal Yea
- Page 299 and 300: Employees Farm Advisor Fund Center
- Page 301 and 302: Farm Advisor Fund Center 215 Fiscal
- Page 303 and 304: Farm Advisor Fund Center 215 Fiscal
- Page 305 and 306: Fish and Game Fund Center 331 Fisca
- Page 307 and 308: Golf Courses Fund Center 427 Fiscal
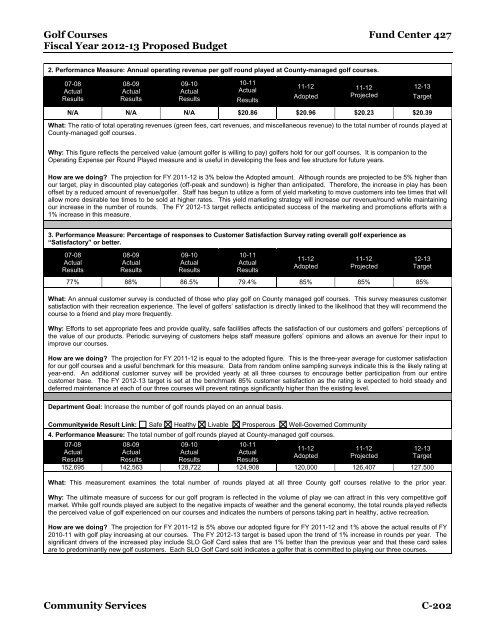
- Page 309 and 310: Golf Courses Fund Center 427 Fiscal
- Page 311: Golf Courses Fund Center 427 Fiscal
- Page 315 and 316: Library Fund Center 377 Fiscal Year
- Page 317 and 318: Library Fund Center 377 Fiscal Year
- Page 319 and 320: Employees 50 40 30 20 10 0 Parks Fu
- Page 321 and 322: Parks Fund Center 305 Fiscal Year 2
- Page 323 and 324: Parks Fund Center 305 Fiscal Year 2
- Page 325 and 326: Parks Fund Center 305 Fiscal Year 2
- Page 327 and 328: Wildlife and Grazing Fund Center 33
- Page 329 and 330: Employees Administrative Office Fun
- Page 331 and 332: Administrative Office Fund Center 1
- Page 333 and 334: Administrative Office Fund Center 1
- Page 335 and 336: Employees Organizational Developmen
- Page 337 and 338: Organizational Development Fund Cen
- Page 339 and 340: Assessor Fund Center 109 Fiscal Yea
- Page 341 and 342: Assessor Fund Center 109 Fiscal Yea
- Page 343 and 344: Assessor Fund Center 109 Fiscal Yea
- Page 345 and 346: Employees Auditor-Controller Fund C
- Page 347 and 348: Auditor-Controller Fund Center 107
- Page 349 and 350: Auditor-Controller Fund Center 107
- Page 351 and 352: Auditor-Controller Fund Center 107
- Page 353 and 354: Board of Supervisors Fund Center 10
- Page 355 and 356: Board of Supervisors Fund Center 10
- Page 357 and 358: Clerk-Recorder Fund Center 110 Fisc
- Page 359 and 360: Clerk-Recorder Fund Center 110 Fisc
- Page 361 and 362: Clerk-Recorder Fund Center 110 Fisc
- Page 363 and 364:
Employees Treasurer, Tax Collector,
- Page 365 and 366:
Treasurer, Tax Collector, Public Ad
- Page 367 and 368:
Treasurer, Tax Collector, Public Ad
- Page 369 and 370:
Treasurer, Tax Collector, Public Ad
- Page 371 and 372:
Treasurer, Tax Collector, Public Ad
- Page 373 and 374:
County Counsel Fund Center 111 Fisc
- Page 375 and 376:
County Counsel Fund Center 111 Fisc
- Page 377 and 378:
County Counsel Fund Center 111 Fisc
- Page 379 and 380:
General Services Agency Fund Center
- Page 381 and 382:
General Services Agency Fund Center
- Page 383 and 384:
General Services Agency Fund Center
- Page 385 and 386:
General Services Agency Fund Center
- Page 387 and 388:
General Services Agency Fund Center
- Page 389 and 390:
General Services Agency Fund Center
- Page 391 and 392:
Fleet Services Fund Center 407 Fisc
- Page 393 and 394:
Fleet Services Fund Center 407 Fisc
- Page 395 and 396:
Fleet Services Fund Center 407 Fisc
- Page 397 and 398:
Information Technology Fund Center
- Page 399 and 400:
Information Technology Fund Center
- Page 401 and 402:
Information Technology Fund Center
- Page 403 and 404:
Reprographics Fund Center 406 Fisca
- Page 405 and 406:
Reprographics Fund Center 406 Fisca
- Page 407 and 408:
Reprographics Fund Center 406 Fisca
- Page 409 and 410:
Human Resources Fund Center 112 Fis
- Page 411 and 412:
Human Resources Fund Center 112 Fis
- Page 413 and 414:
Human Resources Fund Center 112 Fis
- Page 415 and 416:
Employees Risk Management Fund Cent
- Page 417 and 418:
Risk Management Fund Center 105 Fis
- Page 419 and 420:
Risk Management Fund Center 105 Fis
- Page 421 and 422:
Risk Management Fund Center 105 Fis
- Page 423 and 424:
Self Insurance Fund Centers 408 -41
- Page 425 and 426:
Self Insurance Fund Centers 408 -41
- Page 427 and 428:
Countywide Automation Replacement F
- Page 429 and 430:
Countywide Automation Replacement F
- Page 431 and 432:
Countywide Automation Replacement F
- Page 433 and 434:
Debt Service Fund Center 277 Fiscal
- Page 435 and 436:
General Government Building Replace
- Page 437 and 438:
Non-Departmental Revenues-Other Fin
- Page 439 and 440:
Non-Departmental Revenues-Other Fin
- Page 441 and 442:
Non-Departmental Revenues Fund Cent
- Page 443 and 444:
Other Post Employment Benefits Fund
- Page 445 and 446:
Pension Obligation Bonds Fund Cente
- Page 447 and 448:
Public Facility Fees Fund Center 24
- Page 449 and 450:
Capital Projects Fund Center 230 Fi
- Page 451 and 452:
Capital Projects Fund Center 230 Fi
- Page 453 and 454:
Capital Projects Fund Center 230 Fi
- Page 455 and 456:
Capital Projects Fund Center 230 Fi
- Page 457 and 458:
Capital Projects Fund Center 230 Fi
- Page 459 and 460:
CAPITAL PROJECTS WBS Project # Proj
- Page 461 and 462:
CAPITAL PROJECTS WBS Project # Proj
- Page 463 and 464:
CAPITAL PROJECTS WBS Project # Proj
- Page 465 and 466:
Completed Capital Projects: FY 2011
- Page 467 and 468:
Maintenance Projects Fund Center 20
- Page 469 and 470:
Maintenance Projects Fund Center 20
- Page 471 and 472:
Maintenance Projects Fund Center 20
- Page 473 and 474:
MAINTENANCE PROJECTS WBS Project #
- Page 475 and 476:
MAINTENANCE PROJECTS WBS Project #
- Page 477 and 478:
Completed Maintenance Projects: FY
- Page 479 and 480:
Completed Countywide Projects: FY 2
- Page 481 and 482:
County of San Luis Obispo 2012-13 P
- Page 483 and 484:
County of San Luis Obispo 2012-13 P
- Page 485 and 486:
County of San Luis Obispo 2012-13 P
- Page 487 and 488:
County of San Luis Obispo 2012-13 P
- Page 489 and 490:
County of San Luis Obispo 2012-13 P
- Page 491 and 492:
County of San Luis Obispo 2012-13 P
- Page 493 and 494:
County of San Luis Obispo 2012-13 P
- Page 495 and 496:
County of San Luis Obispo 2012-13 P
- Page 497 and 498:
County of San Luis Obispo 2012-13 P
- Page 499 and 500:
County of San Luis Obispo 2012-13 P
- Page 501 and 502:
County of San Luis Obispo 2012-13 P
- Page 503 and 504:
County of San Luis Obispo 2012-13 P
- Page 505 and 506:
County of San Luis Obispo 2012-13 P
- Page 507 and 508:
STATE CONTROLLER SCHEDULES COUNTY O
- Page 509 and 510:
STATE CONTROLLER SCHEDULES COUNTY O
- Page 511 and 512:
STATE CONTROLLER SCHEDULES COUNTY O
- Page 513 and 514:
STATE CONTROLLER SCHEDULES COUNTY O
- Page 515 and 516:
STATE CONTROLLER SCHEDULES COUNTY O
- Page 517 and 518:
STATE CONTROLLER SCHEDULES COUNTY O
- Page 519 and 520:
STATE CONTROLLER SCHEDULES COUNTY O
- Page 521 and 522:
STATE CONTROLLER SCHEDULES COUNTY O
- Page 523 and 524:
STATE CONTROLLER SCHEDULES COUNTY O
- Page 525 and 526:
STATE CONTROLLER SCHEDULES COUNTY O
- Page 527 and 528:
STATE CONTROLLER SCHEDULES COUNTY O
- Page 529 and 530:
STATE CONTROLLER SCHEDULES COUNTY O
- Page 531 and 532:
STATE CONTROLLER SCHEDULES COUNTY O
- Page 533 and 534:
STATE CONTROLLER SCHEDULES COUNTY O
- Page 535 and 536:
STATE CONTROLLER SCHEDULES COUNTY O
- Page 537 and 538:
STATE CONTROLLER SCHEDULES COUNTY O
- Page 539 and 540:
STATE CONTROLLER SCHEDULES COUNTY O
- Page 541 and 542:
STATE CONTROLLER SCHEDULES COUNTY O
- Page 543 and 544:
STATE CONTROLLER SCHEDULES COUNTY O
- Page 545 and 546:
Schedule 8 Detail of Financing Uses
- Page 547 and 548:
STATE CONTROLLER SCHEDULES COUNTY O
- Page 549 and 550:
STATE CONTROLLER SCHEDULES COUNTY O
- Page 551 and 552:
Schedule 9 Financing Sources and Us
- Page 553 and 554:
Analysis of Financing Sources by So
- Page 555 and 556:
Date: 04/12/12 SLO County Budget Pr
- Page 557 and 558:
Date: 04/12/12 SLO County Budget Pr
- Page 559 and 560:
Date: 04/12/12 SLO County Budget Pr
- Page 561 and 562:
Date: 04/12/12 SLO County Budget Pr
- Page 563 and 564:
Date: 04/12/12 SLO County Budget Pr
- Page 565 and 566:
Date: 04/12/12 SLO County Budget Pr
- Page 567 and 568:
Date: 04/12/12 SLO County Budget Pr
- Page 569 and 570:
SLO COUNTY BUDGET PREPARATION SYSTE
- Page 571 and 572:
SLO COUNTY BUDGET PREPARATION SYSTE
- Page 573 and 574:
SLO COUNTY BUDGET PREPARATION SYSTE
- Page 575 and 576:
SLO COUNTY BUDGET PREPARATION SYSTE
- Page 577 and 578:
SLO COUNTY BUDGET PREPARATION SYSTE
- Page 579 and 580:
SLO COUNTY BUDGET PREPARATION SYSTE
- Page 581 and 582:
SLO COUNTY BUDGET PREPARATION SYSTE
- Page 583 and 584:
SLO COUNTY BUDGET PREPARATION SYSTE
- Page 585 and 586:
SLO COUNTY BUDGET PREPARATION SYSTE
- Page 587 and 588:
SLO COUNTY BUDGET PREPARATION SYSTE
- Page 589 and 590:
SLO COUNTY BUDGET PREPARATION SYSTE
- Page 591 and 592:
SLO COUNTY BUDGET PREPARATION SYSTE
- Page 593 and 594:
SLO COUNTY BUDGET PREPARATION SYSTE
- Page 595 and 596:
SLO COUNTY BUDGET PREPARATION SYSTE
- Page 597 and 598:
SLO COUNTY BUDGET PREPARATION SYSTE
- Page 599 and 600:
SLO COUNTY BUDGET PREPARATION SYSTE
- Page 601 and 602:
SLO COUNTY BUDGET PREPARATION SYSTE
- Page 603 and 604:
SLO COUNTY BUDGET PREPARATION SYSTE
- Page 605 and 606:
SLO COUNTY BUDGET PREPARATION SYSTE
- Page 607 and 608:
SLO COUNTY BUDGET PREPARATION SYSTE
- Page 609 and 610:
SLO COUNTY BUDGET PREPARATION SYSTE
- Page 611 and 612:
SLO COUNTY BUDGET PREPARATION SYSTE
- Page 613 and 614:
County of San Luis Obispo 2012-13 P
- Page 615 and 616:
County of San Luis Obispo 2012-13 P
- Page 617 and 618:
County of San Luis Obispo 2012-13 P
- Page 619 and 620:
County of San Luis Obispo 2012-13 P
- Page 621 and 622:
County of San Luis Obispo 2012-13 P
- Page 623 and 624:
County of San Luis Obispo 2012-13 P
- Page 625 and 626:
County of San Luis Obispo 2012-13 P