Past and future changes in climate and hydrological - GLERL - NOAA
Past and future changes in climate and hydrological - GLERL - NOAA
Past and future changes in climate and hydrological - GLERL - NOAA

You also want an ePaper? Increase the reach of your titles
YUMPU automatically turns print PDFs into web optimized ePapers that Google loves.
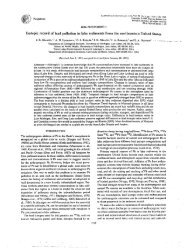
Clim Dyn (2007) 28:381–407<br />
DOI 10.1007/s00382-006-0187-8<br />
<strong>Past</strong> <strong>and</strong> <strong>future</strong> <strong>changes</strong> <strong>in</strong> <strong>climate</strong> <strong>and</strong> <strong>hydrological</strong> <strong>in</strong>dicators<br />
<strong>in</strong> the US Northeast<br />
Kathar<strong>in</strong>e Hayhoe Æ Cameron P. Wake Æ Thomas G. Hunt<strong>in</strong>gton Æ<br />
Lifeng Luo Æ Mark D. Schwartz Æ Just<strong>in</strong> Sheffield Æ Eric Wood Æ<br />
Bruce Anderson Æ James Bradbury Æ Art DeGaetano Æ<br />
Tara J. Troy Æ David Wolfe<br />
Received: 22 February 2006 / Accepted: 1 August 2006 / Published onl<strong>in</strong>e: 16 November 2006<br />
Ó Spr<strong>in</strong>ger-Verlag 2006<br />
Abstract To assess the <strong>in</strong>fluence of global <strong>climate</strong><br />
change at the regional scale, we exam<strong>in</strong>e past <strong>and</strong><br />
<strong>future</strong> <strong>changes</strong> <strong>in</strong> key <strong>climate</strong>, <strong>hydrological</strong>, <strong>and</strong> biophysical<br />
<strong>in</strong>dicators across the US Northeast (NE). We<br />
first consider the extent to which simulations of twentieth<br />
century <strong>climate</strong> from n<strong>in</strong>e atmosphere-ocean<br />
general circulation models (AOGCMs) are able to<br />
reproduce observed <strong>changes</strong> <strong>in</strong> these <strong>in</strong>dicators. We<br />
then evaluate projected <strong>future</strong> trends <strong>in</strong> primary <strong>climate</strong><br />
characteristics <strong>and</strong> <strong>in</strong>dicators of change, <strong>in</strong>clud<strong>in</strong>g<br />
seasonal temperatures, ra<strong>in</strong>fall <strong>and</strong> drought, snow<br />
cover, soil moisture, streamflow, <strong>and</strong> <strong>changes</strong> <strong>in</strong> biometeorological<br />
<strong>in</strong>dicators that depend on threshold or<br />
accumulated temperatures such as grow<strong>in</strong>g season,<br />
frost days, <strong>and</strong> Spr<strong>in</strong>g Indices (SI). Changes <strong>in</strong> <strong>in</strong>dicators<br />
for which temperature-related signals have already<br />
been observed (seasonal warm<strong>in</strong>g patterns, advances<br />
K. Hayhoe (&)<br />
Department of Geosciences, Texas Tech University,<br />
Lubbock, TX, USA<br />
e-mail: kathar<strong>in</strong>e.hayhoe@ttu.edu<br />
C. P. Wake<br />
Institute for the Study of Earth, Oceans, <strong>and</strong> Space,<br />
University of New Hampshire, Durham, NH, USA<br />
T. G. Hunt<strong>in</strong>gton<br />
US Geological Survey, Augusta, ME, USA<br />
L. Luo J. Sheffield E. Wood T. J. Troy<br />
Department of Civil <strong>and</strong> Environmental Eng<strong>in</strong>eer<strong>in</strong>g,<br />
Pr<strong>in</strong>ceton University, Pr<strong>in</strong>ceton, NJ, USA<br />
M. D. Schwartz<br />
Department of Geography,<br />
University of Wiscons<strong>in</strong>-Milwaukee,<br />
Milwaukee, WI, USA<br />
<strong>in</strong> high-spr<strong>in</strong>g streamflow, decreases <strong>in</strong> snow depth,<br />
extended grow<strong>in</strong>g seasons, earlier bloom dates) are<br />
generally reproduced by past model simulations <strong>and</strong> are<br />
projected to cont<strong>in</strong>ue <strong>in</strong> the <strong>future</strong>. Other <strong>in</strong>dicators for<br />
which trends have not yet been observed also show<br />
projected <strong>future</strong> <strong>changes</strong> consistent with a warmer<br />
<strong>climate</strong> (shr<strong>in</strong>k<strong>in</strong>g snow cover, more frequent droughts,<br />
<strong>and</strong> extended low-flow periods <strong>in</strong> summer). The magnitude<br />
of temperature-driven trends <strong>in</strong> the <strong>future</strong> are<br />
generally projected to be higher under the Special<br />
Report on Emission Scenarios (SRES) mid-high (A2)<br />
<strong>and</strong> higher (A1FI) emissions scenarios than under the<br />
lower (B1) scenario. These results provide confidence<br />
regard<strong>in</strong>g the direction of many regional <strong>climate</strong> trends,<br />
<strong>and</strong> highlight the fundamental role of <strong>future</strong> emissions<br />
<strong>in</strong> determ<strong>in</strong><strong>in</strong>g the potential magnitude of <strong>changes</strong> we<br />
can expect over the com<strong>in</strong>g century.<br />
B. Anderson<br />
Department of Geography <strong>and</strong> Environment,<br />
Boston University, Boston, MA, USA<br />
J. Bradbury<br />
Department of Geosciences,<br />
Climate System Research Center,<br />
University of Massachusetts,<br />
Amherst, MA, USA<br />
A. DeGaetano<br />
Northeast Regional Climate Center,<br />
Department of Earth <strong>and</strong> Atmospheric Sciences,<br />
Cornell University, Ithaca, NY, USA<br />
D. Wolfe<br />
Department of Horticulture,<br />
Cornell University, Ithaca, NY, USA<br />
123
382 K. Hayhoe et al.: Changes <strong>in</strong> <strong>climate</strong> <strong>and</strong> <strong>hydrological</strong> <strong>in</strong>dicators<br />
1 Introduction<br />
Investigat<strong>in</strong>g current <strong>and</strong> <strong>future</strong> <strong>climate</strong> change at the<br />
regional scale is essential to underst<strong>and</strong><strong>in</strong>g potential<br />
impacts on humans <strong>and</strong> the natural environment.<br />
Atmospheric circulation, topography, l<strong>and</strong> use, <strong>and</strong><br />
other regional features modify global <strong>changes</strong> to produce<br />
unique patterns of change at the regional scale.<br />
As global- <strong>and</strong> regional-scale <strong>changes</strong> <strong>in</strong>fluence exist<strong>in</strong>g<br />
natural <strong>and</strong> human systems, a set of impacts <strong>and</strong><br />
responses dist<strong>in</strong>ctive to each region are produced. For<br />
example, the effects of global sea-level rise <strong>in</strong> regions<br />
with steep rocky shorel<strong>in</strong>es would be very different<br />
from those for low-ly<strong>in</strong>g coastal areas. Global-scale<br />
<strong>changes</strong> may also trigger region-specific feedbacks—temperature<br />
<strong>in</strong>creases at higher latitudes could<br />
drive snow-albedo feedbacks, with a potential<br />
enhancement of local warm<strong>in</strong>g, while a similar <strong>in</strong>crease<br />
at lower latitudes might <strong>in</strong>crease atmospheric water<br />
content <strong>and</strong> cloud<strong>in</strong>ess, which could moderate such a<br />
warm<strong>in</strong>g.<br />
Here, we assess the implications of global <strong>climate</strong><br />
change for the US Northeast (NE), an area encompass<strong>in</strong>g<br />
the states of Ma<strong>in</strong>e, New Hampshire,<br />
Vermont, Massachusetts, Rhode Isl<strong>and</strong>, Connecticut,<br />
New York, New Jersey, <strong>and</strong> Pennsylvania. S<strong>in</strong>ce 1970,<br />
this region has seen <strong>in</strong>creases <strong>in</strong> temperature of<br />
0.25°C/decade <strong>and</strong> <strong>changes</strong> <strong>in</strong> other related <strong>in</strong>dicators<br />
consistent with a warm<strong>in</strong>g <strong>climate</strong>. The number of<br />
days that exceed the 95th percentile threshold for<br />
daily maximum temperature at northeastern US stations<br />
has <strong>in</strong>creased by nearly 1.7 occurrences per<br />
decade over the last 45 years (DeGaetano <strong>and</strong> Allen<br />
2002). Warm m<strong>in</strong>imum temperature extremes (i.e.,<br />
nights that rema<strong>in</strong> above the daily 95th percentile)<br />
have <strong>in</strong>creased at almost double this rate (2.9 occurrences<br />
per decade) <strong>and</strong> more than twice the rate<br />
observed <strong>in</strong> other regions of the US. Extremely cold<br />
temperature days also have decreased s<strong>in</strong>ce 1960,<br />
although they have typically decreased at a rate of<br />
less than one occurrence per decade (DeGaetano <strong>and</strong><br />
Allen 2002).<br />
Warm<strong>in</strong>g temperatures have also affected the ratio<br />
of snow to total precipitation (S/P), <strong>and</strong> the amount<br />
<strong>and</strong> density of snow on the ground. The S/P ratio<br />
decreased at 11 of 21 United States Historical<br />
Climatology Network (USHCN) sites <strong>in</strong> New Engl<strong>and</strong><br />
from 1948 through 2000 (Hunt<strong>in</strong>gton et al. 2004). The<br />
four sites <strong>in</strong> northernmost New Engl<strong>and</strong> with the<br />
strongest <strong>and</strong> most coherent trends showed an average<br />
decrease <strong>in</strong> annual S/P ratio from about 30% <strong>in</strong><br />
1949 to 23% <strong>in</strong> 2000. Hunt<strong>in</strong>gton et al. (2004) also<br />
reported decreas<strong>in</strong>g snowfall amounts at most of the<br />
123<br />
21 USHCN sites over this period. Furthermore, 18 of<br />
23 snow course sites <strong>in</strong> Ma<strong>in</strong>e with records spann<strong>in</strong>g<br />
at least 50 years through 2004 had decreases <strong>in</strong><br />
snowpack depth or <strong>in</strong>creases <strong>in</strong> snow density (Hodgk<strong>in</strong>s<br />
<strong>and</strong> Dudley 2006a). F<strong>in</strong>ally, four sites with the<br />
longest (1926–2004) <strong>and</strong> most complete records <strong>in</strong>dicate<br />
an average decrease <strong>in</strong> March/April snowpack<br />
depth of 16% <strong>and</strong> an 11% <strong>in</strong>crease <strong>in</strong> snow density.<br />
Together, these <strong>changes</strong> <strong>in</strong> the S/P ratio, snowfall<br />
amounts, <strong>and</strong> snow density/depth comb<strong>in</strong>e to present<br />
a consistent picture of <strong>changes</strong> <strong>in</strong> w<strong>in</strong>ter snow driven<br />
by warmer temperatures.<br />
Reductions <strong>in</strong> the length of the ice cover on lakes<br />
<strong>and</strong> rivers has also been observed. These <strong>changes</strong> are<br />
aga<strong>in</strong> consistent with warmer air temperatures <strong>in</strong> late<br />
w<strong>in</strong>ter <strong>and</strong> early spr<strong>in</strong>g. Records of spr<strong>in</strong>g ice-out on<br />
lakes <strong>in</strong> the NE between 1850 <strong>and</strong> 2000 <strong>in</strong>dicate an<br />
advancement of 9 days for lakes <strong>in</strong> northern <strong>and</strong><br />
mounta<strong>in</strong>ous regions <strong>and</strong> 16 days for lakes <strong>in</strong> more<br />
southerly regions (Hodgk<strong>in</strong>s et al. 2002). Similarly,<br />
historical stream flow records <strong>in</strong>dicate an advance <strong>in</strong><br />
the tim<strong>in</strong>g of high river flows dur<strong>in</strong>g the twentieth<br />
century over the northern part of the NE, where<br />
snowmelt dom<strong>in</strong>ates the annual <strong>hydrological</strong> cycle<br />
(Hodgk<strong>in</strong>s et al. 2003; Hodgk<strong>in</strong>s <strong>and</strong> Dudley 2006a).<br />
Most of the observed change occurred dur<strong>in</strong>g the<br />
period 1970 through 2000—when w<strong>in</strong>ters <strong>in</strong> the NE<br />
were warm<strong>in</strong>g at ~0.7°C/decade—with the dates of<br />
high flow advanc<strong>in</strong>g by 7–14 days (Hodgk<strong>in</strong>s et al.<br />
2003).<br />
Biological responses to <strong>climate</strong> change have also<br />
been detected <strong>in</strong> the NE. A comprehensive analysis of<br />
historical records from 72 sites across the NE, where<br />
the first flower date for the same clone of lilac has been<br />
monitored s<strong>in</strong>ce the 1960s, shows an advance of 4 days<br />
(Wolfe et al. 2005). The same study also exam<strong>in</strong>ed first<br />
flower data from 1960 to 2000 for grape <strong>and</strong> apple trees<br />
<strong>in</strong> NY only, <strong>and</strong> found an advance of 6–8 days for these<br />
woody perennials. Us<strong>in</strong>g herbarium specimens at the<br />
Harvard University Arnold Arboretum (Cambridge,<br />
MA, USA), Primack et al. (2004) found that flower<strong>in</strong>g<br />
was occurr<strong>in</strong>g on average 8 days earlier from 1980 to<br />
2002 than it did from 1900 to 1920.<br />
In addition to plant responses, <strong>changes</strong> <strong>in</strong> fauna have<br />
also been observed. For example, Gibbs <strong>and</strong> Breisch<br />
(2001) documented an advance of 10–13 days <strong>in</strong> first<br />
date of spr<strong>in</strong>g mat<strong>in</strong>g calls <strong>in</strong> upstate NY s<strong>in</strong>ce the<br />
beg<strong>in</strong>n<strong>in</strong>g of the century, for four of six frog species<br />
studied. Advances <strong>in</strong> the tim<strong>in</strong>g of migration of anadromous<br />
fish (Atlantic salmon <strong>and</strong> alewives) <strong>in</strong> NE<br />
rivers dur<strong>in</strong>g the last few decades have also been<br />
recently reported (Hunt<strong>in</strong>gton et al. 2003; Juanes et al.<br />
2004).
K. Hayhoe et al.: Changes <strong>in</strong> <strong>climate</strong> <strong>and</strong> <strong>hydrological</strong> <strong>in</strong>dicators 383<br />
These <strong>and</strong> other trends suggest that the impacts of<br />
<strong>climate</strong> change are already be<strong>in</strong>g experienced across<br />
the NE. Furthermore, most of the <strong>changes</strong> observed to<br />
date are consistent with what would be expected from<br />
a warm<strong>in</strong>g trend. As global temperatures cont<strong>in</strong>ue to<br />
rise over the next century driven by human emissions<br />
of greenhouse gases, how will these <strong>and</strong> other <strong>in</strong>dicators<br />
of regional change <strong>in</strong> the NE be affected? In each<br />
of the follow<strong>in</strong>g sections, we address this question <strong>in</strong><br />
two steps. First, we exam<strong>in</strong>e the extent to which historical<br />
model simulations that <strong>in</strong>corporate both natural<br />
variability <strong>and</strong> human drivers of <strong>climate</strong> change are<br />
able to reproduce trends <strong>in</strong> surface <strong>climate</strong>, hydrology,<br />
<strong>and</strong> biometeorological <strong>in</strong>dicators over the past century.<br />
Then, we assess <strong>future</strong> model-simulated trends <strong>in</strong> these<br />
key <strong>climate</strong> <strong>in</strong>dicators <strong>and</strong> <strong>in</strong>terpret these trends <strong>in</strong> the<br />
context of past <strong>changes</strong>, <strong>in</strong> order to assess the potential<br />
direction <strong>and</strong> magnitude of <strong>future</strong> change under higher<br />
<strong>and</strong> lower emission scenarios.<br />
2 Data sources <strong>and</strong> methods<br />
2.1 Observational data sources<br />
The observational data used <strong>in</strong> this analysis are a<br />
subset of the USHCN <strong>in</strong>strumental temperature <strong>and</strong><br />
precipitation records (Karl et al. 1990; Easterl<strong>in</strong>g et al.<br />
1999; Williams et al. 2005). These represent the best<br />
available data for <strong>in</strong>vestigat<strong>in</strong>g <strong>changes</strong> s<strong>in</strong>ce 1900, as<br />
the stations were selected based on length <strong>and</strong> quality<br />
of data, which <strong>in</strong>cludes limit<strong>in</strong>g the number of station<br />
<strong>changes</strong>. In addition, monthly data have undergone<br />
numerous quality assurances <strong>and</strong> adjustments to best<br />
characterize the actual variability <strong>in</strong> <strong>climate</strong>. These<br />
adjustments take <strong>in</strong>to consideration the validity of<br />
extreme outliers, time of observation bias (Karl et al.<br />
1986), <strong>changes</strong> <strong>in</strong> <strong>in</strong>strumentation (Quayle et al. 1991),<br />
r<strong>and</strong>om relocations of stations (Karl <strong>and</strong> Williams<br />
1987), <strong>and</strong> urban warm<strong>in</strong>g biases (Karl et al. 1988).<br />
Miss<strong>in</strong>g data are estimated from surround<strong>in</strong>g stations<br />
to produce a nearly cont<strong>in</strong>uous data set for each<br />
station.<br />
Annual <strong>and</strong> seasonal temperature <strong>and</strong> precipitation<br />
trends for the entire region were calculated us<strong>in</strong>g the<br />
monthly USHCN data as follows. First, the mean for<br />
all station data <strong>in</strong> each of the National Climatic Data<br />
Center <strong>climate</strong> divisions (Guttman <strong>and</strong> Quayle 1996)<br />
was calculated based on monthly temperature <strong>and</strong><br />
precipitation data, with typically less than six stations<br />
per division. Then, the area-weighted regional mean of<br />
the <strong>climate</strong> division data was calculated, represent<strong>in</strong>g<br />
the data from 73 stations for the temperature analysis<br />
<strong>and</strong> 93 stations for the precipitation analysis. No weight<br />
was given to <strong>climate</strong> divisions with no stations; however,<br />
these only represent 6% of the total area of the<br />
study region for the temperature analysis, <strong>and</strong> 11% for<br />
the precipitation analysis. Daily USHCN data were<br />
used as <strong>in</strong>put to the freeze date analysis <strong>and</strong> the Spr<strong>in</strong>g<br />
Indices (SI) models.<br />
In addition to the surface data, sea surface temperature<br />
reconstructions for the historical period were<br />
derived for the Gulf of Ma<strong>in</strong>e <strong>and</strong> the Gulf Stream <strong>in</strong><br />
the southern part of the NE based on the <strong>NOAA</strong><br />
Extended Reconstructed sea-surface temperature<br />
(SST) data (Smith <strong>and</strong> Reynolds 2003), was provided<br />
by the <strong>NOAA</strong>-CIRES Climate Diagnostics Center 1 .<br />
2.2 Climate models <strong>and</strong> emission scenarios<br />
for <strong>future</strong> projections<br />
The model analysis presented here is based on output<br />
from n<strong>in</strong>e of the latest coupled atmosphere-ocean<br />
general circulation models (AOGCMs) available from<br />
the IPCC AR4 WG1 database, as listed <strong>in</strong> Table 1.<br />
Historical model simulations (1900–1999) correspond<br />
to the CMIP ‘‘Twentieth Century Climate <strong>in</strong> Coupled<br />
Models’’ or 20C3M scenarios. These represent each<br />
model<strong>in</strong>g group’s best efforts to reproduce observed<br />
<strong>climate</strong> over the past century. As such, they can <strong>in</strong>clude<br />
forc<strong>in</strong>g from anthropogenic emissions of greenhouse<br />
gases, aerosols, <strong>and</strong> reactive species; <strong>changes</strong> <strong>in</strong> solar<br />
output; particulate emissions from volcanic eruptions;<br />
<strong>changes</strong> <strong>in</strong> tropospheric <strong>and</strong> stratospheric ozone; <strong>and</strong><br />
other <strong>in</strong>fluences required to provide a comprehensive<br />
picture of <strong>climate</strong> over the last century.<br />
It is important to note, however, that although the<br />
20C3M simulations are all <strong>in</strong>tended to represent the<br />
same historical total-forc<strong>in</strong>g scenarios (<strong>in</strong>clud<strong>in</strong>g both<br />
natural variability as well as the effect of human<br />
emissions on <strong>climate</strong>), due to the uncerta<strong>in</strong>ty <strong>in</strong> estimat<strong>in</strong>g<br />
<strong>changes</strong> <strong>in</strong> natural <strong>and</strong> human-related forc<strong>in</strong>gs<br />
over the last century, they do not necessarily have<br />
identical boundary conditions. Some <strong>in</strong>ter-model differences<br />
as well as discrepencies between model simulations<br />
<strong>and</strong> observations, therefore, may also be a<br />
result of differ<strong>in</strong>g <strong>in</strong>put conditions.<br />
Future AOGCM simulations (2000–2099) are all<br />
forced us<strong>in</strong>g the same IPCC Special Report on<br />
Emission Scenarios (SRES, Nakićenović et al. 2000)<br />
higher (A1FI), mid-high (A2), <strong>and</strong> lower (B1) emissions<br />
scenarios. These scenarios use projections of<br />
<strong>changes</strong> <strong>in</strong> population, demographics, technology,<br />
<strong>in</strong>ternational trade, <strong>and</strong> other socio-economic factors<br />
1 http://www.cdc.noaa.gov/<br />
123
384 K. Hayhoe et al.: Changes <strong>in</strong> <strong>climate</strong> <strong>and</strong> <strong>hydrological</strong> <strong>in</strong>dicators<br />
Table 1 Key characteristics of the n<strong>in</strong>e atmosphere-ocean general circulation models (AOGCMs) <strong>and</strong> their output used <strong>in</strong> this<br />
analysis<br />
Model acronym Host <strong>in</strong>stitution SRES scenarios Resolution References<br />
to estimate correspond<strong>in</strong>g emissions of greenhouse<br />
gases <strong>and</strong> other radiatively active species. Although<br />
the SRES scenarios do not <strong>in</strong>clude any explicit policies<br />
aimed at reduc<strong>in</strong>g greenhouse gas emissions to<br />
mitigate <strong>climate</strong> change, the B1 scenario can be seen<br />
as proxy for stabiliz<strong>in</strong>g atmospheric CO2 concentrations<br />
at or above 550 ppm, as levels reach this value<br />
by 2100. Atmospheric CO 2 concentrations for the<br />
higher A1FI scenario are 970 ppm by 2100 <strong>and</strong><br />
830 ppm for A2. Information from these scenarios<br />
used to drive the <strong>future</strong> AOGCM simulations <strong>in</strong>clude<br />
regional <strong>changes</strong> <strong>in</strong> emissions of greenhouse gases <strong>and</strong><br />
reactive species. Although <strong>changes</strong> <strong>in</strong> l<strong>and</strong> use <strong>and</strong><br />
hence vegetation cover are implicit <strong>in</strong> these emissions<br />
estimates, feedbacks between emissions <strong>and</strong> <strong>climate</strong><br />
are not <strong>in</strong>cluded <strong>in</strong> the AOGCM simulations used<br />
here.<br />
The broader analyses of monthly temperature <strong>and</strong><br />
precipitation presented here are based on results from<br />
the full set of n<strong>in</strong>e AOGCMs <strong>and</strong> multiple ensemble<br />
members, as summarized <strong>in</strong> Table 1. At the time of this<br />
analysis, only two models (HadCM3 <strong>and</strong> PCM) had<br />
produced daily output for both A1FI <strong>and</strong> B1 simulations.<br />
As the higher A1FI <strong>and</strong> lower B1 scenarios are<br />
expected to show the largest difference between projected<br />
impacts (Hayhoe et al. 2004), our <strong>in</strong>tensive<br />
<strong>hydrological</strong> analysis focuses primarily on the A1FI<br />
<strong>and</strong> B1 simulations from these two models. A1FI<br />
output from a third model, GFDL, recently became<br />
available <strong>and</strong> these projections have been added to the<br />
broader analysis. Further analyses of <strong>changes</strong> <strong>in</strong> sea<br />
surface temperatures <strong>and</strong> biometeorological <strong>in</strong>dices<br />
were limited by the availability of monthly ocean<br />
output (available for only five of n<strong>in</strong>e models: CCSM,<br />
CGCM3, HadCM3, Miroc, <strong>and</strong> PCM) <strong>and</strong> daily temperature<br />
output (available for the periods 2046–2065<br />
Atmospheric Oceanic<br />
CCSM3 NCAR (USA) A2, B1 1.4° ·1.4° 0.46° ·1.125° Coll<strong>in</strong>s et al. (2006)<br />
CGCM3 CCCMA (Canada) A2, B1 3.75° ·3.75° 1.875° ·1.875° Kim et al. (2002, 2003)<br />
CSIRO Mk3 ABM (Australia) A2, B1 1.875° ·1.875° 0.95° ·1.875° Gordon et al. (2002)<br />
GFDL CM2.1 <strong>NOAA</strong>/GFDL (USA) A1FI, A2, B1 2° ·2.5° 0.9° ·1.0° Delworth et al. (2006)<br />
GISS E-R NASA/GISS (USA) A2, B1 4° ·5° 4° ·5° Schmidt et al. (2006)<br />
HadCM3 UKMO (UK) A1FI, A2, B1 2.5° ·3.75° 1.25° ·1.25° Pope et al. (2000)<br />
ECHAM5 MPI (Germany) A2, B1 1.875° ·1.875° 1.0° ·1.0° Roeckner et al. (2003)<br />
MIROC-med CCSR (Japan) A2, B1 2.81° ·2.81° 0.9° ·1.4° Hasumi <strong>and</strong> Emori (2004)<br />
PCM NCAR (USA) A1FI, A2, B1 2.81° ·2.81° 1.0° ·1.0° Wash<strong>in</strong>gton et al. (2000)<br />
All models have 17 atmospheric levels unless <strong>in</strong>dicated otherwise<br />
123<br />
<strong>and</strong> 2081–2099 only for four of n<strong>in</strong>e models: CGCM3,<br />
CSIRO, ECHAM5, <strong>and</strong> Miroc).<br />
2.3 Hydrological model<strong>in</strong>g<br />
For the <strong>hydrological</strong> model<strong>in</strong>g, monthly AOGCM<br />
temperature <strong>and</strong> precipitation fields were first statistically<br />
downscaled to daily values with a resolution of<br />
1/8°, after Wood et al. (2002). This downscal<strong>in</strong>g used<br />
an empirical statistical technique that maps the<br />
probability density functions for modeled monthly<br />
<strong>and</strong> daily precipitation <strong>and</strong> temperature for the climatological<br />
period (1961–1990) onto those of gridded<br />
historical observed data. In this way, the mean <strong>and</strong><br />
variability of both monthly <strong>and</strong> daily observations are<br />
reproduced by the <strong>climate</strong> model output. The bias<br />
correction <strong>and</strong> spatial disaggregation technique is one<br />
orig<strong>in</strong>ally developed for adjust<strong>in</strong>g AOGCM output<br />
for long-range streamflow forecast<strong>in</strong>g (Wood et al.<br />
2002), later adapted for use <strong>in</strong> studies exam<strong>in</strong><strong>in</strong>g the<br />
hydrologic impacts of <strong>climate</strong> change (VanRheenan<br />
et al. 2004).<br />
This method compares favorably to other statistical<br />
<strong>and</strong> dynamic downscal<strong>in</strong>g techniques (Wood et al.<br />
2004). It also carries the additional benefit of be<strong>in</strong>g<br />
able to generate the daily <strong>climate</strong> <strong>in</strong>puts required to<br />
drive the <strong>hydrological</strong> model for models <strong>and</strong> scenarios<br />
that did not save their output at daily resolution (e.g.,<br />
HadCM3 A1FI; also true for A2 <strong>and</strong> B1 simulations<br />
from CGCM3, CSIRO, ECHAM5, <strong>and</strong> Miroc).<br />
However, there are also some disadvantages to this<br />
approach. First, statistical generation of daily values<br />
from monthly temperature <strong>and</strong> precipitation means<br />
that these do not reflect possible <strong>changes</strong> <strong>in</strong> atmospheric<br />
circulation as simulated by the global models<br />
on scales of days to weeks, except so far as these
K. Hayhoe et al.: Changes <strong>in</strong> <strong>climate</strong> <strong>and</strong> <strong>hydrological</strong> <strong>in</strong>dicators 385<br />
are reflected by the global models’ monthly means.<br />
Furthermore, this approach assumes that the shapes<br />
(although not the mean) of the monthly historical<br />
temperature <strong>and</strong> precipitation distributions used to<br />
generate the daily values for each month rema<strong>in</strong><br />
unchanged over time. This assumption may not be<br />
valid for many regions of the globe, where modelsimulated<br />
<strong>in</strong>creases <strong>in</strong> daily extremes are often not<br />
directly proportional to what would be projected<br />
based on shifts <strong>in</strong> the mean value alone (e.g., Wehner<br />
2004). For that reason, K. Hayhoe et al. (personal<br />
communication) compared the performance of this<br />
statistical downscal<strong>in</strong>g (SD) method for the NE with<br />
available dynamic regional model simulations (RCM)<br />
driven by the PCM model. Overall, we found the two<br />
methods to be relatively comparable for this region.<br />
For most of the temperature range, SD-based estimates<br />
of <strong>changes</strong> <strong>in</strong> the distribution were with<strong>in</strong> 5%<br />
of RCM-generated estimates (except between ~28<br />
<strong>and</strong> 33°C, where the SD frequencies were higher).<br />
Projected precipitation <strong>changes</strong> by the SD <strong>and</strong> RCM<br />
methods were generally with<strong>in</strong> 5% of each other as<br />
well, except for relatively small precipitation events of<br />
386 K. Hayhoe et al.: Changes <strong>in</strong> <strong>climate</strong> <strong>and</strong> <strong>hydrological</strong> <strong>in</strong>dicators<br />
Fig. 1 Correlation between<br />
observed monthly gaugebased<br />
streamflow amounts<br />
<strong>and</strong> VIC-simulated monthly<br />
streamflow for a 50-year<br />
(1950–1999) retrospective<br />
simulation driven by observed<br />
historical temperature <strong>and</strong><br />
precipitation. Triangles<br />
<strong>in</strong>dicate locations of selectedunregulated<br />
bas<strong>in</strong>s for which<br />
correlations were calculated.<br />
A correlation of 1 <strong>in</strong>dicates a<br />
perfect match between<br />
observed <strong>and</strong> modelsimulated<br />
monthly anomalies,<br />
while lower values quantify<br />
the strength of the correlation<br />
at that location<br />
variance, transpiration fluxes from the extended<br />
grow<strong>in</strong>g season, <strong>and</strong> other daily climatological metrics<br />
will not be represented by VIC outputs. In this sense,<br />
the VIC downscaled <strong>climate</strong> projections are a direct<br />
representation of <strong>in</strong>ter-monthly AOGCM forc<strong>in</strong>g,<br />
coupled with terra<strong>in</strong>-related adjustments based on the<br />
Parameter-elevation Regressions on Independent<br />
Slopes Model (PRISM, Daly et al. 1997) to resolve<br />
f<strong>in</strong>er-scale topographical features.<br />
2.4 Spr<strong>in</strong>g Indices models<br />
The SI models (Schwartz 1997; Schwartz <strong>and</strong> Reiter<br />
2000) were developed from over 2,000 station-years of<br />
weather data comb<strong>in</strong>ed with first leaf <strong>and</strong> first bloom<br />
data for lilac, <strong>and</strong> to a lesser degree, honeysuckle.<br />
These data were collected from 1961 to 1994 at sites<br />
throughout the north-central <strong>and</strong> northeastern USA.<br />
The SI models are a set of l<strong>in</strong>ked multiple regressionbased<br />
models developed to simulate the spr<strong>in</strong>g phenology<br />
of three regionally important species: cloned<br />
lilac (Syr<strong>in</strong>ga ch<strong>in</strong>ensis ‘‘Red Rothomagensis’’) <strong>and</strong><br />
cloned honeysuckle (Lonicera tatarica ‘‘Arnold Red’’<br />
<strong>and</strong> L. korolkowii ‘‘Zabeli’’). Model simulations of<br />
123<br />
first-leaf <strong>and</strong> first-bloom dates are based on the number<br />
of high degree-days accumulated. They are also<br />
affected by synoptic weather events that occur after<br />
w<strong>in</strong>ter chill<strong>in</strong>g requirements (i.e., vernalization) has<br />
been satisfied, particularly events that occur with<strong>in</strong><br />
about 1 week of first leaf. Species-specific values are<br />
first calculated, then averaged to produce composite<br />
output for three component models: chill<strong>in</strong>g date<br />
(when the required w<strong>in</strong>ter rest condition has been<br />
satisfied), first leaf date (<strong>in</strong>dicative of <strong>in</strong>itial understory<br />
plant growth, when the l<strong>and</strong> surface becomes ‘‘active’’<br />
<strong>in</strong> energy exchange), <strong>and</strong> first bloom date (<strong>in</strong>dicative of<br />
overstory plant growth), as described <strong>in</strong> Schwartz<br />
(1997). The SI models have been extensively tested <strong>and</strong><br />
shown to be representative of the general development<br />
of mid-latitude forest trees <strong>and</strong> shrubs that are temperature-responsive<br />
<strong>and</strong> not water-limited <strong>in</strong> spr<strong>in</strong>g<br />
(Schwartz et al. 2006). These models <strong>and</strong> associated<br />
suite of measures (<strong>in</strong>clud<strong>in</strong>g last spr<strong>in</strong>g frost date, first<br />
autumn frost date, <strong>and</strong> related values) can be calculated<br />
for any sets of daily Tmax/Tm<strong>in</strong>, given the latitude<br />
of the station (Schwartz <strong>and</strong> Reiter 2000). Here,<br />
they have been calculated based on gridded downscaled<br />
historical <strong>and</strong> <strong>future</strong> simulated <strong>changes</strong> <strong>in</strong> NE
K. Hayhoe et al.: Changes <strong>in</strong> <strong>climate</strong> <strong>and</strong> <strong>hydrological</strong> <strong>in</strong>dicators 387<br />
temperatures. This produces a ‘‘pooled’’ analysis for<br />
the entire NE region start<strong>in</strong>g <strong>in</strong> 1916 <strong>and</strong> extend<strong>in</strong>g out<br />
to 2099. First leaf <strong>and</strong> first bloom dates were calculated<br />
for <strong>in</strong>dividual grid po<strong>in</strong>ts, which were then averaged to<br />
provide a regional average date for first leaf <strong>and</strong><br />
bloom.<br />
3 Basic <strong>climate</strong> <strong>in</strong>dicators<br />
Changes <strong>in</strong> annual <strong>and</strong> seasonal temperature <strong>and</strong> precipitation<br />
serve as primary <strong>in</strong>dicators of <strong>climate</strong><br />
change. These also drive <strong>changes</strong> <strong>in</strong> <strong>hydrological</strong> <strong>and</strong><br />
biological <strong>in</strong>dicators. Hence, we first exam<strong>in</strong>e observed<br />
<strong>and</strong> historical simulated temperature <strong>and</strong> precipitation<br />
trends across the NE. We then assess <strong>future</strong> <strong>changes</strong> <strong>in</strong><br />
temperature <strong>and</strong> precipitation that may occur under<br />
higher <strong>and</strong> lower emission scenarios as projected by a<br />
range of AOGCMs with vary<strong>in</strong>g degrees of sensitivity.<br />
This analysis places <strong>future</strong> temperature <strong>and</strong> precipitation<br />
<strong>changes</strong> <strong>in</strong> the context of what has already been<br />
observed across the region. It also qualifies the amount<br />
of uncerta<strong>in</strong>ty <strong>in</strong> regional projections that is due to our<br />
underst<strong>and</strong><strong>in</strong>g of the <strong>climate</strong> system (as represented by<br />
the temperature change projected to occur by multiple<br />
models under a s<strong>in</strong>gle emissions scenario) as compared<br />
with the uncerta<strong>in</strong>ty due to projections of socio-economic<br />
<strong>and</strong> other types of human development over<br />
such long time scales (represented by the temperature<br />
<strong>changes</strong> projected to occur under different emissions<br />
scenarios).<br />
3.1 Temperature<br />
Annual temperatures over the NE have risen an<br />
average of +0.08 ± 0.01°C/decade over the last century.<br />
This rate has <strong>in</strong>creased significantly over the recent<br />
three decades to a rate of +0.25 ± 0.01°C/decade. The<br />
greatest <strong>changes</strong> over the last 35 years have been seen<br />
<strong>in</strong> w<strong>in</strong>ter, which has warmed at 0.70 ± 0.05°C/decade,<br />
almost a degree per decade (see also Keim et al. 2003;<br />
Trombulak <strong>and</strong> Wolfson 2004). On average, observed<br />
annual temperatures <strong>in</strong> the 1990s were 0.6°C warmer<br />
than the 1900–1999 long-term mean. In the 1990s,<br />
temperatures were also greater <strong>in</strong> w<strong>in</strong>ter (1.1°C) than<br />
summer (0.4°C) relative to the long-term mean.<br />
In compar<strong>in</strong>g observed trends with historical model<br />
simulations, an important clarification must be made.<br />
The AOGCM simulations used here are not constra<strong>in</strong>ed<br />
by prescribed sea surface temperatures or<br />
other boundary conditions that would force them to<br />
match observed year-to-year <strong>climate</strong> variations.<br />
Hence, there is no reason per se to expect an AOGCM<br />
to reproduce the specific tim<strong>in</strong>g of a warm or cold year,<br />
or even a trend over shorter period of time that would<br />
be dom<strong>in</strong>ated by the natural variability of the <strong>climate</strong><br />
system. Furthermore, the sensitivity of l<strong>in</strong>ear trends to<br />
the end-po<strong>in</strong>ts of the time series used to calculate such<br />
a trend suggest that even over a 30-year period, differences<br />
<strong>in</strong> the tim<strong>in</strong>g of natural <strong>climate</strong> fluctuations<br />
are likely to result <strong>in</strong> at least some differences <strong>in</strong> the<br />
magnitude of model-simulated versus observed trends<br />
that should not be taken as <strong>in</strong>dicative of the models’<br />
ability to reproduce long-term <strong>climate</strong> trends.<br />
Despite these caveats, most models are able to<br />
reproduce 100-year <strong>and</strong> even the 30-year trend <strong>in</strong> annual<br />
temperature over the NE, with a model ensemble<br />
average trend from 1900 to 1999 of +0.08 ± 0.06°C/<br />
decade <strong>and</strong> a higher trend of +0.23 ± 0.11°C/decade<br />
from 1970 to 1999, as compared with observed trends<br />
of +0.08 ± 0.01 <strong>and</strong> 0.25±0.01°C/decade, respectively<br />
(Table 2). This suggests: first, that external forc<strong>in</strong>gs<br />
rather than <strong>in</strong>ternal variability may be responsible for<br />
the greater part of the observed trend; <strong>and</strong> second, that<br />
most AOGCMs are able to translate external forc<strong>in</strong>g<br />
<strong>in</strong>to regional temperature trends of the correct sign but<br />
tend to under-estimate the correct magnitude of recent<br />
change.<br />
Long-term (1900–1999) AOGCM ensemble average<br />
seasonal temperatures are also similar to observed,<br />
although with higher variability. W<strong>in</strong>ter (DJF) modelled<br />
temperature trends are +0.12 ± 0.16°C/decade, as<br />
compared with observed trends of +0.12 ± 0.02°C/<br />
decade, while summer (JJA) modelled trends are<br />
0.07 ± 0.06°C/decade as compared with 0.07 ± 0.01°C/<br />
decade observed. From 1970 to 2000, however, models<br />
do not appear to capture the seasonal trends well,<br />
significantly under-estimat<strong>in</strong>g them <strong>in</strong> w<strong>in</strong>ter <strong>and</strong> overestimat<strong>in</strong>g<br />
them <strong>in</strong> summer. Over the short-term, observed<br />
w<strong>in</strong>ter temperatures <strong>in</strong>creased at a rate of<br />
+0.7 ± 0.05°C/decade, while the AOGCM ensemble<br />
average <strong>in</strong>crease was only +0.25 ± 0.26°C/decade. The<br />
observed summer trend was +0.12 ± 0.02°C/decade,<br />
while modeled trends averaged +0.29 ± 0.14°C/decade.<br />
This suggests that the models are not able to capture<br />
the regional <strong>and</strong>/or larger-scale characteristics that<br />
have enhanced observed w<strong>in</strong>ter warm<strong>in</strong>g over the last<br />
few decades. In fact, <strong>in</strong>dications are that AOGCMs<br />
tend to under-estimate the magnitude of both past <strong>and</strong><br />
recent observed change over the NE. Dynamical features<br />
may be produc<strong>in</strong>g the model w<strong>in</strong>ter biases, such<br />
as a failure to resolve the chang<strong>in</strong>g albedo due to snow<br />
loss.<br />
In the <strong>future</strong>, temperatures across the NE are projected<br />
to cont<strong>in</strong>ue to <strong>in</strong>crease. Greater <strong>in</strong>creases (significant<br />
at the 0.001 level) are seen under higher A1FI<br />
123
388 K. Hayhoe et al.: Changes <strong>in</strong> <strong>climate</strong> <strong>and</strong> <strong>hydrological</strong> <strong>in</strong>dicators<br />
Table 2 Comparison of observed with multi-model ensemble average simulated trends <strong>in</strong> primary <strong>climate</strong> <strong>in</strong>dicators for the NE over<br />
the past century (length of record) <strong>and</strong> the last three decades (1970–2000)<br />
<strong>and</strong> A2 scenarios relative to the lower B1 scenario <strong>in</strong><br />
all seasons by end-of-century, <strong>and</strong> for summer <strong>and</strong><br />
annually by 2035–2064. Projected <strong>in</strong>creases <strong>in</strong> annual<br />
regional surface temperature average 5.3°C by 2070–<br />
2099 relative to 1961–1990 under A1FI 2 <strong>and</strong> 4.5°C <strong>in</strong>crease<br />
under A2 as compared with 2.9°C under B1<br />
(Fig. 2; Table 3). Toward end-of-century, models also<br />
project an equal or larger <strong>in</strong>crease <strong>in</strong> summer as<br />
compared with w<strong>in</strong>ter temperatures (Table 3). As this<br />
is <strong>in</strong> contrast to the greater trend <strong>in</strong> w<strong>in</strong>ter temperatures<br />
that has been observed to date, we speculate that<br />
it may be related to regional-scale feedbacks <strong>in</strong> the<br />
water balance connected to both a decrease <strong>in</strong> the<br />
relative importance of the snow-albedo feedbacks (as<br />
overall snow cover decreases) as well as summer dry<strong>in</strong>g<br />
<strong>and</strong> enhanced warm<strong>in</strong>g due to <strong>in</strong>creased evaporation.<br />
These temperature <strong>in</strong>creases have the potential to<br />
impact a range of meteorological events <strong>and</strong> other <strong>climate</strong><br />
<strong>in</strong>dicators across the NE. One of the more obvious<br />
impacts to be expected is on temperature extremes. As<br />
Units Period of record 1970–2000<br />
OBS MOD OBS MOD<br />
Temperature (1900–1999)<br />
Annual °C/decade +0.08 +0.08 +0.25 +0.23<br />
W<strong>in</strong>ter (DJF) °C/decade +0.12 +0.12 +0.70 +0.25<br />
Summer (JJA) °C/decade +0.07 +0.07 +0.12 +0.29<br />
Precipitation (1900–1999)<br />
Annual mm/decade +10 +0.7 –8 +7<br />
W<strong>in</strong>ter (DJF) mm/decade –0.5 +0.5 +3 +3<br />
Summer (JJA) mm/decade +1 –0.3 –0.2 +0.6<br />
Sea surface temperatures (1900–2000)<br />
Gulf of Ma<strong>in</strong>e °C/decade +0.5 +0.8 +0.06 +0.6<br />
Gulf Stream °C/decade +0.3 +0.4 –0.20 +0.3<br />
Terrestrial hydrology a,b (1950–1999)<br />
Evaporation mm/day/decade +0.014 +0.006 –0.027 –0.040<br />
Runoff mm/day/decade +0.032 +0.022 –0.017 –0.015<br />
Soil moisture %sat/decade +0.005 +0.023 –0.0014 –0.0029<br />
Streamflow b (1950–1999)<br />
Tim<strong>in</strong>g of spr<strong>in</strong>g peak flow centroid days/decade –0.44 +0.27 –0.21 –0.11<br />
7-day low-flow amount %/decade +2.8 –0.25 –1.77 +0.22<br />
Snow a,b (1950–1999)<br />
Total SWE mm/decade –0.025 +0.05 –3.52 –2.90<br />
Number of snow days days/month/decade –0.040 –0.07 –0.52 –0.60<br />
Spr<strong>in</strong>g <strong>in</strong>dices (1916–2003)<br />
First leaf days/decade –0.44 –0.05 –2.19 –1.39<br />
First bloom days/decade –0.41 –0.20 –0.92 –0.69<br />
a<br />
‘‘Observed’’ estimates of long- <strong>and</strong> short-term trends <strong>in</strong> region-wide average evaporation, runoff, soil moisture <strong>and</strong> SWE are based on<br />
the retrospective VIC simulation driven by observed temperature <strong>and</strong> precipitation, while ‘‘modeled’’ estimates are based on VIC<br />
simulations driven by HadCM3 <strong>and</strong> PCM 20C3M simulations<br />
b<br />
Modeled trends for period of record are from 1960 to 1999 only. Observed trends are shown for length of record start<strong>in</strong>g <strong>in</strong> 1950 to<br />
avoid beg<strong>in</strong>n<strong>in</strong>g l<strong>in</strong>ear trends near the 1960s drought<br />
2<br />
Based on available A1FI simulations from HadCM3, GFDL<br />
CM2.1 <strong>and</strong> PCM1 only.<br />
123<br />
mean temperature <strong>in</strong>creases, the distribution of daily<br />
temperatures shifts toward the warmer end of the<br />
spectrum, <strong>in</strong>creas<strong>in</strong>g the number of days that fall above<br />
the present-day high-temperature thresholds for warm<br />
temperatures <strong>and</strong> decreas<strong>in</strong>g the days that fall below<br />
cold-temperature thresholds (DeGaetano <strong>and</strong> Allen<br />
2002). Regional model simulations for the NE (K.<br />
Hayhoe et al., personal communication) show 20–40<br />
more days per year above the 1990 90th percentile<br />
threshold by the 2090s under the A1FI scenario, while<br />
Diffenbaugh et al. (2005) estimated <strong>in</strong>creases of 30–<br />
40 days/year <strong>in</strong> the NE <strong>in</strong> the 95th percentile by latetwenty-first<br />
century under A2. This represents an<br />
approximately twofold <strong>in</strong>crease <strong>in</strong> the occurrence rate,<br />
highlight<strong>in</strong>g the potential for both <strong>changes</strong> <strong>in</strong> mean<br />
seasonal temperatures as well as <strong>future</strong> shifts <strong>in</strong> the<br />
climatological daily temperature distribution.<br />
3.2 Precipitation<br />
In addition to temperature, precipitation is an important<br />
aspect of <strong>climate</strong> <strong>in</strong> the NE. However, <strong>in</strong>ter-annual
K. Hayhoe et al.: Changes <strong>in</strong> <strong>climate</strong> <strong>and</strong> <strong>hydrological</strong> <strong>in</strong>dicators 389<br />
Fig. 2 Projected <strong>changes</strong> <strong>in</strong> annual, w<strong>in</strong>ter (DJF) <strong>and</strong> summer<br />
(JJA) temperature (°C) <strong>and</strong> precipitation (%) under the SRES<br />
B1 (low), A2 (mid-high) <strong>and</strong> A1FI (higher) emissions scenarios<br />
for the periods 2035–2064 <strong>and</strong> 2070–2099 relative to the 1961–<br />
1990 average over the US Northeast. Solid bars <strong>in</strong>dicate the<br />
ensemble average value from 9 AOGCMs (B1, A2) <strong>and</strong> 3<br />
AOGCMs (A1FI), while the whiskers <strong>in</strong>dicate the range of<br />
projections from <strong>in</strong>dividual simulations. All models consistently<br />
<strong>in</strong>dicate <strong>in</strong>creases <strong>in</strong> temperature over all seasons <strong>and</strong> <strong>in</strong> annual<br />
<strong>and</strong> w<strong>in</strong>ter precipitation that become greater over time. They<br />
also <strong>in</strong>dicate a larger temperature change under higher relative<br />
to lower emissions scenarios<br />
variability <strong>in</strong> precipitation is generally much higher<br />
than that of temperature. This makes it more difficult<br />
to dist<strong>in</strong>guish consistent long-term trends from natural<br />
fluctuations. In particular, historical records are<br />
dom<strong>in</strong>ated by the 1960s drought, a multi-year event<br />
estimated to be the most severe drought to occur <strong>in</strong> that<br />
region <strong>in</strong> the observational record (Leathers et al.<br />
2000). As the AOGCM simulations are unconstra<strong>in</strong>ed<br />
by observations, these may simulate droughts of a<br />
similar magnitude (as exam<strong>in</strong>ed later <strong>in</strong> this analysis)<br />
but not necessarily at the same time. Hence, care must<br />
be used <strong>in</strong> estimat<strong>in</strong>g long-term precipitation trends, as<br />
any trends that beg<strong>in</strong> or end near a major drought event<br />
(or a extended wet period) will be biased by this very<br />
strong event.<br />
Despite uncerta<strong>in</strong>ty <strong>in</strong> determ<strong>in</strong><strong>in</strong>g long-term trends,<br />
historical records do show a consistent long-term trend<br />
<strong>in</strong> annual precipitation of +9.5 ± 2 mm/decade over the<br />
last century (as also found by Keim et al. 2005). These<br />
<strong>changes</strong> are split between spr<strong>in</strong>g, summer <strong>and</strong> fall, with<br />
seasonal trends of +2.4 ± 0.3 mm/decade for spr<strong>in</strong>g <strong>and</strong><br />
fall, 1.2 ± 0.5 mm/decade for summer, but little change<br />
(–0.5 ± 1 mm/decade) <strong>in</strong> w<strong>in</strong>ter. S<strong>in</strong>ce 1970, there is<br />
some <strong>in</strong>dication of a reversal of the seasonal trends seen<br />
over the previous century. Annually, there is a decrease<br />
of –8 ± 9 mm/decade, with a decrease <strong>in</strong> spr<strong>in</strong>g <strong>and</strong> fall<br />
(–2 ± 3 mm/decade), little change <strong>in</strong> summer, <strong>and</strong> a<br />
slight <strong>in</strong>crease of +3 ± 3 mm/decade <strong>in</strong> w<strong>in</strong>ter precipitation.<br />
However, given the sensitivity of precipitation<br />
trends to the length of the period used to determ<strong>in</strong>e the<br />
trend <strong>and</strong> the large <strong>in</strong>terdecadal variability <strong>in</strong> precipitation<br />
characteristic of the NE, these trends are not<br />
robust.<br />
A range of positive <strong>and</strong> negative trends result from<br />
AOGCM simulations, with an average annual trend<br />
of +0.7 ± 3 mm/decade over the last century, <strong>and</strong><br />
+7 ± 18 mm/decade from 1970 to 2000. With the sole<br />
exception of w<strong>in</strong>ter precipitation from 1970 to 2000<br />
(+3 mm/decade for both observed <strong>and</strong> model average),<br />
modeled <strong>changes</strong> <strong>in</strong> seasonal precipitation do not<br />
match observed, although the high variability associated<br />
with model-based trends certa<strong>in</strong>ly encompasses<br />
the observed trends. This suggests that the observed<br />
trend <strong>in</strong> precipitation <strong>in</strong> the NE at least over the last<br />
century may be primarily driven by natural variability<br />
rather than a long-term <strong>climate</strong> trend.<br />
Regard<strong>in</strong>g the recently observed <strong>and</strong> model-simulated<br />
<strong>in</strong>crease <strong>in</strong> w<strong>in</strong>ter precipitation, however, <strong>future</strong><br />
projections from almost all model simulations show<br />
consistent <strong>in</strong>creases <strong>in</strong> w<strong>in</strong>ter precipitation <strong>and</strong> no<br />
change to a decrease <strong>in</strong> summer ra<strong>in</strong>fall. Specifically, by<br />
end-of-century, w<strong>in</strong>ter precipitation is projected to <strong>in</strong>crease<br />
an average of 11% under B1 <strong>and</strong> 14% under A2,<br />
but show small decreases (on the order of a few percent)<br />
<strong>in</strong> summer precipitation (Fig. 2, Table 3). These<br />
trends are <strong>in</strong> agreement with what has been observed <strong>in</strong><br />
the recent past, suggest<strong>in</strong>g there may be a global <strong>climate</strong><br />
change-related signal <strong>in</strong> seasonal precipitation<br />
that is beg<strong>in</strong>n<strong>in</strong>g to emerge from the observational record<br />
but is not yet evident <strong>in</strong> model simulations. These<br />
w<strong>in</strong>ter precipitation <strong>in</strong>creases are also dynamically<br />
consistent with a projected westward shift <strong>in</strong> the seasonal<br />
mean position of the East Coast trough <strong>in</strong> some of<br />
the models (J. Bradbury, personal communication).<br />
Increases <strong>in</strong> w<strong>in</strong>ter precipitation <strong>and</strong> no change or<br />
decreases <strong>in</strong> summer ra<strong>in</strong>fall will also alter the mean<br />
distribution of precipitation <strong>in</strong> the NE. Increases <strong>in</strong><br />
heavy precipitation (greater than 2 <strong>in</strong>. <strong>in</strong> less than<br />
48 h) have already been observed across much of the<br />
NE, particularly dur<strong>in</strong>g the 1980s <strong>and</strong> 1990s relative to<br />
earlier <strong>in</strong> the century (Wake <strong>and</strong> Markham 2005).<br />
Further <strong>in</strong>creases are expected <strong>in</strong> many locations<br />
around the world, <strong>in</strong>clud<strong>in</strong>g the NE (Wehner 2004;<br />
Tebaldi et al. 2006). This is generally consistent with<br />
123
390 K. Hayhoe et al.: Changes <strong>in</strong> <strong>climate</strong> <strong>and</strong> <strong>hydrological</strong> <strong>in</strong>dicators<br />
Table 3 Absolute values for the reference period 1961–1990 <strong>and</strong> projected <strong>future</strong> <strong>changes</strong> <strong>in</strong> key <strong>climate</strong> <strong>in</strong>dicators for the period<br />
2035–2064 <strong>and</strong> 2070–2099<br />
observed historical trends toward an <strong>in</strong>tensification of<br />
the hydrologic cycle (Hunt<strong>in</strong>gton 2006).<br />
Precipitation clearly impacts both human <strong>and</strong> natural<br />
systems throughout the NE. Due to the large <strong>in</strong>terannual<br />
variability <strong>and</strong> uncerta<strong>in</strong>ty <strong>in</strong> estimated trends,<br />
more weight should be attached to temperature-driven<br />
<strong>changes</strong> than precipitation. However, given the consistency<br />
between the sign of the seasonal trends <strong>in</strong><br />
observations over the last few decades <strong>and</strong> <strong>future</strong><br />
model simulations, we also consider <strong>in</strong> the follow<strong>in</strong>g<br />
analyses the impact of <strong>in</strong>creas<strong>in</strong>g w<strong>in</strong>ter precipitation<br />
on snow cover <strong>and</strong> spr<strong>in</strong>g streamflow, <strong>and</strong> of no change<br />
or a decrease <strong>in</strong> summer ra<strong>in</strong>fall on summer dry<strong>in</strong>g <strong>and</strong><br />
drought.<br />
Units 1961–1990 2035–2064 2070–2099<br />
20C3M B1 A2 A1F1 B1 A2 A1FI<br />
Temperature<br />
Annual °C 7.8 +2.1 +2.5 ±2.9 +2.9 ±4.5 ±5.3<br />
W<strong>in</strong>ter (DJF) °C –4.8 +1.1 +1.7 +3.1 +1.7 ±3.7 ±5.4<br />
Summer (JJA)<br />
Precipitation<br />
°C 20.0 +1.6 +2.2 ±3.1 +2.4 ±4.3 ±5.9<br />
Annual cm (%) 102.9 +5% +6% +8% +7% +9% +14%<br />
W<strong>in</strong>ter (DJF) cm (%) 20.95 +6% +8% +16% +12% +14% +30%<br />
Summer (JJA)<br />
Sea surface temperatures<br />
cm (%) 28.03 –1% –1% +3% –1% –2% 0%<br />
a<br />
Gulf of Ma<strong>in</strong>e °C 11.6 a<br />
+1.3 a<br />
+1.5 b<br />
– +1.9 a<br />
±3.3 b<br />
–<br />
Gulf Stream °C 23.4 a<br />
+0.9 a<br />
+1.3 b<br />
3.3 Sea surface temperatures<br />
– +1.2 a<br />
Terrestrial hydrology<br />
Evaporation mm/day 1.80 +0.10 – +0.16 +0.16 – +0.20<br />
Runoff mm/day 1.14 +0.12 – +0.09 +0.21 – +0.18<br />
Soil moisture %sat 55.0 +0.4 – +0.02 +1.0 – –0.07<br />
Streamflow<br />
Tim<strong>in</strong>g of spr<strong>in</strong>g peak flow centroid days 84.5 –5 – –8 –11 – –13<br />
Low flow days (Q < 0.0367 m 3 /s/km 2 ) days 65.5 –14 – –1.5 –26 – +22<br />
7-day low-flow amount % 100 –4 – –1 –4 – –11<br />
Drought frequency<br />
Short no. of droughts per 30 years 12.61 +5.12 – +7.19 +3.06 – ±9.99<br />
Medium no. of droughts per 30 years 0.57 +0.03 – +0.51 +0.39 – ±2.21<br />
Long no. of droughts per 30 years 0.03 +0.03 – +0.11 +0.04 – ±0.39<br />
Snow<br />
Total SWE mm 11.0 –4.4 – –5.5 –5.9 – –9.3<br />
Number of snow days days/month 5.2 –1.7 – –2.2 –2.4 – –3.8<br />
Grow<strong>in</strong>g season b<br />
First frost (autumn) day 295 +1 ±16 – +6 ±20 –<br />
Last frost (spr<strong>in</strong>g) day 111 –8 –14 – –16 –23 –<br />
Length of grow<strong>in</strong>g season days 184 +12 ±27 – ±29 ±43 –<br />
Spr<strong>in</strong>g <strong>in</strong>dices b<br />
First leaf day 98.8 –3.0 –5.2 –3.9 –6.7 –15 –15<br />
First bloom day 128.8 –3.7 –6.0 –5.6 –6.3 –15 –16<br />
Changes significantly different relative to the 1961–1990 annual distribution at the 99.9% confidence level or higher as determ<strong>in</strong>ed by a<br />
Student’s t-test are highlighted <strong>in</strong> bold, <strong>and</strong> <strong>changes</strong> significantly different under A1FI <strong>and</strong>/or A2 relative to B1 at the 99.9% confidence<br />
level are underl<strong>in</strong>ed<br />
a<br />
Based on SST output (‘‘tos’’) from HadCM3, MIROC, CGCM CCSM, <strong>and</strong> PCM only<br />
b Time periods restricted by output availability to 2047–2065 <strong>and</strong> 2082–2099<br />
123<br />
±2.3 b<br />
The f<strong>in</strong>al basic <strong>climate</strong> <strong>in</strong>dicator exam<strong>in</strong>ed here is<br />
regional sea surface temperatures (SSTs). SSTs are an<br />
important boundary condition on NE <strong>climate</strong>, as they<br />
determ<strong>in</strong>e the steepness of the north-to-south air<br />
temperature gradient across the region. Variability <strong>in</strong><br />
regional SSTs has also been l<strong>in</strong>ked to surface <strong>climate</strong><br />
anomalies <strong>in</strong> the NE, <strong>in</strong>clud<strong>in</strong>g the 1960s drought<br />
(Namias 1966; Bradbury et al. 2002). Off-shore, barocl<strong>in</strong>icity<br />
<strong>and</strong> storm track<strong>in</strong>g can respond themodynamically<br />
to SST anomalies <strong>in</strong> the vic<strong>in</strong>ity of the<br />
steep meridional SST gradient at the northern boundary<br />
of the Gulf Stream, creat<strong>in</strong>g positive feedback cycles<br />
–
K. Hayhoe et al.: Changes <strong>in</strong> <strong>climate</strong> <strong>and</strong> <strong>hydrological</strong> <strong>in</strong>dicators 391<br />
(Kushnir et al. 2002) that may affect atmospheric<br />
<strong>in</strong>stability over the NE region on seasonal or longer<br />
time-scales.<br />
Over the past century, a trend of +0.5°C/decade has<br />
been observed <strong>in</strong> regional SSTs <strong>in</strong> the Gulf of Ma<strong>in</strong>e<br />
<strong>and</strong> +0.3°C/decade <strong>in</strong> the Gulf Stream region (Fig. 3),<br />
with similar but slightly larger trends (+0.8°C/decade<br />
<strong>and</strong> +0.4°C/decade, respectively), be<strong>in</strong>g simulated by<br />
five of n<strong>in</strong>e AOGCMs exam<strong>in</strong>ed here for which ocean<br />
surface temperature outputs were available 3 . As shown<br />
<strong>in</strong> Fig. 3, the models are generally able to capture the<br />
seasonal cycles <strong>in</strong> terms of the average monthly means<br />
<strong>and</strong> the variance. The models are particularly skillful <strong>in</strong><br />
the vic<strong>in</strong>ity of the Gulf Stream, east of Cape Hatteras.<br />
However, the CCSM3, HadCM3, <strong>and</strong> MIROC models<br />
display a warm bias <strong>in</strong> the northern Gulf of Ma<strong>in</strong>e<br />
coastal region, where SSTs are largely <strong>in</strong>fluenced by<br />
the southeasterly Labrador Current. CGCM3 <strong>and</strong><br />
PCM do not appear to have these biases <strong>in</strong> the north<br />
<strong>and</strong>, thus, more realistically simulate the steep SST<br />
gradient observed at the northern boundary of the Gulf<br />
Stream. This may be <strong>in</strong>dicative of a general problem<br />
with the ability of global models to capture the complex<br />
ocean currents <strong>in</strong> this part of the Atlantic, such as<br />
the Labrador Current. Other more detailed studies<br />
(e.g., Dai et al. 2004) have shown that PCM also displays<br />
a systematic warm bias <strong>in</strong> ocean temperatures,<br />
which is at least partially due to its resolution, as it fails<br />
to resolve the smaller-scale processes <strong>and</strong> topographic<br />
features that determ<strong>in</strong>e the latitude at which the Gulf<br />
Stream separates from the eastern coast of North<br />
America.<br />
In the <strong>future</strong>, regional SSTs are projected to <strong>in</strong>crease<br />
<strong>in</strong> accordance with regional air temperatures<br />
(Table 3), with larger <strong>and</strong> more consistent year-round<br />
<strong>changes</strong> under the higher forc<strong>in</strong>g scenario. By 2070–<br />
2099, the annually averaged steep SST gradient north<br />
of the Gulf Stream is projected to decrease by 15–20%,<br />
cont<strong>in</strong>u<strong>in</strong>g the trends already seen <strong>in</strong> both observations<br />
<strong>and</strong> AOGCM simulations of the twentieth century.<br />
This implies potential impacts on NE surface <strong>climate</strong>,<br />
as feedbacks between SST anomalies <strong>and</strong> atmospheric<br />
<strong>in</strong>stability may weaken. These temperature <strong>in</strong>creases<br />
also have the potential to directly impact temperaturesensitive<br />
mar<strong>in</strong>e species that live <strong>in</strong> the waters, for<br />
example exp<strong>and</strong><strong>in</strong>g the range of warm water species<br />
northward <strong>and</strong> permitt<strong>in</strong>g <strong>in</strong>vasive species to exp<strong>and</strong><br />
<strong>in</strong>to previously colder waters.<br />
3 Monthly SST outputs for the historical <strong>and</strong> <strong>future</strong> periods were<br />
available from the CCSM3, CGCM3, HadCM3, Miroc (med res)<br />
<strong>and</strong> PCM1 models.<br />
300<br />
295<br />
290<br />
285<br />
K<br />
280<br />
275<br />
Jan Feb Mar Apr May Jun Jul Aug Sep Oct Nov Dec<br />
KEY<br />
Gulf of Ma<strong>in</strong>e<br />
Gulf Stream<br />
<strong>NOAA</strong>-ER MOD-avg<br />
(OBS) (5 models)<br />
4 Hydrological <strong>in</strong>dicators<br />
<strong>NOAA</strong>-ER SSTs<br />
1961-90 Ann-avg<br />
Fig. 3 Comparison of the seasonal cycle <strong>in</strong> observed mean sea<br />
surface temperatures (1961–1990) for the Gulf of Ma<strong>in</strong>e <strong>and</strong> a<br />
southern Gulf Stream region with 5-model average SSTs. Inset<br />
figure shows grid-po<strong>in</strong>ts from the <strong>NOAA</strong>-ER SST dataset—color<br />
coded with respect to the l<strong>in</strong>e graphs—on which<br />
regional averages were based, with comparable grids used for<br />
each model, <strong>and</strong> observed annual average SSTs, <strong>in</strong> degrees<br />
Kelv<strong>in</strong><br />
Changes <strong>in</strong> NE hydrology are driven by both temperature<br />
<strong>and</strong> precipitation. In terms of temperature, we<br />
have already seen historical advances <strong>in</strong> the dates of<br />
spr<strong>in</strong>g ice-out on lakes across the NE <strong>and</strong> <strong>in</strong> the tim<strong>in</strong>g<br />
of high-river flows over the northern part of the doma<strong>in</strong><br />
that are positively correlated with late w<strong>in</strong>ter/<br />
early spr<strong>in</strong>g surface air temperatures (Hodgk<strong>in</strong>s et al.<br />
2003). In addition, precipitation affects the total<br />
amount of water available as contributions to streamflow,<br />
groundwater, <strong>and</strong> lake levels, <strong>and</strong> the tim<strong>in</strong>g of<br />
peak <strong>and</strong> low flows as well as extreme events. Here, we<br />
exam<strong>in</strong>e four types of <strong>hydrological</strong> <strong>in</strong>dicators that<br />
would be expected to affect natural <strong>and</strong> human systems<br />
across the NE: terrestrial <strong>hydrological</strong> <strong>in</strong>dicators<br />
(evaporation, soil moisture, <strong>and</strong> runoff), summer dry<strong>in</strong>g<br />
or drought, streamflow, <strong>and</strong> w<strong>in</strong>ter snow cover.<br />
4.1 Evaporation, soil moisture, <strong>and</strong> runoff<br />
Observations are <strong>in</strong>sufficient to determ<strong>in</strong>e long-term<br />
<strong>and</strong> spatially coherent trends <strong>in</strong> most terrestrial<br />
<strong>hydrological</strong> variables across the NE. For that reason,<br />
we assess historical climatological averages <strong>and</strong> trends<br />
<strong>in</strong> regionally-averaged water balance components from<br />
the 50-year retrospective VIC simulation driven by<br />
observed temperature <strong>and</strong> precipitation records.<br />
Similar to precipitation, the time series of major<br />
components of the <strong>hydrological</strong> cycle <strong>in</strong> the NE are<br />
123
392 K. Hayhoe et al.: Changes <strong>in</strong> <strong>climate</strong> <strong>and</strong> <strong>hydrological</strong> <strong>in</strong>dicators<br />
Fig. 4 Annual time series of<br />
regionally averaged air<br />
temperature, precipitation,<br />
<strong>and</strong> water balance<br />
components (evaporation-toprecipitation<br />
ratio, snow<br />
water equivalent, runoff, soil<br />
moisture, <strong>and</strong> snow cover)<br />
from the 50-year<br />
retrospective VIC simulation<br />
driven by observed<br />
temperature <strong>and</strong> precipitation<br />
records from 1950 to 1999.<br />
The signature of the 1960s<br />
drought is seen <strong>in</strong> the time<br />
series of precipitation,<br />
evaporation, runoff, <strong>and</strong> soil<br />
moisture<br />
dom<strong>in</strong>ated by the drought period <strong>in</strong> the mid-1960s<br />
(Namias 1966). This event resulted <strong>in</strong> the lowest values<br />
of evaporation, runoff ,<strong>and</strong> soil moisture seen over the<br />
last 50 years (Fig. 4). A non-parametric test of trends<br />
from 1950 to 2000 <strong>in</strong>dicates slight <strong>in</strong>creases <strong>in</strong> evapotranspiration,<br />
runoff <strong>and</strong> soil moisture (weighted by<br />
the 1960s drought at the beg<strong>in</strong>n<strong>in</strong>g of the period),<br />
although none of these <strong>changes</strong> are statistically significant<br />
(Table 2). The last 30 years (1970–1999) show<br />
decreas<strong>in</strong>g, but also not significant, trends <strong>in</strong> water<br />
balance components that are generally consistent with<br />
<strong>in</strong>creas<strong>in</strong>g temperatures <strong>and</strong> little change <strong>in</strong> ra<strong>in</strong>fall<br />
over that time. AOGCM-driven VIC simulations for<br />
123<br />
the 20C3M scenario show trends of the same sign over<br />
both time periods.<br />
Over the com<strong>in</strong>g century, projected wetter w<strong>in</strong>ters<br />
<strong>and</strong> warmer temperatures drive <strong>in</strong>creases <strong>in</strong> w<strong>in</strong>ter<br />
runoff, decreases <strong>in</strong> spr<strong>in</strong>g runoff, <strong>and</strong> <strong>in</strong>creases <strong>in</strong><br />
annual runoff as peak runoff shifts to earlier <strong>in</strong> the year<br />
(Fig. 5; Table 3). Changes <strong>in</strong> runoff are generally<br />
greater under the higher A1FI scenario as compared<br />
with the lower B1, <strong>and</strong> for the more sensitive HadCM3<br />
model as compared with the less sensitive PCM.<br />
Regionally, <strong>changes</strong> <strong>in</strong> precipitation <strong>and</strong> hence runoff<br />
are most pronounced <strong>in</strong> the north. For example, <strong>in</strong><br />
the southwest part of the doma<strong>in</strong> (region 1, PA–NY),
K. Hayhoe et al.: Changes <strong>in</strong> <strong>climate</strong> <strong>and</strong> <strong>hydrological</strong> <strong>in</strong>dicators 393<br />
Fig. 5 30-year mean annual<br />
evapotranspiration versus<br />
runoff from the four <strong>future</strong><br />
<strong>climate</strong> simulations (HadCM3<br />
<strong>and</strong> PCM A1FI <strong>and</strong> B1)<br />
averaged over the NE region<br />
<strong>and</strong> the four sub-regions.<br />
Both evaporation <strong>and</strong> runoff<br />
tend to <strong>in</strong>crease over time,<br />
with proportionally greater<br />
<strong>in</strong>creases <strong>in</strong> runoff relative to<br />
evaporation <strong>in</strong> regions 3 <strong>and</strong> 4<br />
as compared with regions 1<br />
<strong>and</strong> 2<br />
<strong>in</strong>creases <strong>in</strong> runoff range from 9 to 18% as compared<br />
with 11–27% <strong>in</strong> the northeast (region 3, NH–VT–MA–<br />
CT–RI).<br />
Ris<strong>in</strong>g temperatures are projected to <strong>in</strong>crease<br />
evaporation across the NE. In general, <strong>changes</strong> are <strong>in</strong><br />
general evenly distributed across the region (e.g., endof-century<br />
<strong>in</strong>creases of 9–17% <strong>in</strong> region 1, 4–16% <strong>in</strong><br />
region 3). Most <strong>in</strong>creases are projected to occur <strong>in</strong> the<br />
spr<strong>in</strong>g <strong>and</strong> summer for all scenarios <strong>and</strong> appear to be<br />
primarily driven by <strong>in</strong>creas<strong>in</strong>g temperatures <strong>and</strong><br />
available soil moisture from <strong>in</strong>creased precipitation.<br />
W<strong>in</strong>ter evapotranspiration is relatively small <strong>in</strong> comparison<br />
but does show a decrease, especially <strong>in</strong> the<br />
east, because the decrease <strong>in</strong> snow pack (caused by<br />
<strong>in</strong>creased temperatures) reduces the total amount of<br />
sublimation.<br />
Increased evapotranspiration comb<strong>in</strong>ed with low<br />
early fall precipitation produces a late summer decrease<br />
<strong>in</strong> soil moisture. These <strong>changes</strong> are most obvious<br />
for A1FI, with its higher temperature change.<br />
W<strong>in</strong>ter/early spr<strong>in</strong>g soil moisture <strong>in</strong>creases dramatically<br />
<strong>in</strong> the <strong>future</strong>, driven by more precipitation <strong>and</strong><br />
<strong>in</strong>creased snowmelt from the higher temperatures.<br />
These <strong>changes</strong> have important implications for <strong>future</strong><br />
water availability <strong>and</strong> drought <strong>in</strong> the NE. As<br />
w<strong>in</strong>ters become wetter <strong>and</strong> summers hotter <strong>and</strong> drier,<br />
agricultural, <strong>and</strong> natural ecosystems that depend on<br />
seasonal ra<strong>in</strong>fall, runoff, <strong>and</strong> soil moisture are likely to<br />
Evaporation (mm/day)<br />
Evaporation (mm/day)<br />
Evaporation (mm/day)<br />
2.2<br />
2<br />
1.8<br />
1.6<br />
2.2<br />
2<br />
1.8<br />
1.6<br />
2.2<br />
2<br />
1.8<br />
1.6<br />
Northeast<br />
1 1.2 1.4 1.6 1.8<br />
Region 2 (NY)<br />
1 1.2 1.4 1.6 1.8<br />
Region 1 (PA-NJ)<br />
1 1.2 1.4 1.6 1.8<br />
Runoff (mm/day)<br />
be affected. Any chang<strong>in</strong>g balance between evapotranspiration<br />
<strong>and</strong> precipitation dur<strong>in</strong>g the grow<strong>in</strong>g<br />
season will have a significant effect on natural vegetation<br />
<strong>and</strong> ra<strong>in</strong>fed agriculture <strong>in</strong> the region (which <strong>in</strong>cludes<br />
most crops grown for gra<strong>in</strong> <strong>and</strong> silage). Changes<br />
<strong>in</strong> vegetation can <strong>in</strong> turn impact the tim<strong>in</strong>g of the<br />
<strong>hydrological</strong> cycle, such as the tim<strong>in</strong>g of transition<br />
from spr<strong>in</strong>g to summer-like conditions (Dirmeyer <strong>and</strong><br />
Brubaker 2006).<br />
The soil moisture projections presented here,<br />
although highly variable, suggest a general <strong>in</strong>crease <strong>in</strong><br />
dry conditions (Table 3). This is important, as even<br />
very short (e.g., 1–4 weeks) water deficits dur<strong>in</strong>g critical<br />
growth stages can have profound effects on plant<br />
productivity <strong>and</strong> reproductive success. These model<br />
simulations do not <strong>in</strong>clude the <strong>changes</strong> <strong>in</strong> seasonal<br />
vegetation driven by a longer grow<strong>in</strong>g season (i.e.,<br />
earlier start up <strong>and</strong> later drop off <strong>in</strong> transpiration flux);<br />
hence, impacts of <strong>climate</strong> change on summer <strong>and</strong> fall<br />
water availability may be enhanced relative to those<br />
projected here. To exam<strong>in</strong>e further impacts, we next<br />
evaluate potential <strong>changes</strong> <strong>in</strong> extreme drought events<br />
<strong>and</strong> general drought frequency across the NE.<br />
4.2 Drought<br />
2.2<br />
2<br />
1.8<br />
1.6<br />
2.2<br />
2<br />
1.8<br />
1.6<br />
HadCM3 SRESA1<br />
HadCM3 SRESB1<br />
PCM SRESA1<br />
PCM SRESB1<br />
Region 4 (ME)<br />
1 1.2 1.4 1.6 1.8<br />
Region 3 (NH-VT-MA-CT-RI)<br />
1 1.2 1.4 1.6 1.8<br />
Runoff (mm/day)<br />
1961-1990<br />
2036-2065<br />
2070-2099<br />
One of the most important <strong>hydrological</strong> events <strong>in</strong> the<br />
NE over the past century was the 1960s drought, which<br />
123
394 K. Hayhoe et al.: Changes <strong>in</strong> <strong>climate</strong> <strong>and</strong> <strong>hydrological</strong> <strong>in</strong>dicators<br />
lasted from 1962 to 1965. In addition to the impacts on<br />
agriculture <strong>and</strong> natural ecosystems across the region<br />
(Janes <strong>and</strong> Brumbach 1965; Paulson et al. 1991;<br />
Leathers et al. 2000), this drought also greatly reduced<br />
water supply. For example, <strong>in</strong> the summer of 1965, at<br />
the height of the drought, New York City stopped<br />
releas<strong>in</strong>g water from its Delaware River reservoirs to<br />
ma<strong>in</strong>ta<strong>in</strong> its withdrawal rate. The result<strong>in</strong>g drop <strong>in</strong><br />
Delaware River streamflow levels risked salt-water<br />
<strong>in</strong>trusion <strong>in</strong>to Philadelphia’s water supply system<br />
(USDA 2000).<br />
With soil moisture, streamflow, <strong>and</strong> agricultural<br />
systems <strong>in</strong> the NE dependent on natural ra<strong>in</strong>fall, even<br />
short periods of drought can have significant impacts.<br />
Here, we exam<strong>in</strong>e potential <strong>changes</strong> <strong>in</strong> two types of<br />
drought <strong>in</strong> the <strong>future</strong>. The first is a common drought<br />
(occurr<strong>in</strong>g several times per decade), as def<strong>in</strong>ed by<br />
VIC-simulated soil moisture deficits, while the second<br />
type is severe drought (i.e., similar to the drought observed<br />
dur<strong>in</strong>g the 1960s), <strong>and</strong> is based on AOGCMsimulated<br />
precipitation deficits.<br />
Soil moisture deficits relate directly to the availability<br />
of water for agriculture <strong>and</strong> water supply. They<br />
reflect the aggregate effect of all hydrologic processes<br />
<strong>in</strong>clud<strong>in</strong>g <strong>changes</strong> <strong>in</strong> short-term precipitation events,<br />
temperature sw<strong>in</strong>gs, evaporative dem<strong>and</strong>, <strong>and</strong> the<br />
longer-term effects of soil dra<strong>in</strong>age <strong>and</strong> <strong>changes</strong> <strong>in</strong><br />
<strong>climate</strong> (Sheffield et al. 2004b). A climatology of simulated<br />
soil moisture values was generated from the<br />
VIC retrospective (observationally-driven) simulations.<br />
Drought <strong>in</strong>tensity for a particular month was<br />
calculated as the percentile soil moisture value relative<br />
to the climatology (Sheffield et al. 2004b). A drought<br />
event was then specified as a number of consecutive<br />
months with soil moisture percentile values less than<br />
10%, with droughts be<strong>in</strong>g classified as short- (1–<br />
3 months), medium- (3–6 months), <strong>and</strong> long-term<br />
(6+ months).<br />
A general <strong>in</strong>crease <strong>in</strong> drought frequency is projected<br />
<strong>in</strong> the <strong>future</strong>, especially under the A1FI scenario<br />
(Fig. 6). This is driven by reductions <strong>in</strong> mean monthly<br />
soil moisture dur<strong>in</strong>g summer <strong>and</strong> autumn as a result of<br />
<strong>in</strong>creased evapotranspiration <strong>and</strong> reduced precipitation,<br />
<strong>and</strong> is consistent with the projected <strong>changes</strong> <strong>in</strong><br />
low-flows discussed next, albeit with <strong>changes</strong> that are<br />
highly variable both spatially as well as between scenarios.<br />
Additional <strong>in</strong>creases <strong>in</strong> evapotranspiration<br />
could be expected due to the extension of the grow<strong>in</strong>g<br />
season. Under the A1FI scenario, the frequency of<br />
short-term droughts reaches 1 per year on average <strong>in</strong><br />
the north <strong>and</strong> east of the doma<strong>in</strong> by the end of the<br />
twenty-first century. Medium-term drought frequencies<br />
also <strong>in</strong>crease considerably for A1FI but show only<br />
123<br />
slight <strong>changes</strong> under B1. Droughts longer than<br />
6 months are <strong>in</strong>frequent due to the high variability <strong>in</strong><br />
<strong>climate</strong> forc<strong>in</strong>gs <strong>and</strong> marked lack of dist<strong>in</strong>ct wet/dry<br />
seasons, but the local maxima <strong>in</strong> western New York<br />
State <strong>in</strong>creases twofold under A1FI <strong>and</strong> exp<strong>and</strong>s<br />
eastward <strong>in</strong> both scenarios by 2070–2099. This region<br />
co<strong>in</strong>cides with the location of maximum drought<br />
length, which is over 10 months by 2070–2099.<br />
Due to the importance of the 1960s drought, we also<br />
exam<strong>in</strong>e model ability to simulate extreme drought<br />
events <strong>and</strong> any potential <strong>changes</strong> <strong>in</strong> their return period<br />
<strong>in</strong> the <strong>future</strong>. The historic drought that persisted<br />
throughout the NE <strong>in</strong> the 1960s was driven primarily<br />
by precipitation shortfalls (Namias 1966). We therefore<br />
calculate mov<strong>in</strong>g averages of precipitation deficits over<br />
four, six, eight, <strong>and</strong> ten consecutive seasons from<br />
available USHCN stations <strong>and</strong> from the historical<br />
AOGCM simulations from 1900 to 1999, to quantify<br />
precipitation deficits for the most severe drought<br />
events over a range of time scales.<br />
Most precipitation-based severe drought events<br />
simulated by the AOGCMs for the NE are, on average,<br />
less <strong>in</strong>tense than the benchmark 1960s event (Fig. 7). In<br />
fact, only two ensemble members—of a total of 38<br />
century-long runs from n<strong>in</strong>e models—simulated an<br />
event of greater <strong>in</strong>tensity than observed dur<strong>in</strong>g the<br />
1960s as measured us<strong>in</strong>g any of the four <strong>in</strong>terval periods<br />
(four, six, eight, <strong>and</strong> ten consecutive season <strong>in</strong>tervals).<br />
It should be noted, however, that the 1960s event, which<br />
peaked dur<strong>in</strong>g the summers of 1964 <strong>and</strong> 1965, was the<br />
worst drought to occur <strong>in</strong> the NE region s<strong>in</strong>ce the<br />
beg<strong>in</strong>n<strong>in</strong>g of record keep<strong>in</strong>g <strong>in</strong> the late n<strong>in</strong>eteenth<br />
century (Leathers et al. 2000), <strong>and</strong> possibly s<strong>in</strong>ce<br />
European settlement (Ludlum 1976). Still, we conclude<br />
from these results that while the coupled global models<br />
are able to simulate meteorologic drought events of<br />
moderate persistence, they do not simulate the severe<br />
magnitude of precipitation deficits that are comparable<br />
to those observed dur<strong>in</strong>g the 1960s.<br />
The same method was then applied to AOGCM<br />
<strong>future</strong> simulations, where the maximum precipitation<br />
shortfalls were computed relative to 1961–1990 averages<br />
from each model. Future model projections show<br />
greater variation than the historical 20C3M runs<br />
(Fig. 7) <strong>and</strong> the average magnitude of the most severe<br />
twenty-first century drought events is projected to be<br />
slightly less than twentieth century events, at least <strong>in</strong><br />
terms of precipitation deficits. However, to account<br />
for the fact that the AOGCMs generally project an<br />
<strong>in</strong>crease <strong>in</strong> annual mean precipitation through the<br />
twenty-first century (Fig. 2), the same analysis was also<br />
conducted on detrended precipitation time series<br />
from all B1 <strong>and</strong> A2 simulations. Not surpris<strong>in</strong>gly, the
K. Hayhoe et al.: Changes <strong>in</strong> <strong>climate</strong> <strong>and</strong> <strong>hydrological</strong> <strong>in</strong>dicators 395<br />
Fig. 6 Frequency of short (1–3 month), medium (3–6 months)<br />
<strong>and</strong> long-term (6 + months) droughts <strong>and</strong> the maximum drought<br />
duration (<strong>in</strong> months) for the historic (1961–1990) <strong>and</strong> <strong>future</strong><br />
(2070–2099) periods. Droughts are def<strong>in</strong>ed as deficits of 10% or<br />
more <strong>in</strong> monthly soil moisture relative to the climatological<br />
analysis of detrended output yielded slightly more<br />
severe <strong>future</strong> drought events relative to the raw<br />
output, suggest<strong>in</strong>g that our method of characteriz<strong>in</strong>g<br />
the severity of <strong>future</strong> drought is somewhat sensitive<br />
to projected upward trends <strong>in</strong> twenty-first century<br />
precipitation. Without tak<strong>in</strong>g <strong>in</strong>to account projected<br />
<strong>in</strong>creases <strong>in</strong> temperature <strong>and</strong> evapotranspiration, we<br />
conclude from this analysis of AOGCM output alone<br />
that severe <strong>and</strong> persistent region-wide precipitation<br />
deficits <strong>in</strong> the twenty-first century are projected to be<br />
roughly equivalent to those observed dur<strong>in</strong>g the recent<br />
past, regardless of the emissions pathway.<br />
mean. Values are the average of the HadCM3 <strong>and</strong> PCM-forced<br />
VIC simulations for the A1FI <strong>and</strong> B1 scenarios. Increases are<br />
greatest for the shorter drought events <strong>and</strong> under the A1FI<br />
scenario as compared with B1<br />
Despite the lack of projected <strong>changes</strong> <strong>in</strong> extreme<br />
precipitation deficits, the projections of drier, hotter<br />
summers <strong>and</strong> more frequent short- <strong>and</strong> medium-term<br />
droughts imply a series of potentially serious impacts<br />
on water supply <strong>and</strong> agriculture. Even very short (1–<br />
4 weeks) water deficits dur<strong>in</strong>g critical growth stages<br />
can have profound effects on plant productivity <strong>and</strong><br />
reproductive success. Dur<strong>in</strong>g a drought, evapotranspiration<br />
cont<strong>in</strong>ues to draw on surface water resources,<br />
further deplet<strong>in</strong>g supply. As a water deficit deepens,<br />
productivity of natural vegetation <strong>and</strong> agriculture<br />
drops. Water use restrictions, such as outdoor water<strong>in</strong>g<br />
123
396 K. Hayhoe et al.: Changes <strong>in</strong> <strong>climate</strong> <strong>and</strong> <strong>hydrological</strong> <strong>in</strong>dicators<br />
bans <strong>and</strong> household conservation measures, are<br />
frequently implemented at the city <strong>and</strong> town level.<br />
Increas<strong>in</strong>g water dem<strong>and</strong> has also <strong>in</strong>creased the perceived<br />
severity of droughts (Lyon et al. 2005). As soil<br />
moisture is further depleted <strong>and</strong> vegetation becomes<br />
<strong>in</strong>creas<strong>in</strong>gly water stressed, the risk of wildfires also<br />
rises (e.g., Amiro et al. 2001; Brown et al. 2004).<br />
4.3 Streamflow<br />
Precipitation deficit (%)<br />
0.0<br />
-10.0<br />
-20.0<br />
-30.0<br />
-40.0<br />
4-season 6-season 8-season 10-season<br />
Fig. 7 Mean precipitation deficits (%) correspond<strong>in</strong>g to the most<br />
severe observed <strong>and</strong> simulated drought events <strong>in</strong> the NE based<br />
on mov<strong>in</strong>g averages over four, six, eight, <strong>and</strong> ten consecutive<br />
seasons. Results are derived from regionally averaged USHCN<br />
station data, historical AOGCM simulations (20C3M; 1900–1999)<br />
<strong>and</strong> twenty-first century <strong>climate</strong> simulations (B1 <strong>and</strong> A2; 2000–<br />
2099). Solid bars <strong>in</strong>dicate the ensemble average value from eight<br />
AOGCMs, while the whiskers <strong>in</strong>dicate the range of projections<br />
We use two metrics to quantify the relationship<br />
between <strong>climate</strong> <strong>and</strong> streamflow <strong>in</strong> the NE. The first<br />
metric is the amount of flow that occurs <strong>in</strong> specific<br />
quantiles, particularly the lowest <strong>and</strong> highest ones<br />
where the greatest impacts can be expected (i.e., floods<br />
or dry periods). The second metric is the tim<strong>in</strong>g of<br />
specific events <strong>in</strong> the annual cycle, such as the tim<strong>in</strong>g of<br />
high-spr<strong>in</strong>g flow <strong>and</strong> the duration of the low-flow period<br />
<strong>in</strong> the summer.<br />
In general, the AOGCM-driven VIC simulations<br />
<strong>in</strong>dicate that <strong>climate</strong> change is likely to drive a re-distribution<br />
of streamflow. There is a general tendency<br />
toward more streamflow <strong>in</strong> w<strong>in</strong>ter <strong>and</strong> spr<strong>in</strong>g, <strong>and</strong> less <strong>in</strong><br />
summer <strong>and</strong> fall. This translates <strong>in</strong>to higher w<strong>in</strong>ter highflow<br />
events <strong>and</strong> lower summer low flows. Analysis of<br />
projected <strong>changes</strong> <strong>in</strong> the probability of w<strong>in</strong>ter 10th<br />
percentile low flows <strong>and</strong> 90th percentile high flows<br />
(Fig. 8) shows that the probability of w<strong>in</strong>ter low flows is<br />
likely to decrease by ~5–10% (i.e., more low flow<br />
events), with greater <strong>changes</strong> toward the northern part<br />
of the doma<strong>in</strong>. A much larger <strong>in</strong>crease <strong>in</strong> the probability<br />
for high flows is projected, with a greater <strong>in</strong>crease under<br />
the A1FI scenario (40–70%) relative to B1 (20–40%)<br />
<strong>and</strong> toward the northern part of the doma<strong>in</strong> where<br />
snowmelt is the dom<strong>in</strong>ant <strong>in</strong>fluence on w<strong>in</strong>ter <strong>and</strong> spr<strong>in</strong>g<br />
streamflow. An <strong>in</strong>-depth analysis of projected trends <strong>in</strong><br />
annual flow quantiles for the s<strong>in</strong>gle model simulation<br />
123<br />
USHCN (Obs)<br />
20C3M (38)<br />
B1 (25)<br />
B1 detrend (25)<br />
A2 (22)<br />
A2 detrend (22)<br />
from the full set of models. Numbers <strong>in</strong> parentheses <strong>in</strong>dicate the<br />
number of ensemble members whose results were averaged to<br />
generate the displayed values. In general, AOGCM simulations<br />
tend to under-estimate the magnitude of potential extreme<br />
droughts <strong>in</strong> the NE, although the uncerta<strong>in</strong>ty range encompasses<br />
the observed deficits. Little change is projected <strong>in</strong> the magnitude<br />
of <strong>future</strong> extreme drought events<br />
with the greatest <strong>changes</strong> (HadCM3 A1FI) for all 51<br />
unmanaged streams from 2000 to 2099 clearly illustrates<br />
these oppos<strong>in</strong>g trends <strong>in</strong> different flow regimes (Fig. 9).<br />
On an annual basis, from the 50th up to the 95th percentile,<br />
there are <strong>in</strong>creases <strong>in</strong> projected flows, while for<br />
the lower 25th down to fifth percentiles, decreases are<br />
projected. In other words, these projections <strong>in</strong>dicate<br />
<strong>in</strong>creased variability: both more high-flow events <strong>and</strong><br />
more low-flow events over the course of the year.<br />
The projected <strong>in</strong>crease <strong>in</strong> variability is consistent with<br />
<strong>in</strong>creases <strong>in</strong> precipitation projected dur<strong>in</strong>g the late fall,<br />
w<strong>in</strong>ter, <strong>and</strong> spr<strong>in</strong>g as compared with little to no <strong>changes</strong><br />
<strong>in</strong> summer, <strong>and</strong> with <strong>in</strong>creas<strong>in</strong>g summertime dry<strong>in</strong>g due<br />
to higher evapotranspiration. Differences between<br />
these streamflow projections <strong>and</strong> earlier ones for the NE<br />
that showed decreases <strong>in</strong> overall streamflow (e.g.,<br />
Moore et al. 1997) can be attributed to our updated <strong>and</strong><br />
broader range of AOGCM forc<strong>in</strong>g scenarios, which<br />
<strong>in</strong>dicate <strong>in</strong>creases <strong>in</strong> w<strong>in</strong>ter precipitation. Overall, these<br />
trends are also consistent with seasonal <strong>and</strong> annual<br />
<strong>in</strong>creases <strong>in</strong> runoff (Fig. 4) because there are substantially<br />
higher flow volumes <strong>in</strong> the higher (<strong>in</strong>creas<strong>in</strong>g)<br />
quantiles than <strong>in</strong> the lower (decreas<strong>in</strong>g) quantiles.<br />
Increas<strong>in</strong>g trends <strong>in</strong> late w<strong>in</strong>ter <strong>and</strong> early spr<strong>in</strong>g<br />
streamflow, <strong>and</strong> advances of 1–2 weeks <strong>in</strong> the date of<br />
peak streamflow 4 have been observed over the northern<br />
part of the NE, with most of the change occurr<strong>in</strong>g<br />
from 1970 to 2000 (Hodgk<strong>in</strong>s et al. 2003, 2005a). These<br />
<strong>changes</strong> are positively correlated with March–April air<br />
temperature, which determ<strong>in</strong>es the date at which ice<br />
ceases to affect flow 5 as well as the tim<strong>in</strong>g of snow melt.<br />
4 The date of peak streamflow is def<strong>in</strong>ed as the center of volume,<br />
or the date on which half of the flow occurr<strong>in</strong>g between 1<br />
January <strong>and</strong> 31 May has passed the gauge.<br />
5 For rivers, the presence of ice can be determ<strong>in</strong>ed by stream<br />
discharge measurements based on cont<strong>in</strong>uously measured river<br />
stages, which are affected by ice <strong>in</strong> easily identifiable ways.
K. Hayhoe et al.: Changes <strong>in</strong> <strong>climate</strong> <strong>and</strong> <strong>hydrological</strong> <strong>in</strong>dicators 397<br />
Fig. 8 Projected change <strong>in</strong><br />
the probability of (a) low<br />
(10%) <strong>and</strong> (b) high (90%)<br />
flows from the historic (1961–<br />
1990) to the <strong>future</strong> (2070–<br />
2099) periods for w<strong>in</strong>ter<br />
(DJF) for selected<br />
unmanaged bas<strong>in</strong>s. AOGCMdriven<br />
VIC simulations<br />
<strong>in</strong>dicate a decreased<br />
probability of low-flow events<br />
<strong>and</strong> <strong>in</strong>creased probability of<br />
high flows, with significantly<br />
higher flows across much of<br />
the northern part of the NE<br />
under the A1FI scenario as<br />
compared with B1<br />
For example, for 80 stations north of 44°N latitude for<br />
the period 1953 through 2002, 69, 75, <strong>and</strong> 94% of all<br />
stations had <strong>in</strong>creas<strong>in</strong>g mean monthly runoff for<br />
January, February, <strong>and</strong> March, respectively (Hodgk<strong>in</strong>s<br />
<strong>and</strong> Dudley 2006b). In contrast, about two-thirds of all<br />
stations had trends toward decreas<strong>in</strong>g streamflow for<br />
the month of May. Historical records from 1936 to<br />
2000 <strong>in</strong>dicate that, on average, the last dates of<br />
123
398 K. Hayhoe et al.: Changes <strong>in</strong> <strong>climate</strong> <strong>and</strong> <strong>hydrological</strong> <strong>in</strong>dicators<br />
Fig. 9 Twenty-first century stream flow quantiles (<strong>in</strong> units of<br />
m 3 /s) based on AOGCM-driven VIC projections for the 51-river<br />
area-weighted annual average discharges, calculated based on<br />
daily flows from 2000 to 2099. Values shown are based on the<br />
HadCM3 <strong>climate</strong> projections only, for the A1FI scenario. Flows<br />
show <strong>in</strong>creas<strong>in</strong>g trends for the 50th quantile <strong>and</strong> above, <strong>and</strong><br />
decreas<strong>in</strong>g trends for the 25th quantile <strong>and</strong> below<br />
ice-affected flow occurred 11 days earlier <strong>in</strong> the<br />
spr<strong>in</strong>g <strong>in</strong> 12 of 16 rural unregulated streams studied<br />
(Hodgk<strong>in</strong>s et al. 2005a). These <strong>changes</strong> are most likely<br />
due to shifts <strong>in</strong> streamflow from later to earlier <strong>in</strong> the<br />
year as snow beg<strong>in</strong>s to melt earlier, s<strong>in</strong>ce late spr<strong>in</strong>g<br />
streamflow has been decreas<strong>in</strong>g (Hodgk<strong>in</strong>s <strong>and</strong> Dudley<br />
2006b).<br />
When the VIC model is forced with AOGCMsimulated<br />
historical temperature <strong>and</strong> precipitation<br />
from 1960 to 1999, it is able to correctly capture the<br />
shift to earlier spr<strong>in</strong>g peak flow as measured by stream<br />
gauge observations (Fig. 10). However, simulations<br />
actually under-estimate the rate of advance (only<br />
0.11 day/year, as compared to the observed average<br />
advance of 0.23–0.46 days/year <strong>in</strong> northern <strong>and</strong><br />
mounta<strong>in</strong>ous areas, Table 2). This is likely due to their<br />
failure to capture the dramatic w<strong>in</strong>ter warm<strong>in</strong>g the NE<br />
has experienced over that time. This trend also may<br />
reflect the shift toward an <strong>in</strong>crease <strong>in</strong> the ratio of ra<strong>in</strong><br />
to snow <strong>in</strong> the w<strong>in</strong>ter (Hunt<strong>in</strong>gton et al. 2004).<br />
In the <strong>future</strong>, peak streamflow <strong>in</strong> spr<strong>in</strong>g is projected<br />
to cont<strong>in</strong>ue to occur earlier <strong>in</strong> the year, with further<br />
advances of 5–8 days by mid-century (Fig. 10). End-ofcentury<br />
<strong>changes</strong> are larger under the higher emissions<br />
scenario (+15 days under A1FI as compared to<br />
+10 days under B1).<br />
In the summer <strong>and</strong> autumn, streamflow tends to<br />
drop as temperatures <strong>and</strong> evaporation rise. The US<br />
Fish <strong>and</strong> Wildlife Service (USFWS) has def<strong>in</strong>ed a low<br />
flow threshold of 0.5 cfs/sq mi (0.037 m 3 /s/km 2 ),<br />
123<br />
Fig. 10 Projections of tim<strong>in</strong>g of snowmelt-driven high spr<strong>in</strong>g<br />
flow, as represented by shifts <strong>in</strong> the center of volume date for 51<br />
unregulated rivers <strong>in</strong> the NE, correspond<strong>in</strong>g to VIC simulations<br />
driven by observed temperature <strong>and</strong> precipitation <strong>and</strong> by the<br />
A1FI <strong>and</strong> B1 scenarios as simulated by HadCM3 <strong>and</strong> PCM. By<br />
end-of-century, <strong>changes</strong> under the A1FI scenario are approximately<br />
twice those projected under the B1 scenario<br />
equivalent to August median flow, as the m<strong>in</strong>imum<br />
streamflow required for summertime ma<strong>in</strong>tenance of<br />
habitat for biota <strong>in</strong> New Engl<strong>and</strong> streams (USFWS<br />
1981). The flow <strong>in</strong> many streams currently drops below<br />
this threshold for several weeks <strong>in</strong> mid- to late-summer,<br />
but more frequent <strong>and</strong>/or extended periods of<br />
streamflow below this threshold could adversely affect<br />
stream habitat for aquatic biota.<br />
Dur<strong>in</strong>g the twentieth century, no significant decrease<br />
<strong>in</strong> summer/fall low flows or change <strong>in</strong> the tim<strong>in</strong>g<br />
of those low-flow events has been observed (Hodgk<strong>in</strong>s<br />
et al. 2005b). Increases <strong>in</strong> precipitation over the last<br />
century may have compensated for any <strong>in</strong>creases <strong>in</strong><br />
evapotranspiration, mask<strong>in</strong>g any underly<strong>in</strong>g trend.<br />
Projected <strong>future</strong> <strong>changes</strong> <strong>in</strong> low-flow amounts <strong>and</strong><br />
duration differ significantly between the higher A1FI<br />
<strong>and</strong> lower B1 scenarios. Under A1FI, the 7-day consecutive<br />
low-flow amounts from every year are projected<br />
to decrease on the order of 10% or more for 51<br />
unmanaged rivers <strong>in</strong> the NE (Fig. 11). Changes under<br />
B1 are smaller,
K. Hayhoe et al.: Changes <strong>in</strong> <strong>climate</strong> <strong>and</strong> <strong>hydrological</strong> <strong>in</strong>dicators 399<br />
Fig. 11 Projections of the change <strong>in</strong> the lowest consecutive<br />
cumulative 7-day flow amounts for each year for 51 unregulated<br />
rivers <strong>in</strong> the NE correspond<strong>in</strong>g to correspond<strong>in</strong>g to VIC<br />
simulations driven by observed temperature <strong>and</strong> precipitation<br />
<strong>and</strong> by the A1FI <strong>and</strong> B1 scenarios as simulated by HadCM3 <strong>and</strong><br />
PCM. Values are shown relative to the 1961–1990 average<br />
(100%), although historical curves fall below this value due to<br />
the LOWESS smooth<strong>in</strong>g function, which m<strong>in</strong>imizes the <strong>in</strong>fluence<br />
of outliers <strong>and</strong> <strong>in</strong> that sense is more analagous to the median<br />
than the mean (Helsel <strong>and</strong> Hirsh 1992). Observation-driven VIC<br />
simulations show the <strong>in</strong>fluence of the extraord<strong>in</strong>ary 1960s<br />
drought. In the <strong>future</strong>, A1FI scenarios show decreas<strong>in</strong>g trends<br />
<strong>in</strong> the average low-flow amounts, while B1-based <strong>changes</strong> are<br />
ambiguous<br />
emission scenario. Furthermore, it appears that these<br />
<strong>changes</strong> likely represent the net effect of <strong>in</strong>teractions<br />
between multiple factors, with the effect of temperature-driven<br />
<strong>in</strong>creases <strong>in</strong> evapotranspiration beg<strong>in</strong>n<strong>in</strong>g<br />
to dom<strong>in</strong>ate under the higher A1FI scenario.<br />
Fig. 12 Projected <strong>changes</strong> <strong>in</strong> average daily flows dur<strong>in</strong>g the<br />
period 21 May through 31 October, <strong>in</strong> units of cubic meters per<br />
second per square kilometer of dra<strong>in</strong>age area, such that the<br />
overall average reflects the mean of the 51 stream values<br />
irrespective of the area of their dra<strong>in</strong>age bas<strong>in</strong>s. 1961–1990<br />
(mod) is based on VIC-simulated hydrology driven by HadCM3/<br />
PCM simulations based on estimated natural <strong>and</strong> human forc<strong>in</strong>g,<br />
while 1961–1990 (obs) is based on VIC-simulated hydrology<br />
driven by observed temperature <strong>and</strong> precipitation over that time.<br />
These projections <strong>in</strong>dicate more variability <strong>in</strong> flow,<br />
with significant implications for many aspects of the<br />
NE. Overall, the impacts are likely to be greatest for<br />
aquatic biota most sensitive to the tim<strong>in</strong>g of highspr<strong>in</strong>g<br />
flow (such as spr<strong>in</strong>g spawners), <strong>and</strong> for river<br />
systems where even moderate reductions <strong>in</strong> summer<br />
low flows could adversely affect habitat or place added<br />
pressure on competition for surface water resources.<br />
Higher w<strong>in</strong>ter flows are related to an <strong>in</strong>crease <strong>in</strong> the<br />
frequency of mid-w<strong>in</strong>ter ice jams that resulted <strong>in</strong> major<br />
flood<strong>in</strong>g <strong>and</strong> damage to <strong>in</strong>frastructure (Beltaos <strong>and</strong><br />
Prowse 2002). Changes <strong>in</strong> the tim<strong>in</strong>g of high-spr<strong>in</strong>g<br />
flow may also <strong>in</strong>fluence survival of Atlantic salmon. If<br />
spr<strong>in</strong>g peak migration of juvenile salmon from freshwater<br />
rivers (which is controlled by a comb<strong>in</strong>ation of<br />
photoperiod, temperature, <strong>and</strong> flow) becomes out of<br />
phase by as much as 2 weeks with optimal environmental<br />
conditions <strong>in</strong> rivers, estuaries or the ocean,<br />
salmon survival could be adversely affected (McCormick<br />
et al. 1998). Another concern is ris<strong>in</strong>g water<br />
temperatures (e.g., the Wild River <strong>in</strong> Ma<strong>in</strong>e, Hunt<strong>in</strong>gton<br />
et al. 2003). Ecological projections call for<br />
major stress on cold-water fish <strong>in</strong> the next century due<br />
to ris<strong>in</strong>g temperatures alone (e.g., Sch<strong>in</strong>dler 2001).<br />
These <strong>changes</strong> will likely be exacerbated by the lowflows<br />
projected to occur under higher emission scenarios.<br />
F<strong>in</strong>ally, even <strong>in</strong> NE where water is considered<br />
relatively abundant, there are already issues aris<strong>in</strong>g<br />
over competition for limited water supplies among<br />
agricultural (e.g., blueberries <strong>in</strong> Ma<strong>in</strong>e), <strong>in</strong>dustrial<br />
Future projections correspond to VIC model simulations driven<br />
by the A1FI <strong>and</strong> B1 scenarios as simulated by HadCM3 <strong>and</strong><br />
PCM. The US Fish <strong>and</strong> Wildlife Service (USFWS) low flow<br />
threshold of 0.037 m 3 /s/km 2<br />
(USFWS 1981) is shown for<br />
reference. Compared with the black l<strong>in</strong>e (historical observations),<br />
the scenarios tend to drop below the threshold earlier <strong>and</strong><br />
rema<strong>in</strong> below it longer by ~3 weeks under the A1FI scenarios<br />
<strong>and</strong> a few days to a week under B1<br />
123
400 K. Hayhoe et al.: Changes <strong>in</strong> <strong>climate</strong> <strong>and</strong> <strong>hydrological</strong> <strong>in</strong>dicators<br />
(hydropower generation), municipal, recreational, <strong>and</strong><br />
ecological/habitat concerns. These will likely be exacerbated<br />
by the imposition of additional variability <strong>and</strong><br />
shifts <strong>in</strong> streamflow tim<strong>in</strong>g due to the <strong>climate</strong> change<br />
over the com<strong>in</strong>g century documented here.<br />
4.4 Snowfall <strong>and</strong> snow cover<br />
Another <strong>hydrological</strong> <strong>in</strong>dicator often used to characterize<br />
the NE is the extent <strong>and</strong> duration of snow cover.<br />
Although w<strong>in</strong>ters <strong>in</strong> the NE are generally snowy, over<br />
the last few decades more w<strong>in</strong>ter precipitation has<br />
fall<strong>in</strong>g as ra<strong>in</strong> <strong>and</strong> less as snow, particularly at the more<br />
northern sites (Hunt<strong>in</strong>gton et al. 2004). Here, we<br />
exam<strong>in</strong>e trends <strong>in</strong> the amount of snow on the ground<br />
(as measured by snow density or SWE), the total<br />
Fig. 13 Number of snowcovered<br />
days per month for<br />
w<strong>in</strong>ter (DJF) averaged over<br />
30-year historic <strong>and</strong> <strong>future</strong><br />
periods. Also shown are the<br />
differences <strong>in</strong> number of<br />
snow-covered days between<br />
the <strong>future</strong> <strong>and</strong> historic period.<br />
Values are the average of the<br />
HadCM3 <strong>and</strong> PCM-forced<br />
VIC simulations<br />
123<br />
number of snow-covered days <strong>in</strong> w<strong>in</strong>ter, <strong>and</strong> the<br />
overall length of the snow season.<br />
As the snow data from snow course sites is limited<br />
(for example, there are only 23 locations <strong>in</strong> Ma<strong>in</strong>e <strong>and</strong><br />
only a few of these have records that extend back <strong>in</strong>to<br />
the early part of the last century), we aga<strong>in</strong> comb<strong>in</strong>e<br />
observations with analysis of the retrospective or<br />
observation-driven VIC simulations. For the period<br />
1950–1999, observationally driven VIC simulations<br />
show snow water equivalence (SWE) across the NE<br />
decreas<strong>in</strong>g by 0.03 mm/decade while AOGCM-driven<br />
VIC simulations show SWE <strong>in</strong>creas<strong>in</strong>g by 0.05 mm/<br />
decade. The number of snow days decreases at a rate<br />
of –0.04 <strong>and</strong> –0.07 days/month/decade based on the<br />
observed- <strong>and</strong> AOGCM-driven VIC simulations,<br />
respectively. These trends are consistent with observed
K. Hayhoe et al.: Changes <strong>in</strong> <strong>climate</strong> <strong>and</strong> <strong>hydrological</strong> <strong>in</strong>dicators 401<br />
trends of decreas<strong>in</strong>g snow cover but <strong>in</strong>creas<strong>in</strong>g density<br />
(Hunt<strong>in</strong>gton et al. 2004; Hodgk<strong>in</strong>s <strong>and</strong> Dudley 2006a).<br />
Dur<strong>in</strong>g the last 30 years of the period (1970–1999),<br />
decreas<strong>in</strong>g trends <strong>in</strong> SWE (–3.52 <strong>and</strong> –2.9 mm/decade<br />
from observed- <strong>and</strong> AOGCM-driven runs) <strong>and</strong> snow<br />
days (–0.5 <strong>and</strong> –0.6 days/month/decade from observed<strong>and</strong><br />
AOGCM-driven runs) are significant at the 95%<br />
level, <strong>and</strong> are likely due to the <strong>in</strong>creas<strong>in</strong>g temperatures<br />
coupled with a decreas<strong>in</strong>g snow-to-total precipitation<br />
ratio.<br />
A snow-covered day is def<strong>in</strong>ed as one with mean<br />
SWE greater than an arbitrary threshold value of<br />
5 mm. Snow cover is generally restricted to the w<strong>in</strong>ter<br />
months, mostly <strong>in</strong> the north <strong>and</strong> higher elevations. The<br />
number of snow-covered w<strong>in</strong>ter (DJF) days <strong>in</strong> the<br />
historic period (1961–1990) ranges from close to zero<br />
day/month south of Pennsylvania to 30 days/month <strong>in</strong><br />
parts of northern New York, Vermont, New Hampshire<br />
<strong>and</strong> Ma<strong>in</strong>e. In the <strong>future</strong>, model-driven VIC<br />
simulations show a general decrease <strong>in</strong> the number of<br />
snow days, most notably across the central part of the<br />
doma<strong>in</strong> <strong>and</strong> southern Ma<strong>in</strong>e (Fig. 13). These decreases<br />
occur ma<strong>in</strong>ly at the edge of the snowl<strong>in</strong>e where the<br />
threshold between snow <strong>and</strong> no snow is most sensitive.<br />
Decreases are greatest for the higher-temperature<br />
A1FI scenario relative to B1 (Table 3), <strong>and</strong> are primarily<br />
driven by <strong>in</strong>creas<strong>in</strong>g temperatures, especially <strong>in</strong><br />
February <strong>and</strong> March. These reduce the number of<br />
freez<strong>in</strong>g days <strong>and</strong> thus the ratio of snowfall to ra<strong>in</strong>fall<br />
events, as well as <strong>in</strong>creas<strong>in</strong>g the likelihood of warm<br />
ra<strong>in</strong> fall<strong>in</strong>g on exist<strong>in</strong>g snowpack <strong>and</strong> accelerat<strong>in</strong>g the<br />
snowmelt. Warm temperatures can also cause exist<strong>in</strong>g<br />
snow to melt more rapidly.<br />
Interest<strong>in</strong>gly, <strong>in</strong> the southern part of the doma<strong>in</strong><br />
under the B1 scenario <strong>and</strong> <strong>in</strong> the northeastern part of<br />
the region <strong>in</strong> late spr<strong>in</strong>g under other scenarios, little<br />
change <strong>in</strong> the number of snow days is seen by 2070–<br />
2099. This is likely due to the relatively smaller <strong>in</strong>crease<br />
<strong>in</strong> temperature be<strong>in</strong>g offset by a larger <strong>in</strong>crease<br />
<strong>in</strong> precipitation. In other words, <strong>in</strong> the southern part of<br />
the NE, there are relatively few days when it is cold<br />
enough to snow there already. So, although the projected<br />
warm<strong>in</strong>g <strong>in</strong> w<strong>in</strong>ter temperature will still decrease<br />
the number of cold days, the projected <strong>in</strong>crease<br />
<strong>in</strong> precipitation means that the chances that it could<br />
actually snow on more of those days could <strong>in</strong>crease<br />
even if there are fewer days. In terms of snow days <strong>in</strong><br />
late spr<strong>in</strong>g, it is likely that <strong>in</strong>creased precipitation is<br />
compensat<strong>in</strong>g for <strong>in</strong>creased snowmelt from the higher<br />
temperatures.<br />
In the <strong>future</strong>, the w<strong>in</strong>ter snow season is shortened <strong>in</strong><br />
all regions, with snow appear<strong>in</strong>g later <strong>in</strong> the w<strong>in</strong>ter <strong>and</strong><br />
disappear<strong>in</strong>g earlier <strong>in</strong> the spr<strong>in</strong>g. This is most evident<br />
<strong>in</strong> northern regions where snow is more prevalent.<br />
Both scenarios show large reductions <strong>in</strong> the length of<br />
the snow season <strong>in</strong> w<strong>in</strong>ter/early spr<strong>in</strong>g with greater<br />
than 50 <strong>and</strong> 25% reductions <strong>in</strong> the number of snow<br />
days by 2070–2099 under scenarios A1FI <strong>and</strong> B1,<br />
respectively.<br />
These <strong>changes</strong> have the potential to affect the NE <strong>in</strong><br />
several ways. First, we have already hypothesized that<br />
the rapid w<strong>in</strong>ter warm<strong>in</strong>g observed over recent decades<br />
may be related to snow-albedo feedbacks on a regional<br />
scale that are not accurately captured by global models.<br />
Additional snow loss may serve to further enhance<br />
w<strong>in</strong>ter warm<strong>in</strong>g over the next few decades, particularly<br />
over the northern part of the doma<strong>in</strong>. Economic sectors<br />
affected by snow loss <strong>in</strong>clude the ski <strong>and</strong> snowmobile<br />
<strong>in</strong>dustries that depend on w<strong>in</strong>ter snow cover for<br />
recreational opportunities <strong>and</strong> related revenue (e.g.,<br />
Hamilton et al. 2003). Snow loss would also affect<br />
forests <strong>and</strong> natural ecosystems that rely on w<strong>in</strong>ter snow<br />
cover for protection dur<strong>in</strong>g frosts <strong>and</strong> as a source of<br />
soil moisture <strong>in</strong> spr<strong>in</strong>g (Perfect et al. 1987). A reduction<br />
<strong>in</strong> snow-cover days <strong>in</strong> w<strong>in</strong>ter would <strong>in</strong>crease the<br />
frequency of freeze-thaw cycles, which research has<br />
shown affects w<strong>in</strong>ter soil microbial processes such that<br />
nitrogen losses as nitrate leach<strong>in</strong>g <strong>and</strong> gaseous flux of<br />
nitrous oxide are <strong>in</strong>creased (Brooks 1998; Groffman<br />
et al. 2001; Dorsh 2004). Increased frequency of freezethaw<br />
cycles also leads to <strong>in</strong>creased root damage (Perfect<br />
et al. 1987).<br />
5 Biometeorological <strong>in</strong>dicators<br />
A third type of <strong>climate</strong> <strong>in</strong>dicator is that which reflects<br />
<strong>changes</strong> <strong>in</strong> biologically-relevant temperature thresholds.<br />
Temperature thresholds determ<strong>in</strong>e the response<br />
of flora, fauna, <strong>and</strong> agriculture <strong>in</strong> the NE to <strong>climate</strong><br />
change. Biological activity is often sensitive to temperature<br />
thresholds <strong>and</strong> to a build-up of temperature<br />
over days <strong>and</strong> months, creat<strong>in</strong>g unique cumulative rather<br />
than <strong>in</strong>stantaneous <strong>in</strong>dicators. Here, we exam<strong>in</strong>e<br />
freeze dates <strong>and</strong> the length of the grow<strong>in</strong>g season<br />
(determ<strong>in</strong>ed by temperature thresholds), <strong>and</strong> the SI<br />
(determ<strong>in</strong>ed by the accumulated days of w<strong>in</strong>ter chill<strong>in</strong>g<br />
<strong>and</strong> the spr<strong>in</strong>g warm<strong>in</strong>g), <strong>in</strong>dicative of the onset of<br />
vegetation growth <strong>in</strong> the spr<strong>in</strong>g.<br />
5.1 Grow<strong>in</strong>g season <strong>and</strong> freeze dates<br />
Historically across the US, the length of the w<strong>in</strong>ter<br />
freeze period has already been decreas<strong>in</strong>g over the last<br />
half of the past century (Kunkel et al. 2004; Schwartz<br />
et al. 2006). Multi-model simulations suggest that the<br />
123
402 K. Hayhoe et al.: Changes <strong>in</strong> <strong>climate</strong> <strong>and</strong> <strong>hydrological</strong> <strong>in</strong>dicators<br />
number of frost days is expected to cont<strong>in</strong>ue to decl<strong>in</strong>e<br />
<strong>in</strong> the <strong>future</strong> across the entire Northern Hemisphere,<br />
while the grow<strong>in</strong>g season will exp<strong>and</strong> (Tebaldi et al.<br />
2006).<br />
Here, we def<strong>in</strong>e the grow<strong>in</strong>g season as be<strong>in</strong>g the<br />
length of time between the last spr<strong>in</strong>g freeze of the<br />
year <strong>and</strong> the first hard freeze of the follow<strong>in</strong>g autumn<br />
where daily m<strong>in</strong>imum temperatures drop to or below –<br />
2.2°C (28°F), after Schwartz et al. (2006). In the NE,<br />
the grow<strong>in</strong>g season typically lasts for about half the<br />
year, or 185 days. Over the period of record (1915–<br />
2003), the length of the grow<strong>in</strong>g or frost-free season<br />
has been <strong>in</strong>creas<strong>in</strong>g at an average of +0.7 days/decade.<br />
Over the last 30 years (1970–2000), the observed trend<br />
based on daily station data across the NE has <strong>in</strong>creased<br />
to +2.4 days/decade. While first freeze dates <strong>in</strong> autumn<br />
are occurr<strong>in</strong>g somewhat later, the observed <strong>in</strong>crease <strong>in</strong><br />
grow<strong>in</strong>g season length is be<strong>in</strong>g driven primarily by<br />
earlier last freeze dates <strong>in</strong> spr<strong>in</strong>g (Schwartz et al. 2006).<br />
It is uncerta<strong>in</strong> whether this phenomenon is respond<strong>in</strong>g<br />
to late w<strong>in</strong>ter snow-albedo feedbacks, whereby more<br />
rapid melt<strong>in</strong>g of snow <strong>in</strong> spr<strong>in</strong>g (as seen <strong>in</strong> the advance<br />
of peak spr<strong>in</strong>g streamflow) could be prevent<strong>in</strong>g lateseason<br />
freezes, or whether it is a simple function of a<br />
greater rate of spr<strong>in</strong>g temperature <strong>in</strong>creases as compared<br />
with autumn (although the fact that the models<br />
also simulate a greater change <strong>in</strong> spr<strong>in</strong>g freeze dates<br />
but do not reproduce a greater change <strong>in</strong> w<strong>in</strong>ter temperatures<br />
as compared with other seasons suggests that<br />
this may not be the primary mechanism). By midcentury,<br />
enough warm<strong>in</strong>g is projected to have occurred<br />
such that the ‘‘easy’’ freezes just below the temperature<br />
threshold <strong>in</strong> late w<strong>in</strong>ter <strong>and</strong> early spr<strong>in</strong>g will not<br />
occur. Thus, the grow<strong>in</strong>g season will be lengthened by<br />
elim<strong>in</strong>at<strong>in</strong>g the much colder days that occur dur<strong>in</strong>g the<br />
w<strong>in</strong>ter months from freez<strong>in</strong>g—a more difficult task.<br />
In the <strong>future</strong>, the multi-model ensemble average<br />
suggests that by mid-century (here def<strong>in</strong>ed as 2045–<br />
2064 due to the limited daily temperature output<br />
available for all but the HadCM3, PCM, <strong>and</strong> GFDL<br />
models) the grow<strong>in</strong>g season may be 2–4 weeks longer<br />
than dur<strong>in</strong>g the 1961–1990 reference period. By end-ofcentury<br />
(2080–2099), the grow<strong>in</strong>g season may be extended<br />
by an average of 4 weeks under the lower B1<br />
scenario <strong>and</strong> 6 weeks under the higher A1FI <strong>and</strong> A2<br />
scenarios. For relatively small temperature <strong>changes</strong><br />
(B1 mid-century), model simulations suggest that the<br />
retreat of spr<strong>in</strong>g freeze dates cont<strong>in</strong>ues to be the primary<br />
cause of the lengthen<strong>in</strong>g grow<strong>in</strong>g season, as observed<br />
over the past few decades. On average, under<br />
B1 the mid-century spr<strong>in</strong>g last freeze is com<strong>in</strong>g 9 days<br />
earlier <strong>and</strong> the autumn first freeze only 0.6 days later.<br />
However, for B1 end-of-century <strong>and</strong> under A1FI/A2,<br />
123<br />
projections suggest that the process caus<strong>in</strong>g spr<strong>in</strong>g<br />
<strong>changes</strong> to be the dom<strong>in</strong>ant driver of grow<strong>in</strong>g season<br />
change saturates. Instead, projected <strong>changes</strong> <strong>in</strong> last<br />
freeze are almost equivalent to the projected <strong>changes</strong><br />
<strong>in</strong> first freeze, with both contribut<strong>in</strong>g nearly equally to<br />
the exp<strong>and</strong><strong>in</strong>g grow<strong>in</strong>g season for temperature <strong>changes</strong><br />
<strong>in</strong> excess of ~2°C.<br />
5.2 Spr<strong>in</strong>g <strong>in</strong>dices<br />
The second set of <strong>in</strong>dicators exam<strong>in</strong>ed here are the SI.<br />
These consist of SI first leaf date, an ‘‘early spr<strong>in</strong>g’’<br />
average date among the three <strong>in</strong>dicator plants related<br />
to a general onset of growth <strong>in</strong> grasses <strong>and</strong> shrubs, <strong>and</strong><br />
SI first bloom date, a ‘‘late spr<strong>in</strong>g’’ average date when<br />
flowers <strong>in</strong> three <strong>in</strong>dicator species start to open, related<br />
to a general onset of growth <strong>in</strong> dom<strong>in</strong>ant forest vegetation.<br />
The first leaf date is particularly important from<br />
an ecological perspective as it often displays the<br />
strongest response to temperature change, <strong>and</strong> is crucial<br />
for accurate assessment of processes related to the<br />
start <strong>and</strong> duration of the grow<strong>in</strong>g season (Schwartz<br />
et al. 2006).<br />
An advance of –2.10 days/decade <strong>in</strong> SI first leaf date<br />
has been previously documented over the NE from<br />
1960 to 2000, along with an advance <strong>in</strong> SI first bloom<br />
date of –1.23 days/decade, based on daily temperature<br />
records from 68 co-op stations, with both trends<br />
significant at P < 0.001 (Wolfe et al. 2005). Us<strong>in</strong>g<br />
observed station temperature records <strong>in</strong> the NE from<br />
1916 to 2003, SI first leaf date <strong>and</strong> first bloom date<br />
showed moderate advancement (both –0.4 days/decade).<br />
Over the last few decades (1970–2000), however,<br />
both beg<strong>in</strong> to advance at accelerated rates of –2.2 <strong>and</strong><br />
–0.9 days/decade (Table 2; aga<strong>in</strong>, all trends significant<br />
at the 0.001 level). AOGCM-driven SI simulations<br />
from 1916 to 2000 also show a decreas<strong>in</strong>g trend toward<br />
earlier <strong>in</strong> the year, although with a tendency to underestimate<br />
the rate of change (Table 2)—aga<strong>in</strong>, perhaps<br />
related to the large w<strong>in</strong>ter temperature <strong>in</strong>creases that<br />
have been observed but are not reproduced by the<br />
AOGCM simulations (Fig. 14). The model ensemble<br />
average trends from 1970 to 2000 are –1.4 <strong>and</strong><br />
–0.7 days/decade for SI first leaf <strong>and</strong> first bloom<br />
dates, respectively (Table 2)—aga<strong>in</strong>, slightly less than<br />
observed trends dur<strong>in</strong>g that period. Dur<strong>in</strong>g recent<br />
decades, all models displayed a late bias (averag<strong>in</strong>g<br />
6 days with a range from 2 to 9 days depend<strong>in</strong>g on the<br />
model), with GFDL be<strong>in</strong>g the best predictor of mean<br />
SI first leaf <strong>and</strong> first bloom date.<br />
Exam<strong>in</strong><strong>in</strong>g <strong>future</strong> projected <strong>changes</strong> <strong>in</strong> the SI dates<br />
for the three AOGCMs with cont<strong>in</strong>uous daily temperature<br />
projections available over the next century,
K. Hayhoe et al.: Changes <strong>in</strong> <strong>climate</strong> <strong>and</strong> <strong>hydrological</strong> <strong>in</strong>dicators 403<br />
Fig. 14 Spr<strong>in</strong>g Indices (SI) first leaf date departures (a) <strong>and</strong> first<br />
bloom date departures (b) by scenario (<strong>in</strong> days) over the 1916–<br />
2099 period (each l<strong>in</strong>e smoothed by a n<strong>in</strong>e-po<strong>in</strong>t normal-curve<br />
filter). Both historical data <strong>and</strong> model output show a trend<br />
toward earlier dates which, by end-of-century, becomes more<br />
pronounced under the higher A1FI <strong>and</strong> A2 scenarios (solid l<strong>in</strong>es)<br />
relative to B1 (dashed l<strong>in</strong>es)<br />
we see a consistent trend toward earlier dates, with<br />
<strong>changes</strong> of –2.1 <strong>and</strong> –2.3 days/decade or almost<br />
3 weeks earlier by end-of-century under A1FI/A2 <strong>and</strong><br />
–1.0 <strong>and</strong> –0.9 days/decade or 1–2 weeks earlier by endof-century<br />
under B1 for SI first leaf <strong>and</strong> first bloom<br />
dates, respectively (Fig. 14). Additional simulations<br />
based on four AOGCMs for which daily output were<br />
only available for the time periods 2046–2065 <strong>and</strong><br />
2081–2099 were also consistent with these f<strong>in</strong>d<strong>in</strong>gs,<br />
with A1FI/A2 scenarios suggest<strong>in</strong>g that average SI first<br />
leaf dates will become ~5 days <strong>and</strong> SI first bloom dates<br />
~6 days earlier <strong>in</strong> 2047–2065, <strong>and</strong> an additional 10 days<br />
earlier by 2082–2099 (compared to the observed values<br />
dur<strong>in</strong>g 1961–1990 <strong>and</strong> consider<strong>in</strong>g the previously<br />
mentioned late biases, Table 3). Under B1, the <strong>changes</strong><br />
are only slightly less by mid-century (~3 days for SI<br />
first leaf date <strong>and</strong> 4 days for SI first bloom date), but<br />
considerably smaller than A1FI/A2 by end-of-century<br />
(only 2–4 additional days earlier, Table 3). This model<br />
is expected to be robust under conditions where <strong>climate</strong><br />
departs significantly from the historical mean, as<br />
the SI models are optimized for cont<strong>in</strong>ental-scale<br />
applications <strong>and</strong> <strong>in</strong>cluded <strong>in</strong>put data from a study area<br />
that extended southward from the US NE to North<br />
Carol<strong>in</strong>a, <strong>and</strong> then westward to Oklahoma <strong>and</strong> North<br />
Dakota (Schwartz 1997). Thus, SI model results for<br />
<strong>future</strong> warm<strong>in</strong>g <strong>in</strong> the NE are well with<strong>in</strong> the range of<br />
actual phenological values <strong>and</strong> temperatures used <strong>in</strong><br />
model development <strong>and</strong> test<strong>in</strong>g.<br />
5.3 Implications for natural <strong>and</strong> managed<br />
ecosystem response<br />
Projected <strong>changes</strong> <strong>in</strong> the tim<strong>in</strong>g of the grow<strong>in</strong>g season<br />
<strong>and</strong> the onset of spr<strong>in</strong>g, comb<strong>in</strong>ed with ris<strong>in</strong>g temperatures,<br />
shifts <strong>in</strong> streamflow, <strong>in</strong>creased frequency of<br />
summer droughts, <strong>and</strong> other <strong>changes</strong> exam<strong>in</strong>ed here<br />
will have impacts on both natural <strong>and</strong> managed systems.<br />
Some animals, plants, <strong>in</strong>sects, <strong>and</strong> pathogens will<br />
benefit, while others do poorly, for a number of reasons.<br />
First, a warm<strong>in</strong>g <strong>climate</strong> is likely to exacerbate<br />
problems associated with <strong>in</strong>vasive species (Weltz<strong>in</strong><br />
et al. 2003), <strong>and</strong> will alter important <strong>in</strong>teractions <strong>and</strong><br />
synchrony between plants <strong>and</strong> poll<strong>in</strong>ators, <strong>in</strong>sect pests,<br />
diseases, <strong>and</strong> weeds (Walther 2002). The current historical<br />
trend show<strong>in</strong>g more warm<strong>in</strong>g <strong>in</strong> w<strong>in</strong>ter than <strong>in</strong><br />
other seasons of the year could have numerous ecological<br />
consequences, such as more overw<strong>in</strong>ter<strong>in</strong>g of<br />
<strong>in</strong>sect pests, <strong>and</strong> <strong>in</strong>sufficient duration of w<strong>in</strong>ter cold to<br />
fully meet vernalization requirements of some plant<br />
species, which negatively affects spr<strong>in</strong>g flower<strong>in</strong>g.<br />
The projected <strong>in</strong>crease <strong>in</strong> the frequency of high day<br />
<strong>and</strong> night temperatures <strong>in</strong> spr<strong>in</strong>g <strong>and</strong> summer will<br />
negatively affect flower<strong>in</strong>g, fruit set, <strong>and</strong>/or seed production<br />
of many plant species, <strong>in</strong>clud<strong>in</strong>g high-value<br />
horticultural crops (Peet <strong>and</strong> Wolfe 2000). Even a<br />
warm-season adapted crop such as tomato can have<br />
reduced yield <strong>and</strong>/or quality if temperatures exceed<br />
32°C for short periods dur<strong>in</strong>g critical flower<strong>in</strong>g <strong>and</strong><br />
poll<strong>in</strong>ation periods (Sato et al. 2001).<br />
A general warm<strong>in</strong>g trend will clearly lengthen the<br />
grow<strong>in</strong>g season <strong>and</strong> result <strong>in</strong> early flower<strong>in</strong>g for many<br />
123
404 K. Hayhoe et al.: Changes <strong>in</strong> <strong>climate</strong> <strong>and</strong> <strong>hydrological</strong> <strong>in</strong>dicators<br />
plant species, as already observed <strong>and</strong> as predicted<br />
here by the SI model (Wolfe et al. 2005; Fig. 14). In<br />
addition, it will hasten plant development throughout<br />
the summer, <strong>in</strong>creas<strong>in</strong>g pressure on water resources <strong>in</strong><br />
the region <strong>and</strong> alter<strong>in</strong>g the tim<strong>in</strong>g of the <strong>hydrological</strong><br />
cycle (Dirmeyer <strong>and</strong> Brubaker, 2006). Warmer summers<br />
can reduce yield of many important gra<strong>in</strong> crops,<br />
such as maize, wheat, <strong>and</strong> oats, due to a shorten<strong>in</strong>g of<br />
the gra<strong>in</strong>-fill<strong>in</strong>g period (e.g., Mitchell et al. 1993).<br />
Farmers <strong>in</strong> the region can adapt to <strong>climate</strong> change by<br />
shifts <strong>in</strong> varieties or crop species, but suitable options<br />
may not always be available, adaptation costs may be<br />
high, or there may be market constra<strong>in</strong>ts to the <strong>in</strong>troduction<br />
of new varieties or new crops.<br />
6 Conclusions<br />
Temperatures across the US Northeast have been<br />
warm<strong>in</strong>g steadily s<strong>in</strong>ce the 1970s. A wide range of<br />
<strong>in</strong>dicators <strong>in</strong> the NE have already been observed to be<br />
respond<strong>in</strong>g to these <strong>changes</strong>, which <strong>in</strong> turn have the<br />
potential to impact urban <strong>and</strong> rural life, agriculture,<br />
<strong>in</strong>dustry, tourism, <strong>and</strong> natural ecosystems.<br />
Comb<strong>in</strong><strong>in</strong>g past observed trends with AOGCM<br />
simulations of <strong>future</strong> <strong>climate</strong> enables us to pa<strong>in</strong>t a<br />
coherent picture of the types of physical <strong>and</strong> biological<br />
<strong>changes</strong> that might be expected across the region<br />
over the com<strong>in</strong>g century. Focal areas studied here<br />
<strong>in</strong>clude <strong>changes</strong> <strong>in</strong> the distribution of seasonal temperature<br />
<strong>and</strong> precipitation; their impact on evaporation,<br />
runoff, <strong>and</strong> soil moisture characteristics of the<br />
region; result<strong>in</strong>g shifts <strong>in</strong> stream flow amounts <strong>and</strong><br />
distribution over the year; impacts on drought characteristics<br />
<strong>and</strong> snow cover; <strong>and</strong> f<strong>in</strong>ally, implications of<br />
temperature change for cultivated <strong>and</strong> natural plant<br />
species via the length of the grow<strong>in</strong>g season <strong>and</strong> SI<br />
calculations. Although the mechanisms responsible<br />
for determ<strong>in</strong><strong>in</strong>g the net <strong>changes</strong> <strong>in</strong> each of these are<br />
complex, most display a consistent signal <strong>in</strong> response<br />
to warm<strong>in</strong>g temperatures.<br />
Historical model simulations that <strong>in</strong>clude the <strong>in</strong>fluence<br />
of human emissions on <strong>climate</strong> are able to reproduce the<br />
sign of observed trends <strong>in</strong> most temperature-related<br />
<strong>climate</strong> <strong>in</strong>dices (<strong>in</strong>clud<strong>in</strong>g mean annual <strong>and</strong> seasonal<br />
temperatures, snow cover <strong>and</strong> extent, streamflow, <strong>and</strong><br />
SI). This suggests that AOGCMs are capable of reproduc<strong>in</strong>g<br />
the dom<strong>in</strong>ant <strong>in</strong>fluence on regional temperaturerelated<br />
<strong>climate</strong> <strong>in</strong>dicators. However, model simulations<br />
fail to capture the regional effects lead<strong>in</strong>g to strong<br />
observed w<strong>in</strong>ter warm<strong>in</strong>g, <strong>and</strong> generally tend to underestimate<br />
the magnitude of observed trends, particularly<br />
over the last few decades. This implies that regional<br />
123<br />
processes may be act<strong>in</strong>g to enhance warm<strong>in</strong>g trends<br />
<strong>in</strong> the NE relative to the global average <strong>in</strong> a way not<br />
captured by global-scale models.<br />
Over the com<strong>in</strong>g century, temperature <strong>in</strong>creases are<br />
projected to be significantly greater under a higher as<br />
compared to a lower emissions scenario, with equal or<br />
greater <strong>in</strong>creases <strong>in</strong> summer relative to w<strong>in</strong>ter. W<strong>in</strong>ter<br />
precipitation is likely to <strong>in</strong>crease by 10–15%, consistent<br />
with recent observed trends, while summer precipitation<br />
shows either little change or a decrease. These<br />
conclusions regard<strong>in</strong>g <strong>in</strong>ter-scenario <strong>and</strong> seasonal differences<br />
are consistent across the 23 <strong>future</strong> simulations<br />
from the n<strong>in</strong>e AOGCMs exam<strong>in</strong>ed here (CCSM3,<br />
CGCM3, CSIRO, ECHAM5, GISS-E-R, GFDL2.1,<br />
HadCM3, Miroc, <strong>and</strong> PCM). Additional <strong>changes</strong> <strong>in</strong><br />
snow depth <strong>and</strong> extent, tim<strong>in</strong>g of streamflow, grow<strong>in</strong>g<br />
season, SI, <strong>and</strong> other temperature-related <strong>climate</strong><br />
<strong>in</strong>dices all show trends that are consistent with warm<strong>in</strong>g<br />
temperatures, with significantly larger trends under<br />
the higher SRES emissions scenarios (A1FI, A2) as<br />
compared to a lower scenario (B1). Even <strong>in</strong>dicators<br />
that might be expected to depend more strongly on<br />
precipitation rather than on temperature show strong<br />
trends, such as earlier spr<strong>in</strong>g melt dates <strong>and</strong> prolonged<br />
summer low-flow periods, which can likely be expla<strong>in</strong>ed<br />
by <strong>in</strong>creased evaporation due to warmer temperatures<br />
that is not balanced by an <strong>in</strong>crease <strong>in</strong><br />
summer precipitation.<br />
Some differences <strong>in</strong> <strong>climate</strong> projections still rema<strong>in</strong><br />
to be resolved, particularly those related to the f<strong>in</strong>escale<br />
spatial <strong>and</strong> temporal distribution of <strong>changes</strong> over<br />
a geographically diverse region such as the US NE.<br />
However, the model-simulated trends <strong>in</strong> temperature<br />
<strong>and</strong> precipitation-related <strong>in</strong>dicators exam<strong>in</strong>ed here are<br />
reasonably consistent with both observed historical<br />
trends as well as a broad range of <strong>future</strong> model simulations.<br />
These suggest confidence <strong>in</strong> the direction <strong>and</strong><br />
potential range of regional trends <strong>in</strong> these <strong>in</strong>dicators,<br />
which clearly depends on the emissions pathway we<br />
follow over the next century.<br />
Acknowledgments This manuscript benefited greatly from<br />
comments <strong>and</strong> suggestions by Dan Cayan <strong>and</strong> Chester Zenone<br />
(USGS), <strong>and</strong> two anonymous reviewers. We acknowledge the<br />
<strong>in</strong>ternational model<strong>in</strong>g groups for provid<strong>in</strong>g their data for analysis,<br />
the Program for Climate Model Diagnosis <strong>and</strong> Intercomparison<br />
(PCMDI) for collect<strong>in</strong>g <strong>and</strong> archiv<strong>in</strong>g the model output,<br />
the JSC/CLIVAR Work<strong>in</strong>g Group on Coupled Model<strong>in</strong>g<br />
(WGCM) <strong>and</strong> their Coupled Model Intercomparison Project<br />
(CMIP) <strong>and</strong> Climate Simulation Panel for organiz<strong>in</strong>g the model<br />
output analysis activity, <strong>and</strong> the IPCC WG1 TSU for technical<br />
support. The IPCC Data Archive at Lawrence Livermore<br />
National Laboratory is supported by the Office of Science, US<br />
Department of Energy. We gratefully acknowledge the Union of<br />
Concerned Scientists, who catalyzed this research as the first<br />
stage of a forthcom<strong>in</strong>g Northeast Climate Impacts Assessment
K. Hayhoe et al.: Changes <strong>in</strong> <strong>climate</strong> <strong>and</strong> <strong>hydrological</strong> <strong>in</strong>dicators 405<br />
Report. Contributions to this study were as follows: synthesis <strong>and</strong><br />
manuscript preparation, model-simulated temperature <strong>and</strong> precipitation<br />
analysis, grow<strong>in</strong>g season analysis, data provision for<br />
<strong>hydrological</strong> <strong>and</strong> biometerological analyses (Hayhoe), synthesis<br />
<strong>and</strong> manuscript preparation, observed temperature <strong>and</strong> precipitation<br />
analysis (Wake), observed <strong>and</strong> model-simulated streamflow<br />
analysis (Hunt<strong>in</strong>gton), VIC <strong>and</strong> river rout<strong>in</strong>g model<br />
simulations (Luo), SI <strong>and</strong> grow<strong>in</strong>g season analysis (Schwartz),<br />
VIC data analysis for terrestrial hydrology, streamflow, drought<br />
<strong>and</strong> snow (Sheffield), hydrologic analysis <strong>and</strong> support (Wood),<br />
precipitation <strong>and</strong> temperature extremes <strong>and</strong> synthesis (Anderson),<br />
SST <strong>and</strong> drought analysis (Bradbury), precipitation <strong>and</strong><br />
temperature extremes (DeGaetano), assistance with VIC model<br />
simulations (Troy), ecosystem response analysis (Wolfe).<br />
References<br />
Abdulla FA, Lettenmaier DP, Wood EF, Smith JA (1996)<br />
Application of a macroscale hydrologic model to estimate<br />
the water balance of the Arkansas-Red river bas<strong>in</strong>. J<br />
Geophys Res 101(D3):7449–7459<br />
Amiro BD, Stocks BJ, Alex<strong>and</strong>er ME, Flannigan MD, Wotton<br />
BM (2001) Fire, <strong>climate</strong> change, carbon <strong>and</strong> fuel management<br />
<strong>in</strong> the Canadian boreal forest. Int J Wildl<strong>and</strong> Fire<br />
10:405–413<br />
Beltaos S, Prowse TD (2002) Effects of <strong>climate</strong> on mid-w<strong>in</strong>ter ice<br />
jams. Hydrol Proc 16:789–804<br />
Bradbury JA, D<strong>in</strong>gman SL, Keim BD (2002) New Engl<strong>and</strong><br />
drought <strong>and</strong> relations with large scale atmospheric circulation<br />
patterns. JAWRA 38:1287–1299<br />
Brooks PD (1998) Inorganic nitrogen <strong>and</strong> microbial biomass<br />
dynamics before <strong>and</strong> dur<strong>in</strong>g spr<strong>in</strong>g snowmelt. Biogeochemistry<br />
43:1–15<br />
Brown TJ, Hall BL, Westerl<strong>in</strong>g AL (2004) The impact of twentyfirst<br />
century <strong>climate</strong> change on wildl<strong>and</strong> fire danger <strong>in</strong> the<br />
western United States: an applications perspective. Clim<br />
Change 62:365–388<br />
Cherkauer KA, Bowl<strong>in</strong>g LC, Lettenmaier DP (2002) Variable<br />
Infiltration Capacity (VIC) cold l<strong>and</strong> process model updates.<br />
Glob Planet Change 38:151–159<br />
Coll<strong>in</strong>s WD, Bitz CM, Blackmon ML, Bonan GB, Bretherton<br />
CS, Carton JA, Chang P, Doney SC, Hack JJ, Henderson<br />
TB, Kiehl JT, Large WG, McKenna DS, Santer BD, Smith<br />
RD (2006) The Community Climate System Model:<br />
CCSM3. J Clim 19:2122–2143<br />
Dai A, Hu A, Meehl GA, Wash<strong>in</strong>gton WM, Str<strong>and</strong> WG (2004)<br />
Atlantic thermohal<strong>in</strong>e circulation <strong>in</strong> a coupled general<br />
circulation model: unforced variations versus forced<br />
<strong>changes</strong>. J Clim 18:3270–3293<br />
Daly C, Taylor G, Gibson W (1997) The PRISM approach to<br />
mapp<strong>in</strong>g precipitation <strong>and</strong> temperature. In: Tenth conference<br />
on applied climatology. American Meteorological<br />
Society, Reno, NV, pp10–12<br />
DeGaetano AT, Allen RJ (2002) Trends <strong>in</strong> twentieth-century<br />
temperature extremes across the United States. J Clim<br />
15:3188–3205<br />
Delworth TL, Broccoli AJ, Rosati A, Stouffer RJ et al (2006)<br />
GFDL’s CM2 global coupled <strong>climate</strong> models—Part 1—formulation<br />
<strong>and</strong> simulation characteristics. J Clim 19:643–674<br />
Diffenbaugh NS, Pal JS, Trapp RJ, Giorgi F (2005) F<strong>in</strong>e-scale<br />
processes regulate the response of extreme events to global<br />
<strong>climate</strong> change. PNAS 102:15774–15778<br />
Dirmeyer PA, Brubaker KL (2006) Evidence for trends <strong>in</strong> the<br />
northern hemisphere water cycle. Geophys Res Lett<br />
33:L14712. DOI 10.1029/2006GL026359<br />
Dorsch P (2004) Overw<strong>in</strong>ter<strong>in</strong>g greenhouse gas fluxes <strong>in</strong> two<br />
contrast<strong>in</strong>g agricultural habitats. Nutr Cycl<strong>in</strong>g Agroecosyst<br />
70:117–133<br />
Easterl<strong>in</strong>g DR, Karl TR, Lawrimore JH, Del Greco SA (1999)<br />
United States historical climatology network daily temperature,<br />
precipitation, <strong>and</strong> snow data for 1871–1997. ORNL/<br />
CDIAC-118, NDP-070. Carbon Dioxide Information Analysis<br />
Center, Oak Ridge National Laboratory, US Department<br />
of Energy, Oak Ridge, TN<br />
Gibbs JP, Breisch AR (2001) Climate warm<strong>in</strong>g <strong>and</strong> call<strong>in</strong>g<br />
phenology of frogs near Ithaca, NY, 1900–1999. Conserv<br />
Biol 15:1175–1178<br />
Gordon HB, Rotstayn LD, McGregor JL, Dix MR, Kowalczyk<br />
EA, O’Farrell SP, Waterman LJ, Hirst AC, Wilson SG,<br />
Collier MA, Watterson IG, Elliott TI (2002) The CSIRO<br />
Mk3 Climate System Model (Electronic publication). Aspendale:<br />
CSIRO Atmospheric Research (CSIRO Atmospheric<br />
Research technical paper; no. 60), 130pp. Available<br />
on-l<strong>in</strong>e at: http://www.dar.csiro.au/publications/gordon_2002a.pdf<br />
Groffman PM, Driscoll CT, Fahey TJ, Hardy JP, Fitzhugh RD,<br />
Tierney GL (2001) Effects of mild w<strong>in</strong>ter freez<strong>in</strong>g on soil N<br />
<strong>and</strong> C dynamics <strong>in</strong> a northern hardwood forest. Biogeochemistry<br />
56:191–213<br />
Guttman N, Quayle R (1996) A historical perspective of US<br />
<strong>climate</strong> divisions. Bull Am Met Soc 77:293–303<br />
Hamilton LC, Rohall D, Brown B, Hayward G, Keim B (2003)<br />
Warm<strong>in</strong>g w<strong>in</strong>ters <strong>and</strong> New Hampshire’s lost ski areas: an<br />
<strong>in</strong>tegrated case study. Int J Soc Soc Policy 23:52–73<br />
Hamlet AF, Lettenmaier DP (2005) Production of temporally<br />
consistent gridded precipitation <strong>and</strong> temperature fields for<br />
the cont<strong>in</strong>ental United States. J Hydrometeorol 6:330–336<br />
Hasumi H, Emori S (eds) (2004) K-1 coupled model (MIROC)<br />
description, K-1 technical report 1. Center for Climate<br />
System Research, University of Tokyo, 34pp. Available at:<br />
http://www.ccsr.u-tokyo.ac.jp/kyosei/hasumi/MIROC/techrepo.pdf<br />
Hayhoe K, Cayan D, Field CB, Frumhoff PC, Maurer EP, Miller<br />
NL, Moser SC, Schneider SH, Nicholas Cahill K, Clel<strong>and</strong><br />
EE, Dale L, Drapek R, Hanemann RM, Kalkste<strong>in</strong> LS,<br />
Lenihan J, Lunch CK, Neilson RP, Sheridan SC, Verville JH<br />
(2004) Emissions pathways, <strong>climate</strong> change, <strong>and</strong> impacts on<br />
California. Proc Natl Acad Sci 101:12422–12427<br />
Helsel DR, Hirsch RM (1992) Statistical methods <strong>in</strong> water<br />
resources, studies <strong>in</strong> environmental science, vol 49. Elsevier,<br />
New York, 522 p<br />
Hodgk<strong>in</strong>s GA, James IC, Hunt<strong>in</strong>gton TG (2002) Historical<br />
<strong>changes</strong> <strong>in</strong> lake ice-out dates as <strong>in</strong>dicators of <strong>climate</strong> change<br />
<strong>in</strong> New Engl<strong>and</strong>, 1850–2000. Int J Climatol 22:1819–1827<br />
Hodgk<strong>in</strong>s GA, Dudley RW, Hunt<strong>in</strong>gton TG (2003) Changes <strong>in</strong><br />
the tim<strong>in</strong>g of high river flows <strong>in</strong> New Engl<strong>and</strong> over the 20th<br />
century. J Hydrol 278:244–252<br />
Hodgk<strong>in</strong>s GA, Dudley RW, Hunt<strong>in</strong>gton TG (2005a) Changes <strong>in</strong><br />
the number <strong>and</strong> tim<strong>in</strong>g of ice-affected flow days on New<br />
Engl<strong>and</strong> rivers, 1930–2000. Clim Change 71:319–340<br />
Hodgk<strong>in</strong>s GA, Dudley RW, Hunt<strong>in</strong>gton TG (2005b) Summer<br />
low flows <strong>in</strong> Northeast over the 20th century. Am Water<br />
Resour Assoc J 41:403–412<br />
Hodgk<strong>in</strong>s GA, Dudley RW (2006a) Changes <strong>in</strong> late-w<strong>in</strong>ter<br />
snowpack depth, water equivalent, <strong>and</strong> density <strong>in</strong> Ma<strong>in</strong>e,<br />
1926–2004. Hydrol Process 20:741–751<br />
123
406 K. Hayhoe et al.: Changes <strong>in</strong> <strong>climate</strong> <strong>and</strong> <strong>hydrological</strong> <strong>in</strong>dicators<br />
Hodgk<strong>in</strong>s GA, Dudley RW (2006b) Changes <strong>in</strong> the tim<strong>in</strong>g of<br />
w<strong>in</strong>ter-spr<strong>in</strong>g high streamflows <strong>in</strong> eastern North America<br />
1912–2002. Geophys Res Lett 33 DOI 10.1029/2005GL025593<br />
Hunt<strong>in</strong>gton TG, Hodgk<strong>in</strong>s GA, Dudley RW (2003) Historical<br />
trend <strong>in</strong> river ice thickness <strong>and</strong> coherence <strong>in</strong> hydroclimatological<br />
trends <strong>in</strong> Ma<strong>in</strong>e. Clim Change 61:217–236<br />
Hunt<strong>in</strong>gton TG, Hodgk<strong>in</strong>s GA, Keim BD, Dudley RW (2004)<br />
Changes <strong>in</strong> the proportion of precipitation occurr<strong>in</strong>g as<br />
snow <strong>in</strong> Northeast (1949 to 2000). J Clim 17:2626–2636<br />
Hunt<strong>in</strong>gton TG (2006) Evidence for <strong>in</strong>tensification of the global<br />
water cycle: review <strong>and</strong> synthesis. J Hydrol 319:83–95<br />
Janes BE, Brumbach JJ (1965) The 1964 agricultural drought <strong>in</strong><br />
connecticut. University of Connecticut Agricultural Experiment<br />
Station Bullet<strong>in</strong> 390, Storrs, 22p<br />
Juanes F, Gephard S, Bel<strong>and</strong> KF (2004) Long-term <strong>changes</strong> <strong>in</strong><br />
migration tim<strong>in</strong>g of adult Atlantic salmon (Salmo salar) a<br />
the southern edge of the species distribution. Cdn J Fish<br />
Aquatic Sci 61:2392–2400<br />
Karl TR et al (1986) A model to estimate the time of observation<br />
bias with monthly mean maximum, m<strong>in</strong>imum, <strong>and</strong> mean<br />
temperatures for the United States. J Clim Appl Meteorol<br />
25:145–160<br />
Karl TR, Williams CN Jr (1987) An approach to adjust<strong>in</strong>g<br />
climatological time series for discont<strong>in</strong>uous <strong>in</strong>homogeneities.<br />
J Clim Appl Meteorol 26:1744–1763<br />
Karl TR, Diaz HF, Kukla G (1988) Urbanization: its detection<br />
<strong>and</strong> effect <strong>in</strong> the United States <strong>climate</strong> record. J Clim<br />
1:1099–1123<br />
Karl TR, Williams CN Jr, Qu<strong>in</strong>lan FT, Boden TA (1990) United<br />
States Historical Climatology Network (HCN) Serial Temperature<br />
<strong>and</strong> Precipitation Data, Environmental Science<br />
Division, Publication No. 3404. Carbon Dioxide Information<br />
<strong>and</strong> Analysis Center, Oak Ridge National Laboratory,<br />
Oak Ridge, TN, 389 pp<br />
Keim BD, Wilson A, Wake C, Hunt<strong>in</strong>gton TG (2003) Are there<br />
spurious temperature trends <strong>in</strong> the United States Climate<br />
Division Database? Geophys Res Lett 30(27):1404, DOI<br />
10.1029/2002GL016295<br />
Keim BD, Fischer MR, Wilson AM (2005) Are there spurious<br />
precipitation trends <strong>in</strong> the United States Climate Division<br />
database? Geophys Res Lett 32:L04702, DOI 10.1029/<br />
2004GL021985<br />
Kim S-J, Flato GM, Boer GJ, McFarlane NA (2002) A coupled<br />
<strong>climate</strong> model simulation of the Last Glacial Maximum, Part<br />
1: transient multi-decadal response. Clim Dyn 19:515–537<br />
Kim S-J, Flato GM, Boer GJ (2003) A coupled <strong>climate</strong> model<br />
simulation of the Last Glacial Maximum, Part 2: approach<br />
to equilibrium. Clim Dyn 20:635–661<br />
Kunkel KE, Easterl<strong>in</strong>g DR, Hubbard K, Redmond K (2004)<br />
Temporal variations <strong>in</strong> frost-free season <strong>in</strong> the United<br />
States: 1895–2000. Geophys Res Lett 31:L03201. DOI<br />
10.1029/2003GL018624<br />
Kushnir Y, Rob<strong>in</strong>son WA, Blade I, Hall NMJ, Peng S, Sutton R<br />
(2002) Atmospheric GCM response to extratropical SST<br />
anomalies: synthesis <strong>and</strong> evaluation. J Clim 15:2233–2256<br />
Leathers DJ, Grundste<strong>in</strong> AJ, Ellis AW (2000) Grow<strong>in</strong>g season<br />
moisture deficits across the northeastern United States. Clim<br />
Res 14:43–55<br />
Liang X, Lettenmaier DP, Wood EF, Burges SJ (1994) A simple<br />
<strong>hydrological</strong>ly based model of l<strong>and</strong> surface water <strong>and</strong> energy<br />
fluxes for GSMs. J Geophys Res 99(D7):14,415–14,428<br />
Liang X, Wood EF, Lettenmaier DP (1996) Surface soil moisture<br />
parameterization of the VIC-2L model: evaluation <strong>and</strong><br />
modifications. Glob Planet Change 13:195–206<br />
Ludlum DM (1976) The Country Journal: Northeast Weather<br />
Book. Houghton Miffl<strong>in</strong>, Boston<br />
123<br />
Lyon B, Christie-Blick N, Gluzberg Y (2005) Water shortages,<br />
development, <strong>and</strong> drought <strong>in</strong> Rockl<strong>and</strong> County, New York.<br />
Am Water Resour Assn J 41:1457–1469<br />
Maurer EP, O’Donnell GM, Lettenmaier DP, Roads JO (2001)<br />
Evaluation of the l<strong>and</strong> surface water budget <strong>in</strong> NCEP/<br />
NCAR <strong>and</strong> NCEP/DOE reanalyses us<strong>in</strong>g an off-l<strong>in</strong>e<br />
hydrologic model. J Geophys Res 106:17841–17862<br />
Maurer EP, Wood AW, Adam JC, Lettenmaier DP, Nijssen B<br />
(2002), A long-term <strong>hydrological</strong>ly-based data set of l<strong>and</strong><br />
surface fluxes <strong>and</strong> states for the conterm<strong>in</strong>ous United States.<br />
J Clim 15:3237–3251<br />
McCormick SD, Hansen LP, Qu<strong>in</strong>n TP, Saunders RL (1998)<br />
Movement, migration, <strong>and</strong> smolt<strong>in</strong>g of Atlantic salmon<br />
(Salmo salar). Cdn J Fish Aquatic Sci 55:77–92<br />
Mitchell RAC, Mitchell VJ, Driscoll S et al (1993) Effects of<br />
<strong>in</strong>creased CO2 concentration <strong>and</strong> temperature on growth<br />
<strong>and</strong> yield of w<strong>in</strong>ter wheat at two levels of nitrogen<br />
application. Plant, Cell Environ 16:521–529<br />
Moore MV, Pace ML, Mather JR, Murdoch PS, Howarth RW,<br />
Folt CL, Chen CY, Hemond HF, Flebbe PA, Driscoll C<br />
(1997) Potential effects of <strong>climate</strong> change on freshwater<br />
ecosystems of the New Engl<strong>and</strong>/Mid-Atlantic region.<br />
Hydrol Process 11:925–947<br />
Nakićenović N et al (2000) IPCC special report on emissions<br />
scenarios. Cambridge University Press, Cambridge, UK <strong>and</strong><br />
New York, NY<br />
Namias J (1966) Nature <strong>and</strong> possible causes of the northeastern<br />
United States Drought dur<strong>in</strong>g 1962–1965. Mon Weather<br />
Rev 94(9):543–557<br />
Nijssen B, O’Donnell GM, Lettenmaier DP, Lohmann D, Wood<br />
EF (2001) Predict<strong>in</strong>g the discharge of global rivers. J Clim<br />
14:3307–3323<br />
Paulson RW, Chase EB, Roberts RS, Moody DW (1991)<br />
National water summary 1988–1989: hydrologic events <strong>and</strong><br />
floods <strong>and</strong> droughts. US Geological Survey Water Supply<br />
Paper No. 2375, Denver Co., 591p<br />
Peet MM, Wolfe DW (2000) Crop ecosystem responses to<br />
<strong>climate</strong> change—vegetable crops. In: Reddy KR, Hodges<br />
HF (eds) Climate change <strong>and</strong> global crop productivity.<br />
CABI Publish<strong>in</strong>g, New York<br />
Perfect E, Miller RD, Burton B (1987) Root morphology <strong>and</strong><br />
vigor effects on w<strong>in</strong>ter heav<strong>in</strong>g of established alfalfa. Agron<br />
J 79:1061–1067<br />
Pope VD, Gallani ML, Rowntree PR, Stratton RA (2000) The<br />
impact of new physical parameterizations <strong>in</strong> the Hadley<br />
Centre <strong>climate</strong> model—HadCM3. Clim Dyn 16:123–146<br />
Primack D, Imbres C, Primack RB, Miller-Rush<strong>in</strong>g A, del<br />
Tredici P (2004) Herbarium specimens demonstrate earlier<br />
flower<strong>in</strong>g times <strong>in</strong> response to warm<strong>in</strong>g <strong>in</strong> Boston. Am J Bot<br />
91(8):1260–1264<br />
Quayle RG, Easterl<strong>in</strong>g DR, Karl TR, Hughes PY (1991) Effects<br />
of recent thermometer <strong>changes</strong> <strong>in</strong> the cooperative station<br />
network. Bull Am Meteorol Soc 72:1718–1724<br />
Roeckner E, Bäuml G, Bonaventura L, Brokopf R, Esch M,<br />
Giorgetta M, Hagemann S, Kirchner I, Kornblueh L,<br />
Manz<strong>in</strong>i E, Rhod<strong>in</strong> A, Schlese U, Schulzweida U, Tompk<strong>in</strong>s<br />
A (2003) The atmospheric general circulation model<br />
ECHAM5. Part I: model description. Max Planck Institute<br />
for Meteorology Rep. 349, 127pp. Available from MPI for<br />
Meteorology, Bundesstr. 53, 20146 Hamburg, Germany<br />
Sato S, Peet MM, Gardener RG (2001) Formation of parthenocarpic<br />
fruit <strong>and</strong> aborted flowers <strong>in</strong> tomato under moderately<br />
elevated temperatures. Sci Hortic 90:243–254<br />
Sch<strong>in</strong>dler DW (2001) The cumulative effects of <strong>climate</strong> warm<strong>in</strong>g<br />
<strong>and</strong> other human stresses on Canadian freshwaters <strong>in</strong> the<br />
new millennium. Can J Fish Aquat Sci 58:18–29
K. Hayhoe et al.: Changes <strong>in</strong> <strong>climate</strong> <strong>and</strong> <strong>hydrological</strong> <strong>in</strong>dicators 407<br />
Schmidt GA et al (2006) Present day atmospheric simulations<br />
us<strong>in</strong>g GISS ModelE: comparison to <strong>in</strong>-situ, satellite <strong>and</strong><br />
reanalysis data. J Clim 19:153–192<br />
Schwartz MD (1997) Spr<strong>in</strong>g <strong>in</strong>dex models: an approach to<br />
connect<strong>in</strong>g satellite <strong>and</strong> surface phenology. In: Lieth H,<br />
Schwartz MD (eds) Phenology <strong>in</strong> seasonal <strong>climate</strong>s I.<br />
Backhuys, Leiden, pp 23–38<br />
Schwartz MD, Ahas R, Aasa A (2006) Onset of spr<strong>in</strong>g start<strong>in</strong>g<br />
earlier across the Northern hemisphere. Glob Change Biol<br />
12:343–351<br />
Schwartz MD, Reiter BE (2000) Changes <strong>in</strong> North American<br />
Spr<strong>in</strong>g. Int J Climatol 20:929–932<br />
Sheffield J, Ziegler AD, Wood EF, Chen Y (2004a) Correction<br />
of the high-latitude ra<strong>in</strong> day anomaly <strong>in</strong> the NCEP/NCAR<br />
reanalysis for l<strong>and</strong> surface <strong>hydrological</strong> model<strong>in</strong>g. J Clim<br />
17(19):3814–3828<br />
Sheffield J, Goteti G, Wen F, Wood EF (2004b) A simulated soil<br />
moisture based drought analysis for the United States. J<br />
Geophys Res 109, D24108, DOI 10.1029/2004JD005182<br />
Smith TM, Reynolds RW (2003) Extended reconstruction of<br />
global Sea surface temperatures based on COADS Data<br />
(1854–1997). J Clim 16:1495–1510<br />
Tebaldi C, Hayhoe K, Arblaster J, Meehl G (2006) Go<strong>in</strong>g to the<br />
extremes: an <strong>in</strong>tercomparison of model simulated historical<br />
<strong>and</strong> <strong>future</strong> <strong>changes</strong> <strong>in</strong> extreme events. Clim Change (<strong>in</strong><br />
press)<br />
Trombulak SC, Wolfson R (2004) Twentieth-century <strong>climate</strong><br />
change <strong>in</strong> Northeast <strong>and</strong> New York, USA. Geophys Res<br />
Lett 31 DOI 10.1029/2004GL020574<br />
US Department of Agriculture (2000) Prepar<strong>in</strong>g for drought <strong>in</strong><br />
the 21st Century. National drought policy commission<br />
report, http://www.fsa.usda.gov/drought/f<strong>in</strong>alreport/fullreport/ndpcfullreportcovers/ndpcreportsummaryv.htm<br />
US Fish <strong>and</strong> Wildlife Service (1981) Interim regional policy for<br />
New Engl<strong>and</strong> stream flow recommendations: region I. US<br />
Fish <strong>and</strong> Wildlife Service, Concord, NH, 3pp<br />
VanRheenan NT, Wood AW, Palmer RN, Lettenmaier DP<br />
(2004) Potential implications of PCM <strong>climate</strong> change<br />
scenarios for Sacramento-San Joaqu<strong>in</strong> River Bas<strong>in</strong> hydrology<br />
<strong>and</strong> water resources. Clim Change 62:257–281<br />
Wake CP, Markham A (2005) Indicators of <strong>climate</strong> change <strong>in</strong> the<br />
Northeast 2005. Clean Air-Cool Planet, Portsmouth, NH.<br />
Available on-l<strong>in</strong>e at: http://www.cleanair-coolplanet.org<br />
Walther GR (2002) Ecological responses to recent <strong>climate</strong><br />
change. Nature 416:389–395<br />
Wash<strong>in</strong>gton WM et al (2000) Parallel Climate Model (PCM)<br />
Control <strong>and</strong> transient simulations. Clim Dyn 16:755–774<br />
Wehner MF (2004) Predicted twenty-first-century <strong>changes</strong> <strong>in</strong><br />
seasonal extreme precipitation events <strong>in</strong> the parallel <strong>climate</strong><br />
model. J Clim 17:4281–4290<br />
Weltz<strong>in</strong> JF, Travis-Belote R, S<strong>and</strong>ers NJ (2003) Biological<br />
<strong>in</strong>vaders <strong>in</strong> a greenhouse world: will elevated CO2 fuel plant<br />
<strong>in</strong>vasions? Front Ecol Environ 1(3):146–153<br />
Williams CN Jr, Menne MJ, Vose RS, Easterl<strong>in</strong>g DR (2005)<br />
United states historical climatology network monthly temperature<br />
<strong>and</strong> precipitation Data.ORNL/CDIAC-118, NDP-<br />
019. Available on-l<strong>in</strong>e at: http://cdiac.ornl.gov/epubs/ndp/<br />
ushcn/usa_monthly.html from the Carbon Dioxide Information<br />
Analysis Center, Oak Ridge National Laboratory, US<br />
Department of Energy, Oak Ridge, TN<br />
Wolfe DW, Schwartz MD, Lakso A, Otsuki Y, Pool R, Shaulis N<br />
(2005) Climate change <strong>and</strong> shifts <strong>in</strong> spr<strong>in</strong>g phenology of<br />
three horticultural woody perennials <strong>in</strong> northeastern USA.<br />
Int J Biometeor 49:303–309<br />
Wood AW, Maurer EP, Kumar A, Lettenmaier DP (2002) Longrange<br />
experimental hydrologic forecast<strong>in</strong>g for the eastern<br />
United States. J Geophys Res 107:Art. No. 4429<br />
Wood A, Leung LR, Sridhar V, Lettenmaier D (2004) Hydrologic<br />
implications of dynamical <strong>and</strong> statistical approaches to<br />
downscal<strong>in</strong>g <strong>climate</strong> model surface temperature <strong>and</strong> precipitation<br />
fields. Clim Change 62:189–216<br />
123