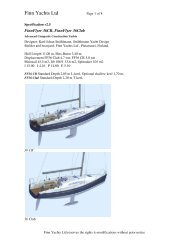
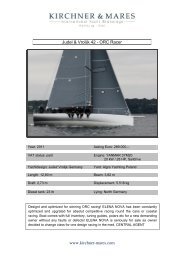
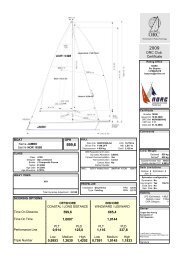
DESIGN #543 Beneteau First 10R For Chantiers Beneteau ... - Blur
DESIGN #543 Beneteau First 10R For Chantiers Beneteau ... - Blur
DESIGN #543 Beneteau First 10R For Chantiers Beneteau ... - Blur

Create successful ePaper yourself
Turn your PDF publications into a flip-book with our unique Google optimized e-Paper software.
FARR YACHT <strong>DESIGN</strong> LTD<br />
613 THIRD STREET SUITE 20 P. O. BOX 4964 ANNAPOLIS MD 21403 U.S.A.<br />
T. 410 267 0780 F. 410 268 0553 info@farrdesign.com www.farrdesign.com<br />
Page 1 G:\Standards\Documents\VPPexplanation.doc<br />
Created on April 21, 2004, Last Saved April 21, 2004<br />
DESCRIPTION OF SYMBOLS IN VPP OUTPUT<br />
The accompanying document contains a large amount information about the predicted performance of your boat. To<br />
allow this document to be used as a valuable racing tool we have prepared the following explanation of the<br />
important terms it contains.<br />
General Terms:<br />
Vt or TWS True Wind Speed<br />
Bt or TWA True Wind Angle<br />
V or Vs Boat Speed<br />
VMG Boat Velocity Made Good<br />
HEEL Heel Angle<br />
REEF Measure of Reduction in Sail Area<br />
FLAT Measure of Reduction in Sail Lift<br />
Va, AWS Apparent Wind Speed<br />
Ba, AWA Apparent Wind Angle<br />
Lee Leeway Angle<br />
Sail Sail Combination Designator (Upwind or Downwind)<br />
Flot Flotation Designator (Varies Only <strong>For</strong> Water Ballasted Boats)<br />
VPP Polar diagram<br />
This is a graphical representation of the boats performance across a range of windspeeds and true wind directions.<br />
Optimal upwind and downwind conditions are marked as small rectangles on the boat speed contours for each<br />
windspeed.<br />
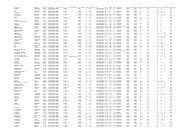
Best Boatspeeds<br />
The upper portion of this page gives a numerical representation of the polar diagram. Boatspeeds in knots are given<br />
for a series of true windspeeds at masthead height, across a range of true wind angles. All boatspeeds and<br />
windspeeds are given in knots. The shaded cells lie beyond the upwind and downwind optimum points. The two<br />
tables on the lower portion of the page provide a ready reference of useful details about the optimum upwind and<br />
downwind sailing conditions as a function of the true windspeeds (Vt’s) across the top of the page. In addition to<br />
indicating the optimum upwind and downwind boat speeds in knots, they are also expressed in seconds/mile and in<br />
seconds/boat length. VMG is also expressed in seconds/mile.<br />
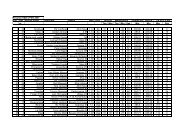
Course Times<br />
This page shows the predicted boat performance over a series of 1.0 nautical mile courses in various windspeeds.<br />
Times around the course are expressed as seconds. The courses reflect five different course conditions:-<br />
LEEWARD, LINEAR RANDOM (LR), WINDWARD-LEEWARD (WL), WINDWARD and CIRCULAR-<br />
RANDOM (CR).<br />
Times for 1 nm (secs)<br />
This page is similar to the Best Boatspeeds page in that it represents the boatspeeds for a series of true windspeeds<br />
and true wind angles. Boatspeeds are expressed as seconds/nautical mile. Shaded areas again depict the off<br />
optimum conditions. Optimum upwind and downwind values, in terms of VMG, are presented underneath the table.