

DPA 2011 Annual Report - Department of Public Advocacy
DPA 2011 Annual Report - Department of Public Advocacy
DPA 2011 Annual Report - Department of Public Advocacy

You also want an ePaper? Increase the reach of your titles
YUMPU automatically turns print PDFs into web optimized ePapers that Google loves.
Trial Office<br />
Number <strong>of</strong><br />
Attorney<br />
Positions<br />
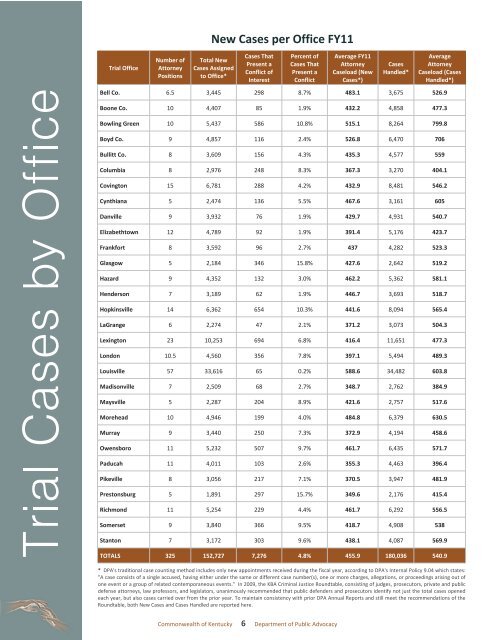
New Cases per Office FY11<br />
Total New<br />
Cases Assigned<br />
to Office*<br />
Cases That<br />
Present a<br />
Conflict <strong>of</strong><br />
Interest<br />
Percent <strong>of</strong><br />
Cases That<br />
Present a<br />
Conflict<br />
Commonwealth <strong>of</strong> Kentucky 6 <strong>Department</strong> <strong>of</strong> <strong>Public</strong> <strong>Advocacy</strong><br />
Average FY11<br />
Attorney<br />
Caseload (New<br />
Cases*)<br />
Cases<br />
Handled*<br />
Average<br />
Attorney<br />
Caseload (Cases<br />
Handled*)<br />
Bell Co. 6.5 3,445 298 8.7% 483.1 3,675 526.9<br />
Boone Co. 10 4,407 85 1.9% 432.2 4,858 477.3<br />
Bowling Green 10 5,437 586 10.8% 515.1 8,264 799.8<br />
Boyd Co. 9 4,857 116 2.4% 526.8 6,470 706<br />
Bullitt Co. 8 3,609 156 4.3% 435.3 4,577 559<br />
Columbia 8 2,976 248 8.3% 367.3 3,270 404.1<br />
Covington 15 6,781 288 4.2% 432.9 8,481 546.2<br />
Cynthiana 5 2,474 136 5.5% 467.6 3,161 605<br />
Danville 9 3,932 76 1.9% 429.7 4,931 540.7<br />
Elizabethtown 12 4,789 92 1.9% 391.4 5,176 423.7<br />
Frankfort 8 3,592 96 2.7% 437 4,282 523.3<br />
Glasgow 5 2,184 346 15.8% 427.6 2,642 519.2<br />
Hazard 9 4,352 132 3.0% 462.2 5,362 581.1<br />
Henderson 7 3,189 62 1.9% 446.7 3,693 518.7<br />
Hopkinsville 14 6,362 654 10.3% 441.6 8,094 565.4<br />
LaGrange 6 2,274 47 2.1% 371.2 3,073 504.3<br />
Lexington 23 10,253 694 6.8% 416.4 11,651 477.3<br />
London 10.5 4,560 356 7.8% 397.1 5,494 489.3<br />
Louisville 57 33,616 65 0.2% 588.6 34,482 603.8<br />
Madisonville 7 2,509 68 2.7% 348.7 2,762 384.9<br />
Maysville 5 2,287 204 8.9% 421.6 2,757 517.6<br />
Morehead 10 4,946 199 4.0% 484.8 6,379 630.5<br />
Murray 9 3,440 250 7.3% 372.9 4,194 458.6<br />
Owensboro 11 5,232 507 9.7% 461.7 6,435 571.7<br />
Paducah 11 4,011 103 2.6% 355.3 4,463 396.4<br />
Pikeville 8 3,056 217 7.1% 370.5 3,947 481.9<br />
Prestonsburg 5 1,891 297 15.7% 349.6 2,176 415.4<br />
Richmond 11 5,254 229 4.4% 461.7 6,292 556.5<br />
Somerset 9 3,840 366 9.5% 418.7 4,908 538<br />
Stanton 7 3,172 303 9.6% 438.1 4,087 569.9<br />
TOTALS 325 152,727 7,276 4.8% 455.9 180,036 540.9<br />
* <strong>DPA</strong>'s traditional case counting method includes only new appointments received during the fiscal year, according to <strong>DPA</strong>'s Internal Policy 9.04 which states:<br />
"A case consists <strong>of</strong> a single accused, having either under the same or different case number(s), one or more charges, allegations, or proceedings arising out <strong>of</strong><br />
one event or a group <strong>of</strong> related contemporaneous events." In 2009, the KBA Criminal Justice Roundtable, consisting <strong>of</strong> judges, prosecutors, private and public<br />
defense attorneys, law pr<strong>of</strong>essors, and legislators, unanimously recommended that public defenders and prosecutors identify not just the total cases opened<br />
each year, but also cases carried over from the prior year. To maintain consistency with prior <strong>DPA</strong> <strong>Annual</strong> <strong>Report</strong>s and still meet the recommendations <strong>of</strong> the<br />
Roundtable, both New Cases and Cases Handled are reported here.