PDF (Full Text) - Universiti Teknologi Malaysia Institutional Repository
PDF (Full Text) - Universiti Teknologi Malaysia Institutional Repository
PDF (Full Text) - Universiti Teknologi Malaysia Institutional Repository

Create successful ePaper yourself
Turn your PDF publications into a flip-book with our unique Google optimized e-Paper software.
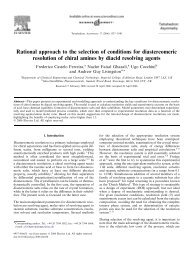
STRIPPING VOLTAMMETRIC METHODS FOR<br />
THE DETERMINATION OF AFLATOXIN COMPOUNDS<br />
MOHAMAD HADZRI BIN YAACOB<br />
UNIVERSITI TEKNOLOGI MALAYSIA
BAHAGIAN A – Pengesahan Kerjasama *<br />
Adalah disahkan bahawa projek penyelidikan tesis ini telah dilaksanakan melalui<br />
kerjasama antara _____________________ dengan _________________________<br />
Disahkan oleh:<br />
Tandatangan : .......................................................... Tarikh : ..........................<br />
Nama : ..........................................................<br />
Jawatan :...........................................................<br />
(Cop rasmi)<br />
* Jika penyediaan tesis/projek melibatkan kerjasama.<br />
BAHAGIAN B – Untuk Kegunaan Pejabat Sekolah Pengajian Siswazah<br />
Tesis ini telah diperiksa dan diakui oleh:<br />
Nama dan Alamat<br />
Pemeriksa Luar : Prof. Dr. Noor Azhar Bin Mohd Shazili<br />
Pengarah<br />
Institut Oseanografi,<br />
Kolej <strong>Universiti</strong> Sains dan <strong>Teknologi</strong> <strong>Malaysia</strong>,<br />
Mengabang Telipot<br />
21030 Kuala Terengganu<br />
Nama dan Alamat<br />
Pemeriksa Dalam I : Prof. Madya Dr. Razali Bin Ismail<br />
Fakulti Sains,<br />
UTM, Skudai<br />
Pemeriksa Dalam II :<br />
Nama Penyelia Lain<br />
(jika ada) :<br />
Disahkan oleh Penolong Pendaftar di Sekolah Pengajian Siswazah:<br />
Tandatangan : .......................................................... Tarikh : ..........................<br />
Nama : .GANESAN A/L ANDIMUTHU
STRIPPING VOLTAMMETRIC METHODS FOR<br />
THE DETERMINATION OF AFLATOXIN COMPOUNDS<br />
MOHAMAD HADZRI BIN YAACOB<br />
A thesis submitted in fulfilment of the<br />
requirements for the award of the degree of<br />
Doctor of Philosophy<br />
Faculty of Science<br />
<strong>Universiti</strong> <strong>Teknologi</strong> <strong>Malaysia</strong><br />
APRIL 2006
Specially dedicated to:<br />
My mother, wife, sons, daughters and all families for<br />
all the love, support and continuous prayer<br />
for my success in completing this work.<br />
iii
ACKNOWLEDGEMENT<br />
All praise be to ALLAH SWT and blessing be upon His Prophet SAW whose<br />
ultimate guidance creates a more meaningful purpose to this work.<br />
I wish to express my sincere gratitude and appreciation to the people who have both<br />
directly and indirectly contributed to this thesis. The following are those to whom I<br />
am particularly indebted:<br />
My supervisors A.P. Dr. Abdull Rahim bin Hj. Mohd. Yusoff and Prof. Dr.<br />
Rahmalan Ahamad for their invaluable guidance, freedom of work and<br />
constant encouragement throughout the course of this work.<br />
School Of Health Sciences, USM, Health Campus, Kubang Krian Kelantan<br />
for awarding study leave together with scholarship in completing the work.<br />
Prof Baharuddin Saad from USM Penang, AP Dr. Razali Ismail from<br />
Chemistry Department, Faculty of Science, UTM and Prof Barek from<br />
Charles University, Prague, Czeck Republic for their useful discussion and<br />
suggestion. Also to Mr Radwan Ismail from Department of Chemistry,<br />
Penang Branch, Mrs Marpongahtun Misni and Mr Wan Kamaruzaman Wan<br />
Ahmad for their friendship, ideas and continuous support in carrying out this<br />
work. Also to Mr Mat Yasin bin Sirin, Mrs Ramlah binti Husin and Mr Azmi<br />
Mahmud for their assistance throughout the work.<br />
UTM for awarding Short Term Grant No: 75152 / 2004<br />
My mother, wife and all families for their encouragements, supports, patience,<br />
tolerance and understanding.<br />
iv
ABSTRACT<br />
Aflatoxin, which is produced by Aspergillus flavus and Aspergillus parasiticus<br />
fungi is one of the compounds in the mycotoxin group. The main types of aflatoxins<br />
are AFB1, AFB2, AFG1 and AFG2 which have carcinogenic properties and are<br />
dangerous to human health. Various techniques have been used for their measurements<br />
such as the high performance liquid chromatography (HPLC), enzyme linked<br />
immunosorbant assay (ELISA) and radioimmunoassay (RIA) but all these methods<br />
have disadvantages such as long analysis time, consume a lot of reagents and<br />
expensive. To overcome these problems, the voltammetric technique was proposed in<br />
this study using controlled growth mercury drop (CGME) as the working electrode and<br />
Britton Robinson buffer (BRB) as the supporting electrolyte. The voltammetric<br />
methods were used for investigating the electrochemical properties and the quantitative<br />
analysis of aflatoxins at the mercury electrode. The experimental conditions were<br />
optimised to obtain the best characterised peak in terms of peak height with analytical<br />
validation of the methods for each aflatoxin. The proposed methods were applied for<br />
the analysis of aflatoxins in groundnut samples and the results were compared with<br />
those obtained by the HPLC technique. All aflatoxins were found to adsorb and<br />
undergo irreversible reduction reaction at the working mercury electrode. The<br />
optimum experimental parameters for the differential pulse cathodic stripping<br />
voltammetry (DPCSV) method were the BRB at pH 9.0 as the supporting electrolyte,<br />
initial potential (Ei): -0.1 V, final potential (Ef): -1.4 V, accumulation potential (Eacc): -<br />
0.6 V, accumulation time (tacc): 80 s, scan rate: 50 mV/s and pulse amplitude: 80 mV.<br />
The optimum parameters for the square wave stripping voltammetry (SWSV) method<br />
were Ei = -0.1 V, Ef = -1.4 V, Eacc: -0.8 V, tacc: 100 s, scan rate: 3750 mV/s, frequency:<br />
125 Hz and voltage step: 30 V. At the concentration of 0.10 µM, using DPCSV<br />
method with the optimum parameters, AFB1, AFB2, AFG1 and AFG2 produced a<br />
single peak at -1.21 V, -1.23 V, -1.17 V and -1.15 V (versus Ag/AgCl) respectively.<br />
Using the SWSV method, a single peak appeared at -1.30 V for AFB1 and AFB2 while<br />
-1.22 V for AFG1 and AFG2. The calibration curves for all aflatoxins were linear with<br />
the limit of detection (LOD) of approximately 2.0 ppb and 0.50 ppb obtained by the<br />
DPCSV and SWSV methods respectively. The results of aflatoxins content in<br />
individual groundnut samples do not vary significantly when compared with those<br />
obtained by the HPLC technique. Finally, it can be concluded that both proposed<br />
methods which are accurate, precise, robust, rugged, fast and low cost were<br />
successfully developed and are potential alternative methods for routine analysis of<br />
aflatoxins in groundnut samples.<br />
v
ABSTRAK<br />
Aflatoksin adalah sejenis sebatian yang dihasilkan oleh kulat Aspergillus flavus<br />
dan Aspergillus parasiticus yang digolongkan di dalam kumpulan mikotoksin. Jenis<br />
utama aflatoksin adalah AFB1, AFB2, AFG1 dan AFG2 yang bersifat karsinogen serta<br />
merbahaya kepada kesihatan manusia. Pelbagai teknik telah digunakan untuk<br />
menentukan aflatoksin seperti kromatografi cecair prestasi tinggi (HPLC), asai serapan<br />
imuno berikatan enzim (ELISA) dan radioamunoasai (RIA) tetapi teknik-teknik ini<br />
mempunyai kelemahan seperti masa analisis yang panjang, melibatkan reagen yang<br />
banyak dan kos yang mahal. Untuk mengatasi masalah ini, teknik voltammetri telah<br />
dicadangkan untuk kajian aflatoksin menggunakan titisan raksa pembesaran terkawal<br />
(CGME) sebagai elektrod bekerja dan larutan penimbal Britton-Robinson (BRB)<br />
sebagai elektrolit penyokong. Pelbagai kaedah voltammetri telah digunakan untuk<br />
mengkaji sifat elektrokimia aflatoksin pada elektrod raksa dan analisis kuantitatifnya.<br />
Parameter kajian telah dioptimumkan untuk memperolehi puncak yang elok<br />
berdasarkan ketinggian puncak serta pengesahan analisis untuk kaedah yang<br />
dibangunkan bagi setiap aflatoksin. Kaedah ini telah digunakan untuk menentukan<br />
kandungan aflatoksin di dalam sampel kacang tanah di mana keputusan yang diperolehi<br />
telah dibandingkan dengan keputusan HPLC. Semua aflatoksin yang dikaji didapati<br />
terjerap dan menjalani proses tindakbalas penurunan tidak berbalik pada elektrod raksa.<br />
Parameter optimum untuk kaedah voltammetri perlucutan kathodik denyut pembeza<br />
(DPCSV) adalah larutan BRB pada pH 9.0 sebagai larutan elektrolit, keupayaan awal<br />
(Ei): -1.0 V, keupayaan akhir (Ef): -1.4 V, keupayaan pengumpulan (Eacc): -0.6 V, masa<br />
pengumpulan (tacc): 80 s, kadar imbasan: 50 mV/s dan amplitud denyut: 80 mV. Untuk<br />
kaedah voltammetri perlucutan gelombang bersegi (SWSV), parameter optimum adalah<br />
Ei : -1.0 V, Ef : -1.4 V, Eacc: -0.8 V, tacc: 100 s, kadar imbasan: 3750 mV/s, frekuensi:<br />
125 Hz dan beza keupayaan: 30 mV. Menggunakan parameter optimum untuk DPCSV,<br />
0.10 µM AFB1, AFB2, AFG1 dan AFG2 menghasilkan puncak tunggal pada<br />
keupayaan -1.21 V, -1.23 V, -1.17 V dan -1.15 V (melawan Ag/AgCl) masingmasingnya.<br />
Menggunakan kaedah SWSV, puncak terhasil pada -1.30 V untuk AFB1<br />
dan AFB2, -1.22 V untuk AFG1 dan AFG2. Keluk kalibrasi adalah linear untuk semua<br />
aflatoksin dengan had pengesanan (LOD) pada 2.0 dan 0.5 ppb diperolehi dari kaedah<br />
DPCSV dan SWSV masing-masingnya. Keputusan analisis kandungan aflatoksin di<br />
dalam sampel kacang tanah tidak memberi perbezaan ketara berbanding dengan yang<br />
diperolehi menggunakan teknik HPLC. Kesimpulannya, kedua-dua kaedah yang dikaji<br />
yang merupakan kaedah yang tepat, jitu, cepat, sesuai digunakan dengan pelbagai<br />
model voltammetri dan kos yang murah telah berjaya dibangunkan dan berpotensi besar<br />
menjadi kaedah alternatif untuk analisis kandungan aflatoksin di dalam kacang tanah<br />
secara berkala.<br />
vi
TABLE OF CONTENTS<br />
CHAPTER TITLE PAGE<br />
TITLE i<br />
DECLARATION ii<br />
DEDICATION iii<br />
ACKNOWLEDGEMENT iv<br />
ABSTRACT v<br />
ABSTRAK vi<br />
TABLE OF CONTENTS vii<br />
LIST OF TABLES xiii<br />
LIST OF FIGURES xvi<br />
ABBREVATIONS xxix<br />
LIST OF APPENDICES xxxiii<br />
1 LITERATURE REVIEW 1<br />
1.1 Overview 1<br />
1.2 Aflatoxins 3<br />
1.2.1 Aflatoxins in general 3<br />
1.2.2 Chemistry of aflatoxins 5<br />
1.2.3 Health aspects of aflatoxins 12<br />
1.2.4 Analytical methods for the determination of<br />
aflatoxins<br />
16<br />
1.2.5 Electrochemical properties of aflatoxins 28<br />
1.3. Voltammetric technique 30<br />
1.3.1 Voltammetric techniques in general 30<br />
vii
1.3.2 Voltammetric measurement 31<br />
1.3.2.1 Instrumentation 31<br />
1.3.2.2 Solvent and supporting electrolyte 44<br />
1.3.2.3 Current in voltammetry 46<br />
1.3.2.4 Quantitative and quantitative aspects of<br />
voltammetry<br />
48<br />
1.3.3 Type of voltammetric techniques 49<br />
1.3.3.1 Polarography 49<br />
1.3.3.2 Cyclic voltammetry 51<br />
1.3.3.3 Stripping voltammetry 54<br />
1.3.3.3a Anodic stripping voltammetry 56<br />
1.3.3.3b Cathodic stripping voltammetry 57<br />
1.3.3.3c Adsorptive stripping voltammetry 58<br />
1.3.3.4 Pulse voltammetry 59<br />
1.3.3.4a Differential pulse voltammetry 60<br />
1.3.3.4b Square wave voltammetry 61<br />
1.4 Objective and scope of study 64<br />
1.4.1 Objective of study 64<br />
1.4.2 Scope of study 67<br />
2 RESEARCH METHODOLOGY 70<br />
2.1 Apparatus, material and reagents 70<br />
2.1.1 Apparatus 70<br />
2.1.2 Materials 72<br />
2.1.2.1 Aflatoxin stock and standard solutions 72<br />
2.1.2.2 Real samples 73<br />
2.1.3 Reagents 73<br />
2.1.3.1 Britton Robinson buffer, 0.04 M 73<br />
2.1.3.2 Carbonate buffer, 0.04 M 74<br />
2.1.3.3 Phosphate buffer, 0.04 M 74<br />
viii
2.1.3.4 Ascorbic acid 74<br />
2.1.3.5 β-cyclodextrin solution, 1.0 mM 75<br />
2.1.3.6 L-Cysteine, 1.0 x 10 -5 M 75<br />
2.1.3.7 2,4-dihydrofuran, 0.15 M 75<br />
2.1.3.8 Coumarin, 3.0 x 10 -2 M 75<br />
2.1.3.9 Poly-L-lysine, 10 ppm 75<br />
2.1.3.10 Standard aluminium (II) solution, 1.0 mM 75<br />
2.1.3.11 Standard plumbum(II) solution, 1.0 mM 76<br />
2.1.3.12 Standard zinc (II) solution, 1.0 mM 76<br />
2.1.3.13 Standard copper (II) solution, 1.0 mM 76<br />
2.1.3.14 Standard nickel (II) solution, 1.0 mM 76<br />
2.1.3.15 Methanol: 0.1 N HCl solution, 95% 76<br />
2.1.3.16 Zinc sulphate solution, 15% 76<br />
2.2 Analytical Technique 77<br />
2.2.1 General procedure for voltammetric analysis 77<br />
2.2.2 Cyclic voltammetry (Anodic and cathodic<br />
directions)<br />
77<br />
2.2.2.1 Standard addition of sample 77<br />
2.2.2.2 Repetitive cyclic voltammetry 78<br />
2.2.2.3 Effect of scan rate 78<br />
2.2.3 Differential pulse cathodic stripping<br />
voltammetric determination of AFB2<br />
78<br />
2.2.3.1 Effect of pH 79<br />
2.2.3.2 Method optimisation for the determination 79<br />
of AFB2<br />
2.2.3.2a Effect of scan rate 79<br />
2.2.3.2b Effect of accumulation potential 80<br />
2.2.3.2c Effect of accumulation time 80<br />
2.2.3.2d Effect of initial potential 80<br />
2.2.3.2e Effect of pulse amplitude 80<br />
ix
2.2.3.3 Method validation 80<br />
2.2.3.4 Interference studies 81<br />
2.2.3.4a Effect of Cu(II), Ni (II), Al(III), 81<br />
Pb(II) and Zn(II)<br />
2.2.3.4b Effect of ascorbic acid, 82<br />
β-cyclodextrin and L-cysteine<br />
2.2.3.5 Modified mercury electrode with PLL 82<br />
2.2.4 Square wave cathodic stripping voltammetry<br />
(SWSV)<br />
82<br />
2.2.4.1 SWSV parameters optimisation 82<br />
2.2.4.2 SWSV determination of all aflatoxins 82<br />
2.2.5 Stability studies of aflatoxins 83<br />
2.2.5.1 Stability of 10 ppm aflatoxins 83<br />
2.2.5.2 Stability of 1 ppm aflatoxins 83<br />
2.2.5.3 Stability of 0.1 µM aflatoxins exposed<br />
to ambient temperature<br />
83<br />
2.2.5.4 Stability of 0.1 µM aflatoxins in different<br />
pH of BRB<br />
84<br />
2.2.6 Application to food samples 84<br />
2.2.6.1 Technique 1 84<br />
2.2.6.2 Technique 2 84<br />
2.2.6.3 Technique 3 85<br />
2.2.6.4 Blank measurement 85<br />
2.2.6.5 Recovery studies 85<br />
2.2.6.6 Voltammetric analysis 86<br />
3 RESULTS AND DISCUSSION 88<br />
3.1 Cyclic voltammetric studies of aflatoxins 88<br />
3.1.1 Cathodic and anodic cyclic voltammetric<br />
of aflatoxins<br />
89<br />
x
3.2 Differential pulse cathodic stripping voltammetry<br />
of AFB2<br />
102<br />
3.2.1 Optimisation of conditions for the stripping 104<br />
analysis<br />
3.2.1.1 Effect of pH and type of supporting 104<br />
electrolyte<br />
3.2.1.2 Optmisation of instrumental conditions 117<br />
3.2.1.2a Effect of scan rate 118<br />
3.2.1.2b Effect of accumulation time 119<br />
3.2.1.2c Effect of accumulation<br />
potential<br />
120<br />
3.2.1.2d Effect of initial potential 121<br />
3.2.1.2e Effect of pulse amplitude 122<br />
3.2.2 Analysis of aflatoxins 127<br />
3.2.2.1 Calibration curves of aflatoxins and<br />
validation of the proposed method<br />
129<br />
3.2.2.1a Calibration curve of AFB2 129<br />
3.2.2.1b Calibration curve of AFB1 134<br />
3.2.2.1c Calibration curve of AFG1 137<br />
3.2.2.1d Calibration curve of AFG2 140<br />
3.2.2.2 Determination of limit of detection 143<br />
3.2.2.3 Determination of limit of quantification 147<br />
3.2.2.4 Inteference studies 150<br />
3.3 Square-wave stripping voltammetry (SWSV) of<br />
aflatoxins<br />
157<br />
3.3.1 SWSV determination of AFB2 158<br />
3.3.1.1 Optimisation of experimental and 159<br />
instrumental SWSV parameters<br />
3.3.3.1a Influence of pH of BRB 159<br />
3.3.3.1b Effect of instrumental<br />
variables<br />
160<br />
xi
3.3.2 SWSV determination of other aflatoxins 166<br />
3.3.3 Calibration curves and method validation 168<br />
3.4 Stability studies of aflatoxins 175<br />
3.4.1 10 ppm aflatoxin stock solutions 175<br />
3.4.2 1 ppm aflatoxins in BRB at pH 9.0 179<br />
3.4.2.1 Month to month stability studies 179<br />
3.4.2.2 Hour to hour stability studies 181<br />
3.4.2.3 Stability studies in different pH<br />
of BRB<br />
186<br />
3.4.2.4 Stability studies in 1.0 M HCl and<br />
1.0 M NaOH<br />
191<br />
3.5 Voltammetric analysis of aflatoxins in real samples 192<br />
3.5.1 Study on the extraction techniques 193<br />
3.5.2 Analysis of blank 194<br />
3.5.3 Recovery studies of aflatoxins in real samples 196<br />
3.5.4 Analysis of aflatoxins in real samples 199<br />
4 CONCLUSIONS AND RECOMMENDATIONS 204<br />
4.1 Conclusions 204<br />
4.2 Recommendations 206<br />
REFERENCES 208<br />
Appendices A – AM 255 - 317<br />
xii
LIST OF TABLES<br />
TABLE NO. TITLE PAGE<br />
1.0 Scientific name for aflatoxin compounds 7<br />
1.1 Chemical and physical properties of aflatoxin 10<br />
compounds<br />
1.2 Summary of analysis methods used for 19<br />
determination of aflatoxins in various samples<br />
1.3 Working electrode and limit of detection for 32<br />
modern polarographic and voltammetric<br />
techniques.<br />
1.4 The application range of various analytical 33<br />
techniques and their concentration limits when<br />
compared with the requirements in different<br />
fields of chemical analysis<br />
1.5 List of different type of working electrodes and 36<br />
its potential windows<br />
1.6 Electroreducible and electrooxidisable organic 50<br />
functional groups<br />
1.7 The characteristics of different type of 53<br />
electrochemical reaction.<br />
1.8 Application of Square Wave Voltammetry 62<br />
technique<br />
2.0 List of aflatoxins and their batch numbers 72<br />
used in this experiment<br />
2.1 Injected volume of aflatoxins into eluate of 86<br />
groundnut and the final concentrations obtained<br />
in voltammetric cell<br />
3.0 The dependence of current peaks of aflatoxins to 97<br />
their concentrations obtained by cathodic cyclic<br />
measurements in BRB at 9.0.<br />
xiii
3.1 Effect of buffer constituents on the peak height 109<br />
of 2.0 µM AFB2 at pH 9.0. Experimental<br />
conditions are the same as Figure 3.21<br />
3.2 Compounds reduced at the mercury electrode 116<br />
3.3 Optimum parameters for 0.06 µM and 2.0 µM 126<br />
AFB2 in BRB at pH 9.0.<br />
3.4 The peak height and peak potential of aflatoxins 127<br />
obtained by optimised parameters in BRB at<br />
pH 9.0 using DPCSV technique.<br />
3.5 Peak height (in nA) obtained for intra-day and 131<br />
inter-day precision studies of 0.10 µM and 0.20<br />
µM by the proposed voltammetric procedure (n=8).<br />
3.6 Mean values for recovery of AFB2 standard 132<br />
solution (n=3).<br />
3.7 Influence of small variation in some of the 133<br />
assay condition of the proposed procedure on its<br />
suitability and sensitivity using 0.10 µM AFB2.<br />
3.8 Results of ruggedness test for proposed method 134<br />
using 0.10 µM AFB2.<br />
3.9 Peak height (in nA) obtained for intra-day and 136<br />
inter-day precision studies of 0.10 µM and 0.20<br />
µM AFB1 by proposed voltammetric procedure<br />
(n=5).<br />
3.10 Mean values for recovery of AFB1 standard 137<br />
solution (n=3).<br />
3.11 Peak height (in nA) obtained for intra-day and 139<br />
inter-day precision studies of 0.10 µM and 0.20<br />
µM AFG1 by proposed voltammetric procedure<br />
(n=5).<br />
3.12 Mean values for recovery of AFG1 standard 139<br />
solution (n=3).<br />
3.13 Peak height (in nA) obtained for intra-day and 141<br />
inter-day precision studies of 0.10 µM and 0.20<br />
µM AFG2 by proposed voltammetric procedure.<br />
xiv
3.14 Mean values for recovery of AFG2 standard 142<br />
solution (n=5).<br />
3.15 Peak height and peak potential of 0.10 µM 143<br />
aflatoxins obtained by BAS and Metrohm<br />
voltammetry analysers under optimised<br />
operational parameters for DPCSV method.<br />
3.16 Analytical parameters for calibration curves 145<br />
for AFB1,AFB2, AFG1 and AFG2 obtained by<br />
DPCSV technique using BRB at pH 9.0 as the<br />
supporting electrolyte.<br />
3.17 LOD values for determination of aflatoxins 148<br />
obtained by various methods.<br />
3.18 LOQ values for determination of aflatoxins 149<br />
obtained by various methods.<br />
3.19 Peak current and peak potential for all aflatoxins 167<br />
obtained by SWSV in BRB at pH 9.0 (n=5).<br />
3.20 Analytical parameters for calibration curves for 172<br />
AFB1, AFB2, AFG1 and AFG2 obtained by<br />
SWSV technique in BRB pH 9.0 as the<br />
supporting electrolyte.<br />
3.21 Result of reproducibility study (intra-day and inter- 173<br />
day measurements) for 0.1 µM aflatoxins in<br />
BRB at pH 9.0 obtained by SWSV method.<br />
3.22 Application of the proposed method in evaluation 174<br />
of the SWSV method by spiking the aflatoxin<br />
standard solutions.<br />
3.23 Average concentration of all aflatoxins within a 175<br />
year stability studies.<br />
3.24 The peak current and peak potential of 10 ppb 196<br />
AFB2 in presence and absence of a blank sample.<br />
3.25 Total aflatoxin contents in real samples which 203<br />
were obtained by DPCSV and HPLC<br />
techniques (average of duplicate analysis)<br />
xv
LIST OF FIGURES<br />
FIGURE NO. TITLE PAGE<br />
1.0 Aspergillus flavus seen under an electron 4<br />
microscope.<br />
1.1 Chemical structure of coumarin 6<br />
1.2 Chemical structures of (a) AFB1, (b) AFB2, 8<br />
(c) AFG1, (d) AFG2, (e) AFM1 and (f) AFM2<br />
1.3 Hydration of (a) AFB1 and (b) AFG1 by TFA 9<br />
produces (c) AFB2a and (d) AFG2a<br />
1.4 Transformation of toxic (a) AFB1 to non-toxic 11<br />
(b) aflatoxicol A.<br />
1.5 Major DNA adducts of AFB1; (a) 8,9-Dihydro-8- 13<br />
(N 7 -guanyl)-9-hydroxy-aflatoxin B1 (AFB1-Gua)<br />
and (b) 8,9-Dihydro-8-(N 5 -Formyl-2 ’ .5 ’ .6 ’ -<br />
triamino-4 ’ -oxo-N 5 -pyrimidyl)-9-hydroxy-Aflatoxin<br />
B1 (AFB1-triamino-Py)<br />
1.6 Metabolic pathways of AFB1 by cytochrom P-450 14<br />
enzymes; B1-epoxide = AFB1 epoxide, M1=<br />
aflatoxin M1, P1= aflatoxin P1 and Q1 = aflatoxin<br />
Q1.<br />
1.7 A typical arrangement for a voltammetric 34<br />
electrochemical cell (RE: reference electrode,<br />
WE: working electrode. AE: auxiliary electrode)<br />
1.8 A diagram of the Hanging Mercury Drop Electrode 37<br />
(HMDE)<br />
1.9 A diagram of the Controlled Growth Mercury 38<br />
Electrode (CGME)<br />
1.10 Cyclic voltammograms of (a) reversible, 52<br />
(b) irriversible and (c) quasireversible reaction at<br />
mercury electrode (O = oxidised form and R = reduced<br />
form)<br />
xvi
1.11 The potential-time sequence in stripping analysis 55<br />
1.12 Schematic drawing showing the Faradaic current 59<br />
and charging current versus pulse time course<br />
1.13 Schematic drawing of steps in DPV by 60<br />
superimposing a periodic pulse on a linear scan<br />
1.14 Waveform for square-wave voltammetry 61<br />
2.0 BAS CGME stand (a) which is connected to 71<br />
CV-50W voltammetric analyser and interface<br />
with computer (b) for data processing<br />
2.1 VA757 Computrace Metrohm voltammetric 71<br />
analyser with 663 VA stand (consists of Multi<br />
Mode (MME))<br />
3.0 Cathodic peak current of 0.6 µM AFB1 in various 89<br />
pH of BRB obtained in cathodic cyclic voltammetry.<br />
Ei = 0, Elow = -1.5 V, Ehigh = 0 and scan rate = 200<br />
mV/s)<br />
3.1 Shifting of peak potential of AFB1 with increasing 90<br />
pH of BRB. Parameter conditions are the same<br />
as in Figure 3.0.<br />
3.2 Mechanism of reduction of AFB1 in BRB at pH 6.0 90<br />
to 8.0.<br />
3.3 Mechanism of reduction of AFB1 in BRB at pH 9.0 91<br />
to 11.0.<br />
3.4 Cathodic cyclic voltammogram for 1.3 µM AFB1 92<br />
obtained at scan rate of 200 mV/s, Ei = 0, Elow =<br />
-1.5 V and Ehigh = 0 in BRB solution at pH 9.0.<br />
3.5 Cathodic cyclic voltammogram for 1.3 µM AFB2 92<br />
in BRB solution at pH 9.0. All parameter conditions<br />
are the same as in Figure 3.4.<br />
3.6 Cathodic cyclic voltammogram for 1.3 µM AFG1 93<br />
in BRB solution at pH 9.0. All parameter conditions<br />
are the same as in Figure 3.4.<br />
xvii
3.7 Cathodic cyclic voltammogram for 1.3 µM AFG2 93<br />
in BRB solution at pH 9.0. All parameter conditions<br />
are the same as in Figure 3.4.<br />
3.8 Effect of Ei to the Ip of 0.6 µM AFB1 in BRB at pH 94<br />
9.0 obtained by cathodic cyclic voltammetry. All<br />
parameter conditions are the same as in Figure 3.4.<br />
3.9 Effect of Ei to the Ip of 0.1 µM Zn 2+ in BRB at pH 94<br />
9.0 obtained by cathodic cyclic voltammetry. All<br />
parameter conditions are the same as in Figure 3.4.<br />
3.10 Anodic cyclic voltammogram of 1.3 µM AFB2 95<br />
obtained at scan rate of 200 mV/s, Ei = -1.5 V,<br />
Elow = -1.5 V and Ehigh = 0 in BRB at pH 9.0.<br />
3.11 Effect of increasing AFB2 concentration on the 96<br />
peak height of cathodic cyclic voltammetrc curve<br />
in BRB at pH = 9.0. (1.30 µM, 2.0 µM, 2.70 µM<br />
and 3.40 µM). All parameter conditions are the<br />
same as in Figure 3.4.<br />
3.12 Peak height of reduction peak of AFB2 with 96<br />
increasing concentration of AFB2. All parameter<br />
conditions are the same as in Figure 3.4.<br />
3.13 Repetitive cathodic cyclic voltammograms of 1.3 98<br />
µM AFB2 in BRB solution at pH 9.0. All<br />
experimental conditions are the same as in Figure 3.4.<br />
3.14 Increasing Ip of 1.3 µM AFB2 cathodic peak 98<br />
obtained from repetitive cyclic voltammetry. All<br />
experimental conditions are the same as in Figure 3.4.<br />
3.15 Peak potential of 1.3 µM AFB2 with increasing 99<br />
number of cycle obtained by repetitive cyclic<br />
voltammetry.<br />
xviii
3.16 Plot of log Ip versus log υ for 1.3 µM AFB2 in 100<br />
BRB solution at pH 9.0. All experimental conditions<br />
are the same as in Figure 3.4.<br />
3.17 Plot of Ep versus log υ for 1.3 µM AFB2 in BRB 101<br />
solution at pH 9.0.<br />
3.18 Plot of Ip versus υ for 1.3 µM AFB2 in BRB 102<br />
solution at pH 9.0. All parameter conditions<br />
are the same as in Figure 3.4.<br />
3.19 DPCS voltammograms of 1.0 µM AFB2 (Peak I) 103<br />
in BRB at pH 9.0 (a) at tacc = 0 and 30 s. Other<br />
parameter conditions; Ei = 0, Ef = -1.50 V,<br />
Eacc = 0, υ =50 mV/s and pulse amplitude =<br />
100 mV. Peak II is the Zn peak.<br />
3.20 DPCS voltammograms of 2.0 µM AFB2 in BRB 104<br />
in BRB (Peak I) at different pH values; 6.0, 7.0,<br />
8.0, 9.0, 11.0and 13.0. Other parameter conditions;<br />
Ei = 0, Ef =-1.50 V, Eacc = 0, υ = 50 mV/s and pulse<br />
amplitude =100 mV. Peak II is the Zn peak.<br />
3.21 Dependence of the Ip for AFB2 on the pH of 105<br />
0.04 M BRB solution. AFB2 concentration:<br />
2.0 µM, Ei =0, Ef = -1.5 V, Eacc = 0, tacc = 30 sec,<br />
υ = 50 mV/s and pulse amplitude = 100 mV.<br />
3.22 Ip of 2.0 µM AFB2 obtained in BRB (a) at pH 106<br />
from 9.0 decreases to 4.0 and re-increase to 9.0 and<br />
(b) at pH from 9.0 increase to 13.0 and re-decrease<br />
to 9.0.<br />
3.23 UV-VIS spectrums of 1 ppm AFB2 in BRB at 107<br />
pH (a) 6.0, (b) 9.0 and (c) 13.0.<br />
3.24 Opening of lactone ring by strong alkali caused no 108<br />
peak to be observed for AFB2 in BRB at pH 13.0.<br />
3.25 Ip of 2.0 µM AFB2 in different concentration of 109<br />
BRB at pH 9.0. Experimental conditions are<br />
the same as in Figure 3.20.<br />
3.26 Ip of 2.0 µM AFB2 in different pH and concentrations 110<br />
of BRB.<br />
xix
3.27 DPCS voltammograms of 2.0 AFB2 (Peak I) 110<br />
in (a) 0.04 M, (b) 0.08 M and (c) 0.08 M BRB<br />
at pH 9.0 as the blank. Ei = 0 V, Ef = -1.5 V,<br />
Eacc = 0 V, tacc = 30 sec, υ = 50mV/s and pulse<br />
amplitude = 100 mV. Peak II is the Zn peak.<br />
3.28 Chemical structures of (a) 2,3-dihydrofuran, 111<br />
(b) tetrahydrofuran and (c) coumarin.<br />
3.29 Voltammograms of 2,3-dihydrifuran (peak I) for 112<br />
concentrations from (b) 0.02 to 0.2 µM in (a)<br />
BRB at pH 9.0.<br />
3.30 Dependence of Ip of coumarin to its concentrations 112<br />
3.31 Voltammograms of coumarin at concentration of 113<br />
(b) 34 µM, (c) 68 µM, (d) 102 µM, (e) 136 µM<br />
and (f) 170 µM in (a) BRB at pH 9.0.<br />
3.32 Chemical structures of (a) cortisone and (b) 114<br />
testosterone.<br />
3.33 Chemical structures of (a) digoxin and (b) digitoxin 115<br />
3.34 Effect of pH of BRB solution on the Ep for AFB2. 117<br />
AFB2 concentration: 2.0 µM. Ei = 0, Ef = -1.5 V,<br />
Eacc = 0, tacc = 30 s and υ = 50 mV/s.<br />
3.35 Effect of various υ to the (a) Ip and (b) Ep of 2.0 µM 118<br />
AFB2 peak in BRB at pH 9.0. Ei = 0, Ef = 1.50 V,<br />
Eacc = 0, tacc = 15 s and pulse amplitude = 100 mV.<br />
3.36 Effect of tacc on (a) Ip and (b) Ep of 2.0 µM AFB2 119<br />
peak in BRB at pH 9.0. Ei = 0, Ef = 1.50 V, Eacc = 0,<br />
υ = 40 mV/s and pulse amplitude = 100 mV.<br />
3.37 The relationship between (a) Ip and (b) Ep with 120<br />
Eacc for 2.0 µM AFB2 in BRB at pH 9.0.<br />
Ei = 0, Ef = -1.5 V, tacc = 15 s, υ = 40 mV/s and<br />
pulse amplitude = 100 mV.<br />
3.38 Effect of Ei on (a) Ip and (b) Ep of 2.0 µM AFB2 121<br />
in BRB at pH 9.0. Ef = 1.50 V, Eacc = -0.80 V,<br />
tacc = 40 s,υ = 40 mV/s and pulse amplitude =<br />
100 mV.<br />
xx
3.39 Effect of pulse amplitude on (a) Ip and (b) Ep 122<br />
of 2.0 µM AFB2 in BRB at pH 9.0. Ei = -1.0 V,<br />
Ef = 1.50 V, Eacc = -0.80 V, tacc = 40 s and υ =<br />
40 mV/s.<br />
3.40 Effect of Eacc on Ip of 0.06 µM AFB2. Ei = -1.0 V, 123<br />
Ef = -1.50 V, tacc = 40 s, υ = 40 mV/s and pulse<br />
amplitude = 100 mV.<br />
3.41 Effect of tacc on (a) Ip and (b) Ep of 0.06 µM AFB2 124<br />
in BRB at pH 9.0. Ei = -1.0 V, Ef = -1.50 V, Eacc =<br />
-0.6 V, υ = 40 mV/s and pulse amplitude = 100 mV.<br />
3.42 The effect υ on (a) Ip and (b) Ep of 0.06 µM AFB2 125<br />
In BRB at pH 9.0. Ei = -1.0 V, Ef = -1.50 V, Eacc =<br />
-0.6 V, tacc = 80 s and pulse amplitude = 100 mV.<br />
3.43 Voltammograms of 0.06 µM AFB2 obtained under 126<br />
(a) optimised and (b) unoptimised parameters in BRB<br />
at pH 9.0.<br />
3.44 Voltammograms of 0.1 µM (a) AFB1, (b) AFG1, 128<br />
(c) AFB2 and (d) AFG2 in BRB at pH 9.0. Ei = 1.0<br />
(except for AFG1 = -0.95 V), Ef = -1.4 V, Eacc = -0.6 V,<br />
tacc = 80 s, υ = 50 mV/s and pulse amplitude = 80 mV.<br />
3.45 Voltammograms of (b) mixed aflatoxins in (a) BRB at 129<br />
pH 9.0 as the blank. Parameters condition: Ei = -0.95 V,<br />
Ef = -1.4 V, Eacc = -0.6 V, tacc = 80 s, υ = 50 mV/s and<br />
Pulse amplitude = 80 mV.<br />
3.46 Increasing concentration of AFB2 in BRB at pH 9.0. 130<br />
The parameter conditions: Ei = -1.0 V, Ef = -1.4 V,<br />
Eacc =-0.6 V, tacc = 80 s, υ = 50 mV/s and<br />
pulse amplitude = 80 mV.<br />
3.47 Linear plot of Ip versus concentration of AFB2 130<br />
in BRB at pH 9.0. The parameter conditions are<br />
the same as in Figure 3.46.<br />
3.48 Standard addition of AFB1 in BRB at pH 9.0. 135<br />
The parameter conditions: Ei = -1.0 V, Ef = -1.4 V,<br />
Eacc =-0.8 V, tacc = 80 s, υ = 50 mV/s and<br />
pulse amplitude = 80 mV.<br />
xxi
3.49 Linear plot of Ip versus concentration of AFB1 135<br />
in BRB at pH 9.0. The parameter conditions are<br />
the same as in Figure 3.48.<br />
3.50 Effect of concentration to Ip of AFG1 in BRB at 138<br />
pH 9.0. Ei = -0.95 V, Ef = -1.40 V, Eacc =-0.8 V,<br />
tacc = 80 s, υ = 50 mV/s and pulse amplitude = 80 mV.<br />
3.51 Linear plot of Ip versus concentration of AFG1 138<br />
in BRB at pH 9.0. The parameter conditions are<br />
the same as in Figure 3.50.<br />
3.52 Effect of concentration to Ip of AFG2 in BRB at 140<br />
pH 9.0. Ei = -1.0 V, Ef = -1.40 V, Eacc =-0.8 V,<br />
tacc = 80 s, υ = 50 mV/s and pulse amplitude = 80 mV.<br />
3.53 Linear plot of Ip versus concentration of AFG2 141<br />
in BRB at pH 9.0. The parameter conditions are<br />
the same as in Figure 3.52.<br />
3.54 Voltammograms of 0.1 µM (a) AFB1, (b) AFB2, 144<br />
(c) AFG1 and (d) AFG2 in BRB at pH 9.0<br />
(d) obtained by 747 VA Metrohm. Ei = -1.0 V (except<br />
for AFG1 = -0.95 V), Ef = -1.4 V, Eacc = -0.6 V,<br />
tacc = 80 s, υ = 50 mV/s and pulse amplitude = 80 mV.<br />
3.55 Ip of all aflatoxins with increasing concentration of 150<br />
Zn 2+ up to 1.0 µM.<br />
3.56 Voltammograms of (i) 0.1µM AFB2 and (ii) AFB2-Zn 151<br />
complex with increasing concentration of Zn 2+ (a = 0,<br />
b = 0.75 µM, c = 1.50 µM, d = 2.25 µM and e = 3.0 µM).<br />
Blank = BRB at pH 9.0. Experimental conditions;<br />
Ei = -1.0 V, Ef = -1.40 V, Eacc = -0.6 V, tacc = 80 s,<br />
υ = 50 mV/s and pulse amplitude = 80 mV.<br />
3.57 Ip of all aflatoxins after reacting with increasing 151<br />
concentration of Zn 2+ in BRB at pH 3.0.<br />
Measurements were made in BRB at pH 9.0 within<br />
15 minutes of reaction time. Ei = -1.0 V (except<br />
for AFG1 = -0.95 V), Ef = -1.40 V, Eacc = -0.6 V,<br />
tacc = 80 s, υ = 50 mV/s and pulse amplitude = 80 mV.<br />
xxii
3.58 Absorbance of all aflatoxins with increasing 152<br />
concentration of Zn 2+ in BRB at pH 3.0 within 15<br />
minutes of reaction time<br />
3.59 Voltammograms of 0.1µM AFB2 with increasing 153<br />
concentration of Zn 2+ (from 0.10 to 0.50 µM) in<br />
BRB at pH 9.0. Ei = -0.25 V, Ef = -1.4 V, Eacc =<br />
-0.6 V, tacc = 80 s, υ = 50 mV/s and pulse amplirude =<br />
80 mV. .<br />
3.60 Chemical structure of ascorbic acid. 153<br />
3.61 Ip of all aflatoxins with increasing concentration 154<br />
of ascorbic acid up to 1.0 µM. Concentrations of<br />
all aflatoxins are 0.1µM.<br />
3.62 Voltammograms of 0.1µM AFB2 with increasing 154<br />
concentration of ascorbic acid.<br />
3.63 Ip of all aflatoxins with increasing concentration 155<br />
of β-cyclodextrin up to 1.0 µM.<br />
3.64 Voltammograms of 0.1µM AFB2 with increasing 156<br />
concentration of β-cyclodextrin.<br />
3.65 Chemical structure of L-cysteine. 156<br />
3.66 Ip of all aflatoxins with increasing concentration 157<br />
of cysteine up to 1.0 µM.<br />
3.67 Voltammograms of 0.1 µM AFB2 obtained by 158<br />
(a) DPCSV and (b) SWSV techniques in BRB at<br />
pH 9.0. Parameters for DPCSV: Ei = -1.0 V, Ef =<br />
-1.40V, Eacc = -0.6 V, tacc = 80 s, υ = 50 mV/s and<br />
pulse amplitude = 80 mV and for SWSV: Ei = -1.0 V,<br />
Ef = -1.40V, Eacc = -0.6 V, tacc = 80 s, frequency =<br />
50 Hz, voltage step = 0.02 V, amplitude = 80 mV<br />
and υ = 1000 mV/s.<br />
3.68 Influence of pH of BRB on the Ip of 0.10 µM 159<br />
AFB2 using SWSV technique. The instrumental<br />
Parameters are the same as in Figure 3.67.<br />
3.69 Voltammograms of 0.1 µM AFB2 in different pH 160<br />
of BRB. Parameter conditions: Ei = -1.0 V, Ef =<br />
-1.40 V, Eacc = -0.6 V, tacc = 80 s, voltage step =<br />
xxiii
0.02 V, amplitude = 50 mV, frequency = 50 Hz<br />
and υ = 1000 mV/s.<br />
3.70 Effect of Ei to the Ip of 0.10 µM AFB2 in BRB at 160<br />
pH 9.0.<br />
3.71 Effect of Eaccto the Ip of 0.10 µM AFB2 in BRB at 161<br />
pH 9.0.<br />
3.72 Relationship between Ip of 0.10 µM AFB2 while 162<br />
increasing tacc.<br />
3.73 Effect of frequency to the Ip of 0.10 µM AFB2 in 162<br />
BRB at pH 9.0.<br />
3.74 Linear relatioship between Ip of AFB2 and square 163<br />
root of frequency.<br />
3.75 Influence of square-wave voltage step to Ip of 163<br />
0.10 µM AFB2.<br />
3.76 Influence of square-wave amplitude to Ip of 0.10 µM 164<br />
AFB2.<br />
3.77 Relationship of SWSV Ep of AFB2 with increasing 164<br />
amplitude.<br />
3.78 Ip of 0.10 µM AFB2 obtained under (a) non-optimised 165<br />
and (b) optimised SWSV parameters compared with<br />
that obtained under (c) optimised DPCSV parameters.<br />
3.79 Voltammograms of 0.10 µM AFB2 obtained under 166<br />
(a) non-optimised and (b) optimised SWSV<br />
parameters compared with that obtained under (c)<br />
optimised DPCSV parameters.<br />
3.80 Ip of 0.10 µM aflatoxins obtained using two 167<br />
different stripping voltammetric techniques under<br />
their optimum paramter conditions in BRB at pH 9.0.<br />
3.81 Voltammograms of (i) AFB1, (ii) AFB2, (iii) AFG1 168<br />
and (iV) AFG2 obtained by (b) DPCSV compared<br />
with that obtained by (c) SWSV in (a) BRB at pH 9.0.<br />
3.82 SWSV voltammograms for different concentrations 169<br />
of AFB1 in BRB at pH 9.0. The broken line<br />
xxiv
epresents the blank: (a) 0.01 µM, (b) 0.025 µM,<br />
(c) 0.05 µM, (d) 0.075 µM, (e) 0.10 µM, (f) 0.125<br />
µM and (g) 0.150 µM. Parameter conditions:<br />
Ei = -1.0 V, Ef = -1.4 V, Eacc = -0.8 V, tacc = 100 s,<br />
frequency = 125 Hz, voltage step = 0.03 V, pulse<br />
amplitude = 75 mV and scan rate = 3750 mV/s.<br />
3.83 Calibration curve for AFB1 obtained by SWSV 170<br />
method.<br />
3.84 Calibration curve for AFB2 obtained by SWSV 170<br />
method.<br />
3.85 Calibration curve for AFG1 obtained by SWSV 170<br />
method.<br />
3.86 Calibration curve for AFG2 obtained by SWSV 171<br />
method.<br />
3.87 LOD for determination of aflatoxins obtained by 171<br />
two different stripping methods.<br />
3.88 UV-VIS spectrums of 10 ppm of all aflatoxins in 176<br />
benzene: acetonitrile (98%) at preparation date.<br />
3.89 UV-VIS spectrums of 10 ppm of all aflatoxins in 176<br />
benzene: acetonitrile (98%) after 6 months of<br />
storage time.<br />
3.90 UV-VIS spectrums of 10 ppm of all aflatoxins in 177<br />
benzene: acetonitrile (98%) after 12 months of<br />
storage time.<br />
3.91 UV-VIS spectrums of 10 ppm AFB1 (a) kept in 178<br />
the cool and dark conditions and (b) exposed to<br />
ambient conditions for 3 days.<br />
3.92 UV-VIS spectrums of 1 ppm AFB1 in BRB 178<br />
solution prepared from (a) good and (b) damaged<br />
10 ppm AFB1 stock solution.<br />
3.93 UV-VIS spectrums of 1 ppm AFB1 in BRB 179<br />
solution prepared from (a) good and (b) damaged<br />
10 ppm AFB1 stock solution after 2 week stored in<br />
the cool and dark conditions.<br />
xxv
3.94 Percentage of Ip of 0.10 µM aflatoxins in BRB at pH 180<br />
9.0 at different storage time in the cool and dark<br />
conditions.<br />
3.95 Percentage of Ip of all aflatoxins in BRB at pH 9.0 181<br />
exposed to ambient conditions up to 8 hours of<br />
exposure time.<br />
3.96 Reaction of 8,9 double bond furan rings in AFB1 182<br />
with TFA, iodine and bromine under special<br />
conditions (Kok, et al., 1986).<br />
3.97 Voltammograms of 0.10 µM AFB1 obtained in (a) 183<br />
BRB at pH 9.0 which were prepared from (b)<br />
damaged and (c) fresh stock solutions.<br />
3.98 Ip of 0.10 µM AFB1 obtained in BRB at pH 9.0 184<br />
from 0 to 8 hours in (a) light exposed and (b)<br />
light protected.<br />
3.99 Ip of 0.10 µM AFB2 obtained in BRB at pH 9.0 184<br />
from 0 to 8 hours in (a) light exposed and (b)<br />
light protected.<br />
3.100 Ip of 0.10 µM AFG1 obtained in BRB at pH 9.0 185<br />
from 0 to 8 hours in (a) light exposed and (b)<br />
light protected.<br />
3.101 Ip of 0.10 µM AFG2 obtained in BRB at pH 9.0 185<br />
from 0 to 8 hours in (a) light exposed and (b)<br />
light protected.<br />
3.102 Peak heights of 0.10 µM aflatoxins in BRB at pH 187<br />
(a) 6.0, (b) 7.0, (c) 9.0 and (d) 11.0 exposed to<br />
ambient conditions up to 3 hours of exposure time.<br />
3.103 Resonance forms of the phenolate ion 187<br />
(Heathcote, 1984).<br />
3.104 Voltammograms of 0.10 µM AFB2 in BRB at pH 188<br />
6.0 from 0 to 3 hrs exposure time.<br />
3.105 Voltammograms of 0.10 µM AFB2 in BRB at pH 188<br />
11.0 from 0 to 3 hrs of exposure time.<br />
xxvi
3.106 Voltammograms of 0.10 µM AFG2 in BRB at pH 189<br />
6.0 from 0 to 3 hrs of exposure time.<br />
3.107 Voltammograms of 0.10 µM AFG2 in BRB at pH 189<br />
11.0 from 0 to 3 hrs of exposure time.<br />
3.108 Absorbance of 1.0 ppm aflatoxins in BRB at pH 190<br />
(a) 6.0, (b) 7.0, (c) 9.0 and (d) 11.0 from 0 to 3<br />
hours of exposure time.<br />
3.109 The peak heights of aflatoxins in 1.0 M HCl from 191<br />
0 to 6 hours of reaction time.<br />
3.110 The peak heights of aflatoxins in 1.0 M NaOH from 192<br />
0 to 6 hours of reaction time.<br />
3.111 Voltammograms of real samples after extraction by 193<br />
Technique (a) 1, (b) 2 and (c) 3 with addition of<br />
AFB1 standard solution in BRB at pH 9.0 as a<br />
blank.<br />
3.112 Voltammograms of blank in BRB at pH 9.0 obtained 194<br />
by (a) DPCSV and (b) SWSV methods.<br />
3.113 DPCSV (a) and SWSV (b) voltammograms of 10 195<br />
ppb AFB2 (i) in present of blank sample (ii) obtained<br />
in BRB at pH 9.0 (iii) as the supporting electrolyte.<br />
3.114 DPCSV voltammograms of real samples (b) added 197<br />
with 3 ppb (i), 9 ppb (ii) and 15 ppb (iii) AFB1<br />
obtained in BRB at pH 9.0 (a) as the blank on the<br />
first day measurement.<br />
3.115 Percentage of recoveries of (a) 3 ppb, (b) 9 ppb, 198<br />
(c) 15 ppb of all aflatoxins in real samples<br />
obtained by DPCSV methods for one to three<br />
days of measurements.<br />
3.116 DPCSV voltammograms of real sample, S11 (b) 199<br />
with the addition of 10 ppb AFB1 (c) in BRB at pH<br />
9.0 (a) as the blank. Parameter conditions: Eacc =<br />
-0.6 V, tacc = 80 s, scan rate = 50 mV/s and pulse<br />
amplitude = 80 mV.<br />
xxvii
3.117 SWSV voltammograms of real sample, S11 (b) 200<br />
with the addition of 10 ppb AFB1 (c) in BRB at pH<br />
9.0 (a) as the blank. Parameter conditions: Eacc =<br />
-0.8 V, tacc = 100 s, scan rate = 3750 mV/s,<br />
frequency = 125 Hz, voltage step = 0.03 V and<br />
pulse amplitude = 75 mV.<br />
3.118 DPCSV voltammograms of real sample, S07 (b) 200<br />
with the addition of 10 ppb AFB1 (c) in BRB at pH<br />
9.0 (a) as the blank. Parameter conditions: Eacc =<br />
-0.6 V, tacc = 80 s, scan rate = 50 mV/s and pulse<br />
amplitude = 80 mV.<br />
3.119 SWSV voltammograms of real sample, S07 (b) 201<br />
with the addition of 10 ppb AFB1 (c) in BRB at pH<br />
9.0 (a) as the blank. Parameter conditions: Eacc =<br />
-0.8 V, tacc = 100 s, scan rate = 3750 mV/s,<br />
frequency = 125 Hz, voltage step = 0.03 V and<br />
pulse amplitude = 75 mV.<br />
3.120 DPCSV voltammograms of real sample, S10 (b) 201<br />
with the addition of 10 ppb AFB1 (c) in BRB at pH<br />
9.0 (a) as the blank. Parameter conditions: Eacc =<br />
-0.6 V, tacc = 80 s, scan rate = 50 mV/s and pulse<br />
amplitude = 80 mV.<br />
3.121 SWSV voltammograms of real sample, S10 (b) 202<br />
with the addition of 10 ppb AFB1 (c) in BRB at pH<br />
9.0 (a) as the blank. Parameter conditions: Eacc =<br />
-0.8 V, tacc = 100 s, scan rate = 3750 mV/s,<br />
frequency = 125 Hz, voltage step = 0.03 V and<br />
pulse amplitude = 80 mV.<br />
xxviii
ABBREVIATIONS<br />
AAS Atomic absorption spectrometry<br />
Abs Absorbance<br />
ACP Alternate current polarography<br />
ACV Alternate current voltammetry<br />
AD Amperometric detector<br />
AdCSV Adsorptive cathodic stripping voltammetry<br />
AE Auxiliary electrode<br />
AFB1 Aflatoxin B1<br />
AFB2 Aflatoxin B2<br />
AFG1 Aflatoxin G1<br />
AFG2 Aflatoxin G2<br />
AFM1 Aflatoxin M1<br />
AFM2 Aflatoxin M2<br />
AFP1 Aflatoxin P1<br />
AFQ1 Aflatoxin Q1<br />
Ag/AgCl Silver/silver chloride<br />
ASV Anodic stripping voltammetry<br />
β-CD β-cyclodextrin<br />
BFE Bismuth film electrode<br />
BLMs Bilayer lipid membranes<br />
BRB Britton Robinson Buffer<br />
CA Concentration of analyte<br />
CE Capillary electrophoresis<br />
CGME Controlled growth mercury electrode<br />
CME Chemically modified electrode<br />
CPE Carbon paste electrode<br />
CSV Cathodic stripping voltammetry<br />
CV Cyclic voltammetry<br />
xxix
DC Direct current<br />
DCP Direct current polarography<br />
DME Dropping mercury electrode<br />
DMSO Dimethyl sulphonic acid<br />
DNA Deoxyribonucliec acid<br />
DPCSV Differential pulse cathodic stripping voltammetry<br />
DPP Differential pulse polarography<br />
DPV Differential pulse voltammetry<br />
Eacc Accumulation potential<br />
Ei Initial potential<br />
Ef Final potential<br />
Ehigh High potential<br />
Elow Low potential<br />
Ep Peak potential<br />
ECS Electrochemical sensing<br />
Et4NH4 OH Tetraethyl ammonium hydroxide<br />
ELISA Enzyme linked immunosorbant assay<br />
FD Fluorescence detector<br />
FDA Food and Drug Administration<br />
GCE Glassy carbon electrode<br />
GC-FID Gas chromatography with flame ionisation detector<br />
HMDE Hanging mercury drop electrode<br />
HPLC High performance liquid chromatography<br />
HPTLC High pressure thin liquid chromatography<br />
IAC Immunoaffinity chromatography<br />
IACLC Immunoaffinity column liquid chromatography<br />
IAFB Immunoaffinity fluorometer biosensor<br />
IARC International Agency for Research Cancer<br />
Ic Charging current<br />
Id Diffusion current<br />
If Faradaic current<br />
xxx
Ip Peak height<br />
ICP-MS Induced coupled plasma-mass spectrometer<br />
IR Infra red<br />
IUPAC International Union of Pure and Applied Chemistry<br />
KGy Kilogray<br />
LD50 Lethal dose 50<br />
LOD Limit of detection<br />
LOQ Limit of quantification<br />
LSV Linear sweep voltammetry<br />
MFE Mercury film electrode<br />
MS Mass spectrometer<br />
MECC Micellar electrokinetic capillary chromatography<br />
MOPS 3-(N-morpholino)propanesulphonic<br />
MOSTI Ministry of Science, Technology and Innovation<br />
NP Normal polarography<br />
NPP Normal pulse polarography<br />
NPV Normal pulse voltammetry<br />
OPLC Over pressured liquid chromatography<br />
PAH Polycyclic aromatic hydrocarbon<br />
PLL Poly-L-lysine<br />
ppb part per billion<br />
ppm part per million<br />
PSA Potentiometric stripping analysis<br />
RDX Hexahydro-1,3,5-trinitro-1,3,5-triazine<br />
RE Reference electrode<br />
RIA Radioimmunoassay<br />
RNA Ribonucleic acid<br />
RSD Relative standard deviation<br />
S/N Signal to noise ratio<br />
SCE Standard calomel electrode<br />
SCV Stair case voltammetry<br />
xxxi
SDS Sodium dodecyl sulphate<br />
SHE Standard hydrogen electrode<br />
SIIA Sequential injection immunoassay<br />
SMDE Static mercury drop electrode<br />
SPE Solid phase extraction<br />
SPCE Screen printed carbon electrode<br />
SWP Square-wave polarography<br />
SWV Square-wave voltammetry<br />
SWSV Square-wave stripping voltammetry<br />
SV Stripping voltammetry<br />
tacc Accumulation time<br />
TBS Tris buffered saline<br />
TEA Triethylammonium<br />
TLC Thin layer chromatography<br />
TFA Trifluoroacetic acid<br />
UME Ultra microelectrode<br />
ν Scan rate<br />
v/v Volume per volume<br />
UVD Ultraviolet-Visible detector<br />
UV-VIS Ultraviolet-Visible<br />
WE Working electrode<br />
WHO World Health Organisation<br />
λmax Maximum wavelenght<br />
εmax Maximum molar absorptivity<br />
xxxii
LIST OF APPENDICES<br />
xxxiii<br />
APPENDIX TITLE PAGE<br />
A Relative fluorescence of aflatoxins in different 255<br />
solvent s<br />
B UV spectra of the principal aflatoxins (in methanol) 256<br />
C Relative intensities of principal bands in the IR 257<br />
spectra of the aflatoxins<br />
D Calculation of concentration of aflatoxin stock 258<br />
solution<br />
E Extraction procedure for aflatoxins in real samples 259<br />
F Calculation of individual aflatoxin in groundnut 260<br />
samples.<br />
G Cyclic voltammograms of AFB1, AFB2 and AFG2 262<br />
with increasing of their concentrations.<br />
H Dependence if the peak heights of AFB1, AFG1 264<br />
and AFG2 on their concentrations.<br />
I Repetitive cyclic voltammograms and their peak 266<br />
heights of AFB1, AFG1 and AFG2 in BRB at pH 9.0<br />
J Plot Ep – log scan rate for the reduction of AFB1, 270<br />
AFG1 and AFG2 in BRB at pH 9.0<br />
K Plot of peak height versus scan rate for 1.3 µM of 272<br />
AFB1, AFG1 and AFG2 in BRB at pH 9.0<br />
L Voltammograms of AFB2 with increasing 274<br />
concentration.<br />
M Voltammograms of 0.1 µM and 0.2 µM AFB2 275<br />
obtained on the same day measurements<br />
N Voltammograms of AFB2 at inter-day 276<br />
measurements
O F test for robustness and ruggedness tests 278<br />
P Voltammograms of AFB1 with increasing 280<br />
concentration<br />
Q Voltammograms of AFG1 with increasing 281<br />
concentration<br />
R Voltammograms of AFG2 with increasing 282<br />
concentration<br />
S LOD determination according to Barek et al. (2001a) 283<br />
T LOD determination according to Barek et al. (1999) 286<br />
U LOD determination according to Zhang et al. (1996) 287<br />
V LOD determination according to Miller and 288<br />
Miller (1993)<br />
W ANOVA test 290<br />
X Peak height of aflatoxins in presence and absence of PLL 292<br />
Y SWSV voltammograms of AFB1, AFB2, AFG1 293<br />
and AFG2 in BRB at pH 9.0<br />
Z SWSV voltammograms of 0.10 µM AFB1, AFB2, 295<br />
AFG1 and AFG2 in BRB at pH 9.0<br />
AA UV-VIS spectrums of 10 ppm AFB1, AFB2, AFG1 297<br />
and AFG2 stock solutions<br />
AB Voltammograms of AFB1, AFB2, AFG1 and AFG2 299<br />
obtained from 0 to 6 months of storage time in the<br />
cool and dark conditions.<br />
AC Voltammograms of AFB1, AFB2, AFG1 and 302<br />
AFG2 in BRB at pH 9.0 from 0 to 8 hours of<br />
exposure time.<br />
AD UV-VIS spectrums of AFB2 in BRB at pH 6.0 305<br />
and 11.0.<br />
xxxiv
AE Voltammograms of AFB1 and AFG1 in 1.0 M HCl 307<br />
and 1.0 M NaOH<br />
AF DPCSV voltammograms of real samples added with 309<br />
various concentrations of AFG1<br />
AG SWSV voltammograms of real samples added with 310<br />
various concentrations of AFB1.<br />
AH Percentage of recoveries of various concentrations 311<br />
of all aflatoxins (3.0 and 9.0 ppb) in real samples<br />
obtained by SWSV method.<br />
AI Calculation of percentage of recovery for 3.0 ppb 312<br />
AFG1 added into real samples.<br />
AJ HPLC chromatograms of real samples: S10 and S07 313<br />
AK Calculation of aflatoxin in real sample, S13 314<br />
AL List of papers presented or published to date 315<br />
resulting from this study.<br />
AM ICP-MS results for analysis of BRB at pH 9.0 317<br />
xxxv
1.1 Overview<br />
CHAPTER I<br />
LITERATURE REVIEW<br />
Humans are continuously exposed to varying amounts of chemicals that have<br />
been shown to have carcinogenic or mutagenic properties in environmental systems.<br />
Exposure can occur exogenously when these agents are present in food, air or water, and<br />
also endogenously when they are products of metabolism or pathophysiologic states such<br />
as inflammation. Great attention is focused on environmental health in the past two<br />
decades as a consequence of the increasing awareness over the quality of life due to<br />
major environment pollutants that affect it. Studies have shown that exposure to<br />
environmental chemical carcinogens have contributed significantly to cause human<br />
cancers, when exposures are related to life style factors such as diet (Wogan et al., 2004).<br />
The contamination of food is part of the global problem of environmental<br />
pollution. Foodstuffs have been found contaminated with substances having<br />
carcinogenic, mutagenic, teratogenic and allergenic properties. As these substances can<br />
be supplied with food throughout the entire life-time of a person, it is necessary to deal<br />
with the chronic action of trace amounts of such substances. Hence the systematic<br />
determination of the foreign substances in nutritional products and feedstock plays an<br />
important role. The determination of trace impurities presents considerable difficulties<br />
owing to the fact that food is a complex system containing thousands of major and minor<br />
compounds (Nilufer and Boyacio, 2002). Increasing environment pollution by toxic<br />
substances such as toxic metals, organometallic and organic pollutants in air,
water, soil and food, calls for reliable analytical procedures for their control in<br />
environmental samples which needs reliable and sensitive methods (Fifield and Haines,<br />
2000). The choice of the method of analysis depends on the sample, the analyte to be<br />
assayed, accuracy, limit of detection, cost and time to complete the analysis (Aboul-<br />
Eneim et a., 2000). For development of this method, emphasis should be on<br />
development of simplified, cost-effective and efficient method that complies with the<br />
legislative requirements (Stroka and Anklam, 2002; Enker, 2003).<br />
The widespread occurrence of aflatoxins producing fungi in our environment and<br />
the reported naturally occurring of toxin in a number of agricultural commodities has led<br />
the investigator to develop a new method for aflatoxin analysis (Creepy, 2002). An<br />
accurate and sensitive method of analysis is therefore required for the determination of<br />
these compounds in foodstuffs that have sustained mould growth.<br />
Numerous articles concerning methods for determination of aflatoxins have been<br />
published. However, with regard to electroanalytical technique, only one method of<br />
determination was reported using the differential pulse pulse polarographic (DPP)<br />
technique which was developed by Smyth et al. (1979). In this experiment, the obtained<br />
limit of detection of aflatoxin B1 was 25 ppb which was higher as compared to the<br />
common amount of aflatoxin in contaminated food samples which is 10 ppb as reported<br />
by Pare (1997) or even less. In <strong>Malaysia</strong>, the regulatory limit for total aflatoxins in<br />
groundnut is 15 ppb. The regulatory for other foods and milk is 10 ppb and 0.05 ppb<br />
respectively (<strong>Malaysia</strong>n Food Act, 1983).<br />
1.2 AFLATOXINS<br />
1.2.1 Aflatoxins in General<br />
Aflatoxins are a group of heterocyclic, oxygen-containing mycotoxins that<br />
possess the bisdifuran ring system. It was discovered some 43 years ago in England<br />
2
following a poisoning outbreak causing 100,000 turkeys death (Miller, 1987 and<br />
Cespedez and Diaz, 1997). The aflatoxins are the most widely distributed fungal toxins<br />
in food. The occurrence of the aflatoxins in food products demonstrated that the high<br />
levels of aflatoxins are significant concern both for food traders and food consumers<br />
(Tozzi et al. 2003; Herrman, 2004; Haberneh, 2004). Aflatoxin is a by-product of mold<br />
growth in a wide range of agriculture commodities such as peanuts (Urano et al., 1993),<br />
maize and maize based food (Papp et al., 2002; Mendez-Albores et al., 2004),<br />
cottonseeds (Pons and Franz, 1977), cocoa (Jefferey et al., 1982), coffee beans (Batista et<br />
al., 2003), medical herbs ( Reif and Metzger, 1998; Rizzo et al., 2004), spices<br />
(Erdogen, 2004; Garner et al., 1993; Akiyama et al., 2001; Aziz et al., 1998), melon<br />
seeds (Bankole et al., 2004) and also in human food such as rice (Shotwell et al., 1966;<br />
Begum and Samajpati, 2000), groundnut (Bankole et al., 2005), peanut products ( Patey<br />
et al., 1990), corn ( Shotwell and Goulden, 1977; Urano et al., 1993 ), vegetable oil<br />
(Miller et al., 1985), beer (Scott and Lawrence, 1997), dried fruits ( Abdul Kadar et al.,<br />
2004, Arrus et al. (2004), milk and dairy products (Kamkar, 2004; Aycicek et al. 2005;<br />
Sarimehmetoglu et al., 2004; Martin and Martin, 2004 ). Meat and meat products are<br />
also contaminated with alfatoxins when farm animals are fed with aflatoxin contaminated<br />
feed (Miller, 1987 and Chiavaro et al., 2001).<br />
The molds that are major producers of aflatoxin are Aspergillus flavus<br />
(Bankole et al. 2004) and Aspergillus parasiticus (Begum and Samajpati, 2000;<br />
Setamou et al., 1997; Erdogen, 2004; Gourama and Bullerman, 1995). Aspergillus<br />
flavus, which is ubiquitous, produces B aflatoxins (Samajphati, 1979) while Aspergillus<br />
parasiticus, which produces both B and G aflatoxins, has more limited distribution<br />
(Garcia-Villanova et al., 2004). A picture of Aspergillus flavus seen under an electron<br />
microscope is shown in Figure 1.0.<br />
Black olive is one of the substrate for Aspergillus parasiticus growth and<br />
aflatoxin B1 production as reported by Leontopoulos et al., (2003). Biosynthesis of<br />
aflatoxins by this fungi depends on the environmental condition such as temperature and<br />
humidity during crop growth and storage (Leszczynska et al., 2000; Tarin et al., 2004<br />
3
and Pildain et al., 2004). The optimum temperatures for aflatoxins growth are 27.84 0 C<br />
and 27.30 0 C at pH=5.9 and 5.5 respectively.<br />
Figure 1.0: Aspergillus flavus seen under an electron microscope<br />
Before harvest, the risk for the development of aflatoxins is greatest during major<br />
drought (Turner et al., 2005). When soil moisture is below normal and temperature is<br />
high, the number of Aspergillus spores in the air increases. These spores infect crops<br />
through areas of damage caused by insects and inclement weather. Once infected, plant<br />
stress occurs, which favor the production of aflatoxins. Fungal growth and aflatoxins<br />
contamination are the sequence of interactions among the fungus, the host and the<br />
environment. The appropriate combination of water stress, high temperature stress and<br />
insect damage of the host plant are major determining factors in mold infestation and<br />
toxin production (Faraj et al., 1991; Koehler, 1985; Park and Bullerman, 1983).<br />
Additional factors such as heat treatment, modified-atmosphere packaging or the<br />
presence of preservative, also contribute in increasing growth rate of the aflatoxins.<br />
Farmers have minimal control over some of these environmental factors.<br />
However appropriate pre-harvest and post-harvest management and good agricultural<br />
practice, including crop rotation, irrigation, timed planting and harvesting and the use of<br />
pesticides are the best methods for preventing or controlling aflatoxins contamination<br />
4
(Turner et al., 2005). Timely harvesting could reduce crop moisture to a point where the<br />
formation of the mould would not occur. For example harvesting corn early when<br />
moisture is above 20 percent and then quickly drying it to a moisture level of at least 15<br />
percent will keep the Aspergillus flavus from completing its life cycle, resulting in lower<br />
aflatoxin concentration. Aflatoxins are to be found in agricultural products as a<br />
consequence of unprosperous storage conditions where humidity of 70 -90 % and a<br />
minimum temperature of about 10° C. Commodities that have been dried to about 12 to<br />
0.5 % moisture are generally considered stable, and immune to any risk of additional<br />
aflatoxins development. Moreover, the minimum damage of shells during mechanized<br />
harvesting of crop reduces significantly the mould contamination. Biocontrol of<br />
aflatoxin contamination is another way to reduce this contamination. The natural ability<br />
of many microorganisms including bacteria, actinomycetes, yeasts, moulds and algae has<br />
been a source for bacteriological breakdown of mycotoxins. The most active organism<br />
such as Flavobacterium aurantiacum which in aqueous solution can take up and<br />
metabolise aflatoxins B1, G1 and M1 (Smith and Moss, 1985).<br />
Production of aflatoxins is greatly inhibited by propionic acid as revealed by<br />
Molina and Gianuzzi (2002) when they studied the production of aflatoxins in solid<br />
medium at different temperature, pH and concentration of propionic acid. It also can be<br />
inhibited by essential oil extracted from thyme as found by Rasooli and Abnayeh (2004).<br />
Other chemicals that can inhibit the growth of this fungus are ammonia, copper sulphate<br />
and acid benzoic (Gowda et al., 2004).<br />
1.2.2 Chemistry of Aflatoxins<br />
Aflatoxins can be classified into two broad groups according to chemical<br />
structure which are difurocoumarocyclopentenone series and ifurocoumarolactone<br />
(Heathcote, 1984). They are highly substituted coumarin derivatives that contain a fused<br />
dihydrofuran moiety. The chemical structure of coumarin is shown in Figure 1.1.<br />
5
Figure 1.1 Chemical structure of coumarin<br />
O<br />
There are six major compounds of aflatoxin such as aflatoxin B1 (AFB1),<br />
aflatoxin B2 (AFB2), aflatoxin G1 (AFG2), aflatoxin G2 (AFG2), aflatoxin M1 (AFM1)<br />
and aflatoxin M2 (AFM2) (Goldblatt, 1969). The former four are naturally found<br />
aflatoxins and the AFM1 and AFM2 are produced by biological metabolism of AFB1<br />
and AFB2 from contaminated feed used by animals. They are odorless, tasteless and<br />
colorless. The scientific name for these aflatoxin compounds are listed in Table 1.0.<br />
Aflatoxins have closely similar structures and form a unique group of highly oxygenated,<br />
naturally occurring heterocyclic compounds. The chemical structures of these aflatoxins<br />
are shown in Figure 1.2. The G series of aflatoxin differs chemically from B series by<br />
the presence of a β-lactone ring, instead of a cyclopentanone ring. Also a double bond<br />
that may undergo reduction reaction is found in the form of vinyl ether at the terminal<br />
furan ring in AFB1 and AFG1 but not in AFB2 and AFG2. However this small<br />
difference in structure at the C-2 and C-3 double bond is associated with a very<br />
significant change in activity, whereby AFB1 and AFG1 are carcinogenic and<br />
considerably more toxic than AFB2 and AFG2. The dihydrofuran moiety in the structure<br />
is said to be of primary importance in producing biological effects. Hydroxylation of the<br />
bridge carbon of the furan rings for AFM1 does not significantly alter the effects of the<br />
compounds. The absolute configuration of AFB2 and AFG2 follows from the fact that it<br />
is derived from the reduction of AFB1 and AFG1 respectively.<br />
AFB is the aflatoxin which produces a blue color under ultraviolet while AFG<br />
produces the green color. AFM produces a blue-violet fluorescence while AFM2<br />
produces a violet fluorescence (Goldblatt, 1969). Relative fluorescence of aflatoxins in<br />
several organic solvents are shown in Appendix A (White and Afgauer, 1970). The<br />
O<br />
6
Table 1.0 Scientific name for aflatoxin compounds<br />
Aflatoxin B1<br />
(AFB1)<br />
Aflatoxin B2<br />
(AFB2)<br />
Aflatoxin G1<br />
(AFG1)<br />
Aflatoxin G2<br />
(AFG2)<br />
Aflatoxin<br />
M1<br />
(AFM1)<br />
Aflatoxin<br />
M2<br />
2,3,6a,9a-tetrahydro-4-methoxycyclopenta[c]<br />
furo[3’,2’:4,5]furo[2,3-h][l] benzopyran-1,11-dione<br />
2,3,6a,8,9,9a-Hexahydro-4-methoxycyclopenta[c]<br />
furo[3’,2’:4,5]furo[2,3-h][l] benzopyran-1,11-dione<br />
3,4, 7a,10a-tetrahydro-5-methoxy-1H, 12H<br />
furo[3’,2’:4,5]furo[2,3-h]pyrano[3,4-c]l]- benzopyran-<br />
1,12-dione<br />
3,4,7a,8,9,10, 10a-Hexahydro-5-methoxy-1H,12H-<br />
furo[3’,2’:4,5]furo[2,3-h]pyrano[3,4-c][l]- benzopyran-<br />
1,12-dione<br />
4-Hydroxy AFB1<br />
4-Hydroxy AFB2<br />
natural fluorescence of aflatoxins arises from their oxygenated pentaheterocyclic<br />
structure. The fluorescence capacity of AFB2 and AFG2 is ten times larger than that of<br />
AFB1 and AFG1, probably owing to the structural difference, namely double bond on the<br />
furanic ring. Such a double bond seems to be very important for the photophysical<br />
7
O<br />
O<br />
O<br />
O<br />
O<br />
O<br />
OH<br />
O<br />
O<br />
O<br />
O O<br />
O<br />
O<br />
(a) (b)<br />
O<br />
O<br />
O<br />
O<br />
O<br />
O<br />
O<br />
O<br />
O<br />
O<br />
OH<br />
O<br />
O<br />
O<br />
O<br />
O<br />
O<br />
O<br />
O<br />
O<br />
O<br />
O<br />
O<br />
O O<br />
(c) (d)<br />
(e) (f)<br />
Figure 1.2 Chemical structures of (a) AFB1, (b) AFB2, (c) AFG1, (d) AFG2,<br />
(e) AFM1 and (f) AFM2.<br />
properties of these derivatives measured just after spectroscopic studies (Cepeda et al.,<br />
1996). The excitation of the natural fluorescence of AFB1 and AFG1 can be promoted<br />
O<br />
8
in many different ways such as post-column iodination (Tuinstra and Haasnoot, 1983;<br />
Davis and Diener, 1980), post-column bromination (Kok et al.,1986; Kok, 1994 ;<br />
Versantroort et al., 2005 ), use of cyclodextrin compound (Cepeda et al., 1996; Chiavaro<br />
et al., 2001; Franco et al., 1998) and trifluoroacetic acid, TFA (Stack and Pohland,<br />
1975; Takahashi, 1977a; Haghighi et al., 1981; Nieduetzki et al., 1994 ).<br />
AFB1 and AFG1 form hemiacetals, AFB2a and AFG2a when reacted with acidic<br />
solution such as triflouroacetic acid (TFA) as represented in Figure 1.3 (Joshua, 1993).<br />
The hydroxyaflatoxins are unstable and tend to decompose to yellow products in the<br />
presence of air, light and alkali. Their UV and visible spectra are similar to those of the<br />
major aflatoxins.<br />
O<br />
O<br />
O<br />
O<br />
O<br />
O<br />
O<br />
O<br />
O O<br />
O<br />
O<br />
O<br />
TFA<br />
TFA<br />
HO<br />
(a) (c)<br />
HO<br />
O<br />
O<br />
O<br />
O<br />
O<br />
O<br />
O<br />
O<br />
O O<br />
(b) (d)<br />
Figure 1.3 Hydration of AFB1 (a) and AFG1 (b) by TFA produces AFB2a (c) and<br />
AFG2a (d) (Joshua, 1993).<br />
The close relationship between AFB1, AFG1, AFB2a and AFG2a was shown by the<br />
similarities in their IR and UV spectra. The main difference between AFB2a and AFG2a<br />
with AFB1 and AFG1 are found in the IR spectra, where an additional band at 3620 cm -1<br />
O<br />
O<br />
O<br />
9
indicates the presence of a hydroxyl group in AFB2a and AFG2a. The absence of bands<br />
at 3100, 1067 and 722 cm -1 (which arise in AFB1 and AFG1 from the vinyl ether group)<br />
indicates that the compounds are hydroxyl derivatives of AFB2 and AFG2. Some<br />
chemical and physical properties of aflatoxin compounds are listed in Table 1.1<br />
(Heathcote and Hibbert, 1978; Weast and Astle, 1987). The close relationship between<br />
these aflatoxins was shown by the similarities in their UV and IR spectra as shown in<br />
Appendix B and C respectively.<br />
Table 1.1 Chemical and physical properties of aflatoxin compounds<br />
Molecular<br />
formula<br />
Molecular weight<br />
Crystals<br />
Melting point<br />
( ° C )<br />
Fluorescence<br />
under UV light<br />
Solubility<br />
Other properties<br />
AFB1<br />
C17H12O6<br />
312<br />
Pale yellow<br />
268.9<br />
Blue<br />
AFB2<br />
C17H14O6<br />
314<br />
Pale yellow<br />
286.9<br />
Blue<br />
AFG1<br />
C17H12O7<br />
328<br />
Colorless<br />
244.6<br />
Green<br />
AFG2<br />
C17H14O7<br />
330<br />
Colorless<br />
237.40<br />
Green<br />
Soluble in water and polar organic solvent. Normal solvents<br />
are: methanol, water: acetonitrile (9:1), trifluoroacetic acid,<br />
methanol: 0.1N HCl (4:1), DMSO and acetone<br />
Odorless, colorless and tasteless in solution form.<br />
Incompatible with strong acids, strong oxidising agents and<br />
strong bases. Soluble in water, DMSO, 95% acetone or<br />
ethanol for 24 hours under ambient temperature<br />
10
STRIPPING VOLTAMMETRIC METHODS FOR<br />
THE DETERMINATION OF AFLATOXIN COMPOUNDS<br />
MOHAMAD HADZRI BIN YAACOB<br />
UNIVERSITI TEKNOLOGI MALAYSIA
BAHAGIAN A – Pengesahan Kerjasama *<br />
Adalah disahkan bahawa projek penyelidikan tesis ini telah dilaksanakan melalui<br />
kerjasama antara _____________________ dengan _________________________<br />
Disahkan oleh:<br />
Tandatangan : .......................................................... Tarikh : ..........................<br />
Nama : ..........................................................<br />
Jawatan :...........................................................<br />
(Cop rasmi)<br />
* Jika penyediaan tesis/projek melibatkan kerjasama.<br />
BAHAGIAN B – Untuk Kegunaan Pejabat Sekolah Pengajian Siswazah<br />
Tesis ini telah diperiksa dan diakui oleh:<br />
Nama dan Alamat<br />
Pemeriksa Luar : Prof. Dr. Noor Azhar Bin Mohd Shazili<br />
Pengarah<br />
Institut Oseanografi,<br />
Kolej <strong>Universiti</strong> Sains dan <strong>Teknologi</strong> <strong>Malaysia</strong>,<br />
Mengabang Telipot<br />
21030 Kuala Terengganu<br />
Nama dan Alamat<br />
Pemeriksa Dalam I : Prof. Madya Dr. Razali Bin Ismail<br />
Fakulti Sains,<br />
UTM, Skudai<br />
Pemeriksa Dalam II :<br />
Nama Penyelia Lain<br />
(jika ada) :<br />
Disahkan oleh Penolong Pendaftar di Sekolah Pengajian Siswazah:<br />
Tandatangan : .......................................................... Tarikh : ..........................<br />
Nama : .GANESAN A/L ANDIMUTHU
STRIPPING VOLTAMMETRIC METHODS FOR<br />
THE DETERMINATION OF AFLATOXIN COMPOUNDS<br />
MOHAMAD HADZRI BIN YAACOB<br />
A thesis submitted in fulfilment of the<br />
requirements for the award of the degree of<br />
Doctor of Philosophy<br />
Faculty of Science<br />
<strong>Universiti</strong> <strong>Teknologi</strong> <strong>Malaysia</strong><br />
APRIL 2006
Specially dedicated to:<br />
My mother, wife, sons, daughters and all families for<br />
all the love, support and continuous prayer<br />
for my success in completing this work.<br />
iii
ACKNOWLEDGEMENT<br />
All praise be to ALLAH SWT and blessing be upon His Prophet SAW whose<br />
ultimate guidance creates a more meaningful purpose to this work.<br />
I wish to express my sincere gratitude and appreciation to the people who have both<br />
directly and indirectly contributed to this thesis. The following are those to whom I<br />
am particularly indebted:<br />
My supervisors A.P. Dr. Abdull Rahim bin Hj. Mohd. Yusoff and Prof. Dr.<br />
Rahmalan Ahamad for their invaluable guidance, freedom of work and<br />
constant encouragement throughout the course of this work.<br />
School Of Health Sciences, USM, Health Campus, Kubang Krian Kelantan<br />
for awarding study leave together with scholarship in completing the work.<br />
Prof Baharuddin Saad from USM Penang, AP Dr. Razali Ismail from<br />
Chemistry Department, Faculty of Science, UTM and Prof Barek from<br />
Charles University, Prague, Czeck Republic for their useful discussion and<br />
suggestion. Also to Mr Radwan Ismail from Department of Chemistry,<br />
Penang Branch, Mrs Marpongahtun Misni and Mr Wan Kamaruzaman Wan<br />
Ahmad for their friendship, ideas and continuous support in carrying out this<br />
work. Also to Mr Mat Yasin bin Sirin, Mrs Ramlah binti Husin and Mr Azmi<br />
Mahmud for their assistance throughout the work.<br />
UTM for awarding Short Term Grant No: 75152 / 2004<br />
My mother, wife and all families for their encouragements, supports, patience,<br />
tolerance and understanding.<br />
iv
ABSTRACT<br />
Aflatoxin, which is produced by Aspergillus flavus and Aspergillus parasiticus<br />
fungi is one of the compounds in the mycotoxin group. The main types of aflatoxins<br />
are AFB1, AFB2, AFG1 and AFG2 which have carcinogenic properties and are<br />
dangerous to human health. Various techniques have been used for their measurements<br />
such as the high performance liquid chromatography (HPLC), enzyme linked<br />
immunosorbant assay (ELISA) and radioimmunoassay (RIA) but all these methods<br />
have disadvantages such as long analysis time, consume a lot of reagents and<br />
expensive. To overcome these problems, the voltammetric technique was proposed in<br />
this study using controlled growth mercury drop (CGME) as the working electrode and<br />
Britton Robinson buffer (BRB) as the supporting electrolyte. The voltammetric<br />
methods were used for investigating the electrochemical properties and the quantitative<br />
analysis of aflatoxins at the mercury electrode. The experimental conditions were<br />
optimised to obtain the best characterised peak in terms of peak height with analytical<br />
validation of the methods for each aflatoxin. The proposed methods were applied for<br />
the analysis of aflatoxins in groundnut samples and the results were compared with<br />
those obtained by the HPLC technique. All aflatoxins were found to adsorb and<br />
undergo irreversible reduction reaction at the working mercury electrode. The<br />
optimum experimental parameters for the differential pulse cathodic stripping<br />
voltammetry (DPCSV) method were the BRB at pH 9.0 as the supporting electrolyte,<br />
initial potential (Ei): -0.1 V, final potential (Ef): -1.4 V, accumulation potential (Eacc): -<br />
0.6 V, accumulation time (tacc): 80 s, scan rate: 50 mV/s and pulse amplitude: 80 mV.<br />
The optimum parameters for the square wave stripping voltammetry (SWSV) method<br />
were Ei = -0.1 V, Ef = -1.4 V, Eacc: -0.8 V, tacc: 100 s, scan rate: 3750 mV/s, frequency:<br />
125 Hz and voltage step: 30 V. At the concentration of 0.10 µM, using DPCSV<br />
method with the optimum parameters, AFB1, AFB2, AFG1 and AFG2 produced a<br />
single peak at -1.21 V, -1.23 V, -1.17 V and -1.15 V (versus Ag/AgCl) respectively.<br />
Using the SWSV method, a single peak appeared at -1.30 V for AFB1 and AFB2 while<br />
-1.22 V for AFG1 and AFG2. The calibration curves for all aflatoxins were linear with<br />
the limit of detection (LOD) of approximately 2.0 ppb and 0.50 ppb obtained by the<br />
DPCSV and SWSV methods respectively. The results of aflatoxins content in<br />
individual groundnut samples do not vary significantly when compared with those<br />
obtained by the HPLC technique. Finally, it can be concluded that both proposed<br />
methods which are accurate, precise, robust, rugged, fast and low cost were<br />
successfully developed and are potential alternative methods for routine analysis of<br />
aflatoxins in groundnut samples.<br />
v
ABSTRAK<br />
Aflatoksin adalah sejenis sebatian yang dihasilkan oleh kulat Aspergillus flavus<br />
dan Aspergillus parasiticus yang digolongkan di dalam kumpulan mikotoksin. Jenis<br />
utama aflatoksin adalah AFB1, AFB2, AFG1 dan AFG2 yang bersifat karsinogen serta<br />
merbahaya kepada kesihatan manusia. Pelbagai teknik telah digunakan untuk<br />
menentukan aflatoksin seperti kromatografi cecair prestasi tinggi (HPLC), asai serapan<br />
imuno berikatan enzim (ELISA) dan radioamunoasai (RIA) tetapi teknik-teknik ini<br />
mempunyai kelemahan seperti masa analisis yang panjang, melibatkan reagen yang<br />
banyak dan kos yang mahal. Untuk mengatasi masalah ini, teknik voltammetri telah<br />
dicadangkan untuk kajian aflatoksin menggunakan titisan raksa pembesaran terkawal<br />
(CGME) sebagai elektrod bekerja dan larutan penimbal Britton-Robinson (BRB)<br />
sebagai elektrolit penyokong. Pelbagai kaedah voltammetri telah digunakan untuk<br />
mengkaji sifat elektrokimia aflatoksin pada elektrod raksa dan analisis kuantitatifnya.<br />
Parameter kajian telah dioptimumkan untuk memperolehi puncak yang elok<br />
berdasarkan ketinggian puncak serta pengesahan analisis untuk kaedah yang<br />
dibangunkan bagi setiap aflatoksin. Kaedah ini telah digunakan untuk menentukan<br />
kandungan aflatoksin di dalam sampel kacang tanah di mana keputusan yang diperolehi<br />
telah dibandingkan dengan keputusan HPLC. Semua aflatoksin yang dikaji didapati<br />
terjerap dan menjalani proses tindakbalas penurunan tidak berbalik pada elektrod raksa.<br />
Parameter optimum untuk kaedah voltammetri perlucutan kathodik denyut pembeza<br />
(DPCSV) adalah larutan BRB pada pH 9.0 sebagai larutan elektrolit, keupayaan awal<br />
(Ei): -1.0 V, keupayaan akhir (Ef): -1.4 V, keupayaan pengumpulan (Eacc): -0.6 V, masa<br />
pengumpulan (tacc): 80 s, kadar imbasan: 50 mV/s dan amplitud denyut: 80 mV. Untuk<br />
kaedah voltammetri perlucutan gelombang bersegi (SWSV), parameter optimum adalah<br />
Ei : -1.0 V, Ef : -1.4 V, Eacc: -0.8 V, tacc: 100 s, kadar imbasan: 3750 mV/s, frekuensi:<br />
125 Hz dan beza keupayaan: 30 mV. Menggunakan parameter optimum untuk DPCSV,<br />
0.10 µM AFB1, AFB2, AFG1 dan AFG2 menghasilkan puncak tunggal pada<br />
keupayaan -1.21 V, -1.23 V, -1.17 V dan -1.15 V (melawan Ag/AgCl) masingmasingnya.<br />
Menggunakan kaedah SWSV, puncak terhasil pada -1.30 V untuk AFB1<br />
dan AFB2, -1.22 V untuk AFG1 dan AFG2. Keluk kalibrasi adalah linear untuk semua<br />
aflatoksin dengan had pengesanan (LOD) pada 2.0 dan 0.5 ppb diperolehi dari kaedah<br />
DPCSV dan SWSV masing-masingnya. Keputusan analisis kandungan aflatoksin di<br />
dalam sampel kacang tanah tidak memberi perbezaan ketara berbanding dengan yang<br />
diperolehi menggunakan teknik HPLC. Kesimpulannya, kedua-dua kaedah yang dikaji<br />
yang merupakan kaedah yang tepat, jitu, cepat, sesuai digunakan dengan pelbagai<br />
model voltammetri dan kos yang murah telah berjaya dibangunkan dan berpotensi besar<br />
menjadi kaedah alternatif untuk analisis kandungan aflatoksin di dalam kacang tanah<br />
secara berkala.<br />
vi
TABLE OF CONTENTS<br />
CHAPTER TITLE PAGE<br />
TITLE i<br />
DECLARATION ii<br />
DEDICATION iii<br />
ACKNOWLEDGEMENT iv<br />
ABSTRACT v<br />
ABSTRAK vi<br />
TABLE OF CONTENTS vii<br />
LIST OF TABLES xiii<br />
LIST OF FIGURES xvi<br />
ABBREVATIONS xxix<br />
LIST OF APPENDICES xxxiii<br />
1 LITERATURE REVIEW 1<br />
1.1 Overview 1<br />
1.2 Aflatoxins 3<br />
1.2.1 Aflatoxins in general 3<br />
1.2.2 Chemistry of aflatoxins 5<br />
1.2.3 Health aspects of aflatoxins 12<br />
1.2.4 Analytical methods for the determination of<br />
aflatoxins<br />
16<br />
1.2.5 Electrochemical properties of aflatoxins 28<br />
1.3. Voltammetric technique 30<br />
1.3.1 Voltammetric techniques in general 30<br />
vii
1.3.2 Voltammetric measurement 31<br />
1.3.2.1 Instrumentation 31<br />
1.3.2.2 Solvent and supporting electrolyte 44<br />
1.3.2.3 Current in voltammetry 46<br />
1.3.2.4 Quantitative and quantitative aspects of<br />
voltammetry<br />
48<br />
1.3.3 Type of voltammetric techniques 49<br />
1.3.3.1 Polarography 49<br />
1.3.3.2 Cyclic voltammetry 51<br />
1.3.3.3 Stripping voltammetry 54<br />
1.3.3.3a Anodic stripping voltammetry 56<br />
1.3.3.3b Cathodic stripping voltammetry 57<br />
1.3.3.3c Adsorptive stripping voltammetry 58<br />
1.3.3.4 Pulse voltammetry 59<br />
1.3.3.4a Differential pulse voltammetry 60<br />
1.3.3.4b Square wave voltammetry 61<br />
1.4 Objective and scope of study 64<br />
1.4.1 Objective of study 64<br />
1.4.2 Scope of study 67<br />
2 RESEARCH METHODOLOGY 70<br />
2.1 Apparatus, material and reagents 70<br />
2.1.1 Apparatus 70<br />
2.1.2 Materials 72<br />
2.1.2.1 Aflatoxin stock and standard solutions 72<br />
2.1.2.2 Real samples 73<br />
2.1.3 Reagents 73<br />
2.1.3.1 Britton Robinson buffer, 0.04 M 73<br />
2.1.3.2 Carbonate buffer, 0.04 M 74<br />
2.1.3.3 Phosphate buffer, 0.04 M 74<br />
viii
2.1.3.4 Ascorbic acid 74<br />
2.1.3.5 β-cyclodextrin solution, 1.0 mM 75<br />
2.1.3.6 L-Cysteine, 1.0 x 10 -5 M 75<br />
2.1.3.7 2,4-dihydrofuran, 0.15 M 75<br />
2.1.3.8 Coumarin, 3.0 x 10 -2 M 75<br />
2.1.3.9 Poly-L-lysine, 10 ppm 75<br />
2.1.3.10 Standard aluminium (II) solution, 1.0 mM 75<br />
2.1.3.11 Standard plumbum(II) solution, 1.0 mM 76<br />
2.1.3.12 Standard zinc (II) solution, 1.0 mM 76<br />
2.1.3.13 Standard copper (II) solution, 1.0 mM 76<br />
2.1.3.14 Standard nickel (II) solution, 1.0 mM 76<br />
2.1.3.15 Methanol: 0.1 N HCl solution, 95% 76<br />
2.1.3.16 Zinc sulphate solution, 15% 76<br />
2.2 Analytical Technique 77<br />
2.2.1 General procedure for voltammetric analysis 77<br />
2.2.2 Cyclic voltammetry (Anodic and cathodic<br />
directions)<br />
77<br />
2.2.2.1 Standard addition of sample 77<br />
2.2.2.2 Repetitive cyclic voltammetry 78<br />
2.2.2.3 Effect of scan rate 78<br />
2.2.3 Differential pulse cathodic stripping<br />
voltammetric determination of AFB2<br />
78<br />
2.2.3.1 Effect of pH 79<br />
2.2.3.2 Method optimisation for the determination 79<br />
of AFB2<br />
2.2.3.2a Effect of scan rate 79<br />
2.2.3.2b Effect of accumulation potential 80<br />
2.2.3.2c Effect of accumulation time 80<br />
2.2.3.2d Effect of initial potential 80<br />
2.2.3.2e Effect of pulse amplitude 80<br />
ix
2.2.3.3 Method validation 80<br />
2.2.3.4 Interference studies 81<br />
2.2.3.4a Effect of Cu(II), Ni (II), Al(III), 81<br />
Pb(II) and Zn(II)<br />
2.2.3.4b Effect of ascorbic acid, 82<br />
β-cyclodextrin and L-cysteine<br />
2.2.3.5 Modified mercury electrode with PLL 82<br />
2.2.4 Square wave cathodic stripping voltammetry<br />
(SWSV)<br />
82<br />
2.2.4.1 SWSV parameters optimisation 82<br />
2.2.4.2 SWSV determination of all aflatoxins 82<br />
2.2.5 Stability studies of aflatoxins 83<br />
2.2.5.1 Stability of 10 ppm aflatoxins 83<br />
2.2.5.2 Stability of 1 ppm aflatoxins 83<br />
2.2.5.3 Stability of 0.1 µM aflatoxins exposed<br />
to ambient temperature<br />
83<br />
2.2.5.4 Stability of 0.1 µM aflatoxins in different<br />
pH of BRB<br />
84<br />
2.2.6 Application to food samples 84<br />
2.2.6.1 Technique 1 84<br />
2.2.6.2 Technique 2 84<br />
2.2.6.3 Technique 3 85<br />
2.2.6.4 Blank measurement 85<br />
2.2.6.5 Recovery studies 85<br />
2.2.6.6 Voltammetric analysis 86<br />
3 RESULTS AND DISCUSSION 88<br />
3.1 Cyclic voltammetric studies of aflatoxins 88<br />
3.1.1 Cathodic and anodic cyclic voltammetric<br />
of aflatoxins<br />
89<br />
x
3.2 Differential pulse cathodic stripping voltammetry<br />
of AFB2<br />
102<br />
3.2.1 Optimisation of conditions for the stripping 104<br />
analysis<br />
3.2.1.1 Effect of pH and type of supporting 104<br />
electrolyte<br />
3.2.1.2 Optmisation of instrumental conditions 117<br />
3.2.1.2a Effect of scan rate 118<br />
3.2.1.2b Effect of accumulation time 119<br />
3.2.1.2c Effect of accumulation<br />
potential<br />
120<br />
3.2.1.2d Effect of initial potential 121<br />
3.2.1.2e Effect of pulse amplitude 122<br />
3.2.2 Analysis of aflatoxins 127<br />
3.2.2.1 Calibration curves of aflatoxins and<br />
validation of the proposed method<br />
129<br />
3.2.2.1a Calibration curve of AFB2 129<br />
3.2.2.1b Calibration curve of AFB1 134<br />
3.2.2.1c Calibration curve of AFG1 137<br />
3.2.2.1d Calibration curve of AFG2 140<br />
3.2.2.2 Determination of limit of detection 143<br />
3.2.2.3 Determination of limit of quantification 147<br />
3.2.2.4 Inteference studies 150<br />
3.3 Square-wave stripping voltammetry (SWSV) of<br />
aflatoxins<br />
157<br />
3.3.1 SWSV determination of AFB2 158<br />
3.3.1.1 Optimisation of experimental and 159<br />
instrumental SWSV parameters<br />
3.3.3.1a Influence of pH of BRB 159<br />
3.3.3.1b Effect of instrumental<br />
variables<br />
160<br />
xi
3.3.2 SWSV determination of other aflatoxins 166<br />
3.3.3 Calibration curves and method validation 168<br />
3.4 Stability studies of aflatoxins 175<br />
3.4.1 10 ppm aflatoxin stock solutions 175<br />
3.4.2 1 ppm aflatoxins in BRB at pH 9.0 179<br />
3.4.2.1 Month to month stability studies 179<br />
3.4.2.2 Hour to hour stability studies 181<br />
3.4.2.3 Stability studies in different pH<br />
of BRB<br />
186<br />
3.4.2.4 Stability studies in 1.0 M HCl and<br />
1.0 M NaOH<br />
191<br />
3.5 Voltammetric analysis of aflatoxins in real samples 192<br />
3.5.1 Study on the extraction techniques 193<br />
3.5.2 Analysis of blank 194<br />
3.5.3 Recovery studies of aflatoxins in real samples 196<br />
3.5.4 Analysis of aflatoxins in real samples 199<br />
4 CONCLUSIONS AND RECOMMENDATIONS 204<br />
4.1 Conclusions 204<br />
4.2 Recommendations 206<br />
REFERENCES 208<br />
Appendices A – AM 255 - 317<br />
xii
LIST OF TABLES<br />
TABLE NO. TITLE PAGE<br />
1.0 Scientific name for aflatoxin compounds 7<br />
1.1 Chemical and physical properties of aflatoxin 10<br />
compounds<br />
1.2 Summary of analysis methods used for 19<br />
determination of aflatoxins in various samples<br />
1.3 Working electrode and limit of detection for 32<br />
modern polarographic and voltammetric<br />
techniques.<br />
1.4 The application range of various analytical 33<br />
techniques and their concentration limits when<br />
compared with the requirements in different<br />
fields of chemical analysis<br />
1.5 List of different type of working electrodes and 36<br />
its potential windows<br />
1.6 Electroreducible and electrooxidisable organic 50<br />
functional groups<br />
1.7 The characteristics of different type of 53<br />
electrochemical reaction.<br />
1.8 Application of Square Wave Voltammetry 62<br />
technique<br />
2.0 List of aflatoxins and their batch numbers 72<br />
used in this experiment<br />
2.1 Injected volume of aflatoxins into eluate of 86<br />
groundnut and the final concentrations obtained<br />
in voltammetric cell<br />
3.0 The dependence of current peaks of aflatoxins to 97<br />
their concentrations obtained by cathodic cyclic<br />
measurements in BRB at 9.0.<br />
xiii
3.1 Effect of buffer constituents on the peak height 109<br />
of 2.0 µM AFB2 at pH 9.0. Experimental<br />
conditions are the same as Figure 3.21<br />
3.2 Compounds reduced at the mercury electrode 116<br />
3.3 Optimum parameters for 0.06 µM and 2.0 µM 126<br />
AFB2 in BRB at pH 9.0.<br />
3.4 The peak height and peak potential of aflatoxins 127<br />
obtained by optimised parameters in BRB at<br />
pH 9.0 using DPCSV technique.<br />
3.5 Peak height (in nA) obtained for intra-day and 131<br />
inter-day precision studies of 0.10 µM and 0.20<br />
µM by the proposed voltammetric procedure (n=8).<br />
3.6 Mean values for recovery of AFB2 standard 132<br />
solution (n=3).<br />
3.7 Influence of small variation in some of the 133<br />
assay condition of the proposed procedure on its<br />
suitability and sensitivity using 0.10 µM AFB2.<br />
3.8 Results of ruggedness test for proposed method 134<br />
using 0.10 µM AFB2.<br />
3.9 Peak height (in nA) obtained for intra-day and 136<br />
inter-day precision studies of 0.10 µM and 0.20<br />
µM AFB1 by proposed voltammetric procedure<br />
(n=5).<br />
3.10 Mean values for recovery of AFB1 standard 137<br />
solution (n=3).<br />
3.11 Peak height (in nA) obtained for intra-day and 139<br />
inter-day precision studies of 0.10 µM and 0.20<br />
µM AFG1 by proposed voltammetric procedure<br />
(n=5).<br />
3.12 Mean values for recovery of AFG1 standard 139<br />
solution (n=3).<br />
3.13 Peak height (in nA) obtained for intra-day and 141<br />
inter-day precision studies of 0.10 µM and 0.20<br />
µM AFG2 by proposed voltammetric procedure.<br />
xiv
3.14 Mean values for recovery of AFG2 standard 142<br />
solution (n=5).<br />
3.15 Peak height and peak potential of 0.10 µM 143<br />
aflatoxins obtained by BAS and Metrohm<br />
voltammetry analysers under optimised<br />
operational parameters for DPCSV method.<br />
3.16 Analytical parameters for calibration curves 145<br />
for AFB1,AFB2, AFG1 and AFG2 obtained by<br />
DPCSV technique using BRB at pH 9.0 as the<br />
supporting electrolyte.<br />
3.17 LOD values for determination of aflatoxins 148<br />
obtained by various methods.<br />
3.18 LOQ values for determination of aflatoxins 149<br />
obtained by various methods.<br />
3.19 Peak current and peak potential for all aflatoxins 167<br />
obtained by SWSV in BRB at pH 9.0 (n=5).<br />
3.20 Analytical parameters for calibration curves for 172<br />
AFB1, AFB2, AFG1 and AFG2 obtained by<br />
SWSV technique in BRB pH 9.0 as the<br />
supporting electrolyte.<br />
3.21 Result of reproducibility study (intra-day and inter- 173<br />
day measurements) for 0.1 µM aflatoxins in<br />
BRB at pH 9.0 obtained by SWSV method.<br />
3.22 Application of the proposed method in evaluation 174<br />
of the SWSV method by spiking the aflatoxin<br />
standard solutions.<br />
3.23 Average concentration of all aflatoxins within a 175<br />
year stability studies.<br />
3.24 The peak current and peak potential of 10 ppb 196<br />
AFB2 in presence and absence of a blank sample.<br />
3.25 Total aflatoxin contents in real samples which 203<br />
were obtained by DPCSV and HPLC<br />
techniques (average of duplicate analysis)<br />
xv
LIST OF FIGURES<br />
FIGURE NO. TITLE PAGE<br />
1.0 Aspergillus flavus seen under an electron 4<br />
microscope.<br />
1.1 Chemical structure of coumarin 6<br />
1.2 Chemical structures of (a) AFB1, (b) AFB2, 8<br />
(c) AFG1, (d) AFG2, (e) AFM1 and (f) AFM2<br />
1.3 Hydration of (a) AFB1 and (b) AFG1 by TFA 9<br />
produces (c) AFB2a and (d) AFG2a<br />
1.4 Transformation of toxic (a) AFB1 to non-toxic 11<br />
(b) aflatoxicol A.<br />
1.5 Major DNA adducts of AFB1; (a) 8,9-Dihydro-8- 13<br />
(N 7 -guanyl)-9-hydroxy-aflatoxin B1 (AFB1-Gua)<br />
and (b) 8,9-Dihydro-8-(N 5 -Formyl-2 ’ .5 ’ .6 ’ -<br />
triamino-4 ’ -oxo-N 5 -pyrimidyl)-9-hydroxy-Aflatoxin<br />
B1 (AFB1-triamino-Py)<br />
1.6 Metabolic pathways of AFB1 by cytochrom P-450 14<br />
enzymes; B1-epoxide = AFB1 epoxide, M1=<br />
aflatoxin M1, P1= aflatoxin P1 and Q1 = aflatoxin<br />
Q1.<br />
1.7 A typical arrangement for a voltammetric 34<br />
electrochemical cell (RE: reference electrode,<br />
WE: working electrode. AE: auxiliary electrode)<br />
1.8 A diagram of the Hanging Mercury Drop Electrode 37<br />
(HMDE)<br />
1.9 A diagram of the Controlled Growth Mercury 38<br />
Electrode (CGME)<br />
1.10 Cyclic voltammograms of (a) reversible, 52<br />
(b) irriversible and (c) quasireversible reaction at<br />
mercury electrode (O = oxidised form and R = reduced<br />
form)<br />
xvi
1.11 The potential-time sequence in stripping analysis 55<br />
1.12 Schematic drawing showing the Faradaic current 59<br />
and charging current versus pulse time course<br />
1.13 Schematic drawing of steps in DPV by 60<br />
superimposing a periodic pulse on a linear scan<br />
1.14 Waveform for square-wave voltammetry 61<br />
2.0 BAS CGME stand (a) which is connected to 71<br />
CV-50W voltammetric analyser and interface<br />
with computer (b) for data processing<br />
2.1 VA757 Computrace Metrohm voltammetric 71<br />
analyser with 663 VA stand (consists of Multi<br />
Mode (MME))<br />
3.0 Cathodic peak current of 0.6 µM AFB1 in various 89<br />
pH of BRB obtained in cathodic cyclic voltammetry.<br />
Ei = 0, Elow = -1.5 V, Ehigh = 0 and scan rate = 200<br />
mV/s)<br />
3.1 Shifting of peak potential of AFB1 with increasing 90<br />
pH of BRB. Parameter conditions are the same<br />
as in Figure 3.0.<br />
3.2 Mechanism of reduction of AFB1 in BRB at pH 6.0 90<br />
to 8.0.<br />
3.3 Mechanism of reduction of AFB1 in BRB at pH 9.0 91<br />
to 11.0.<br />
3.4 Cathodic cyclic voltammogram for 1.3 µM AFB1 92<br />
obtained at scan rate of 200 mV/s, Ei = 0, Elow =<br />
-1.5 V and Ehigh = 0 in BRB solution at pH 9.0.<br />
3.5 Cathodic cyclic voltammogram for 1.3 µM AFB2 92<br />
in BRB solution at pH 9.0. All parameter conditions<br />
are the same as in Figure 3.4.<br />
3.6 Cathodic cyclic voltammogram for 1.3 µM AFG1 93<br />
in BRB solution at pH 9.0. All parameter conditions<br />
are the same as in Figure 3.4.<br />
xvii
3.7 Cathodic cyclic voltammogram for 1.3 µM AFG2 93<br />
in BRB solution at pH 9.0. All parameter conditions<br />
are the same as in Figure 3.4.<br />
3.8 Effect of Ei to the Ip of 0.6 µM AFB1 in BRB at pH 94<br />
9.0 obtained by cathodic cyclic voltammetry. All<br />
parameter conditions are the same as in Figure 3.4.<br />
3.9 Effect of Ei to the Ip of 0.1 µM Zn 2+ in BRB at pH 94<br />
9.0 obtained by cathodic cyclic voltammetry. All<br />
parameter conditions are the same as in Figure 3.4.<br />
3.10 Anodic cyclic voltammogram of 1.3 µM AFB2 95<br />
obtained at scan rate of 200 mV/s, Ei = -1.5 V,<br />
Elow = -1.5 V and Ehigh = 0 in BRB at pH 9.0.<br />
3.11 Effect of increasing AFB2 concentration on the 96<br />
peak height of cathodic cyclic voltammetrc curve<br />
in BRB at pH = 9.0. (1.30 µM, 2.0 µM, 2.70 µM<br />
and 3.40 µM). All parameter conditions are the<br />
same as in Figure 3.4.<br />
3.12 Peak height of reduction peak of AFB2 with 96<br />
increasing concentration of AFB2. All parameter<br />
conditions are the same as in Figure 3.4.<br />
3.13 Repetitive cathodic cyclic voltammograms of 1.3 98<br />
µM AFB2 in BRB solution at pH 9.0. All<br />
experimental conditions are the same as in Figure 3.4.<br />
3.14 Increasing Ip of 1.3 µM AFB2 cathodic peak 98<br />
obtained from repetitive cyclic voltammetry. All<br />
experimental conditions are the same as in Figure 3.4.<br />
3.15 Peak potential of 1.3 µM AFB2 with increasing 99<br />
number of cycle obtained by repetitive cyclic<br />
voltammetry.<br />
xviii
3.16 Plot of log Ip versus log υ for 1.3 µM AFB2 in 100<br />
BRB solution at pH 9.0. All experimental conditions<br />
are the same as in Figure 3.4.<br />
3.17 Plot of Ep versus log υ for 1.3 µM AFB2 in BRB 101<br />
solution at pH 9.0.<br />
3.18 Plot of Ip versus υ for 1.3 µM AFB2 in BRB 102<br />
solution at pH 9.0. All parameter conditions<br />
are the same as in Figure 3.4.<br />
3.19 DPCS voltammograms of 1.0 µM AFB2 (Peak I) 103<br />
in BRB at pH 9.0 (a) at tacc = 0 and 30 s. Other<br />
parameter conditions; Ei = 0, Ef = -1.50 V,<br />
Eacc = 0, υ =50 mV/s and pulse amplitude =<br />
100 mV. Peak II is the Zn peak.<br />
3.20 DPCS voltammograms of 2.0 µM AFB2 in BRB 104<br />
in BRB (Peak I) at different pH values; 6.0, 7.0,<br />
8.0, 9.0, 11.0and 13.0. Other parameter conditions;<br />
Ei = 0, Ef =-1.50 V, Eacc = 0, υ = 50 mV/s and pulse<br />
amplitude =100 mV. Peak II is the Zn peak.<br />
3.21 Dependence of the Ip for AFB2 on the pH of 105<br />
0.04 M BRB solution. AFB2 concentration:<br />
2.0 µM, Ei =0, Ef = -1.5 V, Eacc = 0, tacc = 30 sec,<br />
υ = 50 mV/s and pulse amplitude = 100 mV.<br />
3.22 Ip of 2.0 µM AFB2 obtained in BRB (a) at pH 106<br />
from 9.0 decreases to 4.0 and re-increase to 9.0 and<br />
(b) at pH from 9.0 increase to 13.0 and re-decrease<br />
to 9.0.<br />
3.23 UV-VIS spectrums of 1 ppm AFB2 in BRB at 107<br />
pH (a) 6.0, (b) 9.0 and (c) 13.0.<br />
3.24 Opening of lactone ring by strong alkali caused no 108<br />
peak to be observed for AFB2 in BRB at pH 13.0.<br />
3.25 Ip of 2.0 µM AFB2 in different concentration of 109<br />
BRB at pH 9.0. Experimental conditions are<br />
the same as in Figure 3.20.<br />
3.26 Ip of 2.0 µM AFB2 in different pH and concentrations 110<br />
of BRB.<br />
xix
3.27 DPCS voltammograms of 2.0 AFB2 (Peak I) 110<br />
in (a) 0.04 M, (b) 0.08 M and (c) 0.08 M BRB<br />
at pH 9.0 as the blank. Ei = 0 V, Ef = -1.5 V,<br />
Eacc = 0 V, tacc = 30 sec, υ = 50mV/s and pulse<br />
amplitude = 100 mV. Peak II is the Zn peak.<br />
3.28 Chemical structures of (a) 2,3-dihydrofuran, 111<br />
(b) tetrahydrofuran and (c) coumarin.<br />
3.29 Voltammograms of 2,3-dihydrifuran (peak I) for 112<br />
concentrations from (b) 0.02 to 0.2 µM in (a)<br />
BRB at pH 9.0.<br />
3.30 Dependence of Ip of coumarin to its concentrations 112<br />
3.31 Voltammograms of coumarin at concentration of 113<br />
(b) 34 µM, (c) 68 µM, (d) 102 µM, (e) 136 µM<br />
and (f) 170 µM in (a) BRB at pH 9.0.<br />
3.32 Chemical structures of (a) cortisone and (b) 114<br />
testosterone.<br />
3.33 Chemical structures of (a) digoxin and (b) digitoxin 115<br />
3.34 Effect of pH of BRB solution on the Ep for AFB2. 117<br />
AFB2 concentration: 2.0 µM. Ei = 0, Ef = -1.5 V,<br />
Eacc = 0, tacc = 30 s and υ = 50 mV/s.<br />
3.35 Effect of various υ to the (a) Ip and (b) Ep of 2.0 µM 118<br />
AFB2 peak in BRB at pH 9.0. Ei = 0, Ef = 1.50 V,<br />
Eacc = 0, tacc = 15 s and pulse amplitude = 100 mV.<br />
3.36 Effect of tacc on (a) Ip and (b) Ep of 2.0 µM AFB2 119<br />
peak in BRB at pH 9.0. Ei = 0, Ef = 1.50 V, Eacc = 0,<br />
υ = 40 mV/s and pulse amplitude = 100 mV.<br />
3.37 The relationship between (a) Ip and (b) Ep with 120<br />
Eacc for 2.0 µM AFB2 in BRB at pH 9.0.<br />
Ei = 0, Ef = -1.5 V, tacc = 15 s, υ = 40 mV/s and<br />
pulse amplitude = 100 mV.<br />
3.38 Effect of Ei on (a) Ip and (b) Ep of 2.0 µM AFB2 121<br />
in BRB at pH 9.0. Ef = 1.50 V, Eacc = -0.80 V,<br />
tacc = 40 s,υ = 40 mV/s and pulse amplitude =<br />
100 mV.<br />
xx
3.39 Effect of pulse amplitude on (a) Ip and (b) Ep 122<br />
of 2.0 µM AFB2 in BRB at pH 9.0. Ei = -1.0 V,<br />
Ef = 1.50 V, Eacc = -0.80 V, tacc = 40 s and υ =<br />
40 mV/s.<br />
3.40 Effect of Eacc on Ip of 0.06 µM AFB2. Ei = -1.0 V, 123<br />
Ef = -1.50 V, tacc = 40 s, υ = 40 mV/s and pulse<br />
amplitude = 100 mV.<br />
3.41 Effect of tacc on (a) Ip and (b) Ep of 0.06 µM AFB2 124<br />
in BRB at pH 9.0. Ei = -1.0 V, Ef = -1.50 V, Eacc =<br />
-0.6 V, υ = 40 mV/s and pulse amplitude = 100 mV.<br />
3.42 The effect υ on (a) Ip and (b) Ep of 0.06 µM AFB2 125<br />
In BRB at pH 9.0. Ei = -1.0 V, Ef = -1.50 V, Eacc =<br />
-0.6 V, tacc = 80 s and pulse amplitude = 100 mV.<br />
3.43 Voltammograms of 0.06 µM AFB2 obtained under 126<br />
(a) optimised and (b) unoptimised parameters in BRB<br />
at pH 9.0.<br />
3.44 Voltammograms of 0.1 µM (a) AFB1, (b) AFG1, 128<br />
(c) AFB2 and (d) AFG2 in BRB at pH 9.0. Ei = 1.0<br />
(except for AFG1 = -0.95 V), Ef = -1.4 V, Eacc = -0.6 V,<br />
tacc = 80 s, υ = 50 mV/s and pulse amplitude = 80 mV.<br />
3.45 Voltammograms of (b) mixed aflatoxins in (a) BRB at 129<br />
pH 9.0 as the blank. Parameters condition: Ei = -0.95 V,<br />
Ef = -1.4 V, Eacc = -0.6 V, tacc = 80 s, υ = 50 mV/s and<br />
Pulse amplitude = 80 mV.<br />
3.46 Increasing concentration of AFB2 in BRB at pH 9.0. 130<br />
The parameter conditions: Ei = -1.0 V, Ef = -1.4 V,<br />
Eacc =-0.6 V, tacc = 80 s, υ = 50 mV/s and<br />
pulse amplitude = 80 mV.<br />
3.47 Linear plot of Ip versus concentration of AFB2 130<br />
in BRB at pH 9.0. The parameter conditions are<br />
the same as in Figure 3.46.<br />
3.48 Standard addition of AFB1 in BRB at pH 9.0. 135<br />
The parameter conditions: Ei = -1.0 V, Ef = -1.4 V,<br />
Eacc =-0.8 V, tacc = 80 s, υ = 50 mV/s and<br />
pulse amplitude = 80 mV.<br />
xxi
3.49 Linear plot of Ip versus concentration of AFB1 135<br />
in BRB at pH 9.0. The parameter conditions are<br />
the same as in Figure 3.48.<br />
3.50 Effect of concentration to Ip of AFG1 in BRB at 138<br />
pH 9.0. Ei = -0.95 V, Ef = -1.40 V, Eacc =-0.8 V,<br />
tacc = 80 s, υ = 50 mV/s and pulse amplitude = 80 mV.<br />
3.51 Linear plot of Ip versus concentration of AFG1 138<br />
in BRB at pH 9.0. The parameter conditions are<br />
the same as in Figure 3.50.<br />
3.52 Effect of concentration to Ip of AFG2 in BRB at 140<br />
pH 9.0. Ei = -1.0 V, Ef = -1.40 V, Eacc =-0.8 V,<br />
tacc = 80 s, υ = 50 mV/s and pulse amplitude = 80 mV.<br />
3.53 Linear plot of Ip versus concentration of AFG2 141<br />
in BRB at pH 9.0. The parameter conditions are<br />
the same as in Figure 3.52.<br />
3.54 Voltammograms of 0.1 µM (a) AFB1, (b) AFB2, 144<br />
(c) AFG1 and (d) AFG2 in BRB at pH 9.0<br />
(d) obtained by 747 VA Metrohm. Ei = -1.0 V (except<br />
for AFG1 = -0.95 V), Ef = -1.4 V, Eacc = -0.6 V,<br />
tacc = 80 s, υ = 50 mV/s and pulse amplitude = 80 mV.<br />
3.55 Ip of all aflatoxins with increasing concentration of 150<br />
Zn 2+ up to 1.0 µM.<br />
3.56 Voltammograms of (i) 0.1µM AFB2 and (ii) AFB2-Zn 151<br />
complex with increasing concentration of Zn 2+ (a = 0,<br />
b = 0.75 µM, c = 1.50 µM, d = 2.25 µM and e = 3.0 µM).<br />
Blank = BRB at pH 9.0. Experimental conditions;<br />
Ei = -1.0 V, Ef = -1.40 V, Eacc = -0.6 V, tacc = 80 s,<br />
υ = 50 mV/s and pulse amplitude = 80 mV.<br />
3.57 Ip of all aflatoxins after reacting with increasing 151<br />
concentration of Zn 2+ in BRB at pH 3.0.<br />
Measurements were made in BRB at pH 9.0 within<br />
15 minutes of reaction time. Ei = -1.0 V (except<br />
for AFG1 = -0.95 V), Ef = -1.40 V, Eacc = -0.6 V,<br />
tacc = 80 s, υ = 50 mV/s and pulse amplitude = 80 mV.<br />
xxii
3.58 Absorbance of all aflatoxins with increasing 152<br />
concentration of Zn 2+ in BRB at pH 3.0 within 15<br />
minutes of reaction time<br />
3.59 Voltammograms of 0.1µM AFB2 with increasing 153<br />
concentration of Zn 2+ (from 0.10 to 0.50 µM) in<br />
BRB at pH 9.0. Ei = -0.25 V, Ef = -1.4 V, Eacc =<br />
-0.6 V, tacc = 80 s, υ = 50 mV/s and pulse amplirude =<br />
80 mV. .<br />
3.60 Chemical structure of ascorbic acid. 153<br />
3.61 Ip of all aflatoxins with increasing concentration 154<br />
of ascorbic acid up to 1.0 µM. Concentrations of<br />
all aflatoxins are 0.1µM.<br />
3.62 Voltammograms of 0.1µM AFB2 with increasing 154<br />
concentration of ascorbic acid.<br />
3.63 Ip of all aflatoxins with increasing concentration 155<br />
of β-cyclodextrin up to 1.0 µM.<br />
3.64 Voltammograms of 0.1µM AFB2 with increasing 156<br />
concentration of β-cyclodextrin.<br />
3.65 Chemical structure of L-cysteine. 156<br />
3.66 Ip of all aflatoxins with increasing concentration 157<br />
of cysteine up to 1.0 µM.<br />
3.67 Voltammograms of 0.1 µM AFB2 obtained by 158<br />
(a) DPCSV and (b) SWSV techniques in BRB at<br />
pH 9.0. Parameters for DPCSV: Ei = -1.0 V, Ef =<br />
-1.40V, Eacc = -0.6 V, tacc = 80 s, υ = 50 mV/s and<br />
pulse amplitude = 80 mV and for SWSV: Ei = -1.0 V,<br />
Ef = -1.40V, Eacc = -0.6 V, tacc = 80 s, frequency =<br />
50 Hz, voltage step = 0.02 V, amplitude = 80 mV<br />
and υ = 1000 mV/s.<br />
3.68 Influence of pH of BRB on the Ip of 0.10 µM 159<br />
AFB2 using SWSV technique. The instrumental<br />
Parameters are the same as in Figure 3.67.<br />
3.69 Voltammograms of 0.1 µM AFB2 in different pH 160<br />
of BRB. Parameter conditions: Ei = -1.0 V, Ef =<br />
-1.40 V, Eacc = -0.6 V, tacc = 80 s, voltage step =<br />
xxiii
0.02 V, amplitude = 50 mV, frequency = 50 Hz<br />
and υ = 1000 mV/s.<br />
3.70 Effect of Ei to the Ip of 0.10 µM AFB2 in BRB at 160<br />
pH 9.0.<br />
3.71 Effect of Eaccto the Ip of 0.10 µM AFB2 in BRB at 161<br />
pH 9.0.<br />
3.72 Relationship between Ip of 0.10 µM AFB2 while 162<br />
increasing tacc.<br />
3.73 Effect of frequency to the Ip of 0.10 µM AFB2 in 162<br />
BRB at pH 9.0.<br />
3.74 Linear relatioship between Ip of AFB2 and square 163<br />
root of frequency.<br />
3.75 Influence of square-wave voltage step to Ip of 163<br />
0.10 µM AFB2.<br />
3.76 Influence of square-wave amplitude to Ip of 0.10 µM 164<br />
AFB2.<br />
3.77 Relationship of SWSV Ep of AFB2 with increasing 164<br />
amplitude.<br />
3.78 Ip of 0.10 µM AFB2 obtained under (a) non-optimised 165<br />
and (b) optimised SWSV parameters compared with<br />
that obtained under (c) optimised DPCSV parameters.<br />
3.79 Voltammograms of 0.10 µM AFB2 obtained under 166<br />
(a) non-optimised and (b) optimised SWSV<br />
parameters compared with that obtained under (c)<br />
optimised DPCSV parameters.<br />
3.80 Ip of 0.10 µM aflatoxins obtained using two 167<br />
different stripping voltammetric techniques under<br />
their optimum paramter conditions in BRB at pH 9.0.<br />
3.81 Voltammograms of (i) AFB1, (ii) AFB2, (iii) AFG1 168<br />
and (iV) AFG2 obtained by (b) DPCSV compared<br />
with that obtained by (c) SWSV in (a) BRB at pH 9.0.<br />
3.82 SWSV voltammograms for different concentrations 169<br />
of AFB1 in BRB at pH 9.0. The broken line<br />
xxiv
epresents the blank: (a) 0.01 µM, (b) 0.025 µM,<br />
(c) 0.05 µM, (d) 0.075 µM, (e) 0.10 µM, (f) 0.125<br />
µM and (g) 0.150 µM. Parameter conditions:<br />
Ei = -1.0 V, Ef = -1.4 V, Eacc = -0.8 V, tacc = 100 s,<br />
frequency = 125 Hz, voltage step = 0.03 V, pulse<br />
amplitude = 75 mV and scan rate = 3750 mV/s.<br />
3.83 Calibration curve for AFB1 obtained by SWSV 170<br />
method.<br />
3.84 Calibration curve for AFB2 obtained by SWSV 170<br />
method.<br />
3.85 Calibration curve for AFG1 obtained by SWSV 170<br />
method.<br />
3.86 Calibration curve for AFG2 obtained by SWSV 171<br />
method.<br />
3.87 LOD for determination of aflatoxins obtained by 171<br />
two different stripping methods.<br />
3.88 UV-VIS spectrums of 10 ppm of all aflatoxins in 176<br />
benzene: acetonitrile (98%) at preparation date.<br />
3.89 UV-VIS spectrums of 10 ppm of all aflatoxins in 176<br />
benzene: acetonitrile (98%) after 6 months of<br />
storage time.<br />
3.90 UV-VIS spectrums of 10 ppm of all aflatoxins in 177<br />
benzene: acetonitrile (98%) after 12 months of<br />
storage time.<br />
3.91 UV-VIS spectrums of 10 ppm AFB1 (a) kept in 178<br />
the cool and dark conditions and (b) exposed to<br />
ambient conditions for 3 days.<br />
3.92 UV-VIS spectrums of 1 ppm AFB1 in BRB 178<br />
solution prepared from (a) good and (b) damaged<br />
10 ppm AFB1 stock solution.<br />
3.93 UV-VIS spectrums of 1 ppm AFB1 in BRB 179<br />
solution prepared from (a) good and (b) damaged<br />
10 ppm AFB1 stock solution after 2 week stored in<br />
the cool and dark conditions.<br />
xxv
3.94 Percentage of Ip of 0.10 µM aflatoxins in BRB at pH 180<br />
9.0 at different storage time in the cool and dark<br />
conditions.<br />
3.95 Percentage of Ip of all aflatoxins in BRB at pH 9.0 181<br />
exposed to ambient conditions up to 8 hours of<br />
exposure time.<br />
3.96 Reaction of 8,9 double bond furan rings in AFB1 182<br />
with TFA, iodine and bromine under special<br />
conditions (Kok, et al., 1986).<br />
3.97 Voltammograms of 0.10 µM AFB1 obtained in (a) 183<br />
BRB at pH 9.0 which were prepared from (b)<br />
damaged and (c) fresh stock solutions.<br />
3.98 Ip of 0.10 µM AFB1 obtained in BRB at pH 9.0 184<br />
from 0 to 8 hours in (a) light exposed and (b)<br />
light protected.<br />
3.99 Ip of 0.10 µM AFB2 obtained in BRB at pH 9.0 184<br />
from 0 to 8 hours in (a) light exposed and (b)<br />
light protected.<br />
3.100 Ip of 0.10 µM AFG1 obtained in BRB at pH 9.0 185<br />
from 0 to 8 hours in (a) light exposed and (b)<br />
light protected.<br />
3.101 Ip of 0.10 µM AFG2 obtained in BRB at pH 9.0 185<br />
from 0 to 8 hours in (a) light exposed and (b)<br />
light protected.<br />
3.102 Peak heights of 0.10 µM aflatoxins in BRB at pH 187<br />
(a) 6.0, (b) 7.0, (c) 9.0 and (d) 11.0 exposed to<br />
ambient conditions up to 3 hours of exposure time.<br />
3.103 Resonance forms of the phenolate ion 187<br />
(Heathcote, 1984).<br />
3.104 Voltammograms of 0.10 µM AFB2 in BRB at pH 188<br />
6.0 from 0 to 3 hrs exposure time.<br />
3.105 Voltammograms of 0.10 µM AFB2 in BRB at pH 188<br />
11.0 from 0 to 3 hrs of exposure time.<br />
xxvi
3.106 Voltammograms of 0.10 µM AFG2 in BRB at pH 189<br />
6.0 from 0 to 3 hrs of exposure time.<br />
3.107 Voltammograms of 0.10 µM AFG2 in BRB at pH 189<br />
11.0 from 0 to 3 hrs of exposure time.<br />
3.108 Absorbance of 1.0 ppm aflatoxins in BRB at pH 190<br />
(a) 6.0, (b) 7.0, (c) 9.0 and (d) 11.0 from 0 to 3<br />
hours of exposure time.<br />
3.109 The peak heights of aflatoxins in 1.0 M HCl from 191<br />
0 to 6 hours of reaction time.<br />
3.110 The peak heights of aflatoxins in 1.0 M NaOH from 192<br />
0 to 6 hours of reaction time.<br />
3.111 Voltammograms of real samples after extraction by 193<br />
Technique (a) 1, (b) 2 and (c) 3 with addition of<br />
AFB1 standard solution in BRB at pH 9.0 as a<br />
blank.<br />
3.112 Voltammograms of blank in BRB at pH 9.0 obtained 194<br />
by (a) DPCSV and (b) SWSV methods.<br />
3.113 DPCSV (a) and SWSV (b) voltammograms of 10 195<br />
ppb AFB2 (i) in present of blank sample (ii) obtained<br />
in BRB at pH 9.0 (iii) as the supporting electrolyte.<br />
3.114 DPCSV voltammograms of real samples (b) added 197<br />
with 3 ppb (i), 9 ppb (ii) and 15 ppb (iii) AFB1<br />
obtained in BRB at pH 9.0 (a) as the blank on the<br />
first day measurement.<br />
3.115 Percentage of recoveries of (a) 3 ppb, (b) 9 ppb, 198<br />
(c) 15 ppb of all aflatoxins in real samples<br />
obtained by DPCSV methods for one to three<br />
days of measurements.<br />
3.116 DPCSV voltammograms of real sample, S11 (b) 199<br />
with the addition of 10 ppb AFB1 (c) in BRB at pH<br />
9.0 (a) as the blank. Parameter conditions: Eacc =<br />
-0.6 V, tacc = 80 s, scan rate = 50 mV/s and pulse<br />
amplitude = 80 mV.<br />
xxvii
3.117 SWSV voltammograms of real sample, S11 (b) 200<br />
with the addition of 10 ppb AFB1 (c) in BRB at pH<br />
9.0 (a) as the blank. Parameter conditions: Eacc =<br />
-0.8 V, tacc = 100 s, scan rate = 3750 mV/s,<br />
frequency = 125 Hz, voltage step = 0.03 V and<br />
pulse amplitude = 75 mV.<br />
3.118 DPCSV voltammograms of real sample, S07 (b) 200<br />
with the addition of 10 ppb AFB1 (c) in BRB at pH<br />
9.0 (a) as the blank. Parameter conditions: Eacc =<br />
-0.6 V, tacc = 80 s, scan rate = 50 mV/s and pulse<br />
amplitude = 80 mV.<br />
3.119 SWSV voltammograms of real sample, S07 (b) 201<br />
with the addition of 10 ppb AFB1 (c) in BRB at pH<br />
9.0 (a) as the blank. Parameter conditions: Eacc =<br />
-0.8 V, tacc = 100 s, scan rate = 3750 mV/s,<br />
frequency = 125 Hz, voltage step = 0.03 V and<br />
pulse amplitude = 75 mV.<br />
3.120 DPCSV voltammograms of real sample, S10 (b) 201<br />
with the addition of 10 ppb AFB1 (c) in BRB at pH<br />
9.0 (a) as the blank. Parameter conditions: Eacc =<br />
-0.6 V, tacc = 80 s, scan rate = 50 mV/s and pulse<br />
amplitude = 80 mV.<br />
3.121 SWSV voltammograms of real sample, S10 (b) 202<br />
with the addition of 10 ppb AFB1 (c) in BRB at pH<br />
9.0 (a) as the blank. Parameter conditions: Eacc =<br />
-0.8 V, tacc = 100 s, scan rate = 3750 mV/s,<br />
frequency = 125 Hz, voltage step = 0.03 V and<br />
pulse amplitude = 80 mV.<br />
xxviii
ABBREVIATIONS<br />
AAS Atomic absorption spectrometry<br />
Abs Absorbance<br />
ACP Alternate current polarography<br />
ACV Alternate current voltammetry<br />
AD Amperometric detector<br />
AdCSV Adsorptive cathodic stripping voltammetry<br />
AE Auxiliary electrode<br />
AFB1 Aflatoxin B1<br />
AFB2 Aflatoxin B2<br />
AFG1 Aflatoxin G1<br />
AFG2 Aflatoxin G2<br />
AFM1 Aflatoxin M1<br />
AFM2 Aflatoxin M2<br />
AFP1 Aflatoxin P1<br />
AFQ1 Aflatoxin Q1<br />
Ag/AgCl Silver/silver chloride<br />
ASV Anodic stripping voltammetry<br />
β-CD β-cyclodextrin<br />
BFE Bismuth film electrode<br />
BLMs Bilayer lipid membranes<br />
BRB Britton Robinson Buffer<br />
CA Concentration of analyte<br />
CE Capillary electrophoresis<br />
CGME Controlled growth mercury electrode<br />
CME Chemically modified electrode<br />
CPE Carbon paste electrode<br />
CSV Cathodic stripping voltammetry<br />
CV Cyclic voltammetry<br />
xxix
DC Direct current<br />
DCP Direct current polarography<br />
DME Dropping mercury electrode<br />
DMSO Dimethyl sulphonic acid<br />
DNA Deoxyribonucliec acid<br />
DPCSV Differential pulse cathodic stripping voltammetry<br />
DPP Differential pulse polarography<br />
DPV Differential pulse voltammetry<br />
Eacc Accumulation potential<br />
Ei Initial potential<br />
Ef Final potential<br />
Ehigh High potential<br />
Elow Low potential<br />
Ep Peak potential<br />
ECS Electrochemical sensing<br />
Et4NH4 OH Tetraethyl ammonium hydroxide<br />
ELISA Enzyme linked immunosorbant assay<br />
FD Fluorescence detector<br />
FDA Food and Drug Administration<br />
GCE Glassy carbon electrode<br />
GC-FID Gas chromatography with flame ionisation detector<br />
HMDE Hanging mercury drop electrode<br />
HPLC High performance liquid chromatography<br />
HPTLC High pressure thin liquid chromatography<br />
IAC Immunoaffinity chromatography<br />
IACLC Immunoaffinity column liquid chromatography<br />
IAFB Immunoaffinity fluorometer biosensor<br />
IARC International Agency for Research Cancer<br />
Ic Charging current<br />
Id Diffusion current<br />
If Faradaic current<br />
xxx
Ip Peak height<br />
ICP-MS Induced coupled plasma-mass spectrometer<br />
IR Infra red<br />
IUPAC International Union of Pure and Applied Chemistry<br />
KGy Kilogray<br />
LD50 Lethal dose 50<br />
LOD Limit of detection<br />
LOQ Limit of quantification<br />
LSV Linear sweep voltammetry<br />
MFE Mercury film electrode<br />
MS Mass spectrometer<br />
MECC Micellar electrokinetic capillary chromatography<br />
MOPS 3-(N-morpholino)propanesulphonic<br />
MOSTI Ministry of Science, Technology and Innovation<br />
NP Normal polarography<br />
NPP Normal pulse polarography<br />
NPV Normal pulse voltammetry<br />
OPLC Over pressured liquid chromatography<br />
PAH Polycyclic aromatic hydrocarbon<br />
PLL Poly-L-lysine<br />
ppb part per billion<br />
ppm part per million<br />
PSA Potentiometric stripping analysis<br />
RDX Hexahydro-1,3,5-trinitro-1,3,5-triazine<br />
RE Reference electrode<br />
RIA Radioimmunoassay<br />
RNA Ribonucleic acid<br />
RSD Relative standard deviation<br />
S/N Signal to noise ratio<br />
SCE Standard calomel electrode<br />
SCV Stair case voltammetry<br />
xxxi
SDS Sodium dodecyl sulphate<br />
SHE Standard hydrogen electrode<br />
SIIA Sequential injection immunoassay<br />
SMDE Static mercury drop electrode<br />
SPE Solid phase extraction<br />
SPCE Screen printed carbon electrode<br />
SWP Square-wave polarography<br />
SWV Square-wave voltammetry<br />
SWSV Square-wave stripping voltammetry<br />
SV Stripping voltammetry<br />
tacc Accumulation time<br />
TBS Tris buffered saline<br />
TEA Triethylammonium<br />
TLC Thin layer chromatography<br />
TFA Trifluoroacetic acid<br />
UME Ultra microelectrode<br />
ν Scan rate<br />
v/v Volume per volume<br />
UVD Ultraviolet-Visible detector<br />
UV-VIS Ultraviolet-Visible<br />
WE Working electrode<br />
WHO World Health Organisation<br />
λmax Maximum wavelenght<br />
εmax Maximum molar absorptivity<br />
xxxii
LIST OF APPENDICES<br />
xxxiii<br />
APPENDIX TITLE PAGE<br />
A Relative fluorescence of aflatoxins in different 255<br />
solvent s<br />
B UV spectra of the principal aflatoxins (in methanol) 256<br />
C Relative intensities of principal bands in the IR 257<br />
spectra of the aflatoxins<br />
D Calculation of concentration of aflatoxin stock 258<br />
solution<br />
E Extraction procedure for aflatoxins in real samples 259<br />
F Calculation of individual aflatoxin in groundnut 260<br />
samples.<br />
G Cyclic voltammograms of AFB1, AFB2 and AFG2 262<br />
with increasing of their concentrations.<br />
H Dependence if the peak heights of AFB1, AFG1 264<br />
and AFG2 on their concentrations.<br />
I Repetitive cyclic voltammograms and their peak 266<br />
heights of AFB1, AFG1 and AFG2 in BRB at pH 9.0<br />
J Plot Ep – log scan rate for the reduction of AFB1, 270<br />
AFG1 and AFG2 in BRB at pH 9.0<br />
K Plot of peak height versus scan rate for 1.3 µM of 272<br />
AFB1, AFG1 and AFG2 in BRB at pH 9.0<br />
L Voltammograms of AFB2 with increasing 274<br />
concentration.<br />
M Voltammograms of 0.1 µM and 0.2 µM AFB2 275<br />
obtained on the same day measurements<br />
N Voltammograms of AFB2 at inter-day 276<br />
measurements
O F test for robustness and ruggedness tests 278<br />
P Voltammograms of AFB1 with increasing 280<br />
concentration<br />
Q Voltammograms of AFG1 with increasing 281<br />
concentration<br />
R Voltammograms of AFG2 with increasing 282<br />
concentration<br />
S LOD determination according to Barek et al. (2001a) 283<br />
T LOD determination according to Barek et al. (1999) 286<br />
U LOD determination according to Zhang et al. (1996) 287<br />
V LOD determination according to Miller and 288<br />
Miller (1993)<br />
W ANOVA test 290<br />
X Peak height of aflatoxins in presence and absence of PLL 292<br />
Y SWSV voltammograms of AFB1, AFB2, AFG1 293<br />
and AFG2 in BRB at pH 9.0<br />
Z SWSV voltammograms of 0.10 µM AFB1, AFB2, 295<br />
AFG1 and AFG2 in BRB at pH 9.0<br />
AA UV-VIS spectrums of 10 ppm AFB1, AFB2, AFG1 297<br />
and AFG2 stock solutions<br />
AB Voltammograms of AFB1, AFB2, AFG1 and AFG2 299<br />
obtained from 0 to 6 months of storage time in the<br />
cool and dark conditions.<br />
AC Voltammograms of AFB1, AFB2, AFG1 and 302<br />
AFG2 in BRB at pH 9.0 from 0 to 8 hours of<br />
exposure time.<br />
AD UV-VIS spectrums of AFB2 in BRB at pH 6.0 305<br />
and 11.0.<br />
xxxiv
AE Voltammograms of AFB1 and AFG1 in 1.0 M HCl 307<br />
and 1.0 M NaOH<br />
AF DPCSV voltammograms of real samples added with 309<br />
various concentrations of AFG1<br />
AG SWSV voltammograms of real samples added with 310<br />
various concentrations of AFB1.<br />
AH Percentage of recoveries of various concentrations 311<br />
of all aflatoxins (3.0 and 9.0 ppb) in real samples<br />
obtained by SWSV method.<br />
AI Calculation of percentage of recovery for 3.0 ppb 312<br />
AFG1 added into real samples.<br />
AJ HPLC chromatograms of real samples: S10 and S07 313<br />
AK Calculation of aflatoxin in real sample, S13 314<br />
AL List of papers presented or published to date 315<br />
resulting from this study.<br />
AM ICP-MS results for analysis of BRB at pH 9.0 317<br />
xxxv
1.1 Overview<br />
CHAPTER I<br />
LITERATURE REVIEW<br />
Humans are continuously exposed to varying amounts of chemicals that have<br />
been shown to have carcinogenic or mutagenic properties in environmental systems.<br />
Exposure can occur exogenously when these agents are present in food, air or water,<br />
and also endogenously when they are products of metabolism or pathophysiologic<br />
states such as inflammation. Great attention is focused on environmental health in the<br />
past two decades as a consequence of the increasing awareness over the quality of life<br />
due to major environment pollutants that affect it. Studies have shown that exposure to<br />
environmental chemical carcinogens have contributed significantly to cause human<br />
cancers, when exposures are related to life style factors such as diet (Wogan et al.,<br />
2004).<br />
The contamination of food is part of the global problem of environmental<br />
pollution. Foodstuffs have been found contaminated with substances having<br />
carcinogenic, mutagenic, teratogenic and allergenic properties. As these substances can<br />
be supplied with food throughout the entire life-time of a person, it is necessary to deal<br />
with the chronic action of trace amounts of such substances. Hence the systematic<br />
determination of the foreign substances in nutritional products and feedstock plays an<br />
important role. The determination of trace impurities presents considerable difficulties<br />
owing to the fact that food is a complex system containing thousands of major and<br />
minor compounds (Nilufer and Boyacio, 2002). Increasing environment pollution by<br />
toxic substances such as toxic metals, organometallic and organic pollutants in air,
water, soil and food, calls for reliable analytical procedures for their control in<br />
environmental samples which needs reliable and sensitive methods (Fifield and Haines,<br />
2000). The choice of the method of analysis depends on the sample, the analyte to be<br />
assayed, accuracy, limit of detection, cost and time to complete the analysis (Aboul-<br />
Eneim et a., 2000). For development of this method, emphasis should be on<br />
development of simplified, cost-effective and efficient method that complies with the<br />
legislative requirements (Stroka and Anklam, 2002; Enker, 2003).<br />
The widespread occurrence of aflatoxins producing fungi in our environment<br />
and the reported naturally occurring of toxin in a number of agricultural commodities<br />
has led the investigator to develop a new method for aflatoxin analysis (Creepy, 2002).<br />
An accurate and sensitive method of analysis is therefore required for the determination<br />
of these compounds in foodstuffs that have sustained mould growth.<br />
Numerous articles concerning methods for determination of aflatoxins have<br />
been published. However, with regard to electroanalytical technique, only one method<br />
of determination was reported using the differential pulse pulse polarographic (DPP)<br />
technique which was developed by Smyth et al. (1979). In this experiment, the<br />
obtained limit of detection of aflatoxin B1 was 25 ppb which was higher as compared<br />
to the common amount of aflatoxin in contaminated food samples which is 10 ppb as<br />
reported by Pare (1997) or even less. In <strong>Malaysia</strong>, the regulatory limit for total<br />
aflatoxins in groundnut is 15 ppb. The regulatory for other foods and milk is 10 ppb<br />
and 0.05 ppb respectively (<strong>Malaysia</strong>n Food Act, 1983).<br />
1.2 AFLATOXINS<br />
1.2.1 Aflatoxins in General<br />
Aflatoxins are a group of heterocyclic, oxygen-containing mycotoxins that<br />
possess the bisdifuran ring system. It was discovered some 43 years ago in England<br />
2
following a poisoning outbreak causing 100,000 turkeys death (Miller, 1987 and<br />
Cespedez and Diaz, 1997). The aflatoxins are the most widely distributed fungal toxins<br />
in food. The occurrence of the aflatoxins in food products demonstrated that the high<br />
levels of aflatoxins are significant concern both for food traders and food consumers<br />
(Tozzi et al. 2003; Herrman, 2004; Haberneh, 2004). Aflatoxin is a by-product of mold<br />
growth in a wide range of agriculture commodities such as peanuts (Urano et al., 1993),<br />
maize and maize based food (Papp et al., 2002; Mendez-Albores et al., 2004),<br />
cottonseeds (Pons and Franz, 1977), cocoa (Jefferey et al., 1982), coffee beans (Batista<br />
et al., 2003), medical herbs ( Reif and Metzger, 1998; Rizzo et al., 2004), spices<br />
(Erdogen, 2004; Garner et al., 1993; Akiyama et al., 2001; Aziz et al., 1998), melon<br />
seeds (Bankole et al., 2004) and also in human food such as rice (Shotwell et al., 1966;<br />
Begum and Samajpati, 2000), groundnut (Bankole et al., 2005), peanut products (<br />
Patey et al., 1990), corn ( Shotwell and Goulden, 1977; Urano et al., 1993 ), vegetable<br />
oil (Miller et al., 1985), beer (Scott and Lawrence, 1997), dried fruits ( Abdul Kadar et<br />
al., 2004, Arrus et al. (2004), milk and dairy products (Kamkar, 2004; Aycicek et al.<br />
2005; Sarimehmetoglu et al., 2004; Martin and Martin, 2004 ). Meat and meat<br />
products are also contaminated with alfatoxins when farm animals are fed with<br />
aflatoxin contaminated feed (Miller, 1987 and Chiavaro et al., 2001).<br />
The molds that are major producers of aflatoxin are Aspergillus flavus<br />
(Bankole et al. 2004) and Aspergillus parasiticus (Begum and Samajpati, 2000;<br />
Setamou et al., 1997; Erdogen, 2004; Gourama and Bullerman, 1995). Aspergillus<br />
flavus, which is ubiquitous, produces B aflatoxins (Samajphati, 1979) while Aspergillus<br />
parasiticus, which produces both B and G aflatoxins, has more limited distribution<br />
(Garcia-Villanova et al., 2004). A picture of Aspergillus flavus seen under an electron<br />
microscope is shown in Figure 1.0.<br />
Black olive is one of the substrate for Aspergillus parasiticus growth and<br />
aflatoxin B1 production as reported by Leontopoulos et al., (2003). Biosynthesis of<br />
aflatoxins by this fungi depends on the environmental condition such as temperature<br />
and humidity during crop growth and storage (Leszczynska et al., 2000; Tarin et al.,<br />
3
2004 and Pildain et al., 2004). The optimum temperatures for aflatoxins growth are<br />
27.84 0 C and 27.30 0 C at pH=5.9 and 5.5 respectively.<br />
Figure 1.0: Aspergillus flavus seen under an electron microscope<br />
Before harvest, the risk for the development of aflatoxins is greatest during<br />
major drought (Turner et al., 2005). When soil moisture is below normal and<br />
temperature is high, the number of Aspergillus spores in the air increases. These spores<br />
infect crops through areas of damage caused by insects and inclement weather. Once<br />
infected, plant stress occurs, which favor the production of aflatoxins. Fungal growth<br />
and aflatoxins contamination are the sequence of interactions among the fungus, the<br />
host and the environment. The appropriate combination of water stress, high<br />
temperature stress and insect damage of the host plant are major determining factors in<br />
mold infestation and toxin production (Faraj et al., 1991; Koehler, 1985; Park and<br />
Bullerman, 1983). Additional factors such as heat treatment, modified-atmosphere<br />
packaging or the presence of preservative, also contribute in increasing growth rate of<br />
the aflatoxins.<br />
Farmers have minimal control over some of these environmental factors.<br />
However appropriate pre-harvest and post-harvest management and good agricultural<br />
practice, including crop rotation, irrigation, timed planting and harvesting and the use<br />
4
of pesticides are the best methods for preventing or controlling aflatoxins<br />
contamination (Turner et al., 2005). Timely harvesting could reduce crop moisture to a<br />
point where the formation of the mould would not occur. For example harvesting corn<br />
early when moisture is above 20 percent and then quickly drying it to a moisture level<br />
of at least 15 percent will keep the Aspergillus flavus from completing its life cycle,<br />
resulting in lower aflatoxin concentration. Aflatoxins are to be found in agricultural<br />
products as a consequence of unprosperous storage conditions where humidity of 70 -<br />
90 % and a minimum temperature of about 10° C. Commodities that have been dried<br />
to about 12 to 0.5 % moisture are generally considered stable, and immune to any risk<br />
of additional aflatoxins development. Moreover, the minimum damage of shells during<br />
mechanized harvesting of crop reduces significantly the mould contamination.<br />
Biocontrol of aflatoxin contamination is another way to reduce this contamination. The<br />
natural ability of many microorganisms including bacteria, actinomycetes, yeasts,<br />
moulds and algae has been a source for bacteriological breakdown of mycotoxins. The<br />
most active organism such as Flavobacterium aurantiacum which in aqueous solution<br />
can take up and metabolise aflatoxins B1, G1 and M1 (Smith and Moss, 1985).<br />
Production of aflatoxins is greatly inhibited by propionic acid as revealed by<br />
Molina and Gianuzzi (2002) when they studied the production of aflatoxins in solid<br />
medium at different temperature, pH and concentration of propionic acid. It also can be<br />
inhibited by essential oil extracted from thyme as found by Rasooli and Abnayeh<br />
(2004). Other chemicals that can inhibit the growth of this fungus are ammonia, copper<br />
sulphate and acid benzoic (Gowda et al., 2004).<br />
1.2.2 Chemistry of Aflatoxins<br />
Aflatoxins can be classified into two broad groups according to chemical<br />
structure which are difurocoumarocyclopentenone series and ifurocoumarolactone<br />
(Heathcote, 1984). They are highly substituted coumarin derivatives that contain a<br />
fused dihydrofuran moiety. The chemical structure of coumarin is shown in Figure 1.1.<br />
5
Figure 1.1 Chemical structure of coumarin<br />
O<br />
There are six major compounds of aflatoxin such as aflatoxin B1 (AFB1),<br />
aflatoxin B2 (AFB2), aflatoxin G1 (AFG2), aflatoxin G2 (AFG2), aflatoxin M1<br />
(AFM1) and aflatoxin M2 (AFM2) (Goldblatt, 1969). The former four are naturally<br />
found aflatoxins and the AFM1 and AFM2 are produced by biological metabolism of<br />
AFB1 and AFB2 from contaminated feed used by animals. They are odorless, tasteless<br />
and colorless. The scientific name for these aflatoxin compounds are listed in Table 1.0.<br />
Aflatoxins have closely similar structures and form a unique group of highly<br />
oxygenated, naturally occurring heterocyclic compounds. The chemical structures of<br />
these aflatoxins are shown in Figure 1.2. The G series of aflatoxin differs chemically<br />
from B series by the presence of a β-lactone ring, instead of a cyclopentanone ring.<br />
Also a double bond that may undergo reduction reaction is found in the form of vinyl<br />
ether at the terminal furan ring in AFB1 and AFG1 but not in AFB2 and AFG2.<br />
However this small difference in structure at the C-2 and C-3 double bond is associated<br />
with a very significant change in activity, whereby AFB1 and AFG1 are carcinogenic<br />
and considerably more toxic than AFB2 and AFG2. The dihydrofuran moiety in the<br />
structure is said to be of primary importance in producing biological effects.<br />
Hydroxylation of the bridge carbon of the furan rings for AFM1 does not significantly<br />
alter the effects of the compounds. The absolute configuration of AFB2 and AFG2<br />
follows from the fact that it is derived from the reduction of AFB1 and AFG1<br />
respectively.<br />
AFB is the aflatoxin which produces a blue color under ultraviolet while AFG<br />
produces the green color. AFM produces a blue-violet fluorescence while AFM2<br />
produces a violet fluorescence (Goldblatt, 1969). Relative fluorescence of aflatoxins in<br />
several organic solvents are shown in Appendix A (White and Afgauer, 1970). The<br />
O<br />
6
Table 1.0 Scientific name for aflatoxin compounds<br />
Aflatoxin B1<br />
(AFB1)<br />
Aflatoxin B2<br />
(AFB2)<br />
Aflatoxin G1<br />
(AFG1)<br />
Aflatoxin G2<br />
(AFG2)<br />
Aflatoxin<br />
M1<br />
(AFM1)<br />
Aflatoxin<br />
M2<br />
2,3,6a,9a-tetrahydro-4-methoxycyclopenta[c]<br />
furo[3’,2’:4,5]furo[2,3-h][l] benzopyran-1,11-dione<br />
2,3,6a,8,9,9a-Hexahydro-4-methoxycyclopenta[c]<br />
furo[3’,2’:4,5]furo[2,3-h][l] benzopyran-1,11-dione<br />
3,4, 7a,10a-tetrahydro-5-methoxy-1H, 12H<br />
furo[3’,2’:4,5]furo[2,3-h]pyrano[3,4-c]l]- benzopyran-<br />
1,12-dione<br />
3,4,7a,8,9,10, 10a-Hexahydro-5-methoxy-1H,12H-<br />
furo[3’,2’:4,5]furo[2,3-h]pyrano[3,4-c][l]- benzopyran-<br />
1,12-dione<br />
4-Hydroxy AFB1<br />
4-Hydroxy AFB2<br />
natural fluorescence of aflatoxins arises from their oxygenated pentaheterocyclic<br />
structure. The fluorescence capacity of AFB2 and AFG2 is ten times larger than that of<br />
AFB1 and AFG1, probably owing to the structural difference, namely double bond on<br />
the furanic ring. Such a double bond seems to be very important for the photophysical<br />
7
O<br />
O<br />
O<br />
O<br />
O<br />
O<br />
OH<br />
O<br />
O<br />
O<br />
O O<br />
O<br />
O<br />
(a) (b)<br />
O<br />
O<br />
O<br />
O<br />
O<br />
O<br />
O<br />
O<br />
O<br />
O<br />
OH<br />
O<br />
O<br />
O<br />
O<br />
O<br />
O<br />
O<br />
O<br />
O<br />
O<br />
O<br />
O<br />
O O<br />
(c) (d)<br />
(e) (f)<br />
Figure 1.2 Chemical structures of (a) AFB1, (b) AFB2, (c) AFG1, (d) AFG2,<br />
(e) AFM1 and (f) AFM2.<br />
properties of these derivatives measured just after spectroscopic studies (Cepeda et al.,<br />
1996). The excitation of the natural fluorescence of AFB1 and AFG1 can be promoted<br />
O<br />
8
in many different ways such as post-column iodination (Tuinstra and Haasnoot, 1983;<br />
Davis and Diener, 1980), post-column bromination (Kok et al.,1986; Kok, 1994 ;<br />
Versantroort et al., 2005 ), use of cyclodextrin compound (Cepeda et al., 1996;<br />
Chiavaro et al., 2001; Franco et al., 1998) and trifluoroacetic acid, TFA (Stack and<br />
Pohland, 1975; Takahashi, 1977a; Haghighi et al., 1981; Nieduetzki et al., 1994 ).<br />
AFB1 and AFG1 form hemiacetals, AFB2a and AFG2a when reacted with<br />
acidic solution such as triflouroacetic acid (TFA) as represented in Figure 1.3 (Joshua,<br />
1993). The hydroxyaflatoxins are unstable and tend to decompose to yellow products<br />
in the presence of air, light and alkali. Their UV and visible spectra are similar to those<br />
of the major aflatoxins.<br />
O<br />
O<br />
O<br />
O<br />
O<br />
O<br />
O<br />
O<br />
O O<br />
O<br />
O<br />
O<br />
TFA<br />
TFA<br />
HO<br />
(a) (c)<br />
HO<br />
O<br />
O<br />
O<br />
O<br />
O<br />
O<br />
O<br />
O<br />
O O<br />
(b) (d)<br />
Figure 1.3 Hydration of AFB1 (a) and AFG1 (b) by TFA produces AFB2a (c) and<br />
AFG2a (d) (Joshua, 1993).<br />
The close relationship between AFB1, AFG1, AFB2a and AFG2a was shown by the<br />
similarities in their IR and UV spectra. The main difference between AFB2a and<br />
AFG2a with AFB1 and AFG1 are found in the IR spectra, where an additional band at<br />
O<br />
O<br />
O<br />
9
3620 cm -1 indicates the presence of a hydroxyl group in AFB2a and AFG2a. The<br />
absence of bands at 3100, 1067 and 722 cm -1 (which arise in AFB1 and AFG1 from the<br />
vinyl ether group) indicates that the compounds are hydroxyl derivatives of AFB2 and<br />
AFG2. Some chemical and physical properties of aflatoxin compounds are listed in<br />
Table 1.1 (Heathcote and Hibbert, 1978; Weast and Astle, 1987). The close<br />
relationship between these aflatoxins was shown by the similarities in their UV and IR<br />
spectra as shown in Appendix B and C respectively.<br />
Table 1.1 Chemical and physical properties of aflatoxin compounds<br />
Molecular<br />
formula<br />
Molecular weight<br />
Crystals<br />
Melting point<br />
( ° C )<br />
Fluorescence<br />
under UV light<br />
Solubility<br />
Other properties<br />
AFB1<br />
C17H12O6<br />
312<br />
Pale yellow<br />
268.9<br />
Blue<br />
AFB2<br />
C17H14O6<br />
314<br />
Pale yellow<br />
286.9<br />
Blue<br />
AFG1<br />
C17H12O7<br />
328<br />
Colorless<br />
244.6<br />
Green<br />
AFG2<br />
C17H14O7<br />
330<br />
Colorless<br />
237.40<br />
Green<br />
Soluble in water and polar organic solvent. Normal solvents<br />
are: methanol, water: acetonitrile (9:1), trifluoroacetic acid,<br />
methanol: 0.1N HCl (4:1), DMSO and acetone<br />
Odorless, colorless and tasteless in solution form.<br />
Incompatible with strong acids, strong oxidising agents and<br />
strong bases. Soluble in water, DMSO, 95% acetone or<br />
ethanol for 24 hours under ambient temperature<br />
10
Many researches have studied the stability of aflatoxins. For example, AFB1<br />
was not found in fruit samples after being irradiated with 5.0 Kgy or more of gammairradiation<br />
as reported by Aziz and Moussa (2002). Gonzalez et al. (1998) have studied<br />
the effect of electrolysis, ultra-violet irradiation and temperature on the decomposition<br />
of AFB1 and AFG1. UV irradiation caused an intense effect on aflatoxins where after<br />
60 min of radiation, AFG1 suffers practically with no more decomposition. However,<br />
when the aflatoxin solutions were placed in a 90° C bath for 3 min, a decrease of 20%<br />
from total amount of both AFB1 and AFG1 was obtained. A greater extent of<br />
decomposition (50%) was found for treatment at 100° C during longer time. Levi<br />
(1980) reported that experimental roasting under conditions simulating those of the<br />
typical roasting operation (20 min at 200 ± 5° C) destroyed about 80% of AFB1 added<br />
to green coffee. It was also found that AFB2 decomposed to a larger extent than AFG1<br />
indicating a lower stability against prolonged heat treatment. During food<br />
fermentation which involved other fungi such as Rhizopus oryzae and R. oligosporus,<br />
cyclopentanone moiety of AFB1 was reduced resulting in the formation of aflatoxicol<br />
A as shown in Figure 1.4 which is non-toxic compound. It retains the blue-fluorescing<br />
property of AFB1 under UV light. It has been considered to be one of the most<br />
important B1 metabolites because there is a correlation between the presence of this<br />
metabolite in animal tissues and body fluids with toxicity of AFB1 in different animals<br />
(Lau and Chu, 1983). Aflatoxin solution prepared in water, dimethyl sulphonic acid<br />
(DMSO), 95% acetone or ethanol is stable for 24 hours under ambient conditions.<br />
AFM1 is relatively stable during pesteuring, sterilisation, preparation and storage of<br />
various dairy products (Gurbay et al., 2004).<br />
O<br />
O<br />
O<br />
O<br />
O<br />
OCH 3<br />
+ R.oryzae<br />
+ R. oligosporus<br />
(a) (b)<br />
Figure 1.4 Transformation of toxic (a) AFB1 to non-toxic (b) aflatoxicol A<br />
O<br />
O<br />
O<br />
O<br />
OH<br />
11<br />
OCH3
1.2.3 Health Aspect of Aflatoxins<br />
Aflatoxins have received greater attention than any other mycotoxins. There are<br />
potent toxin and were considered as human carcinogen by The International Agency for<br />
Research on Cancer (IARC) as reported in World Health Organisation (WHO)’s<br />
monograph (1987). These mycotoxins are known to cause diseases in man and animals<br />
called aflatoxicosis (Eaton and Groopman, 1994). Human exposure to aflatoxins is<br />
principally through ingestion of contaminated foods (Versantroort et al., 2005).<br />
Inhalation of the toxins may also occur occasionally due to the occupational exposure.<br />
After intake of contaminated feedstuffs aflatoxins cause some undesirable effect in<br />
animals, which can range from vomiting, weight loss and acute necrosis to various<br />
types of carcinoma, leading in many cases to death (Pestka and Bondy, 1990 and<br />
Bingham et al., 2004). Even at low concentration, aflatoxins diminish the immune<br />
function of animals against infection. Epidemiological studies have shown a<br />
correlation between liver cancer and the prevalence of aflatoxins in the food supply.<br />
In views of occurrence and toxicity, AFB1 is extremely carcinogenic while<br />
others are considered as highly carcinogenic as reported by Carlson (2000). It is<br />
immunosuppressive and a potent liver toxin; less than 20 µg of this compound is lethal<br />
to duckling (Hussein and Brasel, 2001). AFB1 is biochemically binding to DNA,<br />
inhibit DNA, RNA, and protein syntheses, and effects DNA polymerase activity as<br />
reported by Egner et al. (2003). Previous research results have demonstrated the<br />
covalent binding of highly reactive metabolite of AFB1 to the N-7 atom of guanine<br />
residues, resulting in major DNA adducts (Moule, 1984; Johnson et al., 1997; Egner et<br />
al., 2003). Major DNA adducts of AFB1 are shown in Figure 1.5.<br />
The four main aflatoxins display decreasing potency in the order AFB1 > AFG1<br />
> AFB2 > AFG2 as reported by Betina (1984). This order of toxicity indicates that the<br />
double bond in terminal furan of AFB1 structure is a critical point for determining the<br />
degree of biological activity of this group of mycotoxins (Hall and Wild, 1994). It<br />
appears that the aflatoxins themselves are not carcinogenic but rather some of their<br />
12
NH 2<br />
NH<br />
O<br />
N<br />
OH<br />
N<br />
N<br />
O O<br />
O<br />
O O<br />
OCH 3<br />
NH 2<br />
NH<br />
O<br />
OH<br />
N<br />
N NH 2<br />
CHO<br />
(a) (b)<br />
O<br />
O<br />
O<br />
O O<br />
Figure 1.5 Major DNA adducts of AFB1; (a) 8,9- Dihydro-8-(N 7 -guanyl)-<br />
9-hydroxy-aflatoxin B1 (AFB1-Gua) and (b) 8,9-Dihydro-8-(N 5 - Formyl-2 ’ .5 ’ .6 ’ -<br />
triamino-4 ’ -oxo-N 5 -pyrimidyl)-9-hydroxy- Aflatoxin B1 (AFB1-triamino-Py)<br />
metabolites (de Vries, 1996). For example, metabolite transformation of AFB1 by<br />
cytochrome P-450 enzyme produces aflatoxin Q1 (AFQ1), AFM1, AFB1-epoxide and<br />
aflatoxin P1 (AFP1) as shown in Figure 1.6. For hamiacetals, AFB2a and AFG2a,<br />
however, are relatively non-toxic despite the close similarity of their structure to those<br />
of AFB1 and AFG1 even at the highest dosages (1200 µg for AFB2a and 1600 µg for<br />
AFG2a).<br />
AFM1 is the main metabolic derivatives of aflatoxins in several animal species<br />
It is found in the cow milk due which had consumed feed which contaminated with<br />
AFB1 as reported by Chang et al. (1983), Yousef and Marth (1985), Van Egmond<br />
(1989), Tuinstra (1990) and Lopez et al. (2002). The relative amount of AFM1<br />
excreted is related to the amount of AFB1 in the feed, and about 0.1% of AFB1<br />
ingested is excreted into milk as AFM1 (Miller, 1987). There was a linear relationship<br />
between the amount of AFM1 in milk and AFB1 in feeds consumed by animals as<br />
reported by Dragacci (1995). AFM1 is produced by hydroxylation of AFB1 in the liver<br />
OCH 3<br />
13
O<br />
OH<br />
O<br />
O<br />
O<br />
O<br />
OCH 3<br />
O<br />
O<br />
O<br />
O<br />
B 1-epoxide<br />
O<br />
O<br />
Aflatoxin B 1<br />
M 1 P 1<br />
O<br />
Figure 1.6 Metabolic pathways of AFB1 by cytochrom P-450 enzymes; B1-<br />
epoxide = AFB1 epoxide, M1 = aflatoxin M1, P1 = aflatoxin P1 and Q1 = aflatoxin<br />
Q1<br />
O<br />
O<br />
O<br />
O<br />
O<br />
O<br />
OCH 3<br />
OCH 3<br />
O<br />
OH<br />
O<br />
O<br />
O<br />
O<br />
O<br />
Q I<br />
O<br />
14<br />
O<br />
OCH 3<br />
OH
of lactating animals, including humans. It is also known as milk toxin which is much<br />
less carcinogenic and mutagenic than AFB1. It has been classified by the International<br />
Agency For Research Cancer (IARC) as a Group 2 carcinogen (IARC, 1993). It can<br />
generally be found in milk and milk products such as dry milk, whey, butter, cheese,<br />
yogurt and ice cream. AFM2 is the analogous metabolic derivatives of AFB2.<br />
Aflatoxins have been considered as one of the most dangerous contaminant in<br />
food and feed. The contaminated food will pose a potential health risk to human such as<br />
aflatoxicosis and cancer (Jeffrey and Williams, 2005). Aflatoxins consumption by<br />
livestock and poultry results in a disease called aflatoxicosis which clinical sign for<br />
animals include gastro intestinal dysfunction, reduced reproductivity, reduced feed<br />
utilisation, anemia and jaundice. Humans are exposed to aflatoxins by ingestion,<br />
inhalation and dermal exposure as reported by Etzel (2002). LD50 which is the amount<br />
of a materials, given all at once, causes the death of 50% (one half) of a group of test<br />
animal (www.aacohs.ca/oshanswers) for most animal and human for AFB1 is between<br />
0.5 to 10.0 mg kg -1 body weight (Smith and Moss, 1985; Salleh, 1998). Clinical<br />
features were characterised by jaundice, vomiting, and anorexia and followed by<br />
ascites, which appeared rapidly within a period of 2-3 weeks.<br />
Besides causing health problems to humans, aflatoxin also can cause adverse<br />
economic effect in which it lowers yield of food production and fiber crops and<br />
becoming a major constraint of profitability for food crop producer countries, an<br />
example of which is given in Rachaputi et al. (2001). It has been estimated that<br />
mycotoxin contamination may affect as much as 25% of the world’s food crop each<br />
year (Lopez, 1999) resulting in significant economic loss for these countries.<br />
Aflatoxins also inflict losses to livestock and poultry producers from aflatoxincontaminated<br />
feeds including death and the more subtle effects of immune system<br />
suppression, reduced growth rates, and losses in feed efficiency.<br />
Due to the above reason, aflatoxin levels in animal feed and various human food<br />
products is now monitored and tightly regulated by the most countries. In <strong>Malaysia</strong>,<br />
15
the action level for total aflatoxins is 15ppb (<strong>Malaysia</strong>n Food Act, 1983). The<br />
European Commission has set limits for the maximum levels of total aflatoxins and<br />
AFB1 allowed in groundnuts, nuts, dried fruit and their products. For foods ready for<br />
retail sale, these limits are 4 ppb for total aflatoxins and 2 ppb for AFB1, and for foods<br />
that are to be processed further the limits stand at 15 ppb for total aflatoxins and 8 ppb<br />
of AFB1 (European Commission Regulation, 2001). The Food and Drug<br />
Administration (FDA) in USA has established an action level of 0.5 ppb of mycotoxin,<br />
AFM1 in milk for humans and 20 ppb for other aflatoxins in food other than milk<br />
(www.ansci.cornel.edu/toxiagents).<br />
In Brazil, the limits allowed for food destined for human consumption are 20<br />
µg/kg of total aflatoxin for corn in grain, flours, peanut and by-products, and 0.5 µg/l of<br />
AFM1 in fluid milk (Sassahara et al., 2005). Australia has established a minimum level<br />
of 15 ppb for aflatoxin in raw peanut and peanut product (Mackson et al., 1999). In<br />
Germany, regulatory levels of total aflatoxins are 4 ppb and 2 ppb for AFB1. For<br />
human dietary products, such as infant nutriment, there are stronger legal limits, 0.05<br />
ppb for AFB1 and the total aflatoxins (Reif and Metzger, 1995). The Dutch Food Act<br />
regulates that food and beverages may contain no more than 5 µg of AFB1 per kg<br />
(Scholten and Spanjer, 1996).<br />
Regulatory level set by Hong Kong government is 20 ppb for peanuts and<br />
peanut products and 15 ppb for all other foods (Risk Assessment Studies report, 2001).<br />
Because of all these reasons, systematic approaches to sampling, sample preparation<br />
and selecting appropriate and accurate method of analysis of aflatoxin are absolutely<br />
necessary to determine aflatoxins at the part-of-billion (ppb) level as reported by Park<br />
and Rua (1991).<br />
1.2.4 Analytical Methods for the Determination of Aflatoxins<br />
Monitoring the presence of aflatoxin in various samples especially in food is<br />
not only important for consumer protection, but also for producers of raw products<br />
16
prior to cost intensive processing or transport. Several methods for aflatoxins<br />
determination in various samples have been developed and reported in the literature.<br />
Method based on thin-layer chromatography (TLC) (Lafont and Siriwardana, 1981;<br />
AOAC, 1984) and high performance liquid chromatography (HPLC) with ultraviolet<br />
absorption, fluorescence, mass spectrometry or amperometry detection, have been<br />
reported (Kok et al., 1986; Taguchi et al., 1995; Ali et al., 2005; Manetta et al.,<br />
2005).<br />
TLC and HPLC techniques are well proven and widely accepted; however,<br />
both techniques have their own disadvantages. These methods require well equipped<br />
laboratories, trained personnel, harmful solvents and time consuming. Moreover,<br />
instrumentations used are expensive (Badea et al., 2004). The main disadvantage<br />
associated with TLC is the lack of precision where a possible measurement error of ±<br />
30 – 50 % is indicated when standard and unknown aflatoxins spot are matched, and<br />
± 15 -25 % when the unknown is interpolated between two standards (Takahashi,<br />
1977b). In this technique, the greater effect was caused by sample matrix which is<br />
usually very complicated (Lin et al., 1998). Poor repeatability is associated with the<br />
sample application, development and plate interpretation steps. HPLC technique is<br />
often viewed as laborious and time intensive, needs complex gradient mobile phase,<br />
large quantity of organic solvent, requiring a significant investment in equipments,<br />
materials and maintenance (Pena et al., 2002).<br />
Pre-column derivatisation technique could improve the sensitivity of the<br />
measurement however, it requires chemical manipulations which are time consuming,<br />
involves aggressive reagents such as bromine, TFA and iodine and also it is difficult<br />
to automate. Other disadvantages of this procedure include the requirement to<br />
prepare iodine solution daily, the necessity for two pumps, dilution of the eluent<br />
stream, the need to thermostat the reactor coil and insufficient day-to-day<br />
reproducibility (Kok et al., 1986). The method using TFA as derivatising agent has<br />
poor reproducibility and is difficult to automate (Reif and Metzger, 1995).<br />
17
Other methods such as enzyme linked immunosorbant assay (ELISA) (Chu et<br />
al., 1987; Lee et al., 1990; Pesavento et al., 1997 and Aycicek et al., 2005),<br />
radioimmunoassay (RIA) (Stroka et al., 2000) and immunoaffinity clean up (Garner,<br />
1993 and Niedwetzki et al., 1994) have also been developed for the detection of these<br />
compounds. The simplicity, sensitivity and rapid detection of aflatoxin by ELISA<br />
has made it possible to monitor several samples simultaneously but ELISA and other<br />
immunochemical methods require highly specific polyclonal or monoclonal sera for<br />
specific and sensitive detection of antigen. The production of specific antibodies for<br />
aflatoxins has allowed the development of this technique based on direct or indirect<br />
competition. This method, however, presents some drawbacks such as long<br />
incubation time, washing and mixing steps (Badea et al., 2004) and is labor intensive<br />
(Carlson et al., 2000). It also requires highly specific polyclonal or monoclonal sera<br />
which is expensive (Rastogi et al., 2001). Blesa et al. (2003) reported that the ELISA<br />
method is a good screening method for investigation of aflatoxins. RIA is very<br />
sensitive but has several disadvantages. The radioisotopes are health hazards,<br />
disposable difficulties and may have short half life (Trucksess et al., 1991).<br />
Cole et al., (1992) have used micellar electrokinetic capillary chromatography<br />
(MECC) technique for rapid separation of aflatoxins. Pena et al., (2002) proposed<br />
capillary electrophoresis (CE) for determination of aflatoxins. They found that the<br />
limit of detection (LOD) of this technique was 0.02 to 0.06 ppb with analysis time of<br />
50 minutes. Due to long duration time and involving use of many reagents such as<br />
benzene and acetonitrile for preparation of aflatoxin stock solution and sodium<br />
dodecyl sulphate (SDS), sodium dihydrogenphosphate, sodium borate and γcyclodextrin<br />
for preparing the buffer solution in performing the analysis, this<br />
technique may not be suitable for routine analysis of aflatoxins. A summary of<br />
techniques used for the determination of aflatoxins compounds in various samples<br />
together with its detection limit is shown in Table 1.2.<br />
18
Table 1.2 Summary of analysis methods used for the determination of aflatoxins in<br />
various samples<br />
No<br />
1<br />
2<br />
3<br />
4<br />
5<br />
6<br />
7<br />
8<br />
9<br />
Method<br />
HPLC-FD<br />
HPLC-FD<br />
HPLC-FD<br />
HPLC-FD<br />
HPLC-FD<br />
HPLC-FD<br />
HPLC-FD<br />
HPLC-FD<br />
HPLC-FD<br />
Aflatoxin / samples<br />
B1, B2, G1 and G2 in spices<br />
B1, B2, G1 and G2 in spices<br />
B1, B2, G1 and G2 in peanut<br />
butter<br />
B1, B2, G1 and G2 in peanut<br />
butter<br />
B1, B2, G1 and G2 in peanut<br />
butter<br />
B1, B2, G1 and G2 in<br />
airborne dust<br />
B1, B2, G1 and G2 in corn,<br />
peanuts and peanut butter<br />
B1, B2, G1 and G2 in<br />
medicinal herbs and plant<br />
extract<br />
B1, B2, G1 and G2 in<br />
airborne dust and human sera<br />
Detection<br />
limit (ppb)<br />
0.06<br />
0.5<br />
5.0<br />
0.5<br />
Not stated<br />
B1, G1, G2<br />
= 3.1<br />
B2 = 1.8<br />
Not stated<br />
0.05<br />
0.08<br />
Reference<br />
Garner et al.<br />
1993)<br />
Akiyama et al.<br />
(2001)<br />
Beebe (1978)<br />
Duhart et al.<br />
(1988)<br />
Patey et al.<br />
(1991)<br />
Kussak et al.<br />
(1995a)<br />
Trucksess et al.<br />
(1991)<br />
Reif and<br />
Metzger (1995)<br />
Brera et al.<br />
(2002)<br />
19
No<br />
10<br />
11<br />
12<br />
13<br />
14<br />
15<br />
16<br />
17<br />
18<br />
Method<br />
HPLC-FD<br />
HPLC-FD<br />
HPLC-FD<br />
HPLC-FD<br />
HPLC-FD<br />
HPLC-FD<br />
HPLC-FD<br />
HPLC-FD<br />
HPLC-FD<br />
Table 1.2 Continued<br />
Aflatoxin / samples<br />
B1, B2, G1 and G2 in<br />
groundnut, peanut and peanut<br />
butter<br />
B1, B2, G1 and G2 in<br />
standard samples<br />
B1, B2, G1 and G2 in wine<br />
B1, B2, G1 and G2 in corn,<br />
almonds, peanuts, milo,rice,<br />
pistachio, walnuts, corn and<br />
cottonseed<br />
M1 in milk and non fat dry<br />
milk<br />
B1, B2, G1 and G2 in beer<br />
B1, B2, G1 and G2 in poultry<br />
and pig feeds and feedstuffs<br />
M1 in milk<br />
M1 in whole milk<br />
Detection<br />
limit (ppb)<br />
2.0<br />
Not stated<br />
0.02<br />
Not stated<br />
0.014<br />
B1, G1=<br />
0.019,<br />
B2, G2 =<br />
0.015<br />
1.0<br />
0.05<br />
0.014<br />
Reference<br />
Chemistry<br />
Department,<br />
MOSTI (1993)<br />
Holcomb et al.<br />
(2001)<br />
Takahashi<br />
(1977a)<br />
Wilson and<br />
Romer (1991)<br />
Chang and<br />
Lawrence<br />
(1997)<br />
Scot and<br />
Lawrence<br />
(1997)<br />
Cespedes and<br />
Diaz (1997)<br />
Yousef and<br />
Marth (1985)<br />
Fremy and<br />
Chang (2002)<br />
20
No<br />
19<br />
20<br />
21<br />
22<br />
23<br />
24<br />
25<br />
26<br />
27<br />
Method<br />
HPLC-FD<br />
HPLC-FD<br />
HPLC-FD<br />
HPLC-FD<br />
HPLC-FD<br />
HPLC-FD<br />
HPLC-FD<br />
and UVD<br />
HPLC-FD<br />
and UVD<br />
HPLC-<br />
UVD<br />
Table 1.2 Continued<br />
Aflatoxin / samples<br />
B1, B2, G1 and G2 in pistachio<br />
kernels and shells<br />
B1, B2, G1 and G2 in urine<br />
M1 in milk<br />
M1 in urine and milk<br />
B1, B2, G1 and G2 in sesame<br />
butter and tahini<br />
B1 and ochratoxin A in bee<br />
pollen<br />
B1, B2, G1 and G2 in<br />
contaminated cocoa beans<br />
B1 and B2 in wine and fruit<br />
juices<br />
B1, B2, G1 and G2 in corn<br />
Detection<br />
limit (ppb)<br />
B1 = 0.8,<br />
B2 = 0.29<br />
G1 = 0.9<br />
G2 = 1.1<br />
0.0068<br />
10<br />
0.0025<br />
Not stated<br />
B1= 0.2<br />
1.0<br />
0.02<br />
B1, G1 =<br />
1.0,<br />
B2, G2 =<br />
0.25<br />
Reference<br />
Chemistry<br />
Department,<br />
MOSTI (1993)<br />
Kussak et al.<br />
(1995b)<br />
Gurbey et al.<br />
(2004)<br />
Simon et al.<br />
(1998)<br />
Nilufer and<br />
Boyacio (2002)<br />
Garcia-<br />
Villanove et al.<br />
(2004)<br />
Jefferey et al.<br />
(1982)<br />
Takahashi<br />
(1997b)<br />
Fremy and<br />
Chang (2002)<br />
21
No<br />
28<br />
29<br />
30<br />
31<br />
32<br />
33<br />
34<br />
35<br />
36<br />
Method<br />
HPLC-<br />
UVD<br />
HPLC-<br />
UVD<br />
HPLC-<br />
UVD<br />
HPLC-<br />
UVD<br />
HPLC-<br />
UVD<br />
HPLC-AD<br />
HPTLC<br />
HPTLC-<br />
SPE<br />
TLC<br />
Table 1.2 Continued<br />
Aflatoxin / samples<br />
B1in standard sample<br />
B1and B2 in cottonseed<br />
B1 in egg<br />
B1 and M1 in corn<br />
B1, B2, G1 and G2 in soy<br />
sauces and soybean paste<br />
B1, B2, G1 and G2 in<br />
standard sample<br />
B1, B2, G1 and G2 in corn,<br />
buckwheat, peanuts and<br />
cheese<br />
B1, B2, G1 and G2 in<br />
palm kernel<br />
B1and M1in artificial<br />
contaminated beef livers<br />
Detection<br />
limit (ppb)<br />
Not stated<br />
5.0<br />
1.0<br />
B1 = 3.0 -5.0<br />
M1 = not<br />
stated<br />
1.0<br />
7.0<br />
B1 = 0.2<br />
B2, G1, G2 =<br />
0.1<br />
B1 = 3.7, B2<br />
= 2.5, G1 =<br />
3.0, G2 = 1.3<br />
B1= 0.03,<br />
M1 = 0.1<br />
Reference<br />
Rastogi et al.<br />
(2001)<br />
Pons and Franz<br />
(1977)<br />
Trucksess et al.<br />
(1977)<br />
Stubblefield and<br />
Shotwell (1977)<br />
Wet et al.<br />
(1980)<br />
Gonzalez et al.<br />
(1998)<br />
Kamimura et al.<br />
(1985)<br />
Nawaz et al.<br />
(1992)<br />
Stabblefield et<br />
al. (1982)<br />
22
No<br />
37<br />
38<br />
39<br />
40<br />
41<br />
42<br />
43<br />
44<br />
45<br />
Method<br />
TLC<br />
TLC<br />
TLC<br />
TLC<br />
TLC<br />
TLC<br />
TLC<br />
TLC<br />
TLC-FDs<br />
Table 1.2 Continued<br />
Aflatoxin / samples<br />
B1in milk and milk powder<br />
Total aflatoxin in wheat<br />
and soybean<br />
B1, B2, G1 and G2 in<br />
apples, pears, apple juice<br />
and pear jams<br />
B1, B2, G1 and G2 in corn<br />
and peanut meal<br />
M1 in milk and condensed,<br />
evaporated and non-fat<br />
powdered milk<br />
B1, B2, G1 and G2 in<br />
ginger root and oleoresin<br />
B1in black olives<br />
B1, B2, G1 and G2 in<br />
cereal and nuts<br />
M1in milk<br />
Detection<br />
limit (ppb)<br />
0.05<br />
Not stated<br />
B1, G1 = 2.0-<br />
2.8,<br />
B2, G2 = 2.0<br />
Corn = 2.0<br />
Peanut meal =<br />
3.0<br />
Milk = 0.1<br />
Others = 0.2<br />
Not stated<br />
3000-7000<br />
Not stated<br />
0.005<br />
Reference<br />
23<br />
Bijl and<br />
Peteghem (1985)<br />
Shotwell et al.<br />
(1977b)<br />
Gimeno and<br />
Martins (1983)<br />
Bicking et al.<br />
(1983)<br />
Fukayama et al.<br />
(1980)<br />
Trucksess and<br />
Stoloff (1980)<br />
Tutour et al.<br />
(1984)<br />
Saleemullah et<br />
al. (1980)<br />
Gauch et al.<br />
(1982)
No<br />
46<br />
47<br />
48<br />
49<br />
50<br />
51<br />
52<br />
53<br />
54<br />
Method<br />
OPLC-FD<br />
LC-MS<br />
ELISA<br />
ELISA<br />
ELISA<br />
ELISA<br />
ELISA<br />
ELISA ST<br />
MECC<br />
Table 1.2 Continued<br />
Aflatoxin / samples<br />
B1, B2, G1 and G2 in<br />
maize, fish, wheat, peanuts,<br />
rice and sunflower seeds<br />
B1, B2, G1 anf G2 in figs<br />
and peanuts<br />
M1 in milk, yogurt,<br />
cheddar and Brie<br />
M1 in infant milk products<br />
and liquid milk<br />
M1in curd and cheese<br />
M1 in cheese<br />
B1, B2, G1 and G2 in<br />
sesame butter and tahini<br />
B1in corn<br />
B1, B2, G1 and G2 in<br />
standard samples<br />
Detection<br />
limit (ppb)<br />
Not stated<br />
1.0<br />
0.01 – 0.05<br />
Not stated<br />
Not stated<br />
Not stated<br />
Not stated<br />
5.0<br />
0.05 – 0.09<br />
Reference<br />
Papp et al.<br />
(2002)<br />
Vahl and<br />
Jargensen<br />
(1998)<br />
Fremy and Chu.<br />
(1984)<br />
Rastogi et al.<br />
(1977)<br />
Grigoriadou et<br />
al. (2005)<br />
Sarimehtoglu et<br />
al. (1980)<br />
Nilufar and<br />
Boyacio (2000)<br />
Beaver et al.<br />
(1991)<br />
Cole et al.<br />
(1992)<br />
24
No<br />
55<br />
56<br />
57<br />
58<br />
59<br />
60<br />
61<br />
62<br />
63<br />
Method<br />
MECC FS<br />
IAC<br />
IAC<br />
FI-IA-AD<br />
GC-FID<br />
ECS with<br />
BLMs<br />
DPP<br />
SIIA<br />
MS<br />
Table 1.2 Continued<br />
Aflatoxin / samples<br />
B1, B2, G1 and G2 in feed<br />
samples<br />
Total aflatoxins and B1 in<br />
nuts<br />
B1 in mixed feeds<br />
M1 in raw milk<br />
B1, B2, G1 and G2 in<br />
culture medium<br />
M1 in skimmed milk<br />
B1 in rice, milk, corn and<br />
peeletised rabbit feed<br />
M1in an artificial<br />
contaminated food<br />
B1, B2, G1 and G2 in<br />
contaminated corns<br />
Detection<br />
limit (ppb)<br />
0.02 – 0.06<br />
Total = 1.0<br />
B1 = 0.2<br />
2.0<br />
0.011<br />
Not stated<br />
761<br />
25<br />
0.2<br />
10<br />
Reference<br />
Pena et al.<br />
(2002)<br />
Leszezynska et<br />
al. (1998)<br />
Shannon et al.<br />
(1984)<br />
Badea et al.<br />
(1977)<br />
Goto et al.<br />
(2005)<br />
Androu et al.<br />
(1997)<br />
Smyth et al.<br />
(1979)<br />
Garden and<br />
Strachen (2001)<br />
Plattner et al.<br />
(1984)<br />
25
No<br />
64<br />
65<br />
66<br />
67<br />
68<br />
69<br />
70<br />
71<br />
72<br />
Method<br />
IAFB<br />
IACLC<br />
IACLC<br />
ICA<br />
TLC<br />
HPLC-FD<br />
LC-MS<br />
LC-MS<br />
TLC<br />
Table 1.2 Continued<br />
Aflatoxin / samples<br />
B1in standard sample<br />
B1 and total aflatoxin in<br />
peanut butter, pistachio<br />
paste, fig paste and paprika<br />
powder<br />
B1, B2, G1 and G2 in<br />
maize and peanut butter<br />
B1 in rice, corn and wheat<br />
B1, B2, G1 and G2 in<br />
peppers<br />
B1, B2, G1 and G2 in<br />
traditional herbal<br />
medicines<br />
M1 in bovine milk<br />
M1in sidestream cigarette<br />
smoke<br />
M1in milk and milk<br />
products<br />
Detection<br />
limit (ppb)<br />
0.1<br />
Not stated<br />
B1, B2, G1,<br />
G2 = 2.0<br />
2.5<br />
Not stated<br />
Not stated<br />
0.02 – 0.15<br />
3.75<br />
0.0125<br />
Reference<br />
Carlson et al.<br />
(2002)<br />
Stroka et al.<br />
(2000)<br />
Chan et al.<br />
(1984)<br />
Xiulan et al.<br />
(2006)<br />
Erdogan (2004)<br />
Ali et al. (2005)<br />
Sorensen and<br />
Elbaek (2005)<br />
Edinboro and<br />
Karnes (2005)<br />
Bakirci (2001)<br />
26
No<br />
73<br />
74<br />
75<br />
76<br />
77<br />
78<br />
79<br />
80<br />
81<br />
82<br />
Method<br />
ELISA<br />
TLC<br />
Ridascreen<br />
Test<br />
Ridascreen<br />
Test<br />
TLC<br />
ECS-ELISA<br />
HPLC-FD<br />
HPLC-FD<br />
LC-MS<br />
ELISA-SPE<br />
Table 1.2 Continued<br />
Aflatoxin / samples<br />
B1and M1 in food and dairy<br />
products<br />
M1 in Iranian feta cheese<br />
M1 in pasteurised milk<br />
M1 in raw milk<br />
B1in melon seeds<br />
B1in barley<br />
B1, B2, G1 and G2 in bee<br />
pollen<br />
M1in milk and cheese<br />
B1, B2, G1 and G2 in<br />
peanuts<br />
M1 in milk<br />
Detection<br />
limit (ppb)<br />
Not stated<br />
0.015<br />
Not stated<br />
0.245<br />
2.0<br />
0.02 – 0.03<br />
Not stated<br />
Milk = 0.001,<br />
Cheese =<br />
0.005<br />
B1, B2, G1,<br />
G2 = 0.125 –<br />
2.50<br />
0.025<br />
Reference<br />
Aycicek et al.<br />
(2005)<br />
Kamkar et al.<br />
(2005)<br />
Alborzi et al.<br />
(2005)<br />
Sassahara et al.<br />
(2005)<br />
Bankole et al.<br />
(2005b)<br />
Ammida et al.<br />
(2004)<br />
Gonzalez et al.<br />
(2005)<br />
Manetta et al.<br />
(2005)<br />
Blesa et al.<br />
(2001)<br />
Micheli et al.<br />
(2005)<br />
27
Notes:<br />
Table 1.2 Continued<br />
AD: Amperometric detector<br />
IAC: Immunoaffinity chromatography<br />
IACLC: Immunoaffinity column liquid chromatogtaphy<br />
IAFB: Immunoaffinity fluorometer biosensor<br />
BLMs: Bilayer lipid membranes<br />
DPP: Differential pulse polarography<br />
ECS: Electrochemical sensing<br />
ECS-ELISA: Electrochemical sensing based on indirect ELISA<br />
ELISA: Enzyme linked immunosorbant assay<br />
ELISA ST: Enzyme linked immunosorbant assay for screening<br />
ELISA-SPE: Enzyme linked immuno sorbant assay combined with screen<br />
printed electrode<br />
FD: Fluorescence detector<br />
FI-IA-AD: Flow-injection immunoassay with amperometric detector<br />
GC-FID: Gas chromatography with flame ionization detecter<br />
HPLC: High pressure liquid chromatography<br />
HPTLC: High pressure thin liquid chromatography<br />
HPTLC-SPE: High pressure thin liquid chromatography with solid phase<br />
extraction<br />
ICA: Immnuochromatographic assay<br />
MECC: Micellar electrokinetic’s capillary chromatography<br />
MS: Mass spectrometry<br />
OPLC: Over pressured liquid chromatography<br />
SIIA: Sequential injection immunoassay test<br />
TLC: Thin layer chromatography<br />
TLC-FDs: Thin layer chromatography with fluorescence densitometer<br />
UVD: Ultraviolet detector<br />
1.2.5 Electrochemical Properties of Aflatoxins<br />
Polarographic determination of aflatoxin has been studied by Smyth et al.<br />
(1979) using DPP technique to determine AFB1, AFB2, AFG1 and AFG2 in food<br />
samples using Britton-Robinson buffer solution as the supporting electrolyte. They<br />
found that all aflatoxins exhibited similar polarographic behaviour over a pH range 4 –<br />
28
11. They also obtained that the best-defined waves for analytical purposes were in<br />
Britton-Robinson buffer at pH 9. Slight differences in the potential of reduction of<br />
aflatoxins have been observed owing to their slight differences in structure. They found<br />
that the half wave potentials of reduction of the various aflatoxins were AFB1 = -1.26<br />
V, AFB2 = -1.27 V, AFG1 = -1.21 V and AFG2 = -1.23 V (all versus SCE). The limit<br />
of detection for AFB1 in pure solutions was about 2 x 10 -8 M (25 ppb).<br />
Gonzalez et al. (1998) have studied the cyclic voltammetry of AFG1 in<br />
methanol: water (1:1, v/v) solution on different electrodes such as glassy carbon,<br />
platinum and gold electrodes. They found that AFG1 gave high peak current at a<br />
potential of about +1.2V using glassy carbon electrode compared to other types of<br />
working electrode. The electro activity of the studied aflatoxins increased in the order<br />
AFG2 < AFB1 < AFB2 < AFG1. This order reflects the ability of the aflatoxins<br />
molecules to undergo electrochemical oxidation on glassy carbon electrode.<br />
Duhart et al. (1988) have determined all types of aflatoxin using HPLC<br />
technique with electrochemical detection. They have used differential-pulse mode at<br />
the dropping mercury electrode (DME) with 1 s drop time for detection system, large<br />
drop size, current scale of 0.5 µA and modulation amplitude of 100 mV. They have<br />
found that using mobile phase which consisted of 62.7% BRB at pH 7, 17.9% methanol<br />
and 19.4% acetonitrile, the peak potentials for all aflatoxins were slightly different<br />
which were AFB1 = -1.37 V, AFB2 = -1.36 V, AFG1 = -1.30 V and at -1.30 V for<br />
AFG2. Due to the fairly close together of peak potentials, a potential of -1.28 V has<br />
been selected for detection purposes of these aflatoxins together with HPLC technique.<br />
They found that using this technique average percentage recoveries for peanut butter<br />
samples (n = 4) which have been spiked with a mixture of the four aflatoxins were<br />
AFB1 (76%), AFB2 (77%), AFG1 (87%) and AFG2 (81%). This results show that a<br />
major advantage of this technique was it did not require a derivatisation step as is<br />
common for fluorescent detection.<br />
29
1.3 Voltammetric Techniques<br />
1.3.1 Voltammetric Techniques in General<br />
Voltammetry is an electrochemical method in which current is measured as a<br />
function of the applied potential. It is a branch of electrochemistry in which the<br />
electrode potential, or the faradaic current or both are changed with time. Normally,<br />
there is an interrelationship between all three of these variables (Bond et al., 1989).<br />
The principle of this technique is a measurement of the diffusion controlled current<br />
flowing in an electrolysis cell in which one electrode is polarisable (Fifield and Kealey,<br />
2000). In this technique a time dependent potential is applied to an electrochemical<br />
cell, and the current flowing through the cell is measured as a function of that potential.<br />
A plot of current which is directly proportional to the concentration of an electroactive<br />
species as a function of applied potential is called a voltammogram. The<br />
voltammogram provides quantitative and qualitative information about the species<br />
involved in the oxidation or reduction reaction or both at the working electrode.<br />
Polarography is the earliest voltammetric technique which was developed by<br />
Jaroslav Heyrovsky (1890-1967) in the early 1920s, for which he was awarded the<br />
Nobel Prize in Chemistry in 1959. It was the first major electro analytical technique<br />
(Barek et al., 2001a). Since then many different forms of voltammetry have been<br />
developed such as direct current polarography (DCP), normal polarography (NP),<br />
differential pulse polarography (DPP), square-wave polarography (SWP), alternate<br />
current polarography (ACP), cyclic voltammetry (CV), stripping voltammetry (SV),<br />
adsorptive stripping voltammetry (AdSV) and adsorptive catalytic stripping<br />
voltammetry (AdCSV) techniques. Working electrodes and limit of detection (LOD)<br />
for these modern voltammetric techniques are shown in Table 1.3 (Barek et al., 2001a).<br />
The advantage of this technique include high sensitivity where quantitative and<br />
qualitative determination of metals, inorganic and organic compounds at trace levels,<br />
10 -4 – 10 -8 M (Fifield and Kealey, 2000), selectivity towards electro active species<br />
30
(Barek et al., 2001b), a wide linear range, portable and low-cost instrumentation,<br />
speciation capability and a wide range of electrode that allow assays of many types of<br />
samples such as environmental samples (Zhang et al., 2002; Ghoneim et al., 2000;<br />
Buffle et al., 2005), pharmaceutical samples (Yaacob, 1993; Yardimer et al., 2001;<br />
Abdine et al., 2002; Hilali et al., 2003 and Carapuca et al., 2005 ), food samples<br />
(Ximenes et al., 2000; Volkoiv et al., 2001); Karadjova et al., 2000; Sabry and Wahbi,<br />
1999 and Sanna et al., 2000), dye samples (Mohd Yusoff et al., 1998 and Gooding et<br />
al., 1997) and forensic samples (Liu et al., 1980; Wasiak et al., 1996; Pourhaghi-Azar<br />
and Dastangoo, 2000; Woolever et al., 2001).<br />
Various advances during the past few years have pushed the detectability of<br />
voltammetric techniques from the submicromolar level for pulse voltammetric<br />
techniques to the subpicomolar level by using an adsorptive catalytic stripping<br />
voltammetry (Czae and Wang, 1999). The comparison of using polarographic and other<br />
analytical techniques in different application fields is depicted in Table 1.4 (Barek et al.,<br />
2001a).<br />
1.3.2 Voltammetric Measurement<br />
1.3.2.1 Instrumentation<br />
Voltammetry technique makes use of a three-electrode system such as working<br />
electrode (WE), reference electrode (RE) and auxiliary electrode (AE). The whole<br />
system consist of a voltammetric cell with a various volume capacity, magnetic stirrer<br />
and gas line for purging and blanketing the electrolyte solution.<br />
31
Table 1.3 Working electrodes and LOD for modern polarographic and<br />
voltametric techniques<br />
Technique<br />
TAST<br />
Normal pulse polarography (NPP)<br />
Normal pulse voltammetry (NPV)<br />
Stair case voltammetry (SCV)<br />
Differential pulse polarography (DPP)<br />
Differential pulse voltammetry (DPV)<br />
Square wave polarography (SWP)<br />
Square wave voltammetry (SWV)<br />
Alternate current polarography (ACP)<br />
Alternate current voltammetry (ACV)<br />
Anodic stripping voltammetry (ASV)<br />
Cathodic stripping voltammetry (CSV)<br />
Potentiometric stripping analysis (PSA)<br />
Working<br />
electrode<br />
DME<br />
DME<br />
HMDE<br />
HMDE<br />
DME<br />
HMDE<br />
DME<br />
HMDE<br />
DME<br />
HMDE<br />
HMDE<br />
MFE<br />
MFE<br />
LOD<br />
~ 10 -6 M<br />
~ 10 -7 M<br />
~ 10 -7 M<br />
~ 10 -7 M<br />
~ 10 -7 M<br />
~ 10 -8 M<br />
~ 10 -8 M<br />
~ 10 -8 M<br />
~ 10 -7 M<br />
~ 10 -8 M<br />
~ 10 -10 M<br />
~ 10 -9 M<br />
~ 10 -12 M<br />
32
Table 1.4 The application range of various analytical techniques and their<br />
concentration limits when compared with the requirements in different fields of<br />
chemical analysis.<br />
Field of chemical analysis<br />
Environmental monitoring<br />
Toxicology<br />
Pharmacological studies<br />
Food control<br />
Forensic<br />
Drug assay<br />
Analytical techniques<br />
Adsorptive stripping voltammetry<br />
Anodic / cathodic stripping voltammetry<br />
Differential pulse voltammetry<br />
Differential pulse polarography<br />
Tast polarography<br />
d.c.polarography<br />
spectrophotometry<br />
HPLC with voltammetric detection<br />
HPLC with fluorescence detection<br />
Concentration range<br />
10 -12 M to 10 -4 M<br />
10 -11 M to 10 -2 M<br />
10 -10 M to 10 -4 M<br />
10 -8 M to 10 -4 M<br />
10 -7 M to 10 -3 M<br />
10 -5 M to 10 -2 M<br />
Application range<br />
10 -12 M to 10 -7 M<br />
10 -11 M to 10 -6 M<br />
10 -8 M to 10 -3 M<br />
10 -7 M to 10 -3 M<br />
10 -6 M to 10 -3 M<br />
10 -5 M to 10 -3 M<br />
10 -6 M to 10 -3 M<br />
10 -7 M to 10 -3 M<br />
10 -9 M to 10 -3 M<br />
33
Analytical techniques<br />
Spectrofluorometry<br />
Atomic absorption spectrometry<br />
Atomic fluorescence spectrometry<br />
Radioimmunoanalysis<br />
Neutron activation analysis<br />
x-ray fluorescence analysis<br />
mass spectrometry<br />
Table 1.4 Continued<br />
Application range<br />
A typical arrangement for a voltammetric electrochemical cell is shown in Figure 1.7<br />
(Fifield and Haines, 2000).<br />
N2<br />
Inlet<br />
RE WE<br />
10 -9 M to 10 -3 M<br />
10 -8 M to 10 -3 M<br />
10 -9 M to 10 -3 M<br />
10 -13 M to 10 -3 M<br />
10 -9 M to 10 -3 M<br />
10 -7 M to 10 -3 M<br />
10 -9 M to 10 -3 M<br />
Figure 1.7 A typical arrangement for a voltammetric electrochemical cell<br />
(RE: reference electrode, WE: working electrode, AE: auxiliary electrode)<br />
AE<br />
Cell<br />
cover<br />
Solution<br />
Level<br />
Stirrer<br />
34
The arrangement of the electrodes within the cell is important. The RE is<br />
placed close to the WE and the WE is located between the RE and the AE. Using the<br />
three-electrode-cell concept, a potentiostat monitors the voltage over the WE and AE<br />
which is automatically adjusted to give the correct applied potential. This is obtained<br />
by continuously measuring the potential between the WE and the RE, by comparing it<br />
to the set voltage and by adjusting the applied voltage accordingly if necessary. The<br />
cell material depends on application that it is usually a small glass beaker with a close<br />
fitting lid, which includes ports for electrodes and a nitrogen gas purge line for<br />
removing dissolved oxygen and an optional stir bar.<br />
The WE is the electrode where the redox reaction of electroactive species takes<br />
place and where the charge transfer occurs. It is potentiostatically controlled and can<br />
minimise errors from cell resistance. It is made of several different materials including<br />
mercury, platinum, gold, silver, carbon, chemically modified and screen printed<br />
electrode. The performance of voltammetry is strongly influenced by the WE. The<br />
ideal characteristics of this electrode are a wide potential range, low resistance,<br />
reproducible surface and be able to provide a high signal-to-noise response. The WE<br />
must be made of a material that will not react with the solvent or any component of the<br />
solution over as wide a potential range as possible. The potential window of such<br />
electrodes depends on the electrode material and the composition of the electrolyte as<br />
summarised in Table 1.5 below (Wang, 2000). Majority of electrochemical methods<br />
use HMDE and MFE (Economou and Fielden, 1995) for use in the cathodic potential<br />
area, whereas solid electrode such as gold, platinum, glassy carbon, carbon paste are<br />
used for examining anodic processes.<br />
Mercury has been used for the WE in earlier voltammetry techniques,<br />
including polarography. Since mercury is a liquid, the WE often consists of a drop<br />
suspended from the end of a capillary tube. It has several advantages including its high<br />
over potential for the reduction of hydronium ion to hydrogen gas. This allows for the<br />
application of potential as negative as -1.0 V versus SCE in acidic solution, and -2.0V<br />
versus SCE in basic solution.<br />
35
Table 1.5 List of different type of working electrodes and its potential windows.<br />
ELECTRODE<br />
Hg<br />
Pt<br />
C<br />
ELECTROLYTE<br />
1 M H2SO4<br />
1 M KCl<br />
1 M NaOH<br />
0.1 M Et4NH4 OH<br />
1 M H2SO4<br />
1 M NaOH<br />
1 M HClO4<br />
0.1M KCl<br />
POTENTIAL WINDOWS<br />
+0.3 to -0.1V<br />
0 to -1.9V<br />
-0.1 to -2.0V<br />
-0.1 to -2.3V<br />
+1.0 to -0.5V<br />
+0.5 to -1.0V<br />
+1.5 to -1.0V<br />
+1.0 to -1.3V<br />
Other advantages of using mercury as the working electrode include the ability<br />
of metals to dissolve in the mercury, resulting in the formation of an amalgam. The<br />
greatest advantages of this electrode is that new drops or new thin mercury films can be<br />
readily formed, and this cleaning process removes problems that could be caused by<br />
contamination as a result of previous analysis. In contrast, this is not the generally case<br />
for electrodes made from other materials, with the possible exception of carbon<br />
electrodes, where the electrode cleaning is made of cutting off a thin layer of the<br />
previous electrode surface. Another advantage is the possibility to achieve a state of<br />
pseudostationary for linear sweep voltammetry (LSV) using higher scan rate.<br />
Miniaturised and compressible mercury electrode offer new possibilities in<br />
voltammetry especially for determination of biologically active species and surfactant.<br />
One limitation of mercury electrode is that it is easily oxidised at + 0.3 V and cannot be<br />
used at potential more positive than + 0.4 V versus the SCE, depending on the<br />
composition of the solution (Dahmen, 1986 and Fifield and Haines, 2000). At this<br />
potential, mercury dissolves to give an anodic polarographic wave due to formation of<br />
mercury (I) (Skoog et al., 1996).<br />
36
There are three main types of mercury electrode used in voltammetry<br />
techniques including hanging mercury drop electrode (HMDE), dropping mercury<br />
drop electrode (DME) and static mercury drop electrode (SMDE). In the HMDE, a<br />
drop of the desired size is formed and hanged at the end of a narrow capillary tube. In<br />
the DME, mercury drops form at the end of the capillary tube as a result of gravity.<br />
The drop continuously grows and has a finite lifetime of several seconds. At the end<br />
of its lifetime the mercury drop is dislodged, either manually or by the gravity, and<br />
replaced by a new drop. In the SMDE, it uses a solenoid-driven plunger to control<br />
the flow of mercury. It can be used as either HMDE or DME. A single activation of<br />
solenoid momentarily lifts the plunger, allowing enough mercury to flow through the<br />
capillary to form a single drop. To obtain a dropping mercury electrode the solenoid<br />
is activated repeatedly. The diagram of HMDE is shown in Figure 1.8 (Metrohm,<br />
2005).<br />
Figure 1.8 A diagram of the HMDE<br />
37
Other type of mercury electrode is the controlled growth mercury drop<br />
electrode (CGME). In this electrode, a fast response valve controls the drop growth.<br />
The cross sectional view of the CGME is shown in Figure 1.9 (BAS, 1993).<br />
Figure 1.9 A diagram of the CGME<br />
The capillary has a stainless stell tube embedded in the top end of the<br />
capillary. Mercury flow through the capillary is controlled by a fast response valve.<br />
The valve is rubber plug at the end of a shaft which when displaced slightly up will<br />
allow mercury to flow. Since the contact between filament of mercury in the capillary<br />
and the reservoir is a stainless steel tube, the electrode has low resistance. The total<br />
resistance from the contact point to the mercury is about 7 ohm. The valve seal is<br />
controlled by the valve seal adjustment knob. The opening of this valve is controlled<br />
by a computer-generated pulse sequence, which leads to a stepped increase in the<br />
drop size. Changing the number of pulse and/or the pulse width, so a wide range of<br />
drop sizes is available can therefore vary the drop size. Varying the time between the<br />
38
pulses can control the rate of growth of the mercury drop. Therefore, a slowly<br />
growing mercury drop suitable for stripping experiments can be generated. An<br />
important advantage of the CGME compared to HMDE is no contamination of the<br />
capillary due to back diffusion (Dean, 1995).<br />
In addition to the mercury drop electrode, mercury may be deposited onto the<br />
surface of a solid electrode to produce mercury film electrode (MFE). The MFE is<br />
based on an electrochemically deposited mercury film on conventional substrate<br />
electrode such as a solid carbon, platinum, or gold electrode. The solid electrode is<br />
placed in solution of mercury ion (Hg 2+ ) and held at a potential at which the reduction<br />
of Hg 2+ to Hg is favorable, forming a thin mercury film. It displays the properties of a<br />
mercury electrode, having various electro analytical advantageous such as a high<br />
hydrogen evolution over potential and simple electrochemistry of many metals and<br />
other species of analytical interest. For example, Castro et al. (2004) have used thinfilm<br />
coated on a glassy carbon electrode (GCE) for quantitative determination of<br />
polycyclic aromatic hydrogen (PAH). In this experiment, they plated the mercury over<br />
5 min at a cell voltage of -0.9 V. Economou and Fielden (1995) have developed a<br />
square wave adsorptive stripping voltammetric technique on the MFE for study of<br />
riboflavin. In this work, riboflavin was absorbed on the MFE at a potential of 0.0 V<br />
(vs. Ag/AgCl) in pH 12.0 of electrolyte solution.<br />
However, the increased risks associated with the use, manipulation and disposal<br />
of metallic mercury or mercury salt, have led to general trend for more environmentalfriendly<br />
analytical methods such as using bismuth film electrode (BFE) instead of<br />
mercury (Kefala et al., 2003; Economou, 2005; Lin et al., 2005a and Lin et al., 2005b ).<br />
The BFE consists of a thin bismuth film deposited on a carbon paste substrate that has<br />
shown to offer comparable performance to the MFE. Morfobos et al. (2004) have<br />
studied square wave adsorptive stripping voltammetry (SWAdSV) on a rotating-disc<br />
BFE for simultaneous determination of nickel (II) and cobalt (II). Hocevar et al. (2005)<br />
have developed a novel bismuth-modified carbon paste (Bi-CPE) for a convenient and<br />
39
eliable electrochemical sensor for trace heavy metals detection in conjunction with<br />
stripping electroanalysis.<br />
In another study, using pencil-lead BFE as the working electrode, Demetriades<br />
et al. (2004) have determined trace metals by anodic stripping voltammetry (ASV).<br />
They revealed that pencil-lead BFE were successfully applied to the determination of<br />
plumbum and zinc in tap water with results in satisfactory agreement with atomic<br />
absorption spectrometry (AAS). Zahir and Abd Ghani (1997) have developed a pencil<br />
2B graphite paste electrode which was fabricated with polymerized 4-vinylpyridine for<br />
glucose monitoring.<br />
Other solid or metal electrode commonly used as WE are carbon, platinum<br />
(Salavagione et al., 2004; Santos and Machado, 2004; Aslanoglu and Ayne, 2004 ),<br />
gold (Hamilton and Ellis,1980; Parham and Zargar, 2001; Parlim and Zarger, 2003;<br />
Moressi et al., 2004; Munoz et al., 2005;), graphite (Orinakova et al., 2004; Pezzatini et<br />
al., 2004; Jin and Lin, 2005), diamond (Sonthalia et al., 2004) and silver (Iwamoto et<br />
al., 1984). Solid electrodes based on carbon are currently in widespread use in<br />
voltammetric technique, primarily because of their broad potential window, low<br />
background current, rich surface chemistry, low cost, chemical inertness, and suitability<br />
for various sensing and detection application (Wang, 2000). It includes glassy carbon<br />
electrode (GCE), carbon paste electrode (CPE), chemically modified electrode (CME)<br />
and screen-printed electrode (SPE).<br />
For the GCE, the usual electrode construction is a rod of glassy carbon, sealed<br />
into an inert electrode body, a disc of electrode material is exposed to the solution. It is<br />
the most commonly used carbon electrode in electro analytical application (Ozkan and<br />
Uslu, 2002; Ibrahim et al., 2003; Erk, 2004). The cleaning of this electrode is<br />
important, to maintain a reactive and reproducible surface. Pre-treated<br />
electrochemically GCE have increased oxygen functionalities that contribute to more<br />
rapid electron transfer. Wang et al. (1997) have used in adsorptive potentiometric<br />
stripping analysis of tamoxifen, a nonsteriodal anti-estrogen used widely for the<br />
40
treatment of hormone-dependent breast cancer. The electrode was anodised at + 1.7 V<br />
for 1 min in the electrolyte containing tomixifen. Using cyclic voltammetric technique,<br />
they found that a large definite anodic peak corresponding to the oxidation of the<br />
adsorbed drug at GCE at + 0.985 V. Other workers using GCE as the WE were Wang<br />
et al. (2004), Shi and Shiu (2004) and Ji et al. (2004).<br />
The CPE, a mixture of carbon powder and a pasting medium at certain ratio,<br />
were the result of an attempt to produce electrode similar to the dropping mercury<br />
electrode (Kizek et al., 2005). They are particularly useful for anodic studies, modified<br />
electrode and also for stripping analysis. CMEs are electrodes which have been<br />
deliberately treated with some reagents, having desirable properties, so as to take on the<br />
properties of the reagents (Arrigan, 1994; Kutner et al., 1998). A few examples of<br />
these applications were reported by Abbaspour and Moosavi, (2002), Abbas and<br />
Mostafa (2003); Ciucu et al. (2003); Ferancova et al. (2000) and Padano and Rivas<br />
(2000).<br />
SPE are increasingly being used for inexpensive, reproducible and sensitive<br />
disposable electrochemical sensors for determination of trace levels of pollutant and<br />
toxic compounds in environmental and biological fluids sample (Wring et al., 1991).<br />
A disposable sensor has several advantages, such as preventing contamination between<br />
samples, constant sensitivity and high reproducibility of different printed sensors (Kim<br />
et al., 2002). The most useful materials for printing electrochemical sensors could be<br />
carbon-based inks because they have a very low firing temperature (20-120° C) and can<br />
be printed on plastic substrate. Carbon can also be directly mixed with different<br />
compounds, such as mediator and enzymes. A few examples of the experiments which<br />
used SPE as the WE were reported by Kim et al. (2002), for detection of phenols using<br />
α-cyclodextrin modified screen printed graphite electrodes. Ohfuji et al. (2004) have<br />
constructed a glucose sensor based on a SPE and a novel mediator pyocyanin from<br />
Pseudomonas aeruginosa. Carpini et al. (2004) have studied oligonucleotide-modified<br />
screen printed gold electrodes for enzyme-amplified sensing of nucleic acid. Lupu et<br />
al. (2004) have developed SPE for the detection of marker analytes during wine<br />
41
making. In this work they have developed biosensors for malic acid and glucose with a<br />
limit of detection of 10 -5 M and 10 -6 M for malic acid and glucose respectively. The<br />
sensors were applied in the analysis of different samples of wine.<br />
Besides using macro-electrode, voltammetric technique also utilizes<br />
microelectrode (Lafleur et al. 1990) with the size of electrode radius much smaller than<br />
the diffusion-layer thickness, typically between 7 to 10 µM (Hutton et al., 2005 and<br />
Buffle and Tercier-Waeber, 2005) as the WE. It is constructed from the same materials<br />
as the macro-electrode but with a smaller diameter to enhance mass transport of analyte<br />
to the electrode surface due to smaller electrode than the diffusion layer. Hence,<br />
increasing signal-to noise ratio and measurement can be made in highly resistive media<br />
due to decrease of the ohmic drop that results when the electrode size reduced<br />
(Andrieux et al., 1990). The microelectrode with diameter as small as 2 µm, allow<br />
voltammetric measurements to be made on even smaller sample (Harvey, 2002). Aoki<br />
(1990) reported that ultra microelectrodes influence electrode kinetics more specifically<br />
than conventional electrode because of lateral diffusion promotes mass transport. Since<br />
it minimise uncompensated resistance, they are useful for determination of kinetic<br />
parameters. Almeida et al. (1998) have done voltammetric studies of the oxidation of<br />
the anti-oxidant drug dipyridamole (DIP) in acetonitrile and ethanol using ultra<br />
microelectrode (UME). In this work they studied cyclic voltammetric technique of the<br />
drug with the UME which was 12.7 µm diameters. They found that with that electrode,<br />
the diffusion current of DIP is proportional to the electrode radii for low scan rates in<br />
cyclic voltammetry.<br />
The second electrode used in the voltammetric system is auxiliary electrode<br />
(AE). The AE is made of an inert conducting material typically a platinum electrode<br />
wire (Wang, 2000). It provides a surface for a redox reaction to balance the process that<br />
occured at the surface of the WE. It does not need special care, such as polishing. In<br />
order to support the current generated at the WE, the surface area of the AE must be<br />
equal to or larger than of the WE. The function of the AE is to complete the circuit,<br />
allowing charge flow through the cell (Fifield and Haines, 2000). In an electro<br />
42
analytical experiment, there is no need to place the AE in a separate compartment since<br />
the diffusion of product that was produced by a redox reaction at the surface of the AE<br />
does not significantly interfere the redox reaction at the WE.<br />
The third electrode used in the voltammetric technique is reference electrode<br />
(RE). This RE provides a stable potential so that any change in cell potential is<br />
attributed to the working electrode. The major requirement for the RE is that the<br />
potential does not change during the recording voltammetric curve at different applied<br />
voltage (Heyrovsky and Zuman, 1968). The common RE are standard hydrogen<br />
electrode (SHE), calomel electrode (SCE) and silver/silver electrode (Ag/AgCl). The<br />
SHE is the reference electrode used to establish standard-state potential for other half<br />
reaction. It consists of a platinum electrode immersed in a solution in which the<br />
hydrogen ion activity is 1.00 and in which hydrogen gas is bubbled at a pressure of 1<br />
atm. The standard-state potential for the reaction;<br />
2H + (aq) + 2e - → H2 (g) (1.0)<br />
is 0.00 V for all temperatures. It is rarely used because it is difficult to prepare and<br />
inconvenient to use.<br />
The second reference electrode is the Standard Calomel Electrode (SCE)<br />
which is based on the redox couple between mercury chloride (Hg2Cl2) and Hg as<br />
below;<br />
Hg2Cl2(s) + 2e 2Hg(l) + 2Cl - (aq) (1.1)<br />
The potential of this electrode is determined by the concentration of chloride ion. It is<br />
constructed using an aqueous solution saturated with potassium chloride (KCl) which<br />
has a potential of + 0.2444 V at 25 0 C. It consists of an inner tube packed with a paste<br />
of Hg, Hg2Cl2 and saturated KCl. A small hole connects the two tubes, an asbestos fiber<br />
serves as a salt bridge to the solution in which the SCE is immersed.<br />
43
Other type of reference electrode is the Ag/AgCl electrode which is the most<br />
common RE since it can be used at higher temperature. This electrode is based on the<br />
redox couple between silver chloride ( AgCl ) and silver ( Ag ) as illustrated below;<br />
AgCl(s) + 2e Ag(s) + Cl - (1.2)<br />
The potential of this electrode is determined by the concentration of Cl - . For saturated<br />
KCl the potential is + 0.197 V whereas for 3.5 M KCl the potential electrode is + 0.205<br />
V at 25° C (Harvey, 2000).<br />
1.3.2.2 Solvent and Supporting Electrolyte<br />
Electrochemical measurements are commonly carried out in a medium which<br />
consists of solvent containing a supporting electrolyte. Sometimes in most cases,<br />
supporting electrolyte has to be added to the dissolved sample in an attempt to achieve<br />
the following (Heyrovsky and Zuman 1968);<br />
a) To make solution conductive<br />
b) To control the pH value so that organic substances are reduced in a<br />
given potential range and inorganic substances are not hydrolysed<br />
c) To ensure the formation of such complexes that give well<br />
developed and well separated waves<br />
d) To shift the hydrogen evaluation towards more negative potentials<br />
and to eliminate catalytic effects on hydrogen evolution<br />
e) To suppress unwanted maxima by addition of surface-active<br />
substances to the supporting electrolyte.<br />
The choice of the solvent is primarily by the solubility of the analyte, its redox<br />
activity and also by solvent properties such as electrical conductivity, electrochemical<br />
activity and chemical reactivity. The solvent should not react with the analyte and<br />
44
should not undergo electrochemical reaction over a wide potential range. In aqueous<br />
solution the cathodic potential is limited by the reduction of hydrogen ions:<br />
2 H + (aq) + 2 e - → H2 (g) (1.3)<br />
resulting hydrogen evolution current. The more acidic the solution the more positive<br />
is the potential of this current due to the reaction expressed by;<br />
E = E 0 H2/H+ - 0.059 pH (1.4)<br />
The composition of the electrolyte may affect the selectivity of voltammetric<br />
measurements. The ideal electrolyte should give well-separated and well-shaped peaks<br />
for all the analytes sought, so that they can be determined simultaneously. For example<br />
Kontoyannis et al. (1999) used tris buffered saline (TBS) at pH 7.4 as the supporting<br />
electrolyte for simultaneous determination of diazepam and liposome using DPP<br />
technique. Inam and Somer (1998) have determined selenium (Se) and lead (Pb)<br />
simultaneously in whole blood sample by the same technique using 0.1 M HCl as the<br />
supporting electrolyte. They observed that there were three peaks at -0.33 V, -0.54 V<br />
and -0.41 V which belonged to an intermetallic compound (PbSe), Se and Pb<br />
respectively. Barbiera et al. (1997) have developed anodic stripping voltammetric<br />
technique for simultaneous determination of trace amounts of zinc, lead and copper in<br />
rum without pre-treatment and in the absence of supporting electrolyte. They observed<br />
that there were three peaks at -0.92 V, -0.42 V and 0.05 V which belong to Zn, Pb and<br />
Cu respectively.<br />
Because of the sensitivity of the voltammetric method, certain impurities in<br />
supporting electrolyte can affect the accuracy of the procedures. It is thus necessary to<br />
prepare the supporting electrolyte from highly purified reagents and should not easily<br />
oxidised and reduced. To obtain acceptable ionic strength of supporting electrolyte,<br />
certain concentration should be prepared which is usually about 0.1 M. This level is a<br />
compromise between high conductivity and minimum contamination (Wang, 2000).<br />
45
The low ionic strength which is 0.01 M of supporting electrolyte (HClO4 – NaClO4)<br />
was very effective for the adsorptive accumulation of analyte on the electrode as found<br />
by Berzas et al. (2000) when they developed adsorptive stripping square wave<br />
technique for determination of sildenafil citrate (Viagra) in pharmaceutical tablet.<br />
Dissolved oxygen must be removed from supporting electrolyte first since the<br />
reduction of dissolved oxygen will cause two cathodic peaks at -0.05 V and -0.9 V<br />
(versus SCE) as reported by Fraga et al. (1998) and Reinke and Simon (2002). With<br />
increasing pH, the waves due to reduction of oxygen are shifted to more negative<br />
potential. The oxygen reduction generates a large background current, greater than that<br />
of the trace analyte, and dissolved oxygen therefore tends to interfere with<br />
voltammetric analysis (Colombo and van den Berg, 1998). The common method for the<br />
removal of dissolved oxygen is by purging with an inert gas such as nitrogen or argon<br />
where longer time may be required for large sample volume or for trace measurements.<br />
To prevent oxygen from reentering, the cell should be blanketed with the gas while the<br />
voltammogram is being recorded. However, this conventional procedure is time<br />
consuming and not suitable for flow analysis. Due to this reason, Colombo and van den<br />
Berg (1998) have introduced in-line deoxygenating for flow analysis with voltammetric<br />
detection. They have used an apparatus which is based on the permeation of oxygen<br />
through semi-permeable silicone tubing into an oxygen free chamber and enables the<br />
determination of trace metals by flow analysis with voltammetric determination.<br />
1.3.2.3 Current in Voltammetry<br />
When an analyte is oxidised at the working electrode, a current passes electrons<br />
through the external electric circuitry to the auxiliary electrode, where reduction of the<br />
solvent or other components of the solution matrix occurs. Reducing an analyte at the<br />
working electrode requires a source of electrons, generating a current that flows from<br />
the auxiliary electrode to the cathode. In either case, a current resulting from redox<br />
reaction at the working electrode and auxiliary electrode is called a faradaic current. A<br />
current due to the analyte’s reduction is called a cathodic current. Anodic currents are<br />
46
due to oxidation reaction. The magnitude of the faradaic current is determined by the<br />
rate ofthe resulting oxidation or reduction reaction at the electrode surface. Two factors<br />
contribute to the rate of the electrochemical reaction which are the rate at which the<br />
reactants and products are transported to and from the electrode, and the rate at which<br />
electron pass between the electrode and the reactants and products in solution.<br />
There are three modes of mass transport that influence the rate at which reactant<br />
and products are transported to and from the electrode surface which are diffusion,<br />
migration and convection. Difussion from a region of high concentration to region of<br />
low concentration occurs whenever the concentration of an ion or molecule at the<br />
surface of electrode is different from that in bulk solution. When the potential applied<br />
to the WE is sufficient to reduce or oxidise the analyte at the electrode surface, a<br />
concentration gradient is established. The volume of solution in which the<br />
concentration gradient exists is called the diffusion layer. Without other modes of mass<br />
transport, the width of the diffusion layer increases with time as the concentration of<br />
reactants near electrode surface decreases. The contribution of diffusion to the rate of<br />
mass transport is time-dependent.<br />
Convection occurs when a mechanical means is used to carry reactants toward<br />
the electrode and to remove products from the electrode. Ther most common means of<br />
convection is to stirr the solution using a stir bar. Other methods include rotating the<br />
electrode and incorporating the electrode into a flow cell.<br />
Migration occurs when charged particles in solution are attracted or repelled<br />
from an electrode that has a positive or negative surface charge. When the electrode is<br />
positively charged, negatively charged particles move toward the electrode, while the<br />
positive charged particles move toward the bulk solution. Unlike diffusion and<br />
convection, migration only affects the mass transport of charged particles.<br />
The rate of mass transport is one factor influencing the current in voltammetry<br />
experiment. When electron transfer kinetics are fast, the redox reaction is equilibrium,<br />
47
and the concentrations of reactants and products at the electrode are those psecified by<br />
Nersnt Equation. Such systems are considered electrochemically reversible. In other<br />
system, when electron transfer kinetics are sufficiently slow, the concentration of<br />
reactants and products at the electrode surface, and thus the current, differ from that<br />
predicted by the Nersnt euqation. In this case the system is electrochemically<br />
irreversible.<br />
Other currents that may exist in an electrochemical cell those are unrelated to<br />
any redox reaction are nonfaradaic and residual currents. The nonfaradaic current must<br />
be accounted for if the faradaic component of the measured current is to be determined.<br />
This current occurs whenever the electrode’s potential is changed. Another type of nonfaradaic<br />
current is charging current which occur in electrochemical cell due to the<br />
electrical double layer’s formation. Residual current is a small current that inevitably<br />
flows through electrochemical cell even in the absence of analyte (Harvey, 2000).<br />
1.3.2.4 Quantitative and Qualitative Aspects of Voltammetry<br />
Quantitative information is obtained by relating current to the concentration of<br />
analyte in the bulk solution and qualitative information is obtained from the<br />
voltammogram by extracting the standard-state potential for redox reaction. The<br />
concentration of the electroactive species can be quantitatively determined by the<br />
measurement of limiting current which is linear function of the concentration of electro<br />
active species in bulk solution.<br />
Half- potential serves as a characteristic of a particular species which undergoes<br />
reduction or oxidation process at the electrode surface in a given supporting electrolyte,<br />
and it is independent of the concentration of that species. Its function in the qualitative<br />
determination is the same as retention time in chromatographic technique.<br />
48
1.3.3 Type of Voltammetric Techniques<br />
1.3.3.1 Polarography<br />
Polarography is a subclass of voltammetry in which the WE is the DME. This<br />
technique has been widely used for the determination of many important reducible<br />
species since the DME has special properties particularly its renewable surface and<br />
wide cathodic potential range. In this technique, it takes place in an unstirred solution<br />
where a limiting current is diffusion limiting current (Harvey, 2000). Each new<br />
mercury drop grows in a solution whose composition is identical to that of the initial<br />
bulk solution. The relationship between the concentration of analyte, CA, and limiting<br />
current ( Id ) is given by Ilikovic equation ( Ewing, 1997; Heyrosky, 1968; Ilkovic,<br />
1934 and Dahmen,1986).<br />
I<br />
d<br />
1<br />
2<br />
2<br />
1<br />
3 6<br />
= 708nD<br />
m t C<br />
(1.5)<br />
where:<br />
n = number of electrons transferred in the redox reaction<br />
D = analyte’s diffusion coefficient ( cm 2 sec -1 )<br />
m = flow rate of mercury drop (g sec -1 )<br />
t = drop time (sec)<br />
CA = concentration of depolariser (mol l -1 )<br />
The above equation represents the current at the end of the drop life. The average<br />
current (Iave) over the drop life is obtained by integrating the current over this time<br />
period:<br />
I ave<br />
= 607nD<br />
A<br />
1<br />
2 m 3<br />
2<br />
t 6<br />
1<br />
C A (1.6)<br />
From the above equation, there is a linear relationship between diffusion current and<br />
concentration of electroactive species. It also indicates that the limiting diffusion<br />
49
current is a function of the diffusion coefficient which depends on the size and shape<br />
of the diffusion particle. As compared to another technique such as cyclic<br />
voltammetry technique, in this technique, the peak current is directly proportional to<br />
concentration and increases with the square root of the scan rate as given by the<br />
Randles-Sevcik equation (Equation 1.7) for a reversible system (Wang, 2000).<br />
Ip = (2.69 x 10 5 ) n 3/2 ACD 1/2 υ 1/2 (1.7)<br />
where;<br />
n = number of electron<br />
A = electrode area (cm 2 )<br />
C = concentration (mol cm -3 )<br />
D = diffusion coefficient (cm 2 s -1 )<br />
υ = scan rate (V s -1 )<br />
There are several types of polarographic techniques as was mentioned earlier.<br />
Polarography is used extensively in the analysis of metal ion, inorganic anions and<br />
organic compounds containing easily reducible or oxidisable functional group. A list<br />
of electroreducible and electrooxidisable organic functional groups is shown in Table<br />
1.6 (Dean, 1995).<br />
Table 1.6 Electroreducible and electrooxidisable organic functional groups<br />
Electroreducible<br />
organic functional<br />
groups<br />
Electrooxidisable<br />
organic functional<br />
groups<br />
Aromatic carboxylic acid, azomethines, azoxy compounds<br />
conjugated alkene, conjugated aromatic, conjugated carboxylic<br />
acid conjugated halide, conjugated ketone, diazo compounds,<br />
dienes, conjugated double bond, nitroso compounds,<br />
organometallics, disulfide, heterocycles, hydroquinones,<br />
acetylene, acyl sulfide aldehyde, hydroxylamines, imines,<br />
ketones, nitrates, nitriles nitro compounds, oximes, peroxides,<br />
quinones, sulfones, sulfonium salts and thiocyanates.<br />
Alcohols, aliphatic halides, amines, aromatic amines, aromatic<br />
ides, carboxylic acids, ethers, heterocyclic amines, heterocyclic<br />
aromatics, olefins, organometallic and phenols.<br />
50
1.3.3.2 Cyclic Voltammetry<br />
Cyclic voltammetry (CV) is a potential-controlled reversal electrochemical<br />
experiment. A cyclic potential sweep is imposed on an electrode and the current<br />
response is observed (Gosser, 1993). CV is an extension of linear sweep<br />
voltammetry (LSV) in that the direction of the potential scan is reversed at the end of<br />
the first scan (the first switching potential) and the potential range is scanned again in<br />
the reverse direction. The experiment can be stopped at the final potential, or the<br />
potential can be scanned past this potential to the second switching potential, where<br />
the direction of the potential scan is again reversed. The potential can be cycled<br />
between the two switching potentials for several cycles before the experiment is<br />
ended at the final potential. CV is the most widely used technique for acquiring<br />
qualitative information about electrochemical reactions.<br />
Analysis of the current response can give considerable information about the<br />
thermodynamics of redox processes, the kinetics of heterogeneous electron-transfer<br />
reaction and the coupled chemical reactions or adsorption processes. It is often the first<br />
electrochemical experiment performed in an electrochemical study especially for any<br />
new analyte since it offers a rapid location of redox potentials of the electro active<br />
species and convenient evaluation of the effect of media upon the redox process. In the<br />
CV technique, the applied potential sweep backwards and forwards between two limits,<br />
the starting potential and the switching potentials. In this technique, the potential of the<br />
WE is increased linearly in an unstirred solution. The resulting plot of current versus<br />
potential is called a cyclic voltammogram. Figure 1.10a to 1.10c show the cyclic<br />
voltammograms for reversible, irreversible and quasireversible reactions. For a typical<br />
reduction and oxidation process in reversible reaction (as in Figure 1.10a), during the<br />
forward sweep the oxidised form is reduced, while on the reverse sweep the reduced<br />
form near the electrode is reoxidised. Chemical reaction coupled to the electrode<br />
reaction can drastically affect the shape of the CV response. In the case of irreversible<br />
reaction, no reverse peak is observed (Figure 1.10b).<br />
51
(c)<br />
Figure 1.10 Cyclic voltammograms of (a) reversible, (b) irriverisble and (c)<br />
quasireversible reactions at mercury electrode (O = oxidised form and R = reduced<br />
form)<br />
(a)<br />
(b)<br />
52
The cyclic voltammogram shows characteristics of an analyte by several<br />
important parameters such as peak currents and peak potentials that can be used in the<br />
analysis of the cyclic voltammetric response either the reaction is reversible,<br />
irreversible or quasi-reversible as listed in Table 1.7. Cyclic voltammogram will<br />
guide the analyst to decide the potential range for the oxidation or reduction of the<br />
analyte and that it can be a very useful diagnostic tool.<br />
Table 1.7 The characteristics of different type of electrochemical reaction<br />
Type of reaction<br />
Reversible<br />
Irreversible<br />
Quasi-reversible<br />
Characteristics<br />
Cathodic and anodic peak potential are separated by 59/n mV.<br />
The position of peak voltage do not alter as a function of voltage<br />
scan rate<br />
The ratio of the peak current is equal to one<br />
The peak currents are proportional to square root of the scan rate<br />
The anodic and cathodic peaks are independent of the scan rate<br />
Disappearance of a reverse peak<br />
The shift of the peak potential with scan rate ( 20 – 100 mV/s)<br />
Peak current is lower than that obtained by reversible reaction.<br />
Larger separation of cathodic and anodic peak potential<br />
(> 57/ n mV) compared to those of reversible system.<br />
53
1.3.3.3 Stripping Voltammetry<br />
Stripping technique is one of the most important and sensitive electrochemical<br />
technique for measuring trace metals and organic samples. The term stripping is<br />
applied to a group of procedures involving preconcentration of the determinant onto<br />
the working electrode, prior to its direct or indirect determination by means of a<br />
potential sweep (Wang, 1985). The preconcentration (or accumulation) step can be<br />
adsorptive, cathodic or anodic. Its remarkable sensitivity is attributed to the addition<br />
of an effective preconcentration step with advanced measurement procedures that<br />
generate an extremely favorable signal-to-noise ratio as reported by Blanc et al.<br />
(2000). Brainina et al. (2000) list advantages of this technique such as high<br />
sensitivity, low detection limit, wide spectrum of test materials and analytes, both of<br />
organic and inorganic origin, insignificant effect of matrix in certain instances,<br />
compatibility with other methods, relative simplicity and low cost of equipment and<br />
finally, it can be automatic on-line and portable options. This technique is able to<br />
measure many analytes simultaneously such as reported by Ghoneim et al. (2000).<br />
They have determined up to eleven metals in water sample simultaneously using this<br />
technique. Stripping voltammetry technique utilises a few steps as follows;<br />
a) Deposition step:<br />
In this step, analyte will be preconcentrated on the WE within a certain time<br />
while solution is stirred. The deposition potential imposed on the WE is chosen<br />
according to the species to be determined and is maintained for a deposition period<br />
depending on their concentration. The choice of deposition potential can provide some<br />
selectivity in the measurement (Sun et al., 2005). Deposition time must be controlled<br />
since the longer the deposition time, the larger the amount of analye available at the<br />
electrode during stripping. During deposition step, the solution is stirred to facilitate<br />
transportation of ions of interest to the surface of WE.<br />
54
) Rest step:<br />
In this step, it allows formation of a uniform concentration of the ions of interest<br />
on the mercury. As the forced convection is stopped at the end of the deposition period,<br />
the deposition current drops almost to zero and a uniform concentration is established<br />
very rapidly. It also insures that the subsequent stripping step is performed in a<br />
quiescent solution.<br />
c) Stripping step:<br />
This step consists of scanning the potential anodically for anodic stripping and<br />
cathodically for cathodic stripping. When the potential reaches the standard potential<br />
of a certain ion of interest–metal ion complex, the particular ion of interest is reoxidised<br />
or reduced back into solution and a current is flowing. The resultant voltammogram<br />
recorded during this step provide the analytical information of the ions of interest. The<br />
stripping step after preconcentration gives the possibility for selective determination of<br />
different substances assuming that they also have different peak potential as reported by<br />
Kubiak et al. (2001). The potential-time sequence in stripping analysis is shown in<br />
Figure 1.11 which shows all three steps that were mentioned earlier.<br />
Applied<br />
Potential<br />
Deposition<br />
Stirred<br />
Deposition potential<br />
Time<br />
Stripping<br />
Quiescent<br />
Final potential<br />
Figure 1.11 The potential-time sequence in stripping analysis<br />
55
Most stripping measurements require the addition of appropriate supporting<br />
electrolyte and removal of dissolved oxygen. The former is needed to decrease the<br />
resistance of the solution and to ensure that the metal ions of interest are transported<br />
toward the electrode by diffusion and not by electrical migration. Contamination of the<br />
sample by impurities in the reagents used for preparing the supporting electrolyte is a<br />
serious problem. Dissolved oxygen severely hampers the quantitation and must be<br />
removed.<br />
The main types of interference in stripping analysis are overlapping stripping<br />
signals, the adsorption of organic surfactants on the electrode surface, the presence of<br />
dissolved oxygen and the formation of intermetallic compounds by metals such as<br />
copper and zinc co-deposited in the mercury electrode. Overlapping signals cause<br />
problems in the simultaneous determination of analytes with similar redox potential<br />
such as lead and tin. Intermetallic-compounds formation and surfactant cause a<br />
depression of the stripping response and also shifting the signal location. Stripping<br />
voltammetry is composed of three related techniques that are anodic, cathodic and<br />
adsorptive stripping voltammetry.<br />
1.3.3.3a Anodic Stripping Voltammetry (ASV)<br />
ASV is mainly used in the determination of metal ions that can be reduced and<br />
then re-oxidised at a mercury electrode. Voltammetric measurements of numerous<br />
metal ions in various types of samples have been reported (Arancibia et al., (2004) and<br />
Shams et al., (2004)). The term ASV is applied to the technique in which metal ions<br />
are accumulated by reduction at an HMDE held at a suitable negative potential. The<br />
deposition potential is usually 0.3 to 0.5 V more negative than a standard potential for<br />
reduced metal ion to be determined. ASV consists of two steps. The first step is a<br />
controlled potential electrolysis in which the working electrode is held at a cathodic<br />
potential sufficient to deposit the metal ion (M n+ ) on the electrode to form an amalgam,<br />
M(Hg). This step is called accumulation step which is represented by an equation;<br />
56
M n+ + ne - + Hg → M(Hg) (1.8)<br />
The solution is stirred during this process to increase the rate of deposition. Near the<br />
end of the deposition time, stirring is stopped to eliminate convection as a mode of<br />
mass transport. The duration of the deposition step is selected according to the<br />
concentration level of the metals ion.<br />
In the second step, the potential is scanned anodically toward more positive<br />
potential. When the potential of the WE is sufficiently positive the analyte is stripped<br />
from the electrode, returning to solution as its oxidised form. This step is called<br />
stripping which is represented by an equation<br />
M(Hg) → M n+ + ne - (1.9)<br />
The current during the stripping step is monitored as a function of potential giving rise<br />
to a peak-shaped voltammogram. The peak current is proportional to the analyte’s<br />
concentration.<br />
1.3.3.3b Cathodic Stripping Voltammetry (CSV)<br />
CSV is used to determine a wide range of organic compounds, and also<br />
inorganic compounds that form insoluble salts with the electrode material. It has been<br />
found to be widely applicable to many problems of clinical and pharmaceutical interest<br />
(Wang, 1988). Voltammetric measurements of numerous electro active species of<br />
biological significance such as drugs (Ghoneim et al., 2003; Arranz et al., 1999;<br />
Rodriguez et al., 2004; Ghoneim and Beltagi, 2003 and Cabanillas et al., 2003 ) and<br />
toxic substances ( Hourch et al., 2003; Safavi et al., 2004 ) have been reported.<br />
The term CSV was used originally for the indirect trace determination of<br />
organic compounds as mercury salt, involving anodic oxidation of mercury and<br />
subsequently cathodic reduction of mercury. This technique is similar to the previous<br />
57
technique with two exceptions. First, the deposition step involves the oxidation of the<br />
mercury electrode from Hg to Hg 2+ , which then reacts with the analyte to form an<br />
insoluble salt at the surface of the electrode. For example, when chloride ion (Cl - ) is the<br />
analyte, the deposition step is<br />
2Hg(l) + 2Cl - (aq) → Hg2Cl2 (s) + 2e - (1.10)<br />
Secondly, stripping is accomplished by scanning cathodically toward a more negative<br />
potential, reducing Hg 2+ back to Hg and returning the analyte to the solution.<br />
Hg2Cl2(s) + 2e - → 2Hg(l) + 2Cl - (aq) (1.11)<br />
1.3.3.3c Adsorptive Stripping Voltammetry (AdSV)<br />
The term AdSV seems to have been first used by Lam et al. in 1983. It is a<br />
powerful analytical technique for the determination of nmol levels of a wide range of<br />
organic compounds (Smyth and Smyth, 1978; Smyth and Vos, 1992). In technical<br />
report for International Union Of Pure And Applied Chemistry under Analytical<br />
Chemistry Division Commission On Electro analytical Chemistry (Fogg and Wang<br />
1999), suggested that AdSV technique is applied to stripping voltammetric technique in<br />
which accumulation is effected by adsorption of mainly organic determinants and that<br />
can be justified less in case of the adsorption of metal complexes in determining metal<br />
ions. The AdSV term should not be applied when there is a change of oxidation state<br />
of the metal ion during the accumulation for example in the accumulation of copper (I)<br />
complexes or salts or in other cases where an organic compounds is being accumulated,<br />
and determined indirectly, as a metal salts or complex such as mercury salts or nickel<br />
complexes.<br />
In this technique the deposition step occurs without electrolysis process.<br />
Instead, the analyte adsorbs on to the electrode’s surface. During deposition, the<br />
electrode is maintained at a potential that enhances adsorption. When deposition is<br />
58
sufficient the potential is scanned in an anodic or cathodic direction depending on<br />
whether we wish to oxidise or reduce the analyte. In recent years, AdSV which<br />
improves sensitivity and selectivity, have promoted the development of many<br />
electrochemical methods for ultra-trace measurement of a variety of organic (Ghoneim<br />
et al., 2003; Ghoniem and Taufik, 2004; Farias et al., 2003 and Hourch et al., 2003)<br />
and inorganic species (Ensafi et al., 2004; Zimmerman et al., 2001) and Jurado-<br />
Gonzalez et al. (2003). Barek et al. (2001a) reported that AdSV on HMDE is much<br />
more sensitive with a typical LOD between 10 -9 and 10 -10 M.<br />
1.3.3.4 Pulse voltammetry<br />
This technique uses pulse waveform in recording its voltammogram which<br />
offers enhanced sensitivity and resolution. The advantage of pulse techniques is that the<br />
waveform is designed so as to discriminate against non-faradic current hence, increase<br />
sensitivity. The enhanced resolution is particularly useful when several electroactive<br />
species are being analysed simultaneously (Fifield and Haines, 2000). In this<br />
technique, current sampling takes place at the end of the pulse and utilise the different<br />
time dependence of faradic (if) and charging current (ic), as shown in Figure 1.12.<br />
+<br />
Current<br />
0<br />
Faradaic<br />
Current, i f<br />
Changing<br />
Current, i c<br />
Pulse time<br />
Sampling time<br />
Time<br />
Figure 1.12 Schematic drawing showing the if and ic versus pulse time course<br />
59
This technique, is aimed at lowering the detection limits of voltammetric measurement<br />
down to 10 -8 M in its differential pulse mode. Increasing the ratio between the faradic<br />
and non-faradic current permit convenient quantitation down to the 10 -8 M<br />
concentration level (Wang, 2000). Differential pulse and square wave techniques are<br />
the most commonly used pulse technique. Differential pulse polarograms or<br />
voltammograms are peak shaped because current difference is measured. The<br />
following section gives an overview of three important waveforms in pulse technique.<br />
1.3.3.4a Differential Pulse Voltammetry (DPV)<br />
In DPV, fixed magnitude pulse (10 to 100 mV) superimposed on a linear<br />
potential ramp are applied to the working electrode at a time just before the end of the<br />
drop as shown in Figure 1.13. The current is sampled twice, just before the pulse<br />
application and again late in the pulse life normally after 40 ms, when the charging<br />
current has decayed. Subtraction of the first current sampled from the second provides<br />
a stepped peak-shape derivative voltammogram. The resulting differential pulse<br />
voltammogram consists of current peaks, the height of which is directly proportional to<br />
the concentration of corresponding analyte. The differential-pulse operation results in a<br />
very effective correction of the charging background current.<br />
E<br />
Step E<br />
Outlet<br />
Time<br />
Pulse<br />
Amplitude<br />
Pulse Width<br />
Sample Period<br />
Sample Period<br />
Pulse Period<br />
Figure 1.13 The schematic diagram of steps in DPV by superimposing a periodic<br />
pulse on a linear scan<br />
t<br />
60
1.3.3.4b Square Wave Voltammetry (SWV)<br />
SWV is a large-amplitude differential technique in which a waveform<br />
composed of a symmetrical square wave, superimposed on a base staircase potential, is<br />
applied to the working electrode. The current is sampled twice during each squarewave<br />
cycle, once at the end of forward pulse and another at the end of the reverse pulse.<br />
Since the square-wave modulation amplitude is very large, the reverse pulses cause the<br />
reverse reaction of the product of the forward pulse. The difference between the two<br />
measurements is plotted versus the base staircase potential as shown in Figure 1.14.<br />
The resulting peak current is proportional to the concentration of the analyte. Excellent<br />
sensitivity accrues from the fact that the net current is larger than either the forward or<br />
reverse components. Coupled with the effective discrimination against the charging<br />
current, very low detection limits can be attained.<br />
Applied<br />
Potential<br />
ESW<br />
1<br />
2<br />
Accumulation Time<br />
τ<br />
Time<br />
Figure 1.14 Waveform for square-wave voltammetry<br />
The advantage of SWV is that a response can be found at a high effective scan<br />
rate, thus reducing the scan time. Because of its high scan rate, it provides a great<br />
economy of time (Arranz et al., 1999 and Ghoneim and Tawfik., 2004). There are<br />
∆E<br />
61
several reports on application of the SWV technique for determination of several<br />
samples as listed in Table 1.8 which involves deoxygenation step prior analysis.<br />
However, in certain case beside it offers the additional advantage of high speed; it can<br />
increase analytical sensitivity and relative insensitivity to the presence of dissolved<br />
oxygen as reported by Economou et al. (2002).<br />
No<br />
1<br />
2<br />
3<br />
4<br />
5<br />
6<br />
7<br />
8<br />
Table 1.8 Application of SWV technique<br />
Sample<br />
Ketorolac in human serum<br />
Imidacloprid in river water<br />
Cocaine and its metabolite<br />
Amlodipine besylate in<br />
tablets and biological fluids<br />
EDTA species in water<br />
RDX in soil<br />
Levofloxacin in human<br />
urine<br />
Sertraline in commercial<br />
products<br />
Supporting electrolyte<br />
Acetate buffer, pH 5.0<br />
BRB, pH 7.2<br />
Phosphate buffer, pH 8.5<br />
BRB, pH 11.0<br />
Diluted HCl, pH 2.8 and<br />
0.05 M NaCl<br />
0.1 M acetate buffer, pH<br />
4.5<br />
0.05 M acetate buffer, pH<br />
5.0<br />
0.1 M borate, pH 8.2<br />
Reference<br />
Radi et al. (2001)<br />
Guiberteau et al.<br />
(2001)<br />
Pavlova et al.<br />
(2004)<br />
Gazy (2004)<br />
Zhao et al. (2003)<br />
Ly et al. (2002)<br />
62<br />
Radi and El-Sherif<br />
(2002)<br />
Nouws et al.<br />
(2005a)
No<br />
9<br />
10<br />
11<br />
12<br />
13<br />
14<br />
15<br />
16<br />
17<br />
Sample<br />
Cadmium in human hair<br />
Copper, stannous,<br />
antimony, thallium, and<br />
plumbum in food and<br />
environmental matrices<br />
Imatinib (Gleevec) and its<br />
metabolite in urine<br />
Famotidine in urine<br />
Haloperidol in bulk form,<br />
pharmaceutical formulation<br />
and biological fluids<br />
Copper, cadmium and zinc<br />
complexes with<br />
cephalosporin antibiotic<br />
Triprolidine in<br />
pharmaceutical tablets<br />
Metoclopramide in tablet<br />
and urine<br />
Cefoperazone in bacterial<br />
culture, milk and urine<br />
Table 1.8 continued<br />
Supporting electrolyte<br />
0.01 M TEA, pH 11.0<br />
0.1 M dibasic ammonium<br />
citrate, pH 6.3<br />
0.012 M HClO4, pH 2.0<br />
0.02 M MOPS buffer, pH<br />
6.7<br />
BRB, pH 9.0<br />
Acetic acid, pH 7.34<br />
0.04 M BRB, pH 11.0<br />
0.4 M HCl-sodium<br />
acetate, pH 6.2 and 0.2 M<br />
KCl<br />
BRB, pH 4.4<br />
Reference<br />
Arancibia et al.<br />
(2004)<br />
Locatelli (2005)<br />
Rodriguez et al.<br />
(2005)<br />
Skrzypek et al.<br />
(2005)<br />
El-Desoky et al.<br />
(2005)<br />
El-Maali et al.<br />
(2004)<br />
Zayed and Habib<br />
(2005)<br />
Farghaly et al.<br />
(2005)<br />
Billova et al.<br />
(2005)<br />
63
Notes:<br />
Table 1.8 continued<br />
BRB: Britton-Robinson buffer<br />
EDTA: Ethylene diamine tetraacetic acid<br />
HClO4: Perchloric acid<br />
MOPS: 3-(N-morpholino)propanesulphonic<br />
RDX: Hexahydro-1,3,5-trinitro-1,3,5-triazine<br />
TEA: Triethylammonium<br />
1.4 Objective and Scope of Study<br />
1.4.1 Objective of Study<br />
The development of methods for the determination of aflatoxins has been<br />
constantly in demand due to the fact that aflatoxins are a major concern as the toxic<br />
contaminants of foodstuffs and animal feed, and have been recognised as a potential<br />
threat to human health since the early 1960s resulting in frequent economic losses.<br />
The widespread occurrence of aflatoxins producing fungi in our environment and the<br />
reported natural occurrence of toxin in a number of agricultural commodities has led<br />
the investigator to develop a new method for aflatoxins analysis.<br />
In order to maintain an effective control of aflatoxins in food and foodstuffs<br />
proper analytical procedures must be applied. Different analytical methods such as<br />
thin layer, liquid chromatography or enzyme immunoassay test which were<br />
mentioned in Chapter I, have been developed for aflatoxins determination. However<br />
all these proposed techniques have their disadvantages. For HPLC technique, the<br />
method requires well equipped laboratories, trained personnel, harmful solvents as<br />
well as time consuming, and costly in buying and maintenance.<br />
64
For immunological methods such as ELISA technique, it has a few<br />
disadvantages such as long incubation time, washing and mixing steps and also labour<br />
intensive. This method requires highly specific polyclonal or monoclonal sera which<br />
is costly. For radioimmunoassay (RIA) technique, it uses radioisotope which raises<br />
concerns in radiation safety in dealing with and also in disposing radioactive waste. For<br />
micellar electrokinetic capillary chromatography (MECC) technique, it needs preparing<br />
a lot of reagents for the buffering system and takes considerable time to complete the<br />
analysis.<br />
With regards to voltammetric analysis, no stripping voltammetric study of<br />
aflatoxins is reported until now. This study has been proposed in order to develop a<br />
new alternative technique for determination of aflatoxins. This technique is the most<br />
promising method for determination of aflatoxins due to its main advantages compared<br />
to competing analytical techniques such as excellent sensitivity, reasonable speed,<br />
minimal sample pre-treatment, satisfactory selectivity, wide applicability, ability to<br />
undertake speciation analysis and low cost of instrumentation and maintenance as<br />
reported by Economou et al. (2002) and Radi (2003). Stripping analysis has been<br />
proven to be a powerful technique for the determination of both organic and inorganic<br />
electroactive species (Bond, 1980). Differential pulse cathodic stripping voltammetry<br />
satisfies the requirement of an efficient and senstitive technique for the determination<br />
of aflatoxin compounds because it has been shown to be a powerful technique in<br />
determination of other organic compounds in various sample origins down to ppb level<br />
as reported by Zima et al. (2001), Sun and Jiao (2002), Yardimer and Ozaltin (2004)<br />
and Nouws et al. (2005b).<br />
In this research, the voltammetric behaviour of these compounds would be<br />
studied in great detail and the stripping voltammetry especially differential pulse<br />
stripping voltammetry (DPSV) and square wave stripping voltammetry (SWSV)<br />
techniques could provide accurate and sensitive methods for aflatoxins determination<br />
especially in food sample such as groundnuts, would be investigated.<br />
65
The groundnut is selected for the sample to be analysed in this study since<br />
among foods and foodstuff, peanut and peanuts products are widely utilized as health<br />
food (www.copdockmill.co.uk/aflatoxin). It seem to be significantly contaminated with<br />
aflatoxins. It contains high content of carbohydrate which provides a substrate that is<br />
particularly suitable for toxin production (Neal, 1987). This will affect the quality and<br />
safety of humans life. Futhermore, Aspergillus moulds which produces aflatoxins grow<br />
easy on groundnut.<br />
AFB1, AFB2, AFG1 and AFG2 were selected as the subjects in this study due<br />
to the regulatory requirement for their determination in imported raw grounnuts as<br />
imposed by the <strong>Malaysia</strong>n government to assure that this commodity is free from any<br />
toxin contamination before being supplied for the domestic market. AFM1 and AFM2<br />
are not involved in this study since currently no such regulation imposed by the<br />
<strong>Malaysia</strong>n government even though a regulatory standard has already been set which is<br />
not more 0.05 ppb AFM1 and AFM2 should be present in milk and milk products. For<br />
the time being, the analysis on AFM1 and AFM2 are not being carried out in <strong>Malaysia</strong>.<br />
The other reason, globally, AFB1, AFB2, AFG1 and AFG2 are more concerned with<br />
their contamination in many food samples compared to AFM1 and AFM2 which<br />
contaminate milk and milk products only.<br />
The objectives of this study are:<br />
a) To investigate the electrochemical behaviour of aflatoxins B1 (AFB1), AFB2,<br />
AFG1 and AFG2 on the mercury electrode in appropriate supporting electrolyte.<br />
b) To establish optimum conditions for the determination of those aflatoxins by<br />
the method of differential pulse cathodic stripping voltammetry (DPCSV) and<br />
square wave stripping voltammetry (SWV) techniques with a HMDE as the<br />
working electrode using Britton-Robinson buffer (BRB) solution as the<br />
supporting electrolyte.<br />
66
c) To develop an accurate, sensitive, fast and simple method for the determination<br />
of all studied aflatoxins in food samples such as ground nut and comparing the<br />
results with the established method such as HPLC.<br />
1.4.2 Scope of Study<br />
The studies are as follows:<br />
a) Studies on the voltammetric behaviour of aflatoxin compounds using cyclic<br />
voltammetry (CV) technique as an introductory step. Using this technique, the<br />
effect of increasing concentration of aflatoxins, scan rate and repetitive scanning<br />
on the peak height (Ip) and peak potential (Ep) of each aflatoxin will be<br />
investigated.<br />
b) Studies on the differential pulse cathodic and anodic stripping voltammetriy<br />
(DPCSV) of all aflatoxins. Parameters optimisation include pH of supporting<br />
electrolyte, accumulation potential (Eacc), accumulation time (tacc), scan rate (υ),<br />
initial potential (Ei), final potential (Ef) and pulse amplitude.<br />
c) Using optimised analytical parameters and experimental conditions, the effect of<br />
increasing concentration of aflatoxins to the Ip of the compounds will be studied.<br />
Regression equation, R 2 value, linearity range, limit of detection (LOD), limit of<br />
quantification (LOQ), accuracy and reliability of the method will be obtained.<br />
Ruggedness and robustness tests also will be studied for the proposed technique.<br />
d) The proposed technique will be further investigated in terms of interference<br />
where each aflatoxin will be reacted with increasing amounts of metals ion such<br />
as zinc, aluminum, nickel, lead and copper, and with organic compounds such as<br />
ascorbic acid, L-cysteine and β-cyclodextrin.<br />
67
e) The optimised parameters for DPCSV technique will be applied for square wave<br />
stripping voltammetry (SWSV) including optimisation steps such as the Eacc,<br />
tacc, pulse amplitude, scan rate, voltage step and frequency. The last 3<br />
parameters are interrelated to each other in the SWSV technique.<br />
f) Both DPCSV and SWSV techniques that were successfully developed will be<br />
applied in the determination of aflatoxins content in real samples such as<br />
groundnut. The recovery studies also will be carried out for the accuracy test of<br />
the developed method. The results will be compared with that obtained by<br />
accepted technique such HPLC. For the HPLC analysis, the final solutions from<br />
the extraction and clean-up procedures of groundnut in chloroform were sent to<br />
the Chemistry Department, Penang Branch, Ministry of Science, Technology<br />
and Innovation (MOSTI).<br />
g) The stability of aflatoxins will be determined for aflatoxin stock and standard<br />
solutions according to the following procedures<br />
i) Aflatoxin stock solutions prepared in benzene: acetonitrile (98:2)<br />
will be studied using ultra-violet-visible spectrophotometer. In<br />
this analysis, each aflatoxin stock solution will be monitored<br />
every month (from 0 to 12 months) and the concentrations of<br />
aflatoxins will be calculated from the measured absorbance.<br />
ii) Aflatoxin standard solutions in BRB which was kept in the<br />
freezer at -4.0 0 C will be measured using voltammetric technique<br />
monthly up to 6 months<br />
iii) Aflatoxin standard solutions in BRB which have been added into<br />
the voltammetric cell and exposed to ambient temperature will be<br />
onitored every hour (from 0 to 8 hours) by measuring their peak<br />
height and peak potential<br />
68
iv) Aflatoxin standard solution in BRB which was added into the<br />
voltammetric cell containing BRB at different pH (6.0, 7.0, 9.0<br />
and 11.0) and exposed to ambient temperature will be monitored<br />
every hour (from 0 to 3 hours) by measuring their peak height<br />
and peak potential.<br />
69
CHAPTER II<br />
RESEARCH METHODOLOGY<br />
2.1 Apparatus, Materials and Reagents<br />
2.1.1 Apparatus<br />
A BAS CV-50W voltammetric analyser in connection with a Control Growth<br />
Mercury Electrode (CGME) stand equipped with a three-electrode system and a 20 ml<br />
capacity BAS MR-1208 cell as shown in Figure 2.0 were used for all the voltammetric<br />
determinations. The working electrode was a Hanging Mercury Drop Electrode<br />
(HMDE). As a reference and counter-electrode, a silver-silver chloride (Ag / AgCl)<br />
and a platinum wire were used, respectively. All potentials are quoted relative to this<br />
reference electrode. BAS CV-50W was connected to a computer for data processing.<br />
For robustness test which is required in validating procedure for developed technique,<br />
VA 757 Computrace Metrohm Voltammetric analyzer as shown in Figure 2.1 was used.<br />
A pH meter Cyber-scan model equipped with a glass electrode combined with an<br />
Ag/AgCl reference electrode, was employed for all pH measurements. UV-VIS<br />
spectrophotometer (UV-2501/PC Shimadzu) was used for measurement of absorbance<br />
of all 10 ppm aflatoxin stock solutions and 1 ppm aflatoxin standard in BRB solution.<br />
70
(a) (b)<br />
Figure 2.0 BAS CGME stand (a) which is connected to CV-50W voltammetric<br />
analyser and interface with computer (b) for data processing<br />
Figure 2.1 VA757 Computrace Metrohm voltammetric analyzer with 663 VA<br />
Stand (consists of Multi Mode Electrode (MME))<br />
71
2.1.2 Materials<br />
2.1.2.1 Aflatoxin Stock and Standard Solutions<br />
Aflatoxin B1 (AFB1), aflatoxin B2 (AFB2), aflatoxin G1 (AFG1) and aflatoxin<br />
G2 ( AFG2) (SIGMA) are supplied by Chemopharm with a quantity of 1 mg per bottle<br />
each. The batch numbers of these aflatoxins are listed in Table 2.0.<br />
Table 2.0 List of aflatoxins and their batch numbers used in this experiment.<br />
Aflatoxins<br />
AFB1<br />
AFB2<br />
AFG1<br />
AFG2<br />
Batch Number<br />
112K4049<br />
120K4014<br />
11K4003<br />
082K4091<br />
Stock solutions of these aflatoxins with concentrations of 10 ppm each were<br />
prepared by dissolving the total amount of aflatoxin with 2.0 ml acetonitrile. The<br />
solution was transfered into 100 ml volumetric flask. Benzene was added into the flask<br />
until 100 ml mark. The flasks were covered with aluminium foil and kept in<br />
refrigerator with a temperature of 16° C. The absorbances of these stock solutions were<br />
measured using ultraviolet-visible (UV) spectrometer and the concentrations of<br />
aflatoxins were calculated. This measurement of these aflatoxins stock solutions were<br />
carried out monthly per a year while kept under cool condition for stability study.<br />
72
For preparation of aflatoxins standard solution with concentration of 1 ppm, 1<br />
ml of the stock solution was pipetted and placed into an amber bottle. Nitrogen was<br />
bubbled into the solution to remove all the organic solvent until dryness followed with<br />
an addition of 10 ml BRB at pH of 9.0. The solution was well mixed and kept in<br />
freezer at temperature of -4 0 C. This standard solution was analysed by voltammetric<br />
technique very month for 6 months to observe the stability of the aflatoxins in buffered<br />
solution. To obtain the concentration of 0.1 µM of AFB1, AFB2, AFG1 and AFG2<br />
each in 10 ml supporting electrolyte, an amount of 312, 315, 328 and 330 µl was<br />
injected into the cell respectively.<br />
2.1.2.2 Real Samples<br />
Real samples such as groundnut were purchased from a few domestic shops<br />
which are located in Taman <strong>Universiti</strong>, Skudai, Johor. These samples were labeled as<br />
S01 to S15.<br />
2.1.3 Reagents<br />
The chemicals used were all of analytical reagent quality grade and the<br />
solutions were prepared with de-ionised water obtained from a Barnstead Ultra<br />
Nanopure water system. 1% of sodium hypochlorite was used to clean all glasswares<br />
used.<br />
2.1.3.1 Britton-Robinson Buffer (BRB), 0.04 M<br />
BRB with a buffering range from 2.0 to 12 was prepared by dissolving 2.47 g of<br />
boric acid (Fluka) in a 1liter flask containing 2.3 ml of glacial acetic acid (MERCK)<br />
and 2.70 ml orthophosphoric acid (Ashland Chemical) and then further diluting to the 1<br />
liter mark with deionised water. The pH of the buffer solution was adjusted to the<br />
73
equired value by addition of 1.0 M sodium hydroxide (MERCK) or 1.0 M<br />
hydrochloric acid solutions (MERCK).<br />
2.1.3.2 Carbonate Buffer, 0.04 M<br />
Carbonate buffer with a buffering range from pH 9.0 to 12 was prepared by<br />
mixing two different solutions which were firstly prepared. The first solution, 0.04 M<br />
sodium bicarbonate was prepared by dissolving 3.36 g sodium bicarbonate (MERCK) in<br />
a 1 liter of de-ionised water. Similarly, for the second solution, 0.04 M sodium<br />
carbonate was prepared by dissolving 4.24 g sodium carbonate (MERCK) in 1 liter of<br />
deionised water. The pH of the buffer was adjusted to the required value by mixing the<br />
two solutions.<br />
2.1.3.3 Phosphate Buffer, 0.04 M<br />
Phosphate buffer was prepared by mixing two different solutions which were<br />
firstly prepared. The first solution, 0.04 M potassium hydrogen phosphate was prepared<br />
by dissolving 5.44 g potassium hydrogen phosphate (BDH) in a 1 liter of deionised<br />
water. Similarly, for the second solution, 0.04 M sodium hydrogen phosphate was<br />
prepared by dissolving 5.68 g sodium hydrogen phosphate (BDH) in 1 liter of deionised<br />
water. The pH of the buffer was adjusted to the required value by mixing the two<br />
solutions.<br />
2.1.3.4 Ascorbic Acid Solution, 1.0 mM<br />
This solution was prepared by dissolving 0.0176 g of ascorbic acid (GCE) in<br />
100 ml of de-ionised water.<br />
74
2.1.3.5 β-cyclodextrin (β-CD) Solution, 1.0 mM<br />
This solution was prepared by dissolving 0.1135 g of C42H70O35 (Fluka) in 100<br />
ml of de-ionised water.<br />
2.1.3.6 L-cysteine, 1.0 x 10 -5 M<br />
This solution was prepared by dissolving 0.012 g of cysteine (SIGMA) in 100<br />
ml of de-ionised water. 1.0 ml of this solution was diluted to 100 ml with de-ionised<br />
water.<br />
2.1.3.7 2,4-dihydrofuran, 0.15 M<br />
This solution was prepared by diluting 1.105 ml of 13.57 M of 2,4 dihydrofuran<br />
(SIGMA) into 100 ml with de-ionised water.<br />
2.1.3.8 Coumarin, 3.0 x 10 -2 M<br />
methanol.<br />
This solution was prepared by dissolving 0.21 g of coumarin (SIGMA) in 50 ml<br />
2.1.3.9 Poly-L-lysine (PLL), 10 ppm<br />
This solution was prepared by dissolving 0.001 g of poly-l-lysine (SIGMA) in<br />
100 ml de-ionised water.<br />
2.1.3.10 Standard Aluminium (III) Solution, 1.0 mM<br />
The standard aluminium (III) solution was prepared by dissolving 0.5212 g of<br />
Al(NO3)3.9H2O (MERCK) in 100 ml de-ionised water.<br />
75
2.1.3.11 Standard Plumbum (II) Solution, 1.0 mM<br />
The standard plumbum (II) solution was prepared by dissolving 0.0530 g<br />
Pb(NO3)2 (EMORY) in 100 ml deionised water.<br />
2.1.3.12 Standard Zinc (II) Solution, 1.0 mM<br />
The standard zinc (II) solution was prepared by dissolving 0.121g ZnSO4.5H2O<br />
(BDH) in 100 ml de-ionised water.<br />
2.1.3.13 Standard Copper (II) Solution, 1.0 mM<br />
The standard copper (II) solution was prepared by dissolving 0.0980 g.<br />
CuSO4.7H2O (GCE) in 100 ml de-ionised water.<br />
2.1.3.14 Standard Nickel (II) Solution, 1.0 mM<br />
The standard nickel (II) solution was prepared by dissolving 0.0963 g<br />
NiCl2.6H2O (MERCK) in 100 ml deionised water.<br />
2.1.3.15 Methanol: 0.1 N HCl Solution, 98 %<br />
This solution was prepared by mixing 98 ml of methanol and 2 ml 0.1 N HCl.<br />
2.1.3.16 Zinc Sulphate Solution, 15%<br />
This solution was prepared by dissolving 15 g of zinc sulphate (MERCK) in 100<br />
ml de-ionised water.<br />
76
2.2 Analytical Technique<br />
2.2.1 General Procedure for Voltammetry Analysis<br />
The general procedure used to obtain stripping voltammograms was according<br />
to the following procedures. A 10 ml aliquot of buffer solution was placed in a<br />
voltammographic cell and the required aflatoxin standard solution was added using a<br />
micropipette. The stirrer was switched on at 300 rpm and the solution was purged with<br />
nitrogen gas for 10 minute. After forming a new HMDE, accumulation was effected for<br />
the required time at the appropriate potential while stirring the solution. A medium<br />
mercury drop size was used. At the end of the accumulation time the stirring was<br />
switched off and after 10 s had elapsed to allow the solution to become quiescent, the<br />
negative going potential was initiated. When further volume of aflatoxin were added to<br />
the cell, the solution was redeoxygenated with nitrogen gas for another 2 minute before<br />
carrying out further voltammetric determination following the mentioned general<br />
procedures.<br />
2.2.2 Cyclic Voltammetry (Anodic and Cathodic Directions)<br />
Cyclic voltammetry of all aflatoxins were carried out by anodic and cathodic<br />
cyclic techniques. The initial parameters for cathodic cyclic voltammetry are as<br />
follows; initial potential (Ei) = 0 V, high potential, (EH) = 0 V, low potential (EL) = -<br />
1.50 V, scan rate (υ)= 200 mV/s, quiet time = 10 s and sensitivity = 1 µA/V. For anodic<br />
cyclic voltammetry, all previous parameters were maintained except for Ei = -1.50 V.<br />
The concentration of aflatoxins used for these experiments were fixed at 1.3 µM.<br />
2.2.2.1 Standard Addition of Sample<br />
5 ppm (1.59 x 10 -5 M) AFB2 standard solution was prepared by taking 5.0 ml<br />
aflatoxin stock solution, degassed until dryness and redissolved in BRB pH 9.0. For<br />
cyclic voltammetry experiment, general procedure as previouly mentioned was<br />
77
followed. A 818 µl of 1.59 x 10 -5 M AFB2 standard solution was then added into<br />
voltammetric cell containing 10 ml of supporting electrolyte which resulted in<br />
concentration of aflatoxin of 1.3 µM in the cell. The solution was purged with nitrogen<br />
for 120 s before being scanned. Further series of scans were carried out with increasing<br />
concentration of the aflatoxins from 2.0 to 3.4 µM. Subsequently a purge of 120 s was<br />
employed between the cyclic voltammetry. A graph of peak current against aflatoxin<br />
concentration was plotted and linearity of the curve was calculated. This method was<br />
repeated for other aflatoxins.<br />
2.2.2.2 Repetitive Cyclic Voltammetry<br />
Using the aflatoxins with concentration of 1.3 µM, repetitive cyclic voltammetry<br />
for anodic and cathodic direction were run using the same parameters as mentioned<br />
before with the υ of 200 mV/s and 10 cyclic number. Any change in the Ip and Ep<br />
height of all aflatoxins due to the increasing number of the cycle were observed.<br />
2.2.2.3 Effect of Scan Rate (υ)<br />
The whole procedure for cyclic voltammetry was repeated for all aflatoxins with<br />
different υ from 20 mV/s to 500 mV/s while other parameters kept constant. The<br />
applied υ were 20, 40, 60, 80, 100, 200, 300, 400 and 500 mV/s. Any change in the Ip<br />
and Ep of all aflatoxins due to the changing of the υ were observed. Graphs of log Ip<br />
against log υ, Ep versus log υ and Ip versus υ were plotted.<br />
2.2.3 Differential Pulse Cathodic Stripping Voltammetric Determination of<br />
AFB2<br />
A 315 µl of 1 ppm (0.318 x 1-0 -5 M) AFB2 sample solution in BRB at pH 9.0<br />
was added by means of micropipette into the cell which contained 10 ml of the BRB<br />
with the same pH. The resulting concentration of sample in the voltammetric cell is 0.1<br />
µM (31.4 ppb). The solution was deoxygenated with nitrogen free oxygen for 120 s<br />
78
efore carrying out further voltammetry. Three further series of sample additions were<br />
employed with a purge of 120 s were performed between each cathodic stripping cycle.<br />
2.2.3.1 Effect of pH<br />
The following general procedure was carried out. A 1.26 ml of 5 ppm (1.59 x<br />
10 -5 M) AFB2 standard solution was added by means of micropipette into the cell which<br />
contained 8.74 ml of BRB at pH 9.0. The resulting concentration of sample in<br />
voltammetric cell is 2.0 µM (628 ppb). The solution was deoxygenated with nitrogen<br />
for 120 s before carrying out further voltammetry. The whole procedure was repeated<br />
for series of buffer from pH 4.0 to 13.0 and a graph of Ip vs. pH was then plotted.<br />
2.2.3.2 Method Optimisation for the Determination of AFB2<br />
The optimisation steps for determination of AFB2 were carried out using two<br />
different concentrations of AFB2 which were 2.0 uM and 0.02 µM for high and low<br />
concentrations respectively. The initial parameters used for this optimisation steps are;<br />
Ei = 0 mV, Ef = -1500 mV, Eacc = 0 mV, tacc = 0, υ = 20 mV/s, pulse implitude = 100<br />
mV and quite time = 10 s. General procedure for voltammetric analysis was employed.<br />
The Ip and Ep values were observed. The same procedure was repeated with the same<br />
parameters except for tacc was 30 s. For the optimisation steps, the influence of each<br />
parameter on the Ip and Ep of AFB2 was studied. In each experiment, one of the<br />
parameters was varied while others were kept constant.<br />
2.2.3.2a Effect of Scan Rate (υ)<br />
After the best condition of pH was chosen, the effect of υ was carried out. The υ<br />
were varied from 20 to 100 mV/s while maintaining other parameters constant.<br />
Subsequently a purge of nitrogen gas for 120 s was employed between cathodic<br />
stripping cycles. A graph of Ip against υ was then plotted and the best υ was then<br />
selected.<br />
79
2.2.3.2b Effect of Accumulation Potential (Eacc)<br />
The general procedure was followed with the best condition of pH and υ set to<br />
the required value. Effect of Eacc was carried out with other parameters kept unchanged<br />
as previously mentioned. A graph of Ip against Eacc was then plotted.<br />
2.2.3.2c Effect of Accumulation Time (tacc)<br />
Using the best condition for Eacc, tacc and pH of BRB solution, general procedure<br />
was followed where a series of scans with increasing tacc were carried out. A graph of Ip<br />
against tacc was then plotted.<br />
2.2.3.2d Effect of Initial Potential (Ei)<br />
The effect of Ei to the Ip using the chosen previous optimised parameters was<br />
carried out where a series of scans with different Ei while Ef kept constant were<br />
performed. The effect of Ei was carried out with variation of 0 V to -1.10 V and<br />
increasing towards more negative potential until it reached the required maximum Ip. A<br />
graph of Ip against Ei was then plotted.<br />
2.2.3.2e Effect of Pulse Amplitude<br />
The best conditions of other parameter were chosen and the pulse amplitude was<br />
optimised as the final step in this optimisation procedure. The effect of pulse amplitude<br />
was carried out with variation of 30 to 100 mV. A graph of Ip against pulse amplitude<br />
was then plotted.<br />
2.2.3.3 Method Validation<br />
Validation of the method was examined via evaluation of linearity, limit of<br />
detection (LOD), limit of quantification (LOQ), accuracy, repeatability, reproducibility,<br />
80
ecovery, robustness and ruggedness. Multiple scanning of blank before addition of<br />
AFB2 standard solution was performed. LOD was calculated by standard addition of<br />
low concentration of aflatoxins until a response was obtained that is significantly<br />
different from the blank sample (Barek et al., 2001a). The intra-assay and inter-assay<br />
precision for AFB2 was calculated from repeated analysis of certain concentration of<br />
AFB2 during one working day and on different days respectively. Recovery study for<br />
the accuracy of the method were performed by adding an amount of AFB2 into the<br />
eluate of real samples and after extraction and clean-up procedures before being<br />
analysed for AFB2 and percentage recovery of AFB2 was calculated. The robustness,<br />
as a measure of procedure’s capability to remain unaffected by small variations of some<br />
important procedure conditions, was examined by analysis of 0.1 µM AFB2 (31.4 ppb)<br />
under the successive variation of pH of the supporting electrolyte (pH 8.5 – 9.5), Eacc<br />
(from - 0.59 to - 0.61 V) and tacc (75 – 85 s). The ruggedness of the measurement was<br />
examined by applying the proposed procedure to assay of aflatoxin using two different<br />
models of voltammetry instruments that were BAS and Metrohm voltammetry<br />
analysers.<br />
For other aflatoxins (AFB1, AFG1 and AFG2) the same procedures were<br />
followed as mentioned for AFB2 including method validation as well. For all cases,<br />
each calibration curve was constructed and the same statistical parameters were<br />
evaluated.<br />
2.2.3.4 Interference Studies<br />
2.2.3.4a Effect of Cu (II), Ni (II), Al (III), Pb (II) and Zn (II)<br />
The effect of all the above metals on the measurement of 0.1 µM of aflatoxin in<br />
BRB pH 9 was carried out by adding a series of concentration of all metal standard<br />
solutions into the aflatoxin solution in the voltammetric cell started from 0.1 to 1.0 µM<br />
concentration. The graphs of Ip of respective aflatoxin against the concentration of all<br />
standard solutions were plotted.<br />
81
2.2.3.4b Effect of Ascorbic Acid, β-CD and L-cysteine<br />
The effect of ascorbic acid, β-CD and L-cysteine on the measurement of 0.1µM<br />
of aflatoxin in BRB pH 9 were carried by adding a series of concentration of ascorbic<br />
acid, β-CD and L-cysteine solutions into the aflatoxin solution in the voltammetric cell<br />
from 0.1 to 1.0 µM concentration of each compound. The graphs of Ip of respective<br />
aflatoxin against the concentration of added acorbic acid, β-CD and L-cysteine were<br />
plotted.<br />
2.2.3.5 Modified Mercury Electrode with Poly-L-Lysine (PLL)<br />
10 ml of BRB solution at pH 9.0 was pipetted into voltammetric cell followed<br />
with 10 µl of PLL and 0.1 µM aflatoxins. The solution was purged for 10 minutes<br />
before general procedure for voltammetric determination was applied. Ip of 0.1µM<br />
AFB2 was measured. The procedure was repeated by using different pH of BRB.<br />
2.2.4 Square Wave Cathodic Stripping Voltammetry (SWSV)<br />
All optimised parameters which were obtained using DPCSV were applied using<br />
SWSV for determination of 0.1 µM of each aflatoxin.<br />
2.2.4.1 SWSV Parameters Optimisation<br />
All SWSV parameters such as pulse amplitude, voltage step and frequency were<br />
optimised to obtain maximum Ip and defined peak for AFB2. For this optimisation<br />
procedure, 0.1 µM AFB2 was used.<br />
2.2.4.2 SWSV Determination of All Aflatoxins<br />
Other aflatoxins with concentration of 0.1 µM have been measured using SWSV<br />
technique with optimised parameters. The results of Ip and Ep of all aflatoxins were<br />
82
compared with those obtained by DPCSV technique. The effect of concentration on Ip<br />
and Ep of aflatoxins has been observed. The plot of Ip versus concentration of<br />
respective aflatoxin was constructed and all statistical parameters were evaluated.<br />
2.2.5 Stability Studies of Aflatoxins<br />
These studies were carried out by a series of experiments according to the<br />
procedures elaborated below;<br />
2.2.5.1 Stability of 10 ppm Aflatoxins<br />
Stability of 10 ppm aflatoxin stock solutions prepared in benzene: acetonitrile<br />
(98%) was monitored using UV-VIS spectrophotometer using 98% of benzene:<br />
acetonitrile as a blank. 1 ml of sample was scanned three times starting from λ of 500<br />
nm to 280 nm. This measurement was done every month from first day of preparation<br />
for 12 months period time. The concentration of each aflatoxin were calculated using<br />
the formula as stated in Appendix D.<br />
2.2.5.2 Stability of 1 ppm Aflatoxins<br />
Stability of 1ppm aflatoxin standard solutions prepared in BRB pH 9.0 was<br />
performed using DPCSV method. In this experiment, 0.1 µM of each aflatoxin was<br />
scanned every month from first to 6 th month. The graph of Ip current against months of<br />
keeping period was plotted.<br />
2.2.5.3 Stability of 0.1 µM Aflatoxins Exposed to Ambient Temperature<br />
Stability study of 0.1 µM aflatoxins in BRB pH 9.0 which was exposed to the<br />
ambient temperature in voltammetric cell was performed using DPCSV method. In this<br />
experiment, 0.1 µM of each aflatoxin was scanned every hour from 0 to 8 th hour<br />
83
exposure time. The graph of Ip against exposure time was plotted. Nitrogen gas was<br />
purged for 10 min before performing each scan.<br />
2.2.5.4 Stability of 0.1µM Aflatoxins in Different pH of BRB<br />
Stability of 0.1µM aflatoxins in different pH of BRB (6 to 11.0) were observed.<br />
For each pH value, the Ip of aflatoxin was measured for 3 hours. The graph of Ip against<br />
exposure time for each pH of BRB was plotted.<br />
2.2.6 Application to Food Sample<br />
Fifteen batches of real samples (groundnut) were purchased and labeled with<br />
S01 to S15 were used in this study. The samples were subjected to the extraction and<br />
clean-up procedure prior voltammetric analysis using DPCSV and SWSV techniques.<br />
A few techniques which were named as Technique 1, 2 and 3 were studied for<br />
extraction and clean-up of real samples.<br />
2.2.6.1 Technique 1<br />
50 g of groundnut samples were weighed into 250 ml blender, then 100 ml of<br />
acetonitrile-water (9:1) solution were added and shaken for 1 hour. The extraction<br />
solution was filtered through a pre-pleated filter paper to remove solid material and<br />
extract was collected and kept for analysis (Pena et al., 2002).<br />
2.2.6.2 Technique 2<br />
Groundnut samples were first ground in a household blender at high speed for<br />
3 minutes. For extraction, 10 ml of methanol-water (80:20) was added to 5g of sample,<br />
followed by 5 ml hexane. The suspension was hand shaken for 3 minutes and then<br />
passed through Whatman No. 4 filter paper. The aqueous layer was diluted 1 in 10 for<br />
the assays to avoid any interference from methanol, hence the consequence aflatoxin’s<br />
84
concentration in the extracted solution was 1/20 th that in groundnut samples. The<br />
extraction took approximately 15 minutes to perform (Garden et al., 2001)<br />
2.2.6.3 Technique 3<br />
This technique is adapted by The Chemistry Department, Penang Branch,<br />
Ministry of Science, Technology and Innovation (MOSTI), Pulau Pinang (2003) as<br />
shown in Appendix E. 1.0 ml of final solution in chloroform was taken and put into an<br />
amber bottle followed with degassing and re-dissolved in 1.0 ml BRB at pH 9.0 before<br />
spiking into voltammetric cell for analysis.<br />
2.2.6.4 Blank Measurement<br />
For blank measurement, the procedure of extraction and clean-up steps were<br />
followed as previously mentioned in Appendix E without addition of real sample. The<br />
blank consisted of methanol, 0.1 N HCl, 15% ZnSO4 and chloroform. 1.0 ml of final<br />
solution was collected from extraction procedure in chloroform, degassed and redissolved<br />
in 1.0 ml of BRB at pH 9.0.<br />
2.2.6.5 Recovery Studies<br />
Recovery studies for aflatoxins in groundnut samples were performed using<br />
DPCSV and SWSV techniques. For this study, a certain volume of 1.0 ppm of<br />
aflatoxins as listed in Table 3.3 were injected into 20.0 ml of eluate from blended real<br />
sample (Ammida et al., 2004). The sample with injected aflatoxins was then mixed<br />
with 20.0 ml zinc sulphate, 15%. The total amount of added aflatoxins in the cell<br />
obtained by respective injected volume is shown in Table 2.1. The solution was well<br />
mixed for 30 s and subjected to extraction procedure as previously mentioned. Sample<br />
solution was prepared by degassed of 1 ml of chloroform until dryness followed with<br />
dissolution in BRB at pH 9.0.<br />
85
Table 2.1 Injected volume of aflatoxins into eluate of groundnut and the final<br />
concentrations obtained in voltammetric cell<br />
Injected volume of 1 ppm<br />
aflatoxins (ml)<br />
1.6<br />
5.1<br />
9.3<br />
2.2.6.6 Voltammetric Analysis<br />
Final concentration in<br />
voltammetric cell (ppb)<br />
3.0<br />
9.0<br />
15.0<br />
Voltammetric analysis of blank, recovery and real samples were carried out<br />
using DPCSV and SWSV techniques. For each sample, 200 µl of the solution was<br />
spiked into 10 ml supporting electrolyte followed with general voltammetric<br />
determination procedure. Voltammograms of each samples were recorded and any peak<br />
appeared was observed. For determination of aflatoxin in real sample, standard addition<br />
method was applied by spiking 10 ppb of aflatoxin standard followed with general<br />
procedure for voltammetric analysis. The amount of aflatoxin in groundnut sample was<br />
calculated according to the formula as stated below;<br />
Aflatoxin (ppb) = P ’ / P x C x 12.5 (2.0)<br />
where;<br />
P ’<br />
= Ip of sample (nA)<br />
P = Ip of aflatoxin standard (after substract from P ’ ) (nA)<br />
C = Concentration of aflatoxin spiked in the cell (ppb)<br />
12.5 = Factor value after the sample weight, volume of chloroform used<br />
in the extraction and preparation of injection sample have been<br />
considered<br />
86
The detailed information on how this formula was formulated are shown in Appendix F<br />
The results were compared with that obtained by HPLC technique. The HPLC<br />
system used was a Waters model comprising WATERS 600 controller, WATERS 717<br />
auto sampler, WATERS temperature control module and MILLENIUM<br />
chromatography manager, equipped with a model WATERS 420-AC fluorescence<br />
detector filled with standard optical filters with 338 nm bandpass excitation filter and<br />
425 nm longpass emission filter, gain; 16 and maximum span. For chromatographic<br />
separation, a Nova-Pak C-18 steel column (150 x 3.9 mm, 4um particle size) was<br />
employed. The separation was carried out at room temperature using, as the mobile<br />
phase of 70% water, 20 % methanol and 10 % acetonitrile with a flow rate of 1.6 ml /<br />
min at column temperature of 30° C. The injection volume was 30 µl with 12 min for<br />
running time.<br />
87
CHAPTER III<br />
RESULTS AND DISCUSSION<br />
3.1 Cyclic Voltammetric Studies of Aflatoxins<br />
Cyclic voltammetric (CV) experiment is normally carried out for the initial<br />
electroanalytical studies of any compound to obtain information on electroanalytical<br />
properties of the compounds before being investigated in depth using other<br />
electroanalytical techniques is carried out (Wang, 2000). In this work, all aflatoxins<br />
(AFB1, AFB2, AFG1 and AFG2) have been initially analysed by this technique. The<br />
main objective of this experiment was to obtain the electroanalytical properties of<br />
aflatoxin at different scan rates in various pH of BRB solution. Any current peak that<br />
appeared from the voltammogram was evaluated to confirm the type of reaction of<br />
aflatoxin on the mercury electrode. The repetitive cyclic voltammetry were also<br />
performed at certain CV parameters such as scan rate of 200 mV/s in BRB solution with<br />
pH of 9.0. This experiment was carried out to observe the process of accumulation of<br />
aflatoxins on mercury electrode with longer accumulation time. Various pH medium of<br />
BRB have been used in these experiments to observe any involvement of hydronium<br />
ion in the electrode processs of aflatoxins on the mercury electrode (Kamal et al.,<br />
1996). The peak potentials of these compounds which were measured throughout this<br />
work were against an Ag/AgCl as the reference electrode.<br />
88
3.1.1 Cathodic and Anodic Cyclic Voltammetric of Aflatoxins<br />
The parameters set up for cathodic cyclic voltammetric measurement were<br />
initial potential (Ei ) = 0 mV, high potential (EH ) = 0 mV, low potential (EL) = -1500<br />
mV, scan rate (ν) = 200 mV/s and sensititvity = 1 µA/V. A BRB solution with pH 9.0<br />
was initially used as the supporting electrolyte following the previous experiment<br />
carried out by Smyth et al. (1979) using DPP technique. The result that were obtained<br />
showed that the BRB solution with pH 9.0 was the best medium for reduction of<br />
aflatoxins on the mercury electrode. CV experiments results also revealed that the BRB<br />
pH 9.0 is the optimum pH for this reduction to take place. Figure 3.0 shows the Ip of<br />
0.6 µM AFB1 obtained by cathodic cyclic voltammetry in different pH of BRB. The Ep<br />
of AFB1 was shifted to the more negative direction with increasing pH as shown in<br />
Figure 3.1 indicating that proton was involved in the reduction of AFB1 (Sun et al.,<br />
2005).<br />
Ip (nA)<br />
30<br />
25<br />
20<br />
15<br />
10<br />
5<br />
0<br />
5 6 7 8 9 10 11 12 13<br />
pH of BRB<br />
Figure 3.0 Cathodic peak current of 0.6 µM AFB1 in various pH of BRB obtained<br />
by cathodic cyclic voltammetry. Ei = 0, Elow = -1.5 V, Ehigh = 0 and scan rate = 200<br />
mV/s.<br />
89
From the Figure 3.0, the curve rises from pH 6.0 to 9.0 then goes down from pH<br />
9.0 to 12.0. According to Smyth et al. (1979), for pH 6.0 to 8.0, the reduction peak of<br />
AFB1 was caused by the reduction of double bond in benzene ring which conjugates to<br />
the keto group and followed by the protonation of molecule that preceded the reduction<br />
until it achieved maximum reduction at pH 9.0. The possible mechanism for this<br />
reaction is shown in Figure 3.2.<br />
O<br />
Ep (-mV)<br />
O<br />
1.34<br />
1.33<br />
1.32<br />
1.31<br />
1.3<br />
1.29<br />
1.28<br />
1.27<br />
OCH 3<br />
5 6 7 8 9 10 11 12 13<br />
pH of BRB<br />
Figure 3.1 Shifting of Ep of AFB1 with incresing pH of BRB. Parameter conditions<br />
are the same as in Figure 3.0.<br />
O<br />
2e -<br />
2H +<br />
O<br />
O<br />
OCH 3<br />
O<br />
H H<br />
Figure 3.2 Mechanism of reduction of AFB1 in BRB at pH 6.0 to 8.0<br />
90
2<br />
For pH 10 to 12.0, due to decreasing number of hydrogen ions in the supporting<br />
electrolyte that is involved in the reduction process, anion radical was dimerised and<br />
produced a reduction peak. Their mechanism is shown in Figure 3.3.<br />
O<br />
O<br />
OCH 3<br />
O<br />
2e -<br />
2<br />
O<br />
O<br />
OCH 3<br />
2 H 2O<br />
D imer + 2 OH -<br />
Figure 3.3 Mechanism of reduction of AFB1 in BRB at pH 9.0 to 11.0<br />
Using BRB at pH 9.0 as the optimum medium for the supporting electrolyte,<br />
cathodic cyclic voltammograms of 1.3 µM of all aflatoxins were obtained where all<br />
aflatoxins produced a sharp and well defined cathodic wave around -1.315 V for both<br />
AFB1 and AFB2, -1.245 V for AFG1 and -1.250 V for AFG2 with a peak current of 42<br />
nA, 30 nA, 47 nA and 39 nA for AFB1, AFB2, AFG1 and AFG2 respectively. The peak<br />
was located not far from the peak of hydrogen over potential which was at -1.450 V.<br />
For all aflatoxins, no oxidation wave appeared in the anodic branch, which indicates<br />
that the aflatoxins reductions are irreversible. Cyclic voltammograms of all aflatoxins<br />
are shown in Figures 3.4 to 3.7.<br />
The effect of initial potential (Ei)) on cathodic peak of AFB1 was investigated.<br />
Varying Ei caused no extra peak to appear for both cathodic and anodic waves which<br />
O<br />
91
show that the Ei did not produce any significant change on the cathodic peak of AFB1.<br />
The Ip were almost the same for Ei at 0 to -0.8 V which was around 22 nA.<br />
Figure 3.4 Cathodic cyclic voltammogram for 1.3 µM AFB1, obtained at<br />
scan rate of 200 mV/s, Ei = 0, Elow = -1.5 V and Ehigh = 0 in BRB solution at pH<br />
9.0.<br />
Figure 3.5 Cathodic cyclic voltammogram for 1.3 µM AFB2 in BRB solution at pH<br />
9.0. All parameter conditions are the same as in Figure 3.4.<br />
92
Figure 3.6 Cathodic cyclic voltammogram for 1.3 µM AFG1 in BRB solution at pH<br />
9.0. All parameter conditions are the same as in Figure 3.4.<br />
Figure 3.7 Cathodic cyclic voltammogram for 1.3 µM AFG2 in BRB solution at pH<br />
9.0. All parameter conditions are the same as in Figure 3.4.<br />
For Ei of more than -0.80 V, the Ip decreased to 17 nA as shown in Figure 3.8.<br />
This is because the presence of Zn +2 in BRB solution facilitates the migration and<br />
adsorption of aflatoxin towards the working electrode. This is proven by the study of<br />
93
Zn +2 using CV technique with various Ei and the results are shown in Figure 3.9. There<br />
is no significant change on Ep of AFB1 (-1.30 V) with changing Ei .<br />
Ip (nA)<br />
Ip (nA)<br />
30<br />
25<br />
20<br />
15<br />
10<br />
20<br />
15<br />
10<br />
5<br />
0<br />
5<br />
0<br />
0 0.2 0.4 0.6 0.8 1 1.2 1.4<br />
E i (-V)<br />
Figure 3.8 Effect of Ei to the Ip of 0.6 µM AFB1 in BRB at pH 9.0 obtained by<br />
cathodic cyclic voltammetry. Parameter conditions are the same as in Figure 4.4.<br />
0 0.2 0.4 0.6 0.8 1 1.2<br />
E i (-V)<br />
Figure 3.9 Effect of Ei to the Ip of 0.1 µM Zn 2+ in BRB at pH 9.0 obtained by<br />
cathodic cyclic voltammetry. Parameter conditions are the same as in Figure 3.4.<br />
Anodic cyclic voltammetry measurement was carried out using the same<br />
parameters with the exception of Ei = -1500 mV (versus Ag/AgCl). The anodic cyclic<br />
voltammograms confirmed that the reduction reaction of all aflatoxins are irreversible<br />
94
whereby only cathodic peak appeared but with a slightly higher current of 46.76 nA at -<br />
1.318 V for AFB1, 35 nA at -1.311 V for AFB2, 52 nA at 1.243 V for AFG1 and 50 nA<br />
at -1.259 V for AFG2. This may be due to longer time of anodic scanning itself, which<br />
gave a longer time for accumulation of aflatoxins on the mercury electrode surface<br />
compared to the cathodic measurement. For example, anodic cyclic voltammogram of<br />
AFB2 is shown in Figure 3.10.<br />
Figure 3.10 Anodic cyclic voltammogram of 1.3 µM AFB2 obtained at scan rate of<br />
200 mV/s, Ei = -1.5 V, Elow = -1.5 V and Ehigh = 0 in BRB solution at pH 9.0.<br />
Standard additions of each aflatoxin shows that the peak current at their<br />
respective potential increases with increasing concentrations. The voltammograms of<br />
AFB2 (Figure 3.11) shows that the peak current at -1.315 V increases with increasing<br />
AFB2 concentration. This dependence is represented in Figure 3.12. The<br />
corresponding equation for this dependence is given below;<br />
Ip (nA) = 21.65 x (µM) + 6.605 (R 2 = 0.9857, n = 4) (3.0)<br />
No extra peak was observed with this standard addition either at the anodic<br />
direction or cathodic direction. This result reveals that the appeared peak was due to the<br />
respective aflatoxin and does not from other electroactive compounds.<br />
95
Figure 3.11 Effect of increasing AFB2 concentration on the peak height of cathodic<br />
cyclic voltammetric curve in BRB at pH 9.0; (a) 1.30 µM, (b) 2.0 µ M (c) 2.70 µM and<br />
(d) 3.40 µM. Parameter conditions are the same as in Figure 3.4<br />
Ip (nA)<br />
100<br />
80<br />
60<br />
40<br />
20<br />
0<br />
y = 21.65x + 6.605<br />
R 2 = 0.9857<br />
1 1.5 2 2.5 3 3.5 4<br />
[AFB2] / uM<br />
Figure 3.12 Peak height of reduction peak of AFB2 with increasing concentration of<br />
AFB2. Experimental conditions are the same as in Figure 3.4.<br />
96
For other aflatoxins, the dependence of current peak to their concentrations in<br />
BRB at pH 9.0 is listed in Table 3.0. The regression equations of this relationship show<br />
that the peak heights of aflatoxins are correlate well with the concentration of<br />
aflatoxins. Cathodic cyclic voltammograms of other aflatoxins for increasing<br />
concentrations are shown in Appendix G. The plots of Ip versus concentrations for<br />
other aflatoxins are shown in Appendix H.<br />
Table 3.0 The dependence of current peaks of aflatoxins to their concentrations<br />
obtained by cathodic cyclic measurement in BRB at pH 9.0<br />
Aflatoxin<br />
AFB1<br />
AFB2<br />
AFG1<br />
AFG2<br />
Regression equation for increasing<br />
concentration from 1.30 to 3.40 µM (n=4)<br />
y = 22.451x + 10.989<br />
y = 21.650x + 6.605<br />
y = 24.756x + 13.072<br />
y = 33.55x + 1.435<br />
R 2<br />
0.9899<br />
0.9807<br />
0.9812<br />
0.9914<br />
Repetitive cathodic stripping voltammetry studies for all aflatoxins were also<br />
carried out in order to observe whether any adsorption phenomenon took place at the<br />
surface of mercury electrode as reported by Ghoneim et al. (2003a). The results show<br />
that the reduction peak of all aflatoxins increases with the number of cycles, which may<br />
be attributed to adsorption of aflatoxins at the mercury electrode surface (Farias et al.,<br />
2003). No other cathodic peak was observed for all cases which show that no other<br />
species was produced by the reduction of aflatoxins. The peak potentials of all<br />
97
aflatoxins were shifted to less negative direction with increasing number of cycles. For<br />
example, repetitive cathodic cyclic voltammograms of AFB2 is shown in Figure 3.13.<br />
Figures 3.14 and 3.15 show the increasing of peak current of AFB2 cathodic peak and<br />
shifting of its peak potential to less negative direction with increasing number of cycle<br />
respectively. For other aflatoxins, their repetitive cyclic voltammogram are shown in<br />
Appendix I.<br />
Figure 3.13 Repetitive cathodic cyclic voltammograms of 1.3 µM AFB2 in BRB<br />
solution at pH 9.0. Experimental conditions are the same as in Figure 3.4.<br />
I p (nA)<br />
60<br />
50<br />
40<br />
30<br />
20<br />
10<br />
0<br />
1 2 3 4 5<br />
No of cycle<br />
Figure 3.14 Increasing Ip of 1.3 µM AFB2 cathodic peaks obtained from repetitive<br />
cyclic voltammetry. Experimental conditions are the same as in Figure 3.4.<br />
98
E p (-mV)<br />
1316<br />
1312<br />
1308<br />
1304<br />
1300<br />
0 1 2 3 4 5 6<br />
No of cycle<br />
Figure 3.15 Peak potential of 1.3 µM AFB2 with increasing number of cycle<br />
obtained by repetitive cyclic voltammetry.<br />
The adsorption of aflatoxins on the electrode surface is expected to be due to the<br />
aflatoxins chemical structures that consist of many functional groups such as ketones,<br />
ester and ether. The presence of these functional groups increases the polarity and<br />
adsorption (Volke and Liska, 1994) of the compound and may be attributed to the<br />
adsorption process taking place on the electrode surface. Furthermore, due to the<br />
presence of the phenyl ring, aflatoxins have surface activity and are readily adsorbed<br />
onto mercury surface (El-Hefnawey et al., 2004). However, a further increase in the<br />
repeatitive cycle tends to slow down the increment of the Ip due to the formation of a<br />
double layer at the mercury electrode (Fifield and Kealey, 2000).<br />
The effect of increasing scan rate, υ (from 20 to 500 mV/s) to the Ep and Ip of<br />
aflatoxins cathodic peaks were observed under the same experimental conditions.<br />
Linear relationship was observed between the log Ip versus log υ for all aflatoxins with<br />
slope values of 0.5346, 0.5097, 0.5623 and 0.5439 for AFB1, AFB2, AFG1 and AFG2<br />
respectively. The slope value of more than 0.5 indicates that the diffusion current<br />
99
produced by the reduction of all aflatoxins on the mercury electrode are influenced by<br />
adsorption in the electrochemical process at the electrode surface (Gosser, 1994 and<br />
Yaridimer and Ozaltin, 2001). For example, a plot of log Ip versus log υ for AFB2 is<br />
shown in Figure 3.16.<br />
Log Ip<br />
1.9<br />
1.7<br />
1.5<br />
1.3<br />
1.1<br />
0.9<br />
0.7<br />
0.5<br />
y = 0.5097x + 0.4115<br />
R 2 = 0.995<br />
1.2 1.4 1.6 1.8 2 2.2 2.4 2.6 2.8<br />
log scan rate<br />
Figure 3.16 Plot of log Ip versus log υ for 1.3 µM AFB2 in BRB solution at pH 9.0.<br />
Experimental conditions are the same as in Figure 3.4.<br />
Plotting Ep versus log υ for scan rates in the range of 20 to 500 mV/s for all<br />
aflatoxins, linear graphs were obtained according to the equation:<br />
a) Ep (-mV) = 61.415 log υ + 1171.6 (R 2 = 0.9987, n = 9) for AFB1 (3.1)<br />
100<br />
b) Ep (-mV) = 40.065 log υ + 1223.2 (R 2 = 0.9936, n = 9) for AFB2 (3.2)<br />
c) Ep (-mV) = 48.484 log υ + 1134.8 (R 2 = 0.9978, n = 9) for AFG1 (3.3)<br />
d) Ep (-mV) = 49.297 log υ + 1146.0 (R 2 = 0.9984), n= 9) for AFG2 (3.4)<br />
The Ep linearly shifted to the more negative direction which confirms the<br />
irreversibility of the reduction processes on the mercury electrode (de Betono et al,<br />
1996 and Arranz et al. 1999). Figure 3.17 shows a plot of Ep of AFB2 versus log υ in<br />
the range of 20 to 500 mV/s. For other aflatoxins, these plots are shown in Appendix J.
Ep (-mV)<br />
1340<br />
1330<br />
1320<br />
1310<br />
1300<br />
1290<br />
1280<br />
1270<br />
y = 40.065x + 1223.3<br />
R 2 = 0.9936<br />
1.2 1.4 1.6 1.8 2 2.2 2.4 2.6 2.8<br />
log scan rate<br />
Figure 3.17 Plot of Ep versus log scan rate for 1.3 µM AFB2 in BRB solution at pH<br />
9.0<br />
A linear plot was obtained for the effect of scan rate on Ip of aflatoxins with 2<br />
linear regions. Taking AFB2 for an example, in the first region which is for the faster<br />
scan rate (100 to 500 mV/s) the equation was linear according to the equation Ip =<br />
0.0759x + 24.566 (R 2 = 0.9917, n = 5) as shown in Figure 3.18. At the second region<br />
where the scan rate was slow (20 to 80 mV/s), the linear equation is Ip = 0.2639x + 6.16<br />
(R = 0.9979, n = 5) which was also linear. Due to the slope of slow scan rate region<br />
that is higher than the fast scan rate region, it can be concluded that the reduction of<br />
aflatoxins on the mercury electrode prefers a slow reaction. The plots for other<br />
aflatoxins are illustrated in Appendix K.<br />
As far as the chemical structures of AFB1, AFB2, AFG1 and AFG2 are<br />
concerned, the main difference of AFB1 and AFG1 with AFB2 and AFG2 is the<br />
absence of double bond in the terminal furan ring of AFB2 and AFG2 compared to<br />
AFB1 and AFG1. From the result, it suggests that this double bond does not play a<br />
major role in the reduction process at the mercury electrode since all of them gave<br />
single cathodic peak at very close potentials. However, the double bond in the benzene<br />
101
ing which conjugates with the keto group has the potential to be reduced on the<br />
mercury electrode and produce cathodic peak.<br />
Ip (nA)<br />
70<br />
60<br />
50<br />
40<br />
30<br />
20<br />
10<br />
0<br />
0 50 100 150 200 250 300 350 400 450 500 550<br />
Scan rate (mv/s)<br />
Figure 3.18 Plot of Ip versus υ for 1.3 µM AFB2 in BRB solution at pH 9.0.<br />
Experimental conditions are the same as in Figure 3.4.<br />
From overall results of CV studies, all aflatoxins reduced at mercury electrode<br />
gave a single cathodic peak with Ip at about 40 ± 5.0 nA for the concentration of 1.3 µM<br />
with Ep between -1.250 V and -1.315 V. All the aflatoxins were adsorbed onto the<br />
mercury electrode. Due to these properties, an adsorptive cathodic stripping<br />
voltammetric technique was developed to obtain more sensitive method for the<br />
determination of trace levels of aflatoxins.<br />
3.2 Differential Pulse Cathodic Stripping Voltammetry (DPCSV) of AFB2<br />
In this experiment, AFB2 was used to represent the aflatoxins since all of them<br />
have the same electrochemical behaviour as those found in previous experiments.<br />
Since the results from CV studies showed that all aflatoxins underwent reduction<br />
102
process only, AFB2 was analysed by DPCSV technique using these parameters; Ei = 0,<br />
Ef = –1.50 V, Eacc = 0 mV, no tacc at υ of 50 mV/s.<br />
103<br />
In this study, AFB2 standard solution was redissolved in BRB at pH 9.0 after the<br />
organic solvent had been completely removed to avoid any effect on the diffusion rate<br />
of electroactive species and the electrical double layer thickness which may increase the<br />
current resistance and further increase the noise level (Kotoucek et al. 1997). BRB<br />
solution at pH 9.0 was used as the supporting electrolyte because from the previous<br />
experiment by CV technique, the BRB solution at pH 9.0 was the best solution for the<br />
determination of aflatoxin. The initial result in Figure 3.19 shows that a single peak<br />
with a peak height (Ip) about 5.0 nA was observed at a peak potential (Ep) of -1.256 V<br />
for 1.0 uM AFB2. The other peak which appears at Ep of -0.92 V is the Zn peak from<br />
the contamination of BRB solution. The single peak at -1.256 V was due to the AFB2<br />
reduction peak since no extra peak was observed as previously confirmed by the CV<br />
technique.<br />
Figure 3.19 DPCS voltammograms of 1.0 µM AFB2 (Peak I) in BRB at pH 9.0 (a) at<br />
tacc = 0 (b) and 30 s (c). Other parameter conditions; Ei = 0, Ef = -1.50 V, Eacc = 0 V, υ =<br />
50 mV/s and pulse amplitude = 100 mV. Peak II is the Zn peak.
The effect of tacc on the Ip of AFB2 peak was also examined. When tacc was set<br />
to 30 s, the Ip of AFB2 increased to 22 nA and at the same time, no increase for the Ip of<br />
the Zn peak (Figure 3.19). This result suggests that AFB2 has been actively adsorbed on<br />
the mercury electrode surface. This phenomenon is similar to the previous result found<br />
by the CV study.<br />
3.2.1 Optimisation of Conditions for the Stripping Analysis<br />
3.2.1.1 Effect of pH and Type of Supporting Electrolyte<br />
The adsorptive cathodic stripping voltammetric response for 2.0 µM AFB2 was<br />
examined in BRB solution over the pH range from 3.0 to 13.0 using cathodic stripping<br />
voltammetry, under the operational conditions: Ei = 0 V, Ef = -1.5 V, Eacc = 0 V, tacc =<br />
30 s, υ = 50 mV/s and pulse amplitude = 100 mV. The results are presented in Figure<br />
3.20.<br />
Figure 3.20 DPCS voltammograms for 2.0 µM AFB2 in BRB (Peak I) at different<br />
pH values: (a) 6.0, (b) 7.0 (c) 8.0 (d) 9.0 (e) 11.0 and (f) 13.0. Eacc = 0 V, tacc = 30 s,<br />
υ= 50 mV/s and pulse amplitude = 100 mV. Peak II is the Zn peak.<br />
104
Since only a single cathodic peak for AFB2 was obtained, it can be concluded<br />
that the AFB2 molecule exhibits one reduction peak over the studied pH. It was found<br />
that for pH less than 4.0, no peak was observed. At pH 4.0 and less, the peak of AFB2<br />
was probably overlapped by hydrogen over potential which appeared at less negative<br />
potential (Abu Zuhri et al, 2000). In acidic conditions, the concentration of hydrogen<br />
ion is higher and more readily reduced at the mercury electrode producing a peak at<br />
potential value around -1.20 V.<br />
Ip (nA)<br />
The single and characteristic AFB2 peak was initially observed at pH 5.0 with Ip<br />
of 11.0 nA and Ep located at -1.119 V. The increase in the pH gradually increased the Ip<br />
until it reached its maximum value at pH 9.0 (45 nA at Ep of -1.192 V). When there is<br />
60<br />
50<br />
40<br />
30<br />
20<br />
10<br />
0<br />
4 6 8 10 12<br />
pH<br />
105<br />
further increase of pH beyond pH 9.0, the Ip decreased until it disappeared at pH 13.0 as<br />
shown in Figure 3.21. This result is not contradictory with that obtained by Smyth et al.<br />
(1979) when they studied the effect of pH of BRB on the peak height of AFB1 using the<br />
differential pulse polarographic (DPP) technique. They also found that BRB at pH 9.0<br />
gave the highest Ip of AFB1.<br />
.<br />
Figure 3.21 Dependence of the Ip for AFB2 on the pH of 0.04 M BRB solution.<br />
AFB2 concentration: 2.0 µM, Ei = 0, Ef = -1.5V, Eacc = 0, tacc = 30 sec, υ = 50 mV/s and<br />
pulse amplitude = 100 mV.
The sharp decrease in Ip at pH 10.0 to 12.0 and no current peak obtained for pH<br />
13.0 indicates that there is deficiency in the amount of hydrogen for reduction process<br />
to take place, hence the peak height decreased. At pH 13.0 no peak was observed<br />
which indicates that at this pH, the chemical structure of AFB2 may be totally damaged<br />
or another reaction has taken place under alkaline medium. This finding was confirmed<br />
by measuring AFB2 in BRB at pH 9.0 and followed with the lower pH such as 4.0 and<br />
subsequently increased to pH 9.0. The measurements were then carried out in the<br />
higher pH such as 10.0, 11.0, 12.0 and 13.0 and then back to 9.0 without changing the<br />
solution. The result of this experiment is shown in Figure 3.22.<br />
I p (n A )<br />
70<br />
60<br />
50<br />
40<br />
30<br />
20<br />
10<br />
0<br />
9 6 4<br />
pH of BRB<br />
6 9<br />
I p (n A )<br />
(a) (b)<br />
70<br />
60<br />
50<br />
40<br />
30<br />
20<br />
10<br />
0<br />
9 10 11 12 13 12 10 9<br />
pH of BRB<br />
Figure 3.22 Ip of 2.0 µM AFB2 obtained in BRB (a) pH from 9.0 decreases to 4.0<br />
and reincrease to 9.0 (b) pH from 9.0 increase to 13.0 and redecrease to 9.0.<br />
Results show that at pH 4.0, no peak was observed but while the pH was<br />
increased to 6.0 and pH 9.0, the peak appeared which indicated that the structure of<br />
AFB2 was not damaged by the strong acidic condition. When pH was adjusted to pH<br />
13.0, the peak dissapeared and no peak was observed even when the pH was re-adjusted<br />
to 9.0 which showed that at pH 13.0, the structure of AFB2 was totally damaged or<br />
transformed to nonelectroactive compound in the strong basic media.<br />
106
The above finding was further confirmed by measuring the absorbance of the<br />
AFB2 using UV-VIS spectrophotometer. The results from UV-VIS technique are<br />
shown in Figures 3.23a, 3.23b and 3.23c for AFB2 in BRb pH 6.0, 9.0 and 13.0<br />
respectively. The results show that no absorbance was obtained at wavelength (λ) of<br />
365 nm for AFB2 in BRB at pH 13.0 while for AFB2 in BRB at pH 6.0 and 9.0 the<br />
absorbance were 0.104 and 0.102 respectively. This was due to the fact that in BRB pH<br />
13.0 the functional group (ketone), one of the UV chromophore which conjugates to<br />
double bond in benzene ring is damaged due to the opening of this ring by the high<br />
basic condition as reported by Janssen et al. (1997).<br />
(a) (b)<br />
(c)<br />
Figure 3.23 UV-VIS spectrums of 1 ppm AFB2 in BRB at pH (a) 6.0, (b) 9.0 and (c)<br />
13.0.<br />
107
Figure 3.24 shows the opening of the lactone ring when AFB2 reacts with high<br />
alkaline solution. When no keto group conjugated with the double bond, it is difficult<br />
for the carbon-carbon double bond in the benzene to be reduced (Smyth and Smyth,<br />
1978) which produce no reduction peak.<br />
O<br />
O<br />
O<br />
O<br />
O<br />
OCH 3<br />
O<br />
O<br />
HO<br />
O<br />
OCH 3<br />
Figure 3.24 Opening of lactone ring by strong alkali caused no peak to be observed<br />
for AFB2 in BRB at pH 13.0.<br />
This results shows that the reduction of AFB2 is totally dependent on the<br />
supporting electrolyte which suggests that the reduction of AFB2 involves the reaction<br />
of AFB2 with hydrogen ions originating from the supporting electrolyte (Abu Zuhri,<br />
2000, Herdenandez et al., 1977 and Rodriguez et al. 2005).<br />
The peak response was also examined in the presence of different buffers such<br />
as phosphate and acetate buffers at the pH 9.0. BRB was selected as the most suitable<br />
supporting electrolyte since it gave the highest Ip and good repeteability, as shown in<br />
Table 3.1. It was found that the presence of peak of AFB2 reduction is strongly<br />
influenced by pH and the buffer constituent.<br />
The supporting electrolyte has two roles to play. The concentration of the<br />
supporting electrolyte regulates the electrical resistance of the cell and it also controls<br />
the migration of ions between the working and secondary electrode (Riley and<br />
Tomlinson, 1987).<br />
108
Table 3.1 Effect of buffer constituents on the Ip of 2.0 µM AFB2 at pH 9.0.<br />
Experimental conditions are the same as in Figure 3.21<br />
Buffer solution<br />
Britton Robinson<br />
Carbonate<br />
Phosphate<br />
Ip (nA)<br />
60<br />
50<br />
40<br />
30<br />
20<br />
10<br />
0<br />
Ip (nA)<br />
50.08<br />
27.82<br />
43.74<br />
Ep (V)<br />
-1.192<br />
-1.130<br />
-1.140<br />
0.02 M 0.04 M<br />
[BRB]<br />
0.08 M<br />
% RSD (n =5)<br />
0.51<br />
1.19<br />
1.35<br />
The effect of different concentrations of BRB at pH 9.0 as the supporting<br />
electrolyte has been carried out and the results are shown in Figure 3.25 which shows<br />
that BRB with 0.04 M concentration gave the highest Ip of AFB2 compared with other<br />
studied concentrations. In 0.08 M, the Ip decreases due to the excess of supporting<br />
electrolyte concentration causing the ionic migration of the aflatoxin to be reduced<br />
(Riley and Tomlinson, 1987).<br />
Figure 3.25 Ip of 2.0 µM AFB2 in different concentration of BRB at pH 9.0.<br />
Experimental conditions are the same as in Figure 3.20.<br />
109
Ip (nA)<br />
60<br />
50<br />
40<br />
30<br />
20<br />
10<br />
0<br />
0.02 M 0.04 M<br />
[BRB]<br />
0.08 M<br />
pH = 6.0<br />
pH = 7.0<br />
pH = 9.0<br />
110<br />
The effect of different pH and concentrations of BRB has been studied and the<br />
results are shown in Figure 3.26. The figure shows that BRB with concentration of 0.04<br />
M at pH 9.0 is the most suitable solution for the voltammetric determination of AFB2.<br />
This can be explained that for 0.04 M at pH 9.0, the migration and adsorption of AFB2<br />
at the working electrode was maximum as compared to other conditions.<br />
Voltammograms of AFB2 in different concentrations of BRB at pH 9.0 are shown in<br />
Figure 3.27<br />
Figure 3.26 Ip of 2.0 µM AFB2 in different pH and concentrations of BRB<br />
Figure 3.27 DPCS voltammograms of 2.0 µM AFB2 (peak I) in (a) 0.04 M, (b) 0.08<br />
M and (c) 0.02 M BRB at pH 9.0 as the blank. Ef = -1.5 V, Eacc = 0 v, tacc = 30 s, υ = 50<br />
mV/s and pulse amplitude = 100 mV. Peak II is the Zn peak
As determined in previous CV and DPCSV experiments, AFB2 were reduced at the<br />
mercury electrode. Based on the chemical structure of aflatoxin, there are a few sites<br />
that may undergo this process. There are double bonds in the terminal furan rings for<br />
AFB1 and AFG1 and a double bond in the benzene ring which is conjugated with the<br />
ketone group for all aflatoxins. Further investigations have been carried out to confirm<br />
which site is actually involved in this reduction reaction at the mercury electrode by<br />
voltammetric study of separate basic compounds that form aflatoxins which are 2,3<br />
dihydrofuran and coumarin.<br />
Another compound is tetrahydrofuran but it does not have any double bond in<br />
their chemical structure which may not be reducable at the electrode, hence no detailed<br />
investigation has been carried out. Their chemical structures are shown in Figures 3.28a<br />
to 3.28c. Other possibility of the chemical structure that form aflatoxin compound was<br />
not studied due to the unavailability of the compound.<br />
O O<br />
(a) (b) (c)<br />
Figure 3.28<br />
coumarin<br />
Chemical structures of (a) 2,3 dihydrofuran (b) tetrahydrofuran and (c)<br />
Voltammograms of 0.02 to 0.2 µM of 2,3 dihyrofuran in BRB pH 9.0 are shown<br />
in Figure 3.29. There is a small peak observed at -1.21 V which has not significantly<br />
increased when the concentration was increased. The result indicates that 2,3<br />
dihydrofuran is not reduced at the mercury electrode which indicates that the reduction<br />
of AFB1 and AFG1 is not due to the reduction of double bond in their terminal furan<br />
rings.<br />
O<br />
O<br />
111
Figure 3.29 Voltammograms of 2,3 dihydrofuran (peak I) for concentrations from (b)<br />
0.02 to 0.2 µM in (a) BRB at pH 9.0. Peak II; Zn peak.<br />
The second compound that may undergo reduction at the mercury electrode is<br />
coumarin (Figure 3.27c). Increasing the concentration of coumarin yields a linear<br />
relationship of Ip corresponding to an equation of y = 25.877x – 35.5 (R 2 = 0.9953).<br />
A plot of Ip versus concentration of coumarin is shown in Figure 3.30.<br />
Ip (nA)<br />
500<br />
400<br />
300<br />
200<br />
100<br />
0<br />
y = 25.877x - 35.5<br />
R 2 = 0.9953<br />
0 5 10 15 20<br />
[Coumarin] x10 -5 M<br />
Figure 3.30 Dependence of Ip of coumarin to its concentrations<br />
112
The voltammograms of coumarin with increasing concentration are represented<br />
in Figure 3.31which shows that it was reduced at the mercury electrode producing sharp<br />
and characteristic peak at Ep of -1.49 V. The result of voltammetric study of coumarin<br />
shows that it is solely involved in the reduction of all studied aflatoxins.<br />
As electrochemical behaviour of the aflatoxins closely parallels that of<br />
coumarin, it is likely that the electroactivity of these compounds is associated with<br />
coumarin moiety in their molecules structure. The main difference in behaviour lies in<br />
the fact that the reduction of the aflatoxins occurs at a potential of about 300 – 400 mV<br />
more positive than that for coumarin. This can be explained by the increased<br />
conjugation caused by ketone group in the neighbouring cyclopentanone (AFB1 and<br />
AFB2) or δ-lactone (AFG1 and AFG2) rings. Based on this reason, aflatoxins are<br />
easier to reduce compared to coumarin and their Ep are located at more positive than<br />
that for coumarin.<br />
Figure 3.31 Voltammograms of coumarin at concentration of (b) 34 µM, (c) 68 µM,<br />
(d) 102 µM, (e) 136 µM and (f) 170 µM in (a) BRB at pH 9.0<br />
113
Based on all previous results, it can be concluded that a double bond in the<br />
benzene ring which conjugates with the ketone group undergoes a reduction reaction<br />
that produces a single cathodic peak for all studied aflatoxins. This finding is also in<br />
O<br />
O<br />
HO<br />
O<br />
HO<br />
O<br />
CH 3<br />
CH 3<br />
OH<br />
114<br />
agreement with a few reports that have been previously published for compounds that<br />
have a double bond in the benzene ring which has conjugated with the ketone group<br />
reduced at the mercury electrode. For example, cortisone and testosterone were reduced<br />
and peaks were obtained for the reduction of the C = C double bond at -1.77 V and -<br />
1.84 V (versus SCE) respectively in 0.1 M tri-ethyl ammonium per chlorate (TEAP)–<br />
50 % methanol as reported by Smyth and Smyth (1978). Both compounds are 3-keto<br />
steroids with un-saturation between C4 and C5 as shown in Figure 3.32a and 3.32b.<br />
(a) (b)<br />
Figure 3.32 Chemical structures of (a) cortisone and (b) testosterone.<br />
Smyth and Smyth (1978) also reported that cardiovascular drugs such as digoxin<br />
and digitoxin (Figure 3.33) also undergo reduction reaction which occurs at C=C bond<br />
in the five membered ring structure containing the conjugated carbonyl group. Using<br />
DPP technique, digoxin and digitoxin gave peak at -2.285 V and -2.325 V (versus SCE)<br />
respectively in propan-2-ol – 0.01 M tetrabutylammonium bromide (TBAB).
(C18H31O9)O<br />
CH 3<br />
H<br />
OH<br />
CH 3<br />
OH<br />
O<br />
O<br />
(C18H31O9)O<br />
CH 3<br />
(a) (b)<br />
Figure 3.33 Chemical structures of (a) digoxin and (b) digitoxin.<br />
H<br />
CH 3<br />
OH<br />
O<br />
115<br />
Other examples for the compounds that undergo reduction reaction which occurs<br />
at C=C bond in their chemical structures are listed in Table 3.2. Other compounds that<br />
have the same chemical structure and reduced at the mercury electrode produce<br />
cathodic peak are enoxacin (Zhang et al. 1996), ofloxacin (Rizk et al. 1998) and<br />
Alizarin Red S (ARS) (Sun and Jiao, 2002). Based on the previous reports, taking into<br />
account that the molecular structure of AFB2 is similar in case where the carbonyl<br />
group conjugates to the double bond in the benzene ring, it is assumed that AFB2<br />
undergoes reduction reaction at the mercury electrode whereby C=C bond in its<br />
chemical structure is reduced at the mercury electrode.<br />
The Ep of AFB2 is also pH dependent and shifted towards a more negative<br />
direction in increasing pH of the BRB solution which indicates the involvement of<br />
protons in the AFB2 electrode reaction (Ghoneim et al., 2003a and Rodriguez et al.,<br />
2004). A plot of Ep versus pH of supporting electrolyte is illustrated in Figure 4.34.<br />
Two ranges were observed in the Ep – pH plot (Range I for pH from 5 to 8 and Range II<br />
for pH from 9 to 12 as in Figure 4.33) with an intersection point at pH 8.7 which was<br />
thought to correspond to the pKa value of the adsorbed AFB2 (Navalion et al. 2002).<br />
This result again suggests that the deprotonated form of the AFB2 is the electroactive<br />
species adsorbed in the HMDE.<br />
O
Table 3.2 Compounds reduced at the mercury electrode<br />
Compound<br />
Imidazoacridinone<br />
Warfarin<br />
Lavonogestrel<br />
Nalidixic acid<br />
O<br />
Chemical structure<br />
H3C<br />
O<br />
N<br />
NHCH2N(CH2CH3)2<br />
N<br />
O O<br />
H<br />
ONa CH2COCH3<br />
N N<br />
C2H5<br />
O<br />
HO<br />
CCH<br />
COOH<br />
Ep (V)<br />
-1.41<br />
-1.40<br />
-1.44<br />
-1.30<br />
Supporting<br />
electrolyte<br />
Phosphate<br />
buffer at<br />
pH 7.4<br />
BRB at<br />
pH 5.0<br />
BRB at<br />
pH 3.0<br />
BRB at<br />
pH 5.0<br />
Reference<br />
Cakala et<br />
al., (1999)<br />
116<br />
Ghoneim<br />
and Tawfik,<br />
(2004)<br />
Ghoneim et<br />
al., (2004a)<br />
Ibrahim et<br />
al., (2002)
Ep (-mV)<br />
1250<br />
1200<br />
1150<br />
1100<br />
Range I<br />
4 6 8 10 12 14<br />
pH<br />
Range II<br />
Figure 3.34 Effect of pH of BRB solution on the Ep for AFB2. AFB2 concentration:<br />
2.0 µM, Ei = 0, Ef = -1.5 V, Eacc = 0, tacc = 30s, υ = 50 mV/s.<br />
The relation between Ep and pH of the medium over the range, 5.0 to 8.0 is expressed<br />
by the following equation:<br />
Ep (-mV) = 21.4 pH + 1015.9 (R 2 = 0.9777, n = 4) (3.5)<br />
The Ep remains constant for pH 10.0 to pH 12.0 which suggests that within this range of<br />
pH, the reaction is independent of the number of protons involved in the reduction<br />
process.<br />
3.2.1.2 Optimisation of Instrumental Conditions<br />
The voltammetric determination of analyte at trace level normally involves very<br />
small current responses. For that reason it is important to optimise all the parameters<br />
which may have an influence on the measured current. From the previous experiment,<br />
BRB solution at pH 9.0 was chosen as the best supporting electrolyte, thus this solution<br />
has been used throughout this optimisation procedure using differential pulse cathodic<br />
117
stripping voltammetry (DPCSV) technique. The effect of Ei, Ef, Eacc, tacc, υ and pulse<br />
amplitude to the Ip and Ep and of AFB2 peak have been studied. This optimisation<br />
procedure used two different concentrations of AFB2 which are 2.0 µM and 0.06 µM<br />
for high and low concentrations respectively. The former has been initially used<br />
followed with the latter as the final optimisation step. The initial parameters used for<br />
this optimisation were; Ei = 0 mV, Ef = -1500 mV, Eacc= 0 mV, tacc = 15 s, υ = 20 mV/s,<br />
pulse amplitude = 100 mV and quiescent time = 10 sec. Using all the stated parameters,<br />
the Ip obtained for 2.0 µM of AFB2 was 29 nA and the Ep was -1.240 V.<br />
3.2.1.2a Effect of Scan Rate (υ)<br />
Ip (nA )<br />
50<br />
40<br />
30<br />
20<br />
10<br />
0<br />
0 20 40 60 80 100 120<br />
Scan rate (mV/s)<br />
Ep (-mV)<br />
1320<br />
1290<br />
1260<br />
1230<br />
0 30 60 90 120<br />
Scan rate (mV/s)<br />
118<br />
The dependence of Ip and Ep of AFB2 on υ has been studied. The υ was varied from 20<br />
to 100 mV/s while other parameters were unchanged. Figure 3.35a shows a maximun<br />
response (36 nA) obtained at scan rate of 40 mV/s.<br />
(a) (b)<br />
Figure 3.35 Effect of various υ to the (a) Ip and (b) Ep of 2.0 µM AFB2 peak in<br />
BRB pH 9.0. Ei = 0, Ef = -1.50 V, Eacc = 0, tacc = 15 s and pulse amplitude = 100 mV.<br />
Ip decreases slowly for the increasing υ from 50 to 80 mV/s and sharply drops for 100<br />
mV/s. The increasing υ has shifted the Ep of AFB2 towards a more negative direction<br />
according to the equation;
Ip (nA)<br />
60<br />
40<br />
20<br />
0<br />
E (-mV) = 0.6x (mV/s) + 1230.4 (R 2 = 0.9896, n = 5) (3.6)<br />
as shown in Figure 3.35b. From this study, the υ of 40 mV/s was used for further<br />
optimisation step.<br />
3.2.1.2b Effect of Accumulation time (tacc)<br />
The effect of tacc to the Ip and Ep of AFB2 peak have been studied over the range<br />
of 15 to 60 s as shown in Figure 3.36. It was found that, for the first 40 s, the Ip<br />
increases with tacc. This is due to the larger amount of AFB2 which has accumulated at<br />
the electrode surface with longer tacc. Since the amount of AFB2 is proportional to the<br />
tacc, the resulting peak currents yield a straight line when plotted against the tacc within<br />
the stated accumulation range as shown in Figure 3.36a. This relationship follows the<br />
equation;<br />
Ip (nA) = 0.4895x (x 10 -6 M) + 26.132 (R 2 = 0.9727, n = 5) (3.7)<br />
0 20 40 60<br />
Accumulation time (s)<br />
E p (-m V )<br />
1280<br />
1270<br />
1260<br />
1250<br />
1240<br />
1230<br />
0 20 40 60<br />
Accumulation time (s)<br />
(a) (b)<br />
Figure 3.36 Effect of tacc on (a) Ip and (b) Ep of 2.0 µM AFB2 in BRB at pH 9.0. Ei =<br />
0, Ef = - 1.50 V, Eacc = 0 mV, υ = 40 mV/s and pulse amplitude = 100 mv.<br />
However, when the tacc is longer than 40s, the Ip slowly decreases which is due to the<br />
complete coverage of the electrode surface (Wang, 1985). This complete coverage<br />
119
phenomenon can be confirmed by increasing drop size of HMDE which resulting<br />
increased of the peak height.<br />
3.2.1.2c Effect of Accumulation Potential (Eacc)<br />
The influence of Eacc to the Ip and Ep of AFB2 reduction peak has been<br />
observed. An Eacc means the potential at which the AFB2 is deposited at the mercury<br />
electrode surface. The optimised Eacc refers to the potential that is the most effective for<br />
the deposition of the AFB2 at the mercury electrode surface while AFB2 solution<br />
remains unstirred which produces the largest Ip and minimum side reaction. (Wang,<br />
1985). The result shown in Figure 3.37 shows that over a range of 0 to -1200 mV, a<br />
highest Ip was found at Eacc of -800 mV which indicates that at this potential, strong<br />
adsorption of AFB2 takes place on the electrode surface. The Ip and Ep of AFB2 at this<br />
optimum Eacc are 50 nA and -1.248 V respectively.<br />
Ip (nA)<br />
60<br />
50<br />
40<br />
30<br />
20<br />
10<br />
0<br />
0 400 800<br />
Eacc (-mV)<br />
1200<br />
E p (-m V )<br />
1258<br />
1256<br />
1254<br />
1252<br />
1250<br />
1248<br />
1246<br />
(a) (b)<br />
0 200 400 600 800 1000 1200 1400<br />
Eacc (-mV)<br />
Figure 3.37 The relationship between (a) Ip and (b) Ep with Eacc for 2.0 µM AFB2<br />
in BRB at pH 9.0. Ei = 0, Ef = -1.50 V, tacc = 15 s, υ = 40 mV/s and pulse amplitude =<br />
100 mV.<br />
A linear response was obtained for the Eacc over a range of 0 to -0.80 V ( R 2 = 0.9769, n<br />
= 5). From Figure 3.37b, for Eacc at more negative than -0.80 V with the same Ei (Ei =<br />
0), Ep of AFB2 were constant which indicates that after the maximum Eacc was achieved<br />
and the accumulation process of AFB2 at electrode surface was not effective, there are<br />
120
no more changes in Ep. At the same time, Ip decreased until it totally disappeared at Eacc<br />
of -1.5 V. The result does not contradict with the suggestion made by Harvey (2000)<br />
that the Eacc was usually several tenths of a volt (0.3 to 0.5 V) before the Ep of<br />
electroactive species being investigated. Since the highest Ip with no extra peak was<br />
obtained at an Eacc of -0.80 V, this potential was chosen as the optimum Eacc.<br />
3.2.1.2d Effect of Initial Potential (Ei)<br />
Ip (nA )<br />
70<br />
60<br />
50<br />
40<br />
30<br />
20<br />
10<br />
0<br />
Further optimisation was performed by observing the effects of Ei to the Ip and<br />
0 300 600<br />
Ei (-mV)<br />
900 1200<br />
Ep (-m V)<br />
1260<br />
1256<br />
1252<br />
1248<br />
1244<br />
1240<br />
0 300 600<br />
Ei (-mV)<br />
900 1200<br />
121<br />
Ep of AFB2. The Ei used in this study were 0, 200, 400, 600, 800 and 1000 mV while Ef<br />
was kept constant at -1500 mV. The result is shown in Figure 3.38a. The result indicates<br />
that when the Ei was changed to more negative values, the Ip slowly decreased until the<br />
Ei was -800mv. However at -1000 mV the Ip sharply increased and gave a maximum<br />
response (53 nA). In other words, when the Ei was changed through this manner, the<br />
window of scanning potential was smaller and hence, the time for analysis became<br />
shorter. For Ei which was more negative than -1000 mV, the scan was not performed<br />
due to the very short range of scanning potential. Also because of the instrumental<br />
limitations, this experiment cannot be continued unless other instrumental parameters<br />
such as pulse amplitude and υ are changed.<br />
(a) (b)<br />
Figure 3.38 Effect of Ei on (a) Ip and (b) Ep of 2.0 µM AFB2 in BRB at pH 9.0. Ef = -<br />
1.50 V, Eacc = -0.80 V, tacc = 40 s, υ = 40 mV/s and pulse amplitude = 100 mV
Ip (nA )<br />
80<br />
60<br />
40<br />
20<br />
0<br />
0 30 60 90 120 150<br />
Pulse amplitude (mV)<br />
Ep (-mV)<br />
1300<br />
1260<br />
1220<br />
1180<br />
1140<br />
0 30 60 90 120<br />
Pulse amplitude (mV)<br />
122<br />
From Figure 3.38b, Ep remains constant for Ei of 0 to -400 mV. It started to shift<br />
towards a more negative direction when the Ei was -600 mV and remained constant<br />
after this value. This experiment reveals that the best potential window was from -1.0<br />
V to -1.50 V which can save the analysis time and at the same time gave maximum Ip.<br />
3.2.1.2e Effect of Pulse Amplitude<br />
The effect of the pulse amplitude on the Ip shows that the Ip increased and Ep<br />
displaced towards less negative direction when the pulse amplitude increased from the<br />
range of 30 to 100mV as shown in Figure 4.39. The result shows that a maximum value<br />
of Ip (53 nA) was obtained at pulse amplitude of 100 mV. At the higher value of pulse<br />
amplitude, the Ip is slightly increased but peak broadening was observed, so 100 mV is<br />
chosen for optimum pulse amplitude.<br />
(a) (b)<br />
Figure 3.39 Effect of pulse amplitude on (a) Ip and (b) Ep of 2.0 µM AFB2 in BRB at<br />
pH 9.0. Ei = -1.0 V, Ef = -1.50 V, Eacc = -0.80 V, t acc = 40 s and υ = 40 mV/s.<br />
From this study, the optimum conditions for electroanalytical determination of<br />
2.0 µM AFB2 by DPCSV technique were as follows; Ei = -1.0 V, Ef = - 1.5 V,<br />
Eacc = -0.80 V, tacc = 40 s, υ = 40 mV/s and pulse amplitude = 100 mV. Using this<br />
optimised parameters, the Ip and Ep of 2.0 uM AFB2 were found to be 53 nA and -1.208<br />
V respectively which was able to enhance the peak current to about 83% as compared to<br />
that obtained by unoptimised parameters.
ip (nA)<br />
20<br />
15<br />
10<br />
5<br />
0<br />
0 400 800 1200 1600<br />
Accumulation potential (-mV)<br />
123<br />
From the previous optimisation procedures, the Ip of AFB2 was enhanced by<br />
83% and an attempt was made to get higher Ip by further optimisation steps using the<br />
lower concentration of AFB2. The reason is using high concentration of AFB2 may lead<br />
to the formation of mercury electrode saturation due to the adsorption of AFB2. This<br />
optimisation was carried out using 0.06 µM AFB2 and all previous optimised<br />
parameters were applied.<br />
The optimisation steps followed the same procedure as for 2.0 µM AFB2. The Ip<br />
and Ep initially obtained for 0.06 µM AFB2 were 13.90 nA and -1.232 V respectively.<br />
The effect of Eacc on the Ip and Ep of AFB2 as shown in Figure 3.40 revealed that the Ip<br />
obtained for Eacc of -200 mV, -400 mV, -600 mV, -800 mV and -1000mV are not<br />
similar which were about 14 nA compared to 11.37 nA and 12.42 nA for 0 and -1100<br />
mV respectively. No peak was observed for Eacc more negative than -1100 mV.<br />
Figure 3.40 Effect of Eacc on Ip of 0.06 µM AFB2. Ei = - 1.0 V, Ef = -1.50 V, tacc = 40<br />
s, scan rate = 40 mV/s and pulse amplitude = 100 mV.<br />
Using the potential window of Ei = -1.0 V and Ef = -1.4 V, the optimum Eacc<br />
was -0.60 V which gave the Ip of 16.84 nA compared to another potential range (Ei = -<br />
1.0 V and Ef = -1.50 V) which produced only 13.78 nA. The Ep of AFB2 remained<br />
constant for all studied Eacc. The results suggested that using lower concentration, the<br />
optimum Eacc is less negative compared to the higher concentration because for the<br />
lower concentration, the electroactive species could easily completely reduce at the<br />
mercury electrode. The Ep of AFB2 was independent of the Eacc at the low
concentrations. From this experiment, Eacc = -0.6 V, Ei = -1.0 V and Ef = -1.40 V were<br />
chosen as the optimum condition for Eacc and potential window respectively.<br />
The effect of the tacc to the Ip of AFB2 was also investigated and the result is<br />
shown in Figure 3.41a which shows that by increasing tacc, for the range of 20 to 80 s,<br />
the Ip linearly increased following the equation:<br />
Ip (nA )<br />
50<br />
40<br />
30<br />
20<br />
10<br />
0<br />
Ip (nA) = 0.4038x (x s) - 0.2847 (R 2 = 0.999, n = 5) (3.8)<br />
The maximum Ip of 31.86 nA was obtained at an Eacc of 80 s. When AFB2 was<br />
deposited at the mercury electrode for more than 80 s, the Ip was not significantly<br />
increased (Figure 3.41a) which may be due to the saturation of the mercury electrode<br />
surface and adsorptive equilibrium was achieved (Shams et al. 2004). Due to this<br />
reason, the tacc at 80 s was chosen as the optimum tacc . The Ep of AFB2 was shifted<br />
toward less negative direction with increasing tacc as shown in Figure 3.41b.<br />
0 30 60 90 120 150<br />
Accumulation time (s)<br />
E p (-m V)<br />
1250<br />
1240<br />
1230<br />
1220<br />
1210<br />
1200<br />
0 30 60 90 120 150<br />
t acc (s)<br />
(a) (b)<br />
Figure 3.41 Effect of tacc on (a) Ip and (b) Ep of 0.06 µM in BRB at pH 9.0. Ei = - 1.0<br />
V, Ef = -1.40 V, tacc = 80 s, υ = 50 mV/s and pulse amplitude = 100 mV.<br />
124<br />
The relationship between the υ and Ip of AFB2 cathodic peak was also<br />
investigated, which revealed that when the υ is increased, the Ip also increased as shown
in Figure 3.42a. For the υ between 20 to 50 mV/s, the Ip is linearly proportional to the υ<br />
according to the following equation:<br />
I p (n A)<br />
50<br />
40<br />
30<br />
20<br />
10<br />
0<br />
Ip (nA) = 0.6481x (x mV/ s) + 5. 8407 (R 2 = 0.9999 n = 3) (3.9)<br />
The Ip was not significantly different when the υ was faster than 60 mV/s. Therefore,<br />
50 mV/s was selected as the optimum υ which gave the maximum Ip of AFB2. The Ep<br />
of AFB2 has linearly shifted towards a more negative direction for this range and a<br />
small change for the υ of 60 and 80 mV/s as shown in Figure 3.42b. Due to<br />
instrumentation limitations, for the υ of 50 mV/s, the pulse amplitude was changed to<br />
80 mV instead of 100 mV. Without that, the Ip of AFB2 could not be automatically<br />
calculated by the computer software. The maximum Ip that was obtained from this<br />
optimisation was 38.18 nA at Ep of -1.23 V which was about 200% higher than before<br />
being optimised (13.90 nA at -1.232 V). Figure 3.44 illustrates the voltammograms of<br />
0.06 uM AFB2 obtained under optimised and unoptimised conditions.<br />
0 20 40 60 80 100<br />
Scan rate (mV/s)<br />
Ep ( -m V )<br />
1225<br />
1220<br />
1215<br />
1210<br />
1205<br />
1200<br />
0 20 40 60 80 100<br />
Scan rate (mV/s)<br />
(a) (b)<br />
Figure 3.42 Effect of υ on (a) Ip and (b) Ep of 0.06 µM AFB2. Ei = - 1.0 V, Ef = -1.40<br />
V, Eacc = -0.60 V and pulse amplitude = 80 mV.<br />
125
Figure 3.43 Voltammogramms of 0.06 µM AFB2 obtained under (a) unoptimised and<br />
(b) optimised parameters in BRB at pH 9.0.<br />
From this optimisation steps, the final optimum parameters of DPCSV for<br />
determination of 0.06 µM AFB2 compound are; Ei = -1.0 V, Ef = -1.40 V, Eacc =<br />
-0.60 V, tacc = 80 s, υ = 50 mV/s and pulse amplitude = 80 mV. Table 3.3 represents all<br />
optimised parameters for both low and high concentrations of AFB2.<br />
Table 3.3 Optimum parameters for 0.06 µM and 2.0 µM AFB2 in BRB at pH 9.0<br />
Parameters<br />
Ei (V)<br />
Ef (V)<br />
Eacc (V)<br />
tacc (s)<br />
υ (mV/s)<br />
Pulse amplitude<br />
0.06 µM AFB2<br />
-1.0<br />
-1.4<br />
-0.6<br />
80<br />
50<br />
80<br />
2.0 µM AFB2<br />
-1.0<br />
-1.5<br />
-0.8<br />
40<br />
40<br />
100<br />
126
For voltammetric study of other aflatoxin except AFG1, the optimum<br />
parameters for lower concentration of AFB2 was used throughout the experiments since<br />
it give more sensitive and shorter analysis time compared to other optimum parameters.<br />
For AFG1, only Ei was changed to -0.95 V to obtain the peak that is located at the<br />
middle of the potential range.<br />
3.2.2 Analysis of Aflatoxins<br />
The optimum parameters determined were then used for determination of 0.1<br />
µM AFB2, AFB1, AFG1 and AFG2. The values of Ip and Ep obtained from these<br />
analysis are listed in Table 3.4. The relative standard deviation (RSD) for five<br />
measurements of each aflatoxins are less than 5% which means that the precision of the<br />
method is good and the obtained analytical information has good reliability as reported<br />
by Aboul-Eneim et al. (2001). Voltammograms of each aflatoxin are shown in Figure<br />
3.44a to 3.44d. Voltammograms of four aflatoxins which were mixed together are<br />
shown in Figure 3.45 which shows that the combination of peak from AFB1 and AFB2<br />
and also from AFG1 and AFG2 produced two shoulders.<br />
Table 3.4 The Ip and Ep of aflatoxins obtained by optimised parameters in BRB at<br />
pH 9.0 using DPCSV technique<br />
Aflatoxin, 0.1 µM<br />
AFB1<br />
AFB2<br />
AFG1<br />
AFG2<br />
Ip (nA), (n=5)<br />
57.38 ± 0.43<br />
57.49 ± 1.02<br />
56.85 ± 1.28<br />
56.20 ± 1.16<br />
RSD (%)<br />
0.75<br />
1.77<br />
2.25<br />
2.06<br />
Ep (V)<br />
-1.22<br />
-1.23<br />
-1.15<br />
-1.17<br />
127
(a) (b)<br />
(c) (d)<br />
Figure 3.44 Voltammograms of 0.1 µM (a) AFB1, (b) AFG1, (c) AFB2 and (d)<br />
AFG2 in BRB at pH 9.0. Ei = -1.0 V (except for AFG1 = -0.95 V), Ef = -1.4 V,<br />
Eacc = -0.6 V, tacc = 80 s, υ = 50 mV/s and pulse amplitude = 80 mV.<br />
128
Figure 3.45 Voltammograms of (b) mixed aflatoxins in BRB at pH 9.0 as the blank<br />
(a). Parameters condition; Ei = -0.95 V, Ef = -1.4 V, Eacc = -0.6 V, tacc = 80 s, υ = 50<br />
mV/s and pulse amplitude = 80 mV.<br />
A study was carried out to observe a relationship between Ip and concentration<br />
of aflatoxins. For each aflatoxin, the calibration curve was prepared by a series of<br />
standard addition of aflatoxins. Statistical parameters such as linearity range, R 2 value,<br />
limit of detection (LOD), limit of quantification (LOQ), accuracy and precision were<br />
evaluated. For ruggedness and robustness tests of the proposed technique, only AFB2<br />
was used.<br />
3.2.2.1 Calibration Curves of Aflatoxins and Validation of the Proposed Method<br />
3.2.2.1a Calibration curve of AFB2<br />
The calibration curve for AFB2 determination was established by applying the<br />
developed procedure. The Ip of AFB2 with increasing concentration is shown in Figure<br />
3.46 which shows that after Ip achieved its maximum value it tends to level off with<br />
further addition of AFB2 standard solution as expected for a process that was limited by<br />
adsorption of analyte. This phenomenon was similarly observed in the previous study<br />
129
carried out by the CV technique. The linear plot of Ip versus the concentration of AFB2<br />
is shown in Figure 3.47. Their voltammograms are shown in Appendix L<br />
I p (nA)<br />
Ip (nA)<br />
250<br />
200<br />
150<br />
100<br />
50<br />
0<br />
200<br />
160<br />
120<br />
80<br />
0 10 20 30 40 50<br />
[AFB2] x 10 -8 M<br />
Figure 3.46 Increasing concentration of AFB2 in BRB at pH 9.0. The parameter<br />
conditions are Ei = -1.0 V, Ef = -1.4 V, Eacc = -0.60 V, tacc = 80 s, υ = 50 mV/s and<br />
pulse amplitude = 80 mV.<br />
y = 5.5385x + 3.2224<br />
R 2 40<br />
0<br />
= 0.9980<br />
0 10 20<br />
[AFB2] X10<br />
30 40<br />
-8 M<br />
Figure 3.47 Linear plot of Ip versus concentration of AFB2 in BRB at pH 9.0. The<br />
parameter conditions are the same as in Figure 4.46<br />
It shows that the range of linearity was found to be from 2.0 to 32.0 x 10 -8 M<br />
(6.29 to 100.63 ppb) with a LOD of 0.796 x 10 -8 M (2.50 ppb) and LOQ was 2.65 x<br />
10 -8 M (8.33 ppb). The R 2 value was 0.9980. The LOD was determined by standard<br />
130
addition of lower concentration of analyte until a sample peak is obtained that was<br />
significantly different from the blank signal (Barek et al., 1999).<br />
For the determination of precision of the developed method, the reproducibility<br />
was calculated from 8 independent measurements of 0.10 µM and 0.20 µM of AFB2<br />
solution on the same day, obtaining relative standard deviations (RSD) of 2.83 % and<br />
0.72% respectively. The precision is good since the mean values do not exceeds 15%<br />
of the variance coefficient (CV) (Torreiro et al. 2004). Voltammograms of these<br />
measurements are shown in Appendix M. For the inter-days (within 3 days) accuracy<br />
determinations, the RSD for day 1, day 2 and day 3 obtained for measurement of 0.10<br />
µM are 2.83%, 2.39% and 1.31% respectively and for 0.20 µM were 0.72 %, 1.03 %<br />
and 0.98 %. Voltammograms of these measurements for 0.10 µM AFB2 are shown in<br />
Appendix N. The results of these precision studies for intra-day and inter-day are<br />
shown in Table 3.5.<br />
Table 3.5 Ip (in nA) obtained for intra-day and inter-day precision studies of 0.10<br />
µM and 0.20 µM by the proposed voltammetric procedure (n=8)<br />
[AFB2]<br />
0.1 µM<br />
0.2 µM<br />
Intra-day<br />
measurement<br />
Ip ± SD (RSD)<br />
57.68 ± 1.63<br />
(2.83%)<br />
114.87 ± 0.83<br />
(0.72%)<br />
Day 1<br />
57.68 ± 1.63<br />
(2.83%)<br />
114.87 ± 0.83<br />
(0.72%)<br />
Inter-day measurement<br />
Ip ± SD (RSD)<br />
Day 2<br />
56.52 ± 1.35<br />
(2.39%)<br />
113.85 ± 1.17<br />
(1.03 %)<br />
Day 3<br />
56.59 ± 0.74<br />
(1.31%)<br />
112.78 ± 1.11<br />
(0.98%)<br />
131
The accuracy of the method is defined as the closeness of agreement between<br />
the experiment result and the true value (Chan et al., 2004). It is determined by<br />
calculating the percentage of relative error between the measured mean concentrations<br />
and the added concentrations (Torriero, 2004). In order to determine the accuracy of<br />
the proposed method, a recovery study was carried out by the addition of an amount of<br />
three different concentrations of AFB2 (0.10 µM, 0.15 µM and 0.20 µM) into the<br />
voltammetric cell and measuring the peak currents of respective concentrations. The<br />
actual amount of AFB2 found in the cell were calculated using the obtained regression<br />
equation (y = 5.5385x + 3.2224). The recoveries obtained were 97.29 ± 1.29 %, 97.15 ±<br />
0.79 % and 99.39 ± 0.50 % respectively as shown in Table 3.6. The result shows that<br />
the recovery of AFB2 standard is considered good.<br />
No of<br />
experiment<br />
1<br />
2<br />
3<br />
Table 3.6 Mean values for recovery of AFB2 standard solution (n = 3)<br />
Amount<br />
added<br />
(x 10 -8 M)<br />
10<br />
15<br />
20<br />
Ip (nA)<br />
56.32<br />
55.45<br />
58.04<br />
85.21<br />
84.78<br />
85.10<br />
113.85<br />
114.20<br />
113.75<br />
Amount<br />
found<br />
(x 10 -8 M)<br />
9.59<br />
9.44<br />
9.88<br />
14.80<br />
14.73<br />
14.78<br />
19.97<br />
20.03<br />
19.94<br />
Recovery<br />
(%)<br />
95.90<br />
94.40<br />
98.80<br />
98.67<br />
98.25<br />
98.53<br />
99.85<br />
100.15<br />
99.70<br />
%Recovery ± SD<br />
(RSD)<br />
96.37 ± 2.24<br />
(2.39 %)<br />
98.47 ± 0.24<br />
(0.24 %)<br />
99.90 ± 0.23<br />
(0.23 %)<br />
132
The robustness of the proposed technique was evaluated by examining the<br />
influence of small variation in some of the most important procedural conditions,<br />
including pH (8.5 to 9.5), Eacc (-0.59 V and -0.61 V) and tacc (75 s and 85 s) to the Ip of<br />
AFB2 (Ghoneim et al., 2004b). The results of these studies are shown in Table 3.7.<br />
Using F test with 95 % degree of freedom, the results showed that none of these<br />
variables significantly affected the obtained Ip of AFB2. Thus, the proposed technique<br />
could be considered robust.<br />
Table 3.7 Influence of small variation in some of the assay conditions of the<br />
proposed procedure on its suitability and sensitivity using 0.10 µM AFB2<br />
Variable<br />
pH 9.0<br />
8.5<br />
9.5<br />
Eacc -0.60 V<br />
-0.59 V<br />
-0.61 V<br />
tacc 80 s<br />
75 s<br />
85 s<br />
Condition<br />
Eacc = -0.60 V<br />
tacc = 80 s<br />
pH = 9.0<br />
tacc = 80 s<br />
pH = 9.0<br />
Eacc = -0.60 V<br />
Ip of AFB2 (nA)<br />
± SD, n=5<br />
60.62 ± 0.88<br />
58.82 ± 0.79<br />
59.30 ± 0.44<br />
60.62 ± 0.88<br />
58.78 ± 1.02<br />
59.82 ± 0.91<br />
60.62 ± 0.88<br />
58.78 ± 0.48<br />
60.90 ± 0.76<br />
Recovery ±SD (%)<br />
n = 5<br />
103.01 ±1.50<br />
100.33 ± 1.35<br />
101.15 ± 0.75<br />
103.01 ± 0.48<br />
100.26 ± 1.75<br />
102.04 ± 1.56<br />
103.01 ± 0.48<br />
100.26 ± 0.82<br />
103.49 ± 1.30<br />
Moreover, the ruggedness of the proposed technique was examined by applying<br />
the procedure to the analysis of 0.1 µM AFB2 using two potentiostat models, BAS CV<br />
133
450 W and VA 757 Metrohm Analysers, under the same optimised experimental<br />
parameters. The results of these studies are listed in Table 3.8. Using the same<br />
statistical test, the results show no significant difference in the Ip of AFB2 obtained by<br />
using both analysers which indicates that the proposed procedure could be considered<br />
rugged. Detailed information on F test for robustness and ruggedness evaluations are<br />
elaborated in Appendix O.<br />
Table 3.8 Results of ruggedness test for proposed method using 0.10 µM AFB2<br />
Voltammetric analyser<br />
BAS CV50W<br />
VA 757 Metrohm<br />
3.2.2.1b Calibration Curve of AFB1<br />
Ip of AFB2 ± SD<br />
(nA) , n = 5<br />
58.08 ± 1.63<br />
57.98 ± 0.83<br />
Recovery ± SD (%)<br />
n = 5<br />
99.11 ± 2.79<br />
98.94 ± 1.42<br />
Using the same approach as carried out for AFB2, the calibration curve for<br />
AFB1 was constructed by plot of Ip of AFB1 versus their concentrations. DPCSV<br />
measurements of increasing concentrations were applied and the result is shown in<br />
Figure 3.48. Figure 3.49 shows the linear curve for AFB1 which has a linear range<br />
between 2.0 to 32.0 x 10 -8 M (6.29 to 100.63 ppb) with a R 2 value of 0.9989. LOD of<br />
the measurement of AFB1 was 0.5 x 10 -8 M (1.56 ppb). LOQ was 1.67 x 10 -8 M (5.2<br />
ppb). Voltammograms of AFB1 with successive standard addition for AFB1 are shown<br />
in Appendix P.<br />
134
Ip (nA)<br />
250<br />
200<br />
150<br />
100<br />
50<br />
0<br />
200<br />
150<br />
100<br />
50<br />
0 10 20 30 40 50<br />
0<br />
[AFB1] x 10 -8 M<br />
Figure 3.48 Standard addition of AFB1 in BRB at pH 9.0. Ei = -1.0 V, Ef = -1.4 V,<br />
Eacc = -0.60 V, tacc = 80 s, υ = 50 mV/s and pulse amplitude = 80 mV.<br />
Ip (nA)<br />
y = 5.4363x + 3.7245<br />
R 2 = 0.9989<br />
0 10 20 30 40<br />
[AFB1] x 10 -8 M<br />
Figure 3.49 Linear plot of Ip versus concentration of AFB1 in BRB at pH 9.0. All<br />
parameter conditions used are the same as stated in Figure 3.48.<br />
135
Repeatability was examined by performing five replicate measurements for 0.10<br />
and 0.20 µM AFB1 both intra-day and inter-day measurements for it precision and the<br />
result is shown in Table 3.9. Relative standard deviation (RSD) of 0.10 µM and 0.20<br />
µM for intra-day measurement were 1.83% and 0.74% respectively have been achieved.<br />
For inter-day measurements, RSD of 0.10 µM of AFB1 for day 1, day 2 and day 3 were<br />
1.83%, 4.37% and 2.86% respectively and for 0.20 µM RSD of Ip were 0.74%, 1.93%<br />
and 0.56%. The results indicate the high precision of the proposed procedure.<br />
The accuracy of the proposed method was evaluated by applying the same<br />
procedure as for AFB2. The results are shown in Table 3.10 which shows that the<br />
accuracy of the proposed method is considered high.<br />
Table 3.9 Ip (in nA) obtained for intra-day and inter-day precision studies of 0.10<br />
µM and 0.20 µM AFB1 by proposed voltammetric procedure (n=5)<br />
[AFB1]<br />
0.10 µM<br />
0.20 µM<br />
Intra-day<br />
measurement<br />
Ip ± SD (RSD)<br />
58.64 ± 1.11<br />
(1.89%)<br />
112.84 ± 0.82<br />
(0.73%)<br />
Day 1<br />
58.64 ± 1.11<br />
(1.89%)<br />
112.84 ± 0.82<br />
(0.73%)<br />
Inter-day measurement<br />
Ip ± SD (RSD)<br />
Day 2<br />
58.53 ± 1.01<br />
(1.72%)<br />
112.68 ± 0.81<br />
(0.72%)<br />
Day 3<br />
57.49 ± 0.67<br />
(1.13%)<br />
113.26 ± 0.63<br />
(0.56%)<br />
136
No of<br />
experiment<br />
1<br />
2<br />
3<br />
Table 3.10 Mean values for recovery of AFB1 standard solution (n = 3)<br />
Amount<br />
added<br />
(x 10 -8 M)<br />
10<br />
15<br />
20<br />
Ip (nA)<br />
58.49<br />
57.11<br />
57.80<br />
84.70<br />
85.24<br />
85.85<br />
112.26<br />
113.32<br />
112.58<br />
3.2.2.1c Calibration Curve of AFG1<br />
Amount<br />
found<br />
(x 10 -8 M)<br />
10.07<br />
9.83<br />
9.95<br />
14.89<br />
14.97<br />
15.08<br />
19.99<br />
20.06<br />
19.96<br />
Recovery<br />
(%)<br />
100.70<br />
98.30<br />
99.50<br />
99.27<br />
99.80<br />
100.53<br />
99.97<br />
100.31<br />
99.80<br />
137<br />
Recovery ± SD (%)<br />
(RSD)<br />
99.50 ± 1.20<br />
(0.21 %)<br />
99.87 ± 0.63<br />
(0.63 %)<br />
100.15 ± 0.49<br />
(0.26 %)<br />
The validation of this proposed method for quantitative assay of AFG1 was<br />
examined via the evaluation of the same parameters as for AFB1. The effect of<br />
increasing concentration of AFG1 to their Ip up to 45 x 10 -8 M (147.6 ppb) is shown in<br />
Figure 3.50. The calibration curve with a linear range of 2.0 to 32.0 x 10 -8 M (6.56 to<br />
105 ppb) with a R 2 value of 0.9992 was obtained as shown in Figure 3.51. LOD value<br />
for this measurement was 1.0 x 10 -8 M (3.28 ppb) and LOQ was 3.33 x 10 -8 M (10.93<br />
ppb) Voltammograms of AFG1 with increasing concentration are shown in Appendix<br />
Q. The results for the precision and accuracy tests are listed Table 3.11 and 3.12<br />
respectively.
I p (nA)<br />
Ip (nA)<br />
250<br />
200<br />
150<br />
100<br />
50<br />
0<br />
200<br />
150<br />
100<br />
50<br />
0<br />
0 10 20 30 40 50<br />
[AFG1] x 10 -8 M<br />
Figure 3.50 Effect of concentration to Ip of AFG1 in BRB at pH 9.0. Ei = -0.95 V,<br />
Ef = -1.4 V, Eacc = -0.60 V, tacc = 80 s, υ = 50 mV/s and pulse amplitude = 80 mV.<br />
y = 5.5899x + 3.708<br />
R 2 = 0.9992<br />
0 10 20 30 40<br />
[AFG1] x 10 -8 M<br />
Figure 3.51 Linear plot of Ip versus concentration of AFG1 in BRB at pH 9.0.<br />
The parameter conditions are same as in Figure 3.50.<br />
138
Table 3.11 Ip (in nA) obtained for intra-day and inter-day precision studies of 0.10<br />
µM and 0.20 µM of AFG1 by proposed voltammetric procedure (n=5)<br />
[AFG1]<br />
0.10 µM<br />
0.20 µM<br />
No of<br />
experiment<br />
1<br />
2<br />
3<br />
Intra-day<br />
measurement<br />
Ip ± SD (RSD)<br />
58.11 ± 0.93<br />
(1.60%)<br />
117.60 ± 1.24<br />
(1.05%)<br />
Day 1<br />
58.11 ± 0.93<br />
(1.60%)<br />
117.60 ± 1.24<br />
(1.05%)<br />
Inter-day measurement<br />
Ip ± SD (RSD)<br />
Day 2<br />
59.34 ± 0.81<br />
(1.37%)<br />
118.85 ± 1.12<br />
(0.94 %)<br />
Day 3<br />
57.56 ± 1.09<br />
(1.89%)<br />
117.65 ± 1.21<br />
(1.02%)<br />
Table 3.12 Mean values for recovery of AFG1 standard solution (n = 3)<br />
Amount<br />
added<br />
(x 10 -8 M)<br />
10<br />
15<br />
20<br />
Ip (nA)<br />
58.83<br />
58.16<br />
57.16<br />
88.20<br />
89.62<br />
88.78<br />
118.16<br />
117.52<br />
118.10<br />
Amount<br />
found<br />
(x 10 -8 M)<br />
9.97<br />
9.98<br />
9.81<br />
14.78<br />
15.02<br />
14.88<br />
19.80<br />
19.69<br />
19.79<br />
Recovery<br />
(%)<br />
99.70<br />
99.80<br />
98.10<br />
98.53<br />
100.13<br />
99.20<br />
99.00<br />
98.45<br />
98.95<br />
Recovery ± SD (%)<br />
(RSD)<br />
99.20 ± 0.95<br />
(0.95 %)<br />
99.28 ± 0.80<br />
(0.81 %)<br />
98.80 ± 0.30<br />
(0.30 %)<br />
139
3.2.2.1d Calibration Curve of AFG2<br />
The applicability of the proposed DPCSV technique as an analytical method for<br />
the last type of aflatoxin which is AFG2 was examined by measuring the peak current<br />
of AFG2 as a function of its concentration under optimised operational parameters.<br />
Figure 3.52 shows the effect of increasing concentration of AFG2 to the Ip. A<br />
calibration graph for AFG2 was constructed by standard addition method.<br />
Ip (nA)<br />
250<br />
200<br />
150<br />
100<br />
50<br />
0<br />
0 10 20 30 40 50<br />
[AFG2] / X10 -8 M<br />
Figure 3.52 Effect of concentration of AFG2 to Ip of AFG2 in BRB at pH 9.0.<br />
Ei = -1.0 V, Ef = -1.4 V, Eacc = -0.60 V, tacc = 80 s, υ = 50 mV/s and pulse amplitude =<br />
80 mV.<br />
The correlation between Ip and concentration of AFG2 was linear within the<br />
range 2.0 to 32.0 x 10 -8 M (6.60 to 105.61 ppb) as shown in Figure 3.53. The<br />
calibration graph was represented by the equation: ip (µA) = 5.7132x (x 10 -8 M) +<br />
1.1682; R 2 = 0.9989 and n = 10. The LOD was found to be 0.758 x 10 -8 M (2.50 ppb)<br />
and LOQ was 2.53 x 10 -8 M (8.33 ppb). The voltammograms of AFG2 with successive<br />
addition of its concentration are shown in Appendix R. The results of precision studies<br />
for 0.10 µM and 0.20 µM of AFG2 which were obtained by proposed method are<br />
represented in Table 3.13.<br />
140
Ip (nA)<br />
200<br />
150<br />
100<br />
50<br />
0<br />
y = 5.7132x + 1.1682<br />
R 2 = 0.9989<br />
0 10 20 30 40<br />
[AFG2] x 10 -8 M<br />
Figure 3.53 Linear plot of Ip versus concentration of AFG2 in BRB at pH 9.0. All<br />
parameters used are the same as stated in Figure 3.52.<br />
Table 3.13 Ip (in nA) obtained for intra-day and inter-day precision studies of 0.10<br />
µM and 0.20 µM of AFG2 by proposed voltammetric procedure (n=5).<br />
[AFG1]<br />
0.10 µM<br />
0.20 µM<br />
Intra-day<br />
measurement<br />
Ip ± SD (RSD)<br />
58.53 ± 1.05<br />
(1.79%)<br />
115.40 ± 1.69<br />
(1.46%)<br />
Day 1<br />
58.53 ± 1.05<br />
(1.79%)<br />
115.40 ± 1.69<br />
(1.46%)<br />
Inter-day measurement<br />
Ip ± SD (RSD)<br />
Day 2<br />
59.11 ± 1.19<br />
(2.01%)<br />
115.20 ± 1.82<br />
(1.58 %)<br />
Day 3<br />
58.72 ± 1.14<br />
(1.94%)<br />
115.40 ±1.14<br />
(0.99%)<br />
For accuracy, it was examined by performing three replicate measurements for<br />
0.1 µM, 0.15 µM and 0.2 µM AFG2 solutions under the same operational parameters.<br />
Percentage recoveries (R%) of 100.12 +/- 0.25 %, 99.66 +/- 0.90 % and 100.03 +/- 0.26<br />
141
% were achieved respectively with a mean value of % RSD of 0.47%, which indicates<br />
the high accuracy of the proposed technique. Table 3.14 shows the results of accuracy<br />
study for AFG2.<br />
No of<br />
experiment<br />
1<br />
2<br />
3<br />
Table 3.14 Mean values for recovery of AFG2 standard solution (n = 3)<br />
Amount<br />
added<br />
(x 10 -8 M)<br />
10<br />
15<br />
20<br />
Ip (nA)<br />
58.14<br />
58.20<br />
59.10<br />
86.20<br />
87.50<br />
86.10<br />
115.40<br />
115.80<br />
115.20<br />
Amount<br />
found<br />
(x 10 -8 M)<br />
9.97<br />
9.98<br />
10.04<br />
14.88<br />
15.10<br />
14.86<br />
19.99<br />
20.06<br />
19.96<br />
Recovery<br />
(%)<br />
99.97<br />
99.80<br />
100.40<br />
99.22<br />
100.70<br />
99.06<br />
99.97<br />
100.31<br />
99.80<br />
Recovery ± SD<br />
(%)<br />
(RSD)<br />
100.12 ± 0.25<br />
(0.25 %)<br />
99.66 ± 0.90<br />
(0.90 %)<br />
100.03 ± 0.26<br />
(0.26 %)<br />
The Ip and Ep of the aflatoxins with concentration of 0.10 µM which were<br />
obtained by BAS C50W were not significantly different compared to those obtained by<br />
VA 757 Metrohm Analyser as shown in Table 3.15, indicating that the proposed<br />
technique can be applied using different types of voltammetry analysers. Figures 3.54a<br />
to 3.54d show the voltammograms of AFB1, AFB2, AFG1 and AFG2 which were<br />
obtained using Metrohm voltammetry analyser. From the validation of the proposed<br />
technique, Table 3.16 shows all statistical parameters for the aflatoxins.<br />
142
Table 3.15 Ip and Ep of 0.10 uM aflatoxins obtained by BAS and Metrohm<br />
voltammetry analysers under optimised operational parameters for DPCSV method.<br />
Aflatoxins<br />
AFB1<br />
AFB2<br />
AFG1<br />
AFG2<br />
BAS CV 50W<br />
Ip (nA) ± SD<br />
(RSD)<br />
58.28 ± 2.79<br />
(4.78%)<br />
58.08 ± 1.63<br />
(2.81%)<br />
56.85 ± 1.87<br />
(3.29%)<br />
56.20 ± 1.34<br />
(2.38%)<br />
Voltammetry analysers<br />
Ep (V)<br />
-1.22<br />
-1.23<br />
-1.15<br />
-1.17<br />
3.2.2.2 Determination of Limit of Detection (LOD)<br />
757 VA Metrohm<br />
Ip (nA) ± SD<br />
(RSD)<br />
59.88 ± 0.94<br />
(1.57%)<br />
57.98 ± 0.83<br />
(1.43%)<br />
59.26 ± 0.84<br />
(1.42%)<br />
57.56 ± 0.63<br />
(1.10%)<br />
Ep (V)<br />
-1.23<br />
-1.24<br />
-1.15<br />
-1.18<br />
The limit of detection (LOD) is an important quantity in chemical analysis. The<br />
LOD is the smallest concentration or amount that can be detected with reasonable<br />
certainty for a given analytical procedure (Ahmad, 1993; Miller and Miller, 1993). It is<br />
the lowest concentrations that can be distinguished from the noise level as described by<br />
Bressole et al. (1996). Thompson (1998) reported that the detection limit caused<br />
problems for analytical chemists because they are difficult to interpret and the arbitrary<br />
dichotomising of the concentration domain provides misleading viewpoint of the<br />
behaviour of analytical systems.<br />
143
(a) (b)<br />
(c) (d)<br />
Figure 3.54 Voltammograms of 0.10 µM (a) AFB1, (b) AFB2, (c) AFG1 and (d)<br />
AFG2 in BRB at pH 9.0 obtained by 757 VA Metrohm voltammetry analyser. Ei = -1.0<br />
V (except for AFG1 = -0.95 V), Ef = -1.4 V, Eacc = -0.8 V, tacc = 80 s, υ = 50 mV/s and<br />
pulse amplitude = 80 mV.<br />
In order to estimate the LOD, some alternative methods have been used to<br />
overcome the difficulties such as:<br />
144
Aflatoxin<br />
B1<br />
B2<br />
G1<br />
G2<br />
Table 3.16 Analytical parameters for calibration curves for AFB1, AFB2, AFG1 and<br />
AFG2 obtained by DPCSV technique using BRB at pH 9.0 as the supporting electrolyte<br />
Ep (V)<br />
-1.22<br />
-1.23<br />
-1.15<br />
-1.17<br />
Notes:<br />
Regression<br />
equations<br />
y = 5.4363x + 3.7245<br />
y = 5.5385x + 3.2224<br />
y = 5.5899x + 3.7080<br />
y = 5.7132x + 1.1682<br />
Sensitivity<br />
(µA/µM)<br />
0.5436<br />
0.5539<br />
0.5900<br />
0.5713<br />
Linearity range<br />
(x 10 -8 M / ppb)<br />
2 – 32 / 6.24 – 99.84<br />
2 – 32 / 6.29 – 100.63<br />
2 – 32 / 6.56 – 104.92<br />
2 – 32 / 6.60 – 105.61<br />
Ep = Peak potential for aflatoxins at concentration of 0.1 µM<br />
y = mx + c; y = nA, x = x 10 -8 M, c = nA<br />
LOD = limit of detection<br />
145<br />
LOD<br />
(x10 -8 M / ppb)<br />
0.5 / 1.56<br />
0.796 / 2.50<br />
1.0 / 3.28<br />
0.758 / 2.50<br />
R 2<br />
0.9989<br />
0.9980<br />
0.9992<br />
0.9989
a) The concentration giving a signal three times the standard error plus the<br />
y-intercept divided by the slope of calibration curve (Miller and Miller,<br />
1993; Sturm et al., 1997; Yilmaz et al., 2001: Arranz et al., 2003;<br />
Skrzypek et al., 2005 and Nouws et al., 2005). This calculation is used<br />
by International Union of Pure and Applied Chemistry (IUPAC)<br />
(IUPAC, 1978).<br />
b) The analyte concentration giving a signal equal to a blank signal plus<br />
two or three (Conesa et al., 1996) standard deviations of the blank.<br />
c) The concentration giving a signal equal to three times (Zhang et al.,<br />
146<br />
1996) or 3.3 times (Perez-Ruiz et al., 2004) the standard deviation of the<br />
blank signal divided by the slope from the calibration curve. The latter<br />
used 12 blank determinations to calculate standard deviation of the<br />
blank.<br />
d) The concentration giving a signal to noise ratio of 3:1 (3 S/N) (Yardimer<br />
and Ozaltin, 2001; Khodari et al., 1997; Wang et al., 1997; Liu et al.,<br />
2000; Ibrahim et al., 2002; Al-ghamdie et al., 2004 and Farghaly et al.,<br />
2005).<br />
e) The value of three fold standard deviation from seven determinations of<br />
the analyte at the concentration corresponding to the lowest point on the<br />
appropriate straight line of the calibration curve which was evaluated by<br />
R 2 value as reported by Barek et al. (1999).<br />
f) The concentration giving 3 times standard deviation of intercept of the<br />
calibration divided by a slope of the calibration curve as reported by Gao<br />
et al. (2004) and El-Desoky and Ghoneim (2005).
g) The lowest concentration of sample that give the significantly different<br />
signal from the blank after standard addition of lower concentration<br />
(Barek et al., 2001a).<br />
h) Use of the robust regression method where the detection limit is dealt as<br />
a hypothesis test in relation to the presence of analyte in an unknown<br />
sample by using the experimental information provided by the<br />
calibration set (Ortiz et al., 1993).<br />
The results of the determinations of aflatoxins using several methods according<br />
to Barek et al. (2001a), Barek et al. (1999), Zhang et al. (1996) and Miller and Miller<br />
(1993) are shown in Table 3.17. These methods were chosen due to its simplicity and<br />
are widely used by many researchers. Examples of these calculations for AFB1 are<br />
represented in Appendix S, T, U and V for each method respectively.<br />
From the results, the LOD values obtained according to Barek et al. (1999),<br />
Barek et al. (2001a) and Zhang et al. (1996) are not significantly different as was<br />
proven by ANOVA test which is reported in Appendix W (Youmen, 1973). The<br />
Method 1 (according to Barek et al., 2001a) was selected for the determination of the<br />
LOD of all aflatoxins throughout this study since it gives the lowest LOD value as<br />
compared to that obtained by other methods.<br />
3.2.2.3 Determination of Limit of Quantification (LOQ)<br />
The limit of quantification (LOQ) is the lower limit for precise quantitative<br />
measurements (Miller and Miller, 1993; Chan et al., 2004). It is determined by the<br />
formula of (LOD / 3) x 10 as reported by Ozkan et al. (2003) and Ghoneim et al.<br />
147<br />
(2004). A value of YB + 10SB has been suggested for this limit (Miller and Miller,<br />
1993; Rodriguez et al., 2005) where YB is a blank signal and SB is the standard deviation<br />
of blank. The LOQ vaules for all aflatoxins obtained by the proposed methods are listed<br />
in Table 3.18.
Aflatoxin<br />
B1<br />
B2<br />
G1<br />
G2<br />
Table 3.17 LOD values for determination of aflatoxins obtained by various methods<br />
Notes:<br />
x 10 -8 M<br />
0.50<br />
0.78<br />
1.00<br />
0.76<br />
1<br />
ppb<br />
1.56<br />
2.50<br />
3.28<br />
2.50<br />
x 10 -8 M<br />
0.64<br />
0.89<br />
1.06<br />
0.92<br />
Method 1: According to Barek et al. (2001a)<br />
Method 2: According to Barek et al. (1999)<br />
Method 3: According to Zhang et . (1996)<br />
Method 4: According to Miller and Miller (1993)<br />
2<br />
ppb<br />
2.00<br />
2.80<br />
3.50<br />
3.02<br />
Method<br />
x 10 -8 M<br />
0.75<br />
0.91<br />
1.10<br />
0.86<br />
3<br />
ppb<br />
2.35<br />
2.86<br />
3.60<br />
2.84<br />
x 10 -8 M<br />
1.14<br />
1.47<br />
2.09<br />
2.48<br />
148<br />
4<br />
ppb<br />
3.56<br />
4.62<br />
6.84<br />
8.18
Aflatoxin<br />
B1<br />
B2<br />
G1<br />
G2<br />
Table 3.18 LOQ values for determination of aflatoxins obtained by various methods<br />
x 10 -8 M<br />
1.67<br />
2.60<br />
3.33<br />
2.53<br />
1<br />
Notes:<br />
ppb<br />
5.20<br />
8.33<br />
10.93<br />
8.33<br />
x 10 -8 M<br />
2.13<br />
2.97<br />
3.53<br />
3.07<br />
Method<br />
Method 1: According to Barek et al. (2001a)<br />
Method 2: According to Barek et al. (1999)<br />
Method 3: According to Zhang et al. (1996)<br />
Method 4: According to Miller and Miller (1993)<br />
2<br />
ppb<br />
6.67<br />
9.33<br />
11.67<br />
10.07<br />
x 10 -8 M<br />
2.50<br />
2.03<br />
3.67<br />
2.87<br />
3<br />
ppb<br />
7.83<br />
9.53<br />
7.87<br />
9.47<br />
149<br />
4<br />
x 10 -8 M<br />
3.80<br />
4.90<br />
12.00<br />
8.27<br />
ppb<br />
11.87<br />
15.40<br />
22.80<br />
27.27
3.2.2.4 Interference studies<br />
Possible interference from various metal ions and organic substances were<br />
Ip (nA)<br />
70<br />
60<br />
50<br />
40<br />
30<br />
20<br />
10<br />
0<br />
[Aflatoxin] = 0.1 uM<br />
0 0.2 0.4 0.6<br />
[Zn(II)] / uM<br />
0.8 1 1.2<br />
AFB1<br />
AFB2<br />
AFG1<br />
AFG2<br />
150<br />
investigated by spiking with excess amount of these interfering substances to the BRB<br />
at pH 9.0 containing 0.10 µM of each aflatoxin under optimum experimental conditions.<br />
The experiments showed that the presence of up to 10-fold of Al 3+ , Cu 2+ , Ni 2+ , Pb 2+ ,<br />
Zn 2+ , ascorbic acid, β-cyclodextrin and cysteine did not affect much the signal measured<br />
which indicates that there was no serious interference to the voltammetric determination<br />
of all studied aflatoxins. For example, the effect of Zn ion to the Ip of all aflatoxins is<br />
shown in Figure 3.55. Voltammogram of AFB2 with addition of this ion is shown in<br />
Figure 3.56(i). The interference study by Zn 2+ was further carried out by initially<br />
reacted all aflatoxins with Zn 2+ in BRB at pH 3.0 before being added into the<br />
voltammetric cell containing BRB at pH 9.0. Voltammograms of complex AFB2-Zn<br />
with increasing concentration of Zn 2+ are shown in Figure 3.56(ii). Figure 3.57 shows<br />
the Ip of all aflatoxins which were complexed with Zn 2+ decreased drastically with the<br />
addition of 1.0 µM Zn 2+ . This effect indicates that Zn 2+ interferes with the<br />
measurement of aflatoxins in acid condition.<br />
Figure 3.55 Ip of all aflatoxins with increasing concentration of Zn 2+ up to 1.0 µM
(i) (ii)<br />
Figure 3.56 Voltammograms of (i) 0.10 µM AFB2 and (ii) 0.1 µM AFB2-Zn<br />
complex with increasing concentration of Zn 2+ ( a = 0, b = 0.75 µM, c = 1.50 µM, d =<br />
2.25 µM and e = 3.0 µM). Blank = BRB at pH 9.0. Experimental conditions; Ei = -1.0<br />
V, Ef = -1.4 V, Eacc = -0.60 V, tacc = 80 s, υ = 50 mV/s and pulse amplitude = 80 mV.<br />
.<br />
I p (nA)<br />
70<br />
60<br />
50<br />
40<br />
30<br />
20<br />
10<br />
0<br />
0 1 2<br />
[Zn] / uM<br />
3 4<br />
AFB1<br />
AFB2<br />
AFG1<br />
AFG2<br />
Figure 3.57 Ip of all aflatoxins-Zn complex after reacting with increasing<br />
concentration of Zn 2+ in BRB at pH 3.0. Measurements were made in BRB at pH 9.0<br />
within 15 minutes of reaction time. Ei = -1.0 (except AFG1 = -0.95 V), Ef = -1.4 V, Eacc<br />
= -0.6 V, tacc = 80 s, υ = 50 mV/s and pulse amplitude = 80 mV.<br />
151
Similarly, studies carried out using UV-VIS spectrometric technique also<br />
showed that absorbance of 1.0 ppm AFB2 decreases with increasing concentration of<br />
Zn 2+ (from 0.15 to 0.60 ppm) in acidic condition as shown in Figure 3.58. The same<br />
patterns were also found for other aflatoxins. Their absorbances decreased linearly with<br />
increasing concentration of Zn 2 . From this study, it can be concluded that Zn 2+ reacted<br />
with all aflatoxins in acidic medium but does not in BRB at pH 9.0.<br />
Abs<br />
0.12<br />
0.1<br />
0.08<br />
0.06<br />
0.04<br />
0.02<br />
0<br />
[aflatoxins] = 1.0 ppm<br />
0 0.15 0.3<br />
[Zn(II)] / ppm<br />
0.45 0.6<br />
AFB1<br />
AFB2<br />
AFG1<br />
AFG2<br />
Figure 3.58 Absorbance of all aflatoxins with increasing concentration of Zn 2+ in<br />
BRB at pH 3.0 within 15 minutes of reaction time.<br />
For Zn 2+ , studies using initial potential (Ei) at - 0.25 V instead -1.0 V was<br />
conducted. The aim was to investigate the response of Zn peak which appeared at -0.98<br />
V with increasing Zn 2+ concentration and the result is shown in Figure 3.59. The figure<br />
illustrates that the Zn 2+ peak increases while no significant change was observed on Ip<br />
and Ep of AFB2 which show that the peak appeared at the Ep of -0.98 was from the<br />
Zn 2+ .<br />
152
Figure 3.59 Voltammograms of 0.10 µM AFB2 with increasing concentrations of<br />
Zn 2+ (from 0.10 to 0.50 µM) in BRB at pH 9.0. Ei = -0.25 V, Ef = -1.4 V, Eacc = -0.6 V,<br />
tacc = 80 s, υ = 50 mV/s and pulse amplitude = 80 mV.<br />
For interference study by organic substance, ascorbic acid (Figure 3.60) was<br />
selected due to its high content in food as a natural micronutrient and plays many<br />
physiological roles as reported by Perez-Ruiz et al. (2004).<br />
HO<br />
O<br />
O<br />
OH<br />
HO<br />
OH<br />
Figure 3.60 Chemical structure of ascorbic acid<br />
Ascorbic acid may interfere with the measurement of aflatoxins because of its<br />
reducing property due to the presence of the ene-1, 2- diol system (Verma et al., 1991).<br />
Its structure has a double bond which conjugates to the ketone group, similar to the<br />
153
aflatoxins chemical structures which may reduce at HMDE in BRB at pH 9.0 and<br />
interfere the measurement of aflatoxins. The result of this study is shown in Figures<br />
3.61 and 3.62 indicate that no significant change was observed by increasing the<br />
concentration of ascorbic acid up to ten-fold of the aflatoxins concentration.<br />
I p (nA)<br />
70<br />
60<br />
50<br />
40<br />
30<br />
20<br />
10<br />
0<br />
0 0.2 0.4 0.6 0.8 1 1.2<br />
[ascorbic acid] / uM<br />
AFB1<br />
AFB2<br />
AFG1<br />
AFG2<br />
Figure 3.61 Ip of all aflatoxins with increasing concentration of ascorbic acid up to<br />
1.0 µM. Concentrations of all aflatoxins are 0.1 µM.<br />
Figure 3.62 Voltammograms of 0.1 µM AFB2 with increasing concentration of<br />
ascorbic acid.<br />
154
Interference studies were also carried out with β-cyclodextrin. Cyclodextrins<br />
(CDs) are cyclic oligosaccharides with a hydrophilic outer surface and lipophilic central<br />
cavity. CDs are formed with a various numbers of glucose units such as α-, β- and γ-<br />
I p (nA)<br />
70<br />
60<br />
50<br />
40<br />
30<br />
20<br />
10<br />
0<br />
[Aflatoxins] = 0.1 uM<br />
0 0.2 0.4 0.6 0.8 1<br />
[B-CD] / uM<br />
AFB1<br />
AFB2<br />
AFG1<br />
AFG2<br />
155<br />
CD, formed by 6, 7 and 8 glucose units, respectively, are present in the greatest amount.<br />
The pKa values of α-, β- and γ-CD are 12.33, 12.20 and 12.08, respectively and the<br />
species are charged in strong alkaline solution (Fang et al., 1998). In aqueous solutions,<br />
CDs are able to solubilise lipophilic moiety of the compound molecule into the central<br />
cavity without any covalent bond. Such complexes are called inclusion complexes<br />
(Loftson and Brewster, 1996).<br />
Due to its inherent interesting inclusion properties which are exhibited both in<br />
solid state and in aqueous solution as reported by Fang et al. (1998) and its capability of<br />
forming complexes with aflatoxins, β-CD was selected in this study. In optimum pH of<br />
supporting electrolyte for the determination of aflatoxins (pH 9.0), the charged β-CD<br />
may react with aflatoxins. The result of this study is as in Figure 3.63 and the<br />
voltammograms of AFB2 with increasing concentration of β-CD in Figure 3.64 shows<br />
that not much interference was observed with increasing concentration of β-CD up to<br />
ten-fold of concentration of aflatoxins.<br />
Figure 3.63 Ip of all aflatoxins with increasing concentration of β- cyclodextrin up to<br />
1.0 µM.
Figure 3.64 Voltammograms of 0.10 µM AFB2 with increasing concentration of β-<br />
cyclodextrin.<br />
Another organic compound which was used in this interference study was Lcysteine<br />
(Figure 3.65).<br />
H 2 N<br />
O<br />
OH<br />
SH<br />
Figure 3.65 Chemical structure of L-cysteine<br />
The result of this study is given in Figure 3.66 which shows that Ip of all<br />
aflatoxins decreased slightly when cysteine was added. Cysteine is one of the organic<br />
compound that show a high activity for electrocatalytic adsorption on mercury and the<br />
most modified electrode as reported by Shahrokhian and Karimi (2004). The result<br />
obtained may be due to the accumulation of L-cysteine on the surface electrode as the<br />
concentration of cysteine was increased, which made the electrode surface saturated,<br />
hence, limiting the adsorption of aflatoxins.<br />
156
Ip (nA)<br />
70<br />
60<br />
50<br />
40<br />
30<br />
20<br />
10<br />
0<br />
[Aflatoxins] = 0.1 uM<br />
0 0.2 0.4 0.6 0.8 1<br />
[L-cysteine] / uM<br />
AFB1<br />
AFB2<br />
AFG1<br />
AFG2<br />
Figure 3.66 Ip of all aflatoxins with increasing concentration of cysteine up to 1.0 µM<br />
157<br />
From this interference study, all studied metal ions and organic compounds<br />
neither significantly decreased nor enhanced the Ip of all aflatoxins in BRB at pH 9.0.<br />
Attempts have been made to enhance the Ip of aflatoxins by performing mercury<br />
electrode modification using poly-L-lysine (PLL) as described by Ferreira et al. (1999).<br />
However the aflatoxin peak does not increase and this may be due to unsuitable medium<br />
for reaction between aflatoxins and PLL to take place. For example, Ip of AFB2 was<br />
enhanced about 15% in BRB at pH 5.0 however at pH 9.0 the Ip was decreased to<br />
almost 35% from its original value as shown in Appendix X.<br />
3.3 Square-Wave Stripping Voltammetry (SWSV) of Aflatoxins<br />
Since aflatoxins can be adsorbed on the mercury surface as has been proven by<br />
CV and DPCSV studies, another technique of adsorptive stripping method for<br />
quantitative measurement of aflatoxins such as SWSV was developed. By using strong<br />
adsorptive phenomenon and by accumulation of aflatoxins at a HMDE prior to SWSV<br />
measurement, higher sensitivities can be readily achieved in order to obtain a much<br />
lower level of detection for aflatoxins. Compared with other pulse techniques, SWSV is<br />
faster and the entire potential scan can be completed in approximately 2 s on a single<br />
drop of mercury electrode (Jelen et al., 1997). In this study, SWSV was used in<br />
combination with an HMDE to study the Ip of aflatoxins in various BRB pH medium<br />
using optimum parameters that have been obtained using DPCSV technique. The
influences of SWSV instrumental variables such as frequency and voltage step on the<br />
SWSV responses have been evaluated. Overall results show that, compared with<br />
DPCSV technique, SWSV produces much higher Ip for all aflatoxins at the same<br />
concentration. Finally the proposed method was applied to the determination of<br />
aflatoxin in groundnut samples.<br />
3.3.1 SWSV Determination of AFB2<br />
Previous optimised parameters that were obtained by DPCSV have been applied<br />
to the determination of 0.10 µM AFB2 using SWSV technique which produces a single<br />
and well developed peak at Ep of -1.30 V with Ip of 230 nA. The Ip was about 380 %<br />
(3.8 times) higher as compared with that obtained by DPCSV which was only 60 nA as<br />
shown in Figure 3.67.<br />
Figure 3.67 Voltammograms of 0.10 µM AFB2 obtained by (a) DPCSV and (b)<br />
SWSV techniques in BRB at pH 9.0. Parameters for DPCSV: Ei = -1.0 V, Ef = -1.4 V,<br />
Eacc = -0.6 V, tacc = 80 s, υ = 50 mV/s and pulse amplitude = 80 mV and for SWSV: Ei =<br />
-1.0 V, Ef = -1.4 V, Eacc = -0.6 V, tacc = 80 s, frequency = 50 Hz, voltage step = 0.02 V,<br />
amplitude = 50 mV and υ = 1000 mV/s.<br />
158
3.3.1.1 Optimisation of Experimental and Instrumental SWSV Parameters<br />
3.3.1.1a Influence of pH of BRB<br />
Using optimised parameters as stated in Figure 3.67 for SWSV, the pH of BRB<br />
was varied between 6.0 and 13.0. Ip of 0.10 µM AFB2 showed maximum value at pH<br />
9.0 as shown in Figure 3.68. This result was the same as found using CV and DPCSV<br />
techniques where BRB at pH 9.0 is the best supporting electrolyte for the determination<br />
of aflatoxins. Voltammogram of AFB2 in differenct pH is shown in Figure 3.69.<br />
Ip (nA)<br />
300<br />
250<br />
200<br />
150<br />
100<br />
50<br />
0<br />
5 6 7 8 9 10 11 12 13 14<br />
pH of BRB<br />
Figure 3.68 Influence of pH of BRB on the Ip of 0.10 µM AFB2 using SWSV<br />
technique. The instrumental parameters are the same as in Figure 3.67.<br />
159
Figure 3.69 Voltammograms of 0.10 µM AFB2 in different pH of BRB. Parameter<br />
conditions; Ei = -1.0 V, Ef = -1.4 V, Eacc = -0.6 V, tacc = 80 s, voltage step = 0.02 V,<br />
amplitude = 50 mV, frequency = 50 Hz and scan rate = 1000 mV/s<br />
3.3.1.1b Effect of Instrumental Variables<br />
With regard to the instrumental variables, the relationship between Ip and Ei was<br />
studied for 0.10 µM AFB2, and Ei was varied from 0 to -1.2 V. It was found that a<br />
maximum amount of 250 nA was obtained for Ei = -1.0 as shown in Figure 3.70. The Ip<br />
was slowly decreased when the value of Ei was more negative than -1.0 V.<br />
.<br />
Ip InA)<br />
300<br />
250<br />
200<br />
150<br />
100<br />
50<br />
0<br />
0 0.2 0.4 0.6 0.8 1 1.2 1.4<br />
- Ei (V)<br />
Figure 3.70 Effect of Ei to the Ip of 0.10 µM AFB2 in BRB at pH 9.0<br />
160
The influence of Eacc to Ip of AFB2 was investigated where the Eacc was varied between<br />
0 to -1.4 V. The maximum value of Ip was obtained at -0.8 V (265 nA) as shown in<br />
Figure 3.71. This value was selected for subsequent experiments<br />
Ip (nA)<br />
300<br />
250<br />
200<br />
150<br />
100<br />
50<br />
0<br />
0 0.2 0.4 0.6 0.8 1 1.2 1.4 1.6<br />
- E acc (V)<br />
Figure 3.71 Effect of Eacc to the Ip of 0.10 µM AFB2 in BRB at pH 9.0<br />
The effect of tacc on the Ip was studied where tacc was varied from 0 to 200 s.<br />
The result is shown in Figure 3.72 which reveals that there is linearity up to 100 s<br />
according to equation; y = 3.020x + 20.143 (n=6) with R 2 = 0.9950, after which it<br />
increased slower and levelled off at about 140 s. After 160 s, Ip decreased which may be<br />
due to the desorption of the aflatoxins back to the bulk solution. Thus, the tacc of 100 s<br />
appeared to be the optimum tacc for the pre-concentration prior to stripping.<br />
A linear increase in Ip of AFB2 was observed when frequency was varied from<br />
25 to 125 Hz as shown in Figure 3.73. The frequency value of 125 Hz was adopted as<br />
the optimum value.<br />
161
I p (nA)<br />
Ip (nA)<br />
400<br />
350<br />
300<br />
250<br />
200<br />
150<br />
100<br />
50<br />
0<br />
1000<br />
800<br />
600<br />
400<br />
200<br />
0<br />
0 40 80 120 160 200 240<br />
t acc (s)<br />
Figure 3.72 Relationship between Ip of 0.10 µM AFB2 while increasing tacc<br />
0 50 100 150<br />
Frequency (Hz)<br />
Figure 3.73 Effect of frequency to the Ip of 0.10 µM AFB2 in BRB at pH 9.0<br />
The Ip of AFB2 depends linearly on the square root of frequency as shown in<br />
Figure 3.74 which indicates that AFB2 adsorbed on the mercury electrode as reported<br />
by Komorsky-Lovric et al. (1992). This result is in agreement with that obtained by<br />
previous CV and DPCSV experiments.<br />
162
Ip (nA)<br />
1000<br />
800<br />
600<br />
400<br />
200<br />
0<br />
1000<br />
800<br />
600<br />
400<br />
200<br />
0<br />
y = 107.91x - 424.7<br />
R 2 = 0.9919<br />
3 5 7 9 11<br />
(Frequency) 1/2<br />
Figure 3.74 Linear relationships between Ip of AFB2 and square root of frequency<br />
The Ip of the AFB2 increases linearly with variation voltage step from 10 mV to<br />
30 mV but after this value the Ip decreases (Figure 3.75). Hence, 30 mV was selected as<br />
the optimum voltage step for further experiments.<br />
Ip (nA)<br />
0 0.01 0.02 0.03 0.04 0.05<br />
Voltage step (V)<br />
Figure 3.75 Influence of square-wave voltage step to Ip of 0.10 µM AFB2.<br />
163
Regarding the influence of the square wave amplitude, the maximum value for<br />
Ip was observed at 0.05 V when the amplitude increases from 0.025 to 0.10V as shown<br />
in Figure 3.76. The Ep of AFB2 was ideally linear and shifted to a more negative<br />
direction with increasing amplitude according to the equation; y = 1.2x -1.36 (n=4, R 2 =<br />
1.0) as shown in Figure 3.77. Since the square wave frequency, voltage step and scan<br />
rate are interrelated, for frequency of 125 Hz and voltage step of 0.03 V, the scan rate is<br />
3750 mV/ s.<br />
Ip (nA)<br />
E p (-V)<br />
1000<br />
750<br />
500<br />
250<br />
0<br />
1.34<br />
1.32<br />
1.3<br />
1.28<br />
1.26<br />
1.24<br />
1.22<br />
0 0.025 0.05 0.075 0.1 0.125<br />
Amplitude (V)<br />
Figure 3.76 Influence of square-wave amplitude to Ip of 0.10 µM AFB2.<br />
y = -1.2x + 1.36<br />
R2 = 1<br />
0 0.025 0.05 0.075 0.1 0.125<br />
Amplitude (V)<br />
Figure 3.77 Relationship of SWSV Ep of AFB2 with increasing amplitude<br />
164
Accordingly, the optimum experimental and instrumental parameters of the<br />
proposed SWSV procedure for the determination of AFB2 are Ei = -1.0 V, Ef = -1.4 V,<br />
Eacc = -0.80 V, tacc = 100 s, frequency = 125 Hz, voltage step = 0.03 V, amplitude = 75<br />
V, scan rate = 3750 mV/s in BRB at pH 9.0 as the supporting electrolyte. Using these<br />
parameters, the Ip for 0.10 µM AFB2 was 913 nA with Ep at -1.28 V an increase of<br />
220% before being optimised. Figure 3.78 shows the Ip of 0.10 µM AFB2 obtained<br />
under optimised and non-optimised SWSV parameters compared with that obtained<br />
under optimised DPCSV parameters.<br />
Ip (nA)<br />
1050<br />
900<br />
750<br />
600<br />
450<br />
300<br />
150<br />
0<br />
a b c<br />
Figure 3.78 The Ip of 0.10 µM AFB2 obtained under (a) non-optimised and (b)<br />
optimised SWSV parameters compared with that obtained under (c) optimised DPCSV<br />
parameters.<br />
The voltammograms of AFB2 are shown in Figure 3.79. As compared to the<br />
DPCSV, the Ip value for the optimised parameters for SWSV was 15 times higher. This<br />
high sensitivity is one of the SWSV characteristics that was also found by other<br />
165<br />
researchers such as reported by Radi et al. (2001), Guiberteau et al. (2001), El-Hady et<br />
al. (2004), Gazy et al. (2004), Farghaly and Ghandour (2005) and Pacheco et al. (2005).
Figure 3.79 Voltammograms of 0.10 µM AFB2 obtained under (a) non-optimised<br />
and (b) optimised SWSV parameters compared with that obtained under (c) optimised<br />
DPCSV parameters.<br />
3.3.2 SWSV Determination of Other Aflatoxins<br />
Using the optimum SWSV parameters, the Ip of AFB1, AFG1 and AFG2 at<br />
concentration of 0.10 µM have been measured in BRB at pH 9.0. The results are shown<br />
in Table 3.19. When compared with the Ip that were obtained by DPCSV, overall<br />
results show that it increases about 15 times for AFB1 and AFB2 while for AFG1 and<br />
AFG2 about 11 times as shown in Figure 3.80. Their voltammograms are shown in<br />
Figure 3.81 which also includes DPCSV voltammograms for comparison.<br />
166
Table 3.19 Ip and Ep for all aflatoxins obtained by SWSV in BRB at pH 9.0 (n=5)<br />
Aflatoxin<br />
AFB1<br />
AFB2<br />
AFG1<br />
AFG2<br />
Ip (nA)<br />
1000<br />
800<br />
600<br />
400<br />
200<br />
0<br />
Ip (nA) / (RSD)<br />
838.8 ± 5.72 (0.68%)<br />
825.4 ± 11.51 (1.39%)<br />
633.0 ± 3.16 (0.50%)<br />
674.2 ± 11.86 (1.76%)<br />
AFB1 AFB2 AFG1 AFG2<br />
Ep (V)<br />
-1.30<br />
-1.30<br />
-1.24<br />
-1.24<br />
DPCSV<br />
SWSV<br />
Figure 3.80 Ip of 0.10 µM aflatoxins obtained using two different stripping<br />
voltammetric techniques under their optimum parameter conditions in BRB at pH 9.0.<br />
167
(i) (ii)<br />
(iii) (iv)<br />
Figure 3.81 Voltammograms of (i) AFB1, (ii) AFB2, (iii) AFG1 and (iv) AFG2<br />
obtained by (b) DPCSV compared with that obtained by (c) SWSV in (a) BRB at pH<br />
9.0.<br />
3.3.3 Calibration Curves and Method Validation<br />
After optimisation of the experimental condition, calibration curves were<br />
prepared by measuring the Ip of each aflatoxin with different concentration. For<br />
example, voltammograms of AFB1 with varying concentrations are shown in Figure<br />
3.82.<br />
168
Figure 3.82 SWSV voltammograms for different concentrations of AFB1 in BRB at<br />
pH 9.0. The broken line represents the blank; (a) 0.01 µM, (b) 0.025 µM, (c) 0.05 µM,<br />
(d) 0.075 µM, (e) 0.10 µM, (f) 0.125 µM and (g) 0.150 µM. Parameter conditions; Ei =<br />
-1.0 V, Ef = -1.4 V, Eacc = -0.8 V, tacc = 100 s, frequency = 125 Hz, voltage step = 0.03<br />
V, pulse amplitude = 75 mV and scan rate = 3750 mV/s.<br />
The calibration curves for all aflatoxins are shown in Figures 3.83 to 3.86. The<br />
LOD were determined by standard addition of low concentration of analyte (AFB1,<br />
AFB2, AFG1 and AFG2) until a response was obtained that is significantly different<br />
from the blank sample (Barek et al., 2001a). LOQ were calculated using the formula<br />
LOD/3 x 10. Figure 3.87 shows the comparison of the LOD values obtained by SWSV<br />
compared with those obtained by DPCSV. The obtained LOD and LOQ for all<br />
aflatoxins are lower than those obtained by DPCSV technique which suggests that the<br />
SWSV is much better than DPCSV in terms of sensitivity.<br />
169
I p (nA)<br />
1200<br />
1000<br />
800<br />
600<br />
400<br />
200<br />
0<br />
1200<br />
1000<br />
800<br />
600<br />
400<br />
200<br />
0<br />
y = 70.97x + 76.588<br />
R 2 = 0.9984<br />
0 5 10 15 20<br />
[AFB1] x 10 -8 M<br />
Figure 3.83 Calibration curve for AFB1 obtained by SWSV method.<br />
I p (nA)<br />
1000<br />
800<br />
600<br />
400<br />
200<br />
0<br />
y = 61.97x + 243.36<br />
R 2 = 0.9938<br />
0 2.5 5 7.5 10 12.5 15<br />
[AFB2] x 10 -8 M<br />
Figure 3.84 Calibration curve for AFB2 obtained by SWSV method<br />
I p (nA)<br />
y = 51.046x + 164.79<br />
R 2 = 0.9912<br />
0 5 10 15<br />
[AFG1] x 10 -8 M<br />
Figure 3.85 Calibration curve for AFG1 obtained by SWSV method.<br />
170
I p (nA)<br />
LOD (ppb)<br />
1000<br />
3.5<br />
800<br />
600<br />
400<br />
200<br />
3<br />
2.5<br />
2<br />
1.5<br />
1<br />
0.5<br />
0<br />
0<br />
y = 49.816x + 157.18<br />
R 2 = 0.9906<br />
0 5 10 15<br />
[AFG2] x 10 -8 M<br />
Figure 3.86 Calibration curve for AFG2 obtained by SWSV method.<br />
AFB1 AFB2 AFG1 AFG2<br />
DPCSV<br />
SqWSV<br />
Figure 3.87 LOD for determination of aflatoxins obtained by two different stripping<br />
methods.<br />
Furthermore, this technique provides a shorter time analysis due to the fast scan<br />
rate (3750 mV/s). Table 3.20 summarises the characteristics of the calibration plots<br />
established using optimum SWSV parameters for all aflatoxins.<br />
171
Aflatoxin<br />
B1<br />
B2<br />
G1<br />
G2<br />
Table 3.20 Analytical parameters for calibration curves for AFB1, AFB2, AFG1 and<br />
AFG2 obtained by SWSV technique in BRB at pH 9.0 as the supporting electrolyte.<br />
Ep (V)<br />
-1.30<br />
-1.30<br />
-1.24<br />
-1.24<br />
Notes;<br />
Regression<br />
Equations<br />
y = 70.97x + 76.59<br />
y = 61.97x + 243.36<br />
y = 51.046x + 64.79<br />
y = 49.816x + 57.18<br />
Ep = Peak potential for aflatoxins at concentration of 0.1 µM<br />
y = mx + c; y = nA, x = x 10 -8 M, c = nA<br />
LOD = limit of detection<br />
LOQ = limit of quantification<br />
Sensitivity<br />
(µA/µM)<br />
7.097<br />
6.197<br />
5.105<br />
4.982<br />
Linearity range<br />
(x 10 -8 M / ppb)<br />
1 – 15 / 3.12 – 46.73<br />
1– 12.5 / 3.14 – 39.31<br />
1– 12.5 / 3.28 – 40.98<br />
1– 12.5 / 3.30 – 41.25<br />
LOD<br />
(x 10 -8 M<br />
/ ppt)<br />
0.125 /<br />
393<br />
0.15 / 468<br />
0.15 / 492<br />
0.15 / 500<br />
172<br />
LOQ<br />
(x 10 -8<br />
M/<br />
ppb)<br />
0.42 /<br />
1.31<br />
0.50 /<br />
1.56<br />
0.50 /<br />
1.64<br />
0.50 /<br />
1.67<br />
R 2<br />
0.9984<br />
0.9938<br />
0.9912<br />
0.9906
Reproducibility was evaluated by performing ten measurements of aflatoxins<br />
with concentration of 0.10 µM on the same day and within 3 days for intra and interdays<br />
measurements respectively. The results are shown in Table 3.21. For all<br />
measurements of all aflatoxins, the RSD were between 0.30% to 1.92% which indicates<br />
that the proposed method is reproducible and gives high precision. Voltammograms of<br />
0.1 µM AFB1, AFB2, AFG1 and AFG2 for intra-day precision (n=10) are shown in<br />
Appendix Y.<br />
Table 3.21 Result of reproducibility study for 0.1 µM aflatoxins in BRB at pH 9.0<br />
Aflatoxins<br />
AFB1<br />
AFB2<br />
AFG1<br />
AFG2<br />
Ip (nA) for intra-day<br />
( ± SD, n = 10) (RSD)<br />
833 ± 10.02<br />
(1.20%)<br />
816 ± 14.88<br />
(1.82%)<br />
630 ± 4.38<br />
(0.70%)<br />
669 ± 9.92<br />
(1.48%)<br />
173<br />
Ip (nA) for inter-day (± SD, n = 10) (RSD)<br />
Day 1<br />
832 ± 8.77<br />
(1.05%)<br />
817 ± 14.24<br />
(1.74%)<br />
634 ± 2.07<br />
(0.33%)<br />
674 ± 11.86<br />
(1.76%)<br />
Day 2<br />
833 ± 10.87<br />
(1.30)<br />
812 ± 15.62<br />
(1.92%)<br />
628 ± 2.55<br />
(0.41%)<br />
665 ± 4.83<br />
(0.73%)<br />
Day 3<br />
833 ± 9.07<br />
(1.09)<br />
816 ± 13.92<br />
(1.71%)<br />
631 ± 4.32<br />
(0.68%)<br />
674 ± 8.41<br />
(1.25)<br />
For assessing accuracy of the proposed method, an amount of 5 x 10 -8 M and 10<br />
x 10 -8 M of each aflatoxin were spiked into voltammetric cell and their respective Ip<br />
were measured. From the obtained Ip, the actual concentration found was calculated<br />
according to the respective calibration plot. The results are summarised in Table 3.22<br />
which show that the recoveries for 5 x 10 -8 M and 10 x 10 -8 M of all aflatoxins are<br />
between 93 to 106% which indicate that the proposed method is of a very high<br />
accuracy. Voltammograms of 10 x 10 -8 M of all aflatoxins (n= 3) are shown in
Appendix Z. From the method validation, the results show that the proposed SWSV<br />
method is satisfactorily precise and accurate, gives very low detection limit and<br />
provides very short time analysis. This method was applied for analysis of aflatoxin<br />
content in groundnut samples together with the DPCSV method.<br />
Table 3.22 Application of the proposed method in evaluation of accuracy of the<br />
SWSV method by spiking the aflatoxin standard solutions.<br />
Aflatoxin<br />
AFB1<br />
AFB2<br />
AFG1<br />
AFG2<br />
Amount<br />
added<br />
( x 10 -8 M)<br />
5.0<br />
10.0<br />
5.0<br />
10.0<br />
5.0<br />
10.0<br />
5.0<br />
10.0<br />
Obtained Ip<br />
(nA)<br />
(± SD, n =3)<br />
442.33 ± 2.56<br />
839.00 ± 5.29<br />
566.30 ± 3.79<br />
820.67 ± 6.81<br />
424.33 ± 5.03<br />
639.07 ± 5.51<br />
417.33 ± 2.08<br />
664.00 ± 1.00<br />
Amount<br />
found<br />
( x 10 -8 M)<br />
(± SD)<br />
5.15 ± 0.03<br />
10.60 ± 0.07<br />
5.19 ± 0.03<br />
9.39 ± 0.07<br />
5.04 ± 0.06<br />
9.57 ± 0.80<br />
5.24 ± 0.03<br />
10.17 ± 0.02<br />
Recovery ±<br />
SD (%)<br />
103.00 ± 0.60<br />
106.00 ± 0.70<br />
103.64 ± 0.58<br />
93.90 ± 0.70<br />
100.87 ± 1.20<br />
95.70 ± 0.80<br />
104.80 ± 0.53<br />
101.70 ± 0.20<br />
174<br />
RSD of<br />
recovery<br />
(%)<br />
0.58<br />
0.66<br />
0.56<br />
0.75<br />
1.19<br />
0.84<br />
0.51<br />
0.20
3.4 Stability Studies of Aflatoxins<br />
3.4.1 10 ppm Aflatoxin Stock Solutions<br />
10 ppm aflatoxin stock solutions which were prepared in benzene: acetonitrile<br />
(98:2) and stored in the dark under refrigeration at temperature of 14 0 C were<br />
monitored for their stability by measuring the absorbance using UV-VIS<br />
175<br />
spectrophotometer every month for twelve months. This study was carried out to<br />
determine the shelf life of aflatoxins stock solution in benzene: acetonitrile kept under<br />
the dark and cool conditions. The obtained concentrations of all aflatoxins monitored<br />
for the period of twelve months at their respective wavelengths are shown in Table 3.23.<br />
UV-VIS spectrums for each freshly prepared AFB1, AFB2, AFG1 and AFG2 are shown<br />
in Appendix AA.<br />
Table 3.23 Average concentration of all aflatoxins within a year stability studies<br />
Aflatoxin<br />
AFB1<br />
AFB2<br />
AFG1<br />
AFG2<br />
λ range (nm)<br />
346 – 348<br />
349 – 351<br />
355 – 357<br />
355 – 357<br />
Average concentration<br />
within a year ± SD (ppm)<br />
(RSD)<br />
10.63 ± 0.32 (3.01%)<br />
10.73 ± 0.42 (3.91%)<br />
10.68 ± 0.44 (4.12%)<br />
10.58 ± 0.40 (3.78%)<br />
The results show that within a year, all aflatoxins which were stored in the cool and<br />
dark conditions are stable and their concentrations are maintained at 10 ppm with RSD<br />
of less than 5.0 %.
Figures 3.88 to 3.90 show the UV-VIS spectrums for all aflatoxins at 0, 6 and 12<br />
months storage time respectively. There are no significant changes in wavelengths for<br />
maximum absorbance of all aflatoxin within the stipulated period of time.<br />
Figure 3.88 UV-VIS spectrum of 10 ppm of all aflatoxins in benzene: acetonitrile<br />
(98%) at preparation date.<br />
Figure 3.89 UV-VIS spectrum of 10 ppm of all aflatoxins in benzene: acetonitrile<br />
(98%) after 6 months of storage time.<br />
176
Figure 3.90 UV-VIS spectrum of 10 ppm of all aflatoxins in benzene: acetonitrile<br />
(98%) after 12 months of storage time.<br />
The maximum absorbance obtained for all aflatoxins are due to the presence of<br />
UV chromophore which is a carbonyl group (C=O) in the aflatoxin molecules. This<br />
group has a transition electronic level between non-bonding (n) and Π * antibonding<br />
which generally occurs at 250 to 300 nm. Due to the conjugation of carbonyl group<br />
with a double bond in benzene ring in the aflatoxin structure, this transition takes place<br />
at longer wavelength which is more than 300 nm as stated in Table 3.23 (Fifield and<br />
Haines, 2000). The result of this study shows that all aflatoxin stock solutions which<br />
were stored in the cool and dark conditions have a shelf life of at least one year and can<br />
be used for further voltammetric study<br />
The same aflatoxin stock solution was exposed to ambient condition, for<br />
example, AFB1, the obtained UV-VIS spectrum is different where the wavelength for<br />
the maximum absorbance was shifted from 348 nm to 335 nm as shown in Figure 3.91<br />
indicating that the chemical structure of AFB1 may be damaged and cannot be used for<br />
voltammetric study.<br />
177
Figure 3.91 UV-VIS spectrums of 10 ppm AFB1 (a) kept in the cool and dark<br />
conditions and (b) exposed to ambient conditions for 3 days.<br />
This can be clearly seen when a lower concentration (1 ppm) of the same<br />
solution was studied and compared with a new fresh stock solution of the same<br />
concentration (Figure 3.92). The result indicates that aflatoxin stock solutions must be<br />
protected from light and kept in cool condition for longer shelf life. The spectrum of<br />
AFB1 prepared from damaged stock solution shows extra peak at λ of 330 nm while for<br />
AFB1 which was prepared from freshly prepared stock solution has only a single peak<br />
at the same λ as obtained for the stock solution.<br />
Figure 3.92 UV-VIS spectrums of 1 ppm AFB1 in BRB solution prepared from (a)<br />
freshly prepared and (b) damaged 10 ppm AFB1 stock solution<br />
178
The diluted solutions were kept in the dark and cool conditions for 2 weeks and<br />
their absorbance were re-measured. The result is shown in Figure 3.93 which shows<br />
that AFB1 from damaged stock produced lower absorbance and at the same time, λ was<br />
179<br />
shifted to lower value from 335 nm to 320 nm compared to the result that was obtained<br />
at the preparation date while the AFB1 from freshly prepared stock shows no significant<br />
change in its absorbance and λ values. These results indicate that AFB1 solution in<br />
BRB prepared from damaged stock is less stable compared to that one prepared from<br />
the fresh stock solution.<br />
Figure 3.93 UV-VIS spectrums of 1 ppm AFB1 in BRB solution prepared from (a)<br />
freshly prepared and (b) damaged 10 ppm AFB1 stock solution after 2 weeks of storage<br />
in the dark and cool conditions.<br />
3.4.2 1 ppm Aflatoxins in BRB at pH 9.0<br />
4.4.2.1 Month to Month Stability Studies<br />
1.0 ppm aflatoxins prepared in BRB at pH 9.0 which were stored in the freezer<br />
at temperature of -4.0 0 C were monitored for their stability within 6 months from the<br />
preparation date using the DPCSV technique. The aim of this study was to determine<br />
the shelf life of 1.0 ppm aflatoxin in BRB at pH 9.0 kept under the cool and dark<br />
conditions. 0.1 µM of each aflatoxin was spiked in 10 ml BRB at pH 9.0 as the
supporting electrolyte and the Ip and Ep of respective aflatoxin were observed from 0 to<br />
6 month storage time. The result is shown in Figure 3.94. Voltammograms of all<br />
aflatoxins obtained after 0 to 6 month storage time are shown in Appendix AB. The<br />
result shows that after three months storage time, the Ip of AFG1 and AFG2 decreased<br />
to about 60 % from original Ip measured at first day of preparation while the Ip of AFB1<br />
and AFB2 still maintained about 75% of their respective Ip. Based of this result, the<br />
stability order of these aflatoxins is suggested as in the order of AFB2 > AFB1 > AFG2<br />
> AFG1. Based on their chemical structures, aflatoxin with a double bond in the<br />
terminal furan ring is less stable in BRB at pH 9.0 as compared to aflatoxin that has a<br />
single bond in their furan ring.<br />
The finding also reveals that AFG1 and AFG2 can be used up to 2 months while<br />
AFB1 and AFB2 up to 3 months. After these periods of time, the respective aflatoxin<br />
should be disposed and the new standard solution should be freshly prepared for the rest<br />
of experiment.<br />
Percentage (%)<br />
100<br />
80<br />
60<br />
40<br />
20<br />
0<br />
0 1 2 3 4 5 6 7<br />
Storage time in freezer (months)<br />
AFB1<br />
AFB2<br />
AFG1<br />
AFG2<br />
Figure 3.94 Percentage of Ip of 0.1 µM aflatoxins in BRB at pH 9.0 at different<br />
storage time in the cool and dark conditions.<br />
180
4.4.2.2 Hour to Hour Stability Studies<br />
Each aflatoxin (0.1 µM) was spiked in BRB at pH 9.0 and monitored by the<br />
DPCSV technique from 0 to 8 hours exposure to ambient conditions. The purpose of<br />
this study was to evaluate the stability of aflatoxins in BRB under ambient conditions<br />
up to 8 hours. The period of 8 hours was selected due to the normal working hours. A<br />
plot of percentage of all aflatoxins versus exposure time is illustrated in Figure 3.95.<br />
Voltammograms of all aflatoxins which were exposed from 0 to 8 hours in BRB at pH<br />
9.0 are shown in Appendix AC.<br />
Percentage (%)<br />
100<br />
80<br />
60<br />
40<br />
20<br />
0<br />
0 1 2 3 4 5 6 7 8 9<br />
Exposure time (hrs)<br />
AFB1<br />
AFB2<br />
AFG1<br />
AFG2<br />
Figure 3.95 Percentage of Ip of all aflatoxins in BRB at pH 9.0 exposed to ambient<br />
condition up to 8 hours of exposure time.<br />
The result shows that AFB1 and AFB2 measured in BRB at pH 9.0 were stable<br />
within 8 hours of exposure time where the Ip for both aflatoxins were reduced only 15%<br />
from initial Ip. In contrast, AFG1 and AFG2 gave significant reduction in the Ip within<br />
181<br />
the same period of exposure time where the Ip of AFG1 and AFG2 were reduced to 38%<br />
and 48% respectively. The Ep of all aflatoxins were shifted to more negative direction<br />
with increasing exposure time as shown in Appendix AC. The experiment reveals that<br />
AFG1 and AFG1 were less stable in BRB at pH 9.0 as compared to AFB1 and AFB2.
Based on their chemical structures, the most reactive functional groups susceptible for<br />
ease of attack by chemical reagents are the two lactones rings of AFG1 and AFG2 and<br />
cyclopentanone rings of AFB1 and AFB2. AFG1 and AFG2 were less stable due to the<br />
easier opening of the lactone rings in strong alkali as compared to the cyclopentanone<br />
ring as reported by Jaimez et al. (2000). The other functional group of this aflatoxin is<br />
less readily attacked by any chemical reagents except for the double bond of terminal<br />
furan ring in AFB1 and AFG1 which are susceptible to attacks by certain reagents such<br />
as TFA (Beebe, 1978; Cespedes and Diaz, 1997; Dhavan and Choudry, 1995; Akiyama<br />
et al., 2001; Erdogan, 2004), iodine (Davis and Diener, 1980; Tuinstra and Haasnoot,<br />
1983; Beaver and Wilson, 1990) or bromine in special conditions as shown in Figure<br />
3.96 (Kok et al., 1986).<br />
O<br />
O<br />
O<br />
O<br />
O<br />
OCH 3<br />
Br 2<br />
4 s , 20 0<br />
C<br />
TFA<br />
I 2<br />
HO<br />
30 min, 50 0<br />
C<br />
40 s, 60 0<br />
C<br />
I<br />
Br<br />
O<br />
O<br />
O<br />
O<br />
O<br />
I O<br />
O<br />
O<br />
O<br />
Br O<br />
O<br />
O<br />
O<br />
OCH 3<br />
O<br />
OCH 3<br />
O<br />
OCH3<br />
Figure 3.96 Reactions of 8, 9 double bond furan rings in AFB1 with TFA, iodine<br />
and bromine under special conditions (Kok et al., 1986).<br />
182
As mentioned earlier, 1 ppm AFB1 standard solution from the “damaged” AFB1<br />
stock solution was prepared in BRB at pH 9.0. Beside UV-VIS spectrophotometric<br />
determination, it was measured by the DPCSV technique and found that the Ip was only<br />
4.0 nA as compared to the freshly prepared from fresh stock solution which gave a peak<br />
current of 60 nA as shown in Figure 3.97. The result indicates that almost all the AFB1<br />
molecules present in BRB solution were already damaged.<br />
Figure 3.97 Voltammograms of 0.1 µM AFB1 obtained in (a) BRB at pH 9.0 which<br />
were prepared from (b) damaged and (c) fresh stock solutions.<br />
Another possible reason why aflatoxins were damaged when exposed to ambient<br />
condition is due to the fact that aflatoxins are not stable to light. Experiments were<br />
performed to verify this statement by running the same experiment as previously<br />
mentioned except by wrapping the voltammetric cell with aluminum foil. The results<br />
are shown in Figure 3.98 to 3.101 which indicate that in the absence of a lighting<br />
system, Ip decreased much faster due to unexplained reason. The result of this<br />
experiment shows that the light was not a main factor that caused instability of<br />
aflatoxins in BRB at pH 9.0.<br />
183
Ip (nA)<br />
70<br />
60<br />
50<br />
40<br />
30<br />
20<br />
10<br />
0<br />
0 2 4 6 8 10<br />
Exposure time (hrs)<br />
Figure 3.98 Ip of 0.1 µM AFB1 obtained in BRB at pH 9.0 from 0 to 8 hours in (a)<br />
light exposed and (b) light protected.<br />
Ip (nA)<br />
70<br />
60<br />
50<br />
40<br />
30<br />
20<br />
10<br />
0<br />
0 2 4 6 8 10<br />
Exposure time (hrs)<br />
Figure 3.99 Ip of 0.1 µM AFB2 obtained in BRB at pH 9.0 from 0 to 8 hours in (a)<br />
light exposed and (b) light protected.<br />
(a)<br />
(b)<br />
(a)<br />
(b)<br />
184
Ip (nA)<br />
Ip (nA)<br />
70<br />
60<br />
50<br />
40<br />
30<br />
20<br />
10<br />
70<br />
60<br />
50<br />
40<br />
30<br />
20<br />
10<br />
0<br />
0<br />
(a)<br />
(b)<br />
0 2 4 6 8 10<br />
Exposure time (hrs)<br />
Figure 3.100 Ip of 0.1 µM AFG1 obtained in BRB at pH 9.0 from 0 to 8 hours in (a)<br />
light exposed and (b) light protected.<br />
(a)<br />
(b)<br />
0 2 4 6 8 10<br />
Exposure time (hrs)<br />
Figure 3.101 Ip of 0.1 µM AFG2 obtained in BRB at pH 9.0 from 0 to 8 hours in (a)<br />
light exposed and (b) light protected.<br />
185
3.4.2.3 Stability Studies In Different pH of BRB<br />
0.1 µM of each aflatoxin was measured in four different pH of BRB (6.0, 7.0,<br />
9.0 and 11.0) and the measurements was made in ambient conditions from 0 to 3 hours<br />
of exposure time. The purpose of this experiment was to study the stability of all<br />
aflatoxins when exposed to ambient condition in slightly acidic, neutral and basic<br />
medium in a period of three hours. The results of these studies are shown in Figures<br />
4.103. At 0 hr exposure time, the Ip of all aflatoxins in BRB at pH 6.0 (Figure 3.102a),<br />
7.0 (Figure 3.102b), and 11.0 (Figure 3.102d) were lower as compared in BRB at pH<br />
9.0 (Figure 3.102c) as these pH were not the optimum pH for the voltammetric analysis<br />
of aflatoxins. In acidic medium, all aflatoxins were stable within 3 hours exposure time<br />
which shows that no reaction has occurred between acid and aflatoxins that can damage<br />
the chemical structures of the aflatoxins. This may be due to the formation of the<br />
phenolate ions which existed in the resonance state as shown in Figure 3.103<br />
(Heathcote, 1984). However, in strong basic medium (pH 11), Ip for all aflatoxins<br />
decreased with longer exposure time and the peak current of AFG1 and AFG2 totally<br />
disappeared after 2 and 3 hours respectively. In strong basic medium, hydroxyl ion can<br />
slowly react with cyclopentanone and lactone groups of the aflatoxins. AFG1 and<br />
AFG2 show faster decreasing value in the Ip compared to AFB1 and AFB2 due to the<br />
readiness of the lactone group being attacked in strong basic condition. Figures 3.104,<br />
3.105, 3.106 and 3.107 show the voltammograms of 0.1 µM AFB2 and AFG2 in BRB<br />
at pH 6.0 and 11.0 for 0 to 3 hours of exposure time respectively.<br />
186
Ip (nA)<br />
Ip (nA)<br />
70<br />
60<br />
50<br />
40<br />
30<br />
20<br />
10<br />
0<br />
70<br />
60<br />
50<br />
40<br />
30<br />
20<br />
10<br />
0<br />
O<br />
O<br />
pH 6.0<br />
0 1 2 3<br />
Exposure time (hrs)<br />
0 1 2 3<br />
Exposure time (hrs)<br />
O<br />
OCH 3<br />
pH 9.0<br />
AFB1<br />
AFB2<br />
AFG1<br />
AFG2<br />
AFB1<br />
AFB2<br />
AFG1<br />
AFG2<br />
Ip (nA)<br />
Ip (nA)<br />
70<br />
60<br />
50<br />
40<br />
30<br />
20<br />
10<br />
0<br />
50<br />
40<br />
30<br />
20<br />
10<br />
0<br />
pH 7.0<br />
0 1 2 3<br />
Exposure time (hrs)<br />
(a) (b)<br />
O<br />
pH 11.0<br />
0 1 2 3<br />
Exposure time (hrs)<br />
(c) (d)<br />
Figure 3.102 Peak heights of 0.1 µM aflatoxins in BRB at pH (a) 6.0, (b) 7.0, (c) 9.0<br />
and (d) 11.0 exposed to ambient conditions up to three hours of exposure time.<br />
_ O<br />
O_<br />
O O<br />
OCH 3<br />
Figure 3.103 Resonance forms of the phenolate ion (Heathcote, 1984)<br />
O<br />
OCH 3<br />
187<br />
AFB1<br />
AFB2<br />
AFG1<br />
AFG2<br />
AFB1<br />
AFB2<br />
AFG1<br />
AFG2
Figure 3.104 Voltammograms of 0.1 µM AFB2 in BRB at pH 6.0 from 0 to 3.0 hrs of<br />
exposure time.<br />
Figure 3.105 Voltammograms of 0.10 µM AFB2 in BRB at pH 11.0 (b) from 0 to 3.0<br />
hrs exposure time.<br />
188
Figure 3.106 Voltammograms of 0.10 µM AFG2 in BRB at pH 6.0 from 0 to 3.0 hrs<br />
of exposure time.<br />
Figure 3.107 Voltammograms of 0.10 µM AFG2 in BRB at pH 11.0 from 0 to 3.0 hrs<br />
of exposure time.<br />
189
The same studies were carried out using UV-VIS spectrophotometer for the<br />
same period of exposure time which showed that the absorbance of all aflatoxins in<br />
BRB at pH 11.0 decreased with increasing exposure time as shown in Figure 3.108.<br />
Overall results are in agreement with that found by voltammetric techniques. UV-VIS<br />
spectrums for AFB2 and AFG2 in BRB pH at 6.0 and 11.0 are shown in Appendix AD.<br />
Abs<br />
Abs<br />
0.16<br />
0.14<br />
0.12<br />
0.1<br />
0.08<br />
0.06<br />
0.04<br />
0.02<br />
0<br />
0.14<br />
0.12<br />
0.1<br />
0.08<br />
0.06<br />
0.04<br />
0.02<br />
0<br />
pH 6.0<br />
0 1 2 3<br />
Exposure time (hrs)<br />
pH 9.0<br />
0 1 2 3<br />
Exposure time (hrs)<br />
AFB1<br />
AFB2<br />
AFG1<br />
AFG2<br />
AFB1<br />
AFB2<br />
AFG1<br />
AFG2<br />
Abs<br />
Abs<br />
0.12<br />
0.1<br />
0.08<br />
0.06<br />
0.04<br />
0.02<br />
0<br />
0.07<br />
0.06<br />
0.05<br />
0.04<br />
0.03<br />
0.02<br />
0.01<br />
0<br />
pH 7.0<br />
0 1 2 3<br />
Exposure time (hrs)<br />
(a) (b)<br />
pH 11.0<br />
0 1 2 3<br />
Exposure time (hrs)<br />
(c) (d)<br />
Figure 3.108 Absorbance of 1.0 ppm aflatoxins in BRB at pH of (a) 6.0, (b) 7.0, (c)<br />
9.0 and (d) 11.0 from 0 to 3 hrs of exposure time.<br />
190<br />
AFB1<br />
AFB2<br />
AFG1<br />
AFG2<br />
AFB1<br />
AFB2<br />
AFG1<br />
AFG2
3.4.2.4 Stability Studies in 1.0 M HCl and 1.0 M NaOH<br />
The objective of this study was to investigate the stability of all aflatoxins in<br />
acid and basic medium within certain period of time where the stability of aflatoxins in<br />
1.0 M HCl and 1.0 M NaOH respectively were carried out. In each case, 0.1 µM of<br />
aflatoxin was dissolved in 1.0 M HCl and NaOH respectively before being spiked into<br />
the voltammetric cell for voltammetric measurement. The measurement was taken<br />
every hour in a period of 6 hours as shown in Figures 3.109 and 3.110. Ip for all the<br />
aflatoxins show no significant difference when placed in 1.0 M HCl up to 6 hours as<br />
compared to that obtained with 1.0 M NaOH. For aflatoxins left in 1.0 M NaOH, the Ip<br />
of AFG1 and AFG2 were significantly reduced as compared to AFB1 and AFB2. The<br />
voltammograms of AFB1 and AFG1 in 1.0 M HCl and 1.0 M NaOH for a period of 6<br />
hrs are shown in Appendix AE. No peak was observed after 5 hours of reaction for<br />
AFG1 and AFG2. It can be concluded that up to 6 hrs of reaction time, aflatoxins are<br />
stable in 1.0 M HCl medium compared with 1.0 M NaOH. This outcome confirmed the<br />
results obtained by previous stability studies where all aflatoxins in acidic media are<br />
more stable than those in basic media.<br />
Ip (nA )<br />
80<br />
70<br />
60<br />
50<br />
40<br />
30<br />
20<br />
10<br />
0<br />
0 1 2 3 4 5 6<br />
Reaction time (hrs)<br />
AFB1<br />
AFB2<br />
AFG1<br />
AFG2<br />
Figure 3.109 The peak heights of 0.10µM aflatoxins in 1.0 M HCl from 0 to 6 hrs of<br />
reaction time.<br />
191
Ip (nA)<br />
70<br />
60<br />
50<br />
40<br />
30<br />
20<br />
10<br />
0<br />
0 1 2 3 4 5 6<br />
Reaction time (hrs)<br />
AFB1<br />
AFB2<br />
AFG1<br />
AFG2<br />
Figure 3.110 The peak heights of 0.10 µM aflatoxins in 1.0 M NaOH from 0 to 6 hrs<br />
of reaction time.<br />
3.5 Voltammetric Analysis of Aflatoxins in Real Samples<br />
Both the proposed DPCSV and SWSV techniques with their optimum<br />
parameters were applied to the determination of aflatoxins in 15 groundnut real<br />
samples. The extraction and clean-up methods for aflatoxin in real samples which have<br />
been previously applied by other researchers (Garden et al., 2001; Pena et al., 2002;<br />
Chemistry Department, 2002) were tried in order to obtain the highest yield of<br />
aflatoxins with the minimum matrix effect. From this study the most reliable technique<br />
was chosen for the analysis of the real samples. In addition, a standard addition method<br />
was applied for the determination of aflatoxin content in order to overcome any matrix<br />
effect (Sanna et al., 2000; Guiberteau et al.,2001; Ghoneim et al., 2003; Rodriguez et<br />
al., 2004). This method also provides the highest precision because the uncertainties<br />
introduced by the sample injection are avoided (Chan, 2004). The results which were<br />
obtained by these proposed techniques were compared with those obtained by the<br />
HPLC which is currently an accepted technique for the routine analysis of aflatoxin<br />
compounds in <strong>Malaysia</strong> (Chemistry Dept., 2000).<br />
192
3.5.1 Study on the Extraction Techniques<br />
Three different extraction techniques, labelled as Technique 1, 2 and 3 were<br />
applied in the extraction of groundnut. The results in Figures 3.111a to 3.111c showed<br />
the Technique 3 gives a well defined peak current for the aflatoxin as compared to other<br />
techniques.<br />
(a) (b)<br />
(c)<br />
Figure 3.111 Voltammograms of real samples after extraction by Technique (a) 1, (b)<br />
2 and (c) 3 with addition of 10 ppb AFB1 standard solution in BRB at pH 9.0 as a<br />
blank.<br />
193
For Technique 3, a standard addition of 10 ppb AFB1 into the sample solution<br />
produced a higher Ip of 20.5 nA with the Ep at -1.24 V. However, for the Technique 1,<br />
Ip of 10 ppb AFB1 standard solution was only 5 nA and no peak was observed for<br />
AFB1 which was spiked in real sample solution obtained by the Technique 2 even<br />
though the concentration of standard solution was increased 5 times. This may be due<br />
to high matrix effect that eliminates the analyte response. Based on this result, the<br />
Technique 3 was selected for extraction and clean-up processes of aflatoxin from<br />
groundnut samples throughout this analysis of real samples.<br />
4.5.1 Analysis of Blank<br />
The results of these analyses are shown in Figures 3.112a and 3.112b which<br />
show no peak was observed for the blank samples which indicate that the reagents used<br />
in extraction and clean-up steps did not produce any peak within the scanned potential<br />
range.<br />
(a) (b)<br />
Figure 3.112 Voltammograms of blank in BRB at pH 9.0 obtained by (a) DPCSV and<br />
(b) SWSV methods.<br />
194
Baseline for the blank however, is higher as compared to the BRB at pH 9.0.<br />
This may be due to the effect of organic compounds which were used in the extraction<br />
process such as methanol and chloroform present in the blank solution which could not<br />
be removed completely during nitrogen purging. The voltammetric measurement was<br />
repeated after two weeks for the same solution and no significant changes in their<br />
voltammograms were observed.<br />
195<br />
Further investigation which involved the addition of 10 ppb AFB2 in the blank<br />
sample to observe any effect on Ip of AFB2 was carried out with the DPCSV and SWSV<br />
methods. Voltammograms of the blank sample with AFB2 are shown in Figure 3.113<br />
and Table 3.24 shows the Ip of AFB2 for both cases. Since the Ip of 10 ppb AFB2<br />
measured in the presence and absence of the blank sample is not significantly different,<br />
it may be concluded that the blank sample does not interfere with the determination of<br />
aflatoxin in the real sample.<br />
(a) (b)<br />
Figure 3.113 DPCSV (a) and SWSV (b) voltammograms of 10 ppb AFB2 (i) in<br />
presence of a blank sample (ii) obtained in BRB at pH 9.0 (iii) as the supporting<br />
electrolyte.
Table 3.24 The Ip and Ep of 10 ppb AFB2 in the presence and absence of a blank<br />
sample<br />
Sample<br />
10 ppb AFB2 in<br />
BRB at pH 9.0<br />
10 ppb AFB2 in<br />
BRB at pH 9.0 +<br />
blank sample<br />
Ip (nA)<br />
21.23 ± 0.21<br />
(0.98%)<br />
20.40 ± 0.20<br />
(0.99%)<br />
DPCSV (n=3)<br />
Ep (V)<br />
-1.25<br />
-1.25<br />
3.5.3 Recovery Studies of Aflatoxins in Real Samples<br />
Ip (nA)<br />
454 ± 2.65<br />
(0.58%)<br />
443 ± 3.21<br />
(0.72%)<br />
SWSV (n=3)<br />
Ep (V)<br />
-1.34<br />
-1.34<br />
This study was carried out by spiking three different concentration levels (3 ppb,<br />
9 ppb and 15 ppb) into the eluate of ground nut sample followed by the extraction and<br />
cleaning-up processes. 15 ppb was the highest concentration used in this study since<br />
this is the highest permissible level for total aflatoxin that should be present in<br />
groundnut sample as imposed by the <strong>Malaysia</strong>n Government. The voltammetric<br />
measurements have been made continuously for three days to observe the recovery of<br />
aflatoxins in real samples which was kept in the freezer at 4° C. Figure 3.114 shows the<br />
DPCSV voltammograms of real samples added with 3 ppb, 9 ppb and 15 ppb AFB1 in<br />
BRB at pH 9.0 for day one. For other aflatoxin such as AFG1 their voltammograms are<br />
shown in Appendix AF. The same study was carried out by the SWSV method and for<br />
example, the SWSV voltammograms of AFB1 are shown in Appendix AG.<br />
196
(i) (ii)<br />
Figure 3.114 DPCSV voltammograms of real sample (b) added with 3 ppb (i), 9 ppb<br />
(ii) and 15 ppb AFB1 (iii) obtained in BRB at pH 9.0 (a) as the blank on the first day of<br />
measurement.<br />
(iii)<br />
197
Figure 3.115 shows the percentage of recovery for all aflatoxins within 3 days<br />
obtained by the DPCSV techniques. For those obtained by the SWSV technique, their<br />
figures are shown in Appendix AH.<br />
% recovery<br />
120<br />
100<br />
80<br />
60<br />
40<br />
20<br />
0<br />
Day 1 Day 2 Day 3<br />
% recovery<br />
120<br />
100<br />
80<br />
60<br />
40<br />
20<br />
0<br />
AFB1<br />
AFB2<br />
AFG1<br />
AFG2<br />
% recovery<br />
120<br />
100<br />
80<br />
60<br />
40<br />
20<br />
Day 1 Day 2 Day 3<br />
0<br />
Day 1 Day 2 Day 3<br />
(a) (b)<br />
AFB1<br />
AFB2<br />
AFG1<br />
AFG2<br />
(c)<br />
Figure 3.115 Percentage of recoveries of (a) 3 ppb, (b) 9 ppb and (c) 15 ppb of all<br />
aflatoxins in real samples obtained by the DPSV method for one to three days<br />
measurements.<br />
The results show that at first day of measurement using both techniques, the<br />
recoveries of 3 ppb, 9 ppb and 15 ppb of all aflatoxins were from 85 % to 102 % which<br />
indicate that the recovery is good. An example on how the recovery is calculated is<br />
represented in Appendix AI. The European Committee for Standardisation (CEN<br />
Report, 1999) stated that the percentage recovery for aflatoxins in real samples should<br />
198<br />
AFB1<br />
AFB2<br />
AFG1<br />
AFG2
e 50 to 120%. Based on these criteria, the recoveries of total aflatoxins are acceptable<br />
using this developed method. These recovery values slightly decreased with longer<br />
keeping time which may be due to the matrix effect. Based on this finding, it is<br />
suggested that the recovery study should be performed on the same day of the sample<br />
preparation.<br />
3.5.4 Analysis of Aflatoxins in Real Samples<br />
In this study, all real samples were analysed using the developed DPCSV and<br />
SWSV methods. For all samples, only the AFB1 was found in this analysis. The<br />
DPCSV and SWSV voltammograms of the real samples and with added 10 ppb AFB1<br />
standard solution are shown in Figures 3.116 to 3.121. Examples of real samples with<br />
no aflatoxin, small and large traces of aflatoxin are shown in samples S11, S07 and S10<br />
respectively. The DPCSV voltammograms of these samples are shown in Figure 3.116,<br />
3.118 and 3.120 respectively. The sample S11 shows no traces of aflatoxin, S07<br />
contains 5.90 ppb and S10 contains 31.93 ppb aflatoxin. As comparison, the HPLC<br />
chromatograms for real samples (S07 and S10) are shown in Appendix AJ.<br />
Figure 3.116 DPCSV voltammograms of real sample, S11 (b) with the addition of 10<br />
ppb AFB1 (c) in BRB at pH 9.0 (a) as the blank. Parameter conditions; Eacc = -0.6 V,<br />
tacc = 80 s, scan rate = 50 mV/s and pulse amplitude = 80 mV.<br />
199
Figure 3.117 SWSV voltammograms of real sample S11 (b) with the addition of 10<br />
ppb AFB1 (c) in BRB at pH 9.0 (a) as the blank. Parameter conditions; Eacc = -0.8 V,<br />
tacc = 100 s, scan rate = 3750 mV/s, frequency = 125 Hz, voltage step = 0.03 V and<br />
pulse amplitude = 75 mV.<br />
Figure 3.118 DPCSV voltammograms of real sample S07 (b) with the addition of 10<br />
ppb AFB1 (c) in BRB at pH 9.0 (a) as the blank. Parameter conditions; Eacc = -0.6 V,<br />
tacc = 80 s, scan rate = 50 mV/s and pulse amplitude = 80 mV.<br />
200
Figure 3.119 SWSV voltammograms of real sample S07 (b) with the addition of 10<br />
ppb AFB1 (c) in BRB at pH 9.0 (a) as the blank. Parameter conditions; Eacc = -0.8 V,<br />
tacc = 100 s, scan rate = 3750 mV/s, frequency = 125 Hz, voltage step = 0.03 V and<br />
pulse amplitude = 75 mV.<br />
Figure 3.120 DPCSV voltammograms of real sample S10 (b) with the addition of 10<br />
ppb AFB1 (c) in BRB at pH 9.0 (a) as the blank. Parameter conditions; Eacc = -0.6 V,<br />
tacc = 80 s, scan rate = 50 mV/s and pulse amplitude = 80 mV<br />
201
Figure 3.121 SWSV voltammograms of real sample S10 (b) with the addition of 10<br />
ppb AFB1 (c) in BRB at pH 9.0 (a) as the blank. . Parameter conditions; Eacc = -0.8 V,<br />
tacc = 100 s, scan rate = 3750 mV/s, frequency = 125 Hz, voltage step = 0.03 V and<br />
pulse amplitude = 75 mV.<br />
The total aflatoxin contents in all 15 samples are shown in Table 3.25. The<br />
results that were obtained by the HPLC technique are also listed which are not<br />
significantly different. In our study using the both proposed techniques, out of 15<br />
analysed samples, 2 samples (13%) were contaminated with more than 15 ppb of total<br />
aflatoxins, 8 samples (53%) were not contaminated and 34% were contaminated with<br />
less than 15 ppb of aflatoxin. Higher levels of aflatoxins were observed in groundnuts<br />
which have been kept for two weeks in the laboratory (S04 and S10) before being<br />
analysed compared to the same samples that were analysed immediately (S01 and S02).<br />
This indicates that the storage time also can affect the level of aflatoxins in groundnut<br />
samples. Due to that reason other samples were analysed immediately. Appendix AK<br />
shows an example on how the aflatoxin content in the S13 was calculated.<br />
202
Table 3.25 Total aflatoxin contents in real samples which were obtained by the<br />
DPCSV, SWSV and HPLC techniques (average of duplicate analysis)<br />
Samples<br />
S01<br />
S02<br />
S03<br />
S04<br />
S05<br />
S06<br />
S07<br />
S08<br />
S09<br />
S10<br />
S11<br />
S12<br />
S13<br />
S14<br />
S15<br />
n.d: not detected<br />
DPCSV<br />
12.73<br />
7.12<br />
n.d<br />
21.46<br />
9.90<br />
n.d<br />
5.90<br />
n.d<br />
n.d<br />
31.93<br />
n.d<br />
n.d<br />
10.76<br />
n.d<br />
n.d<br />
Total aflatoxin (ppb)<br />
SWSV<br />
13.92<br />
8.36<br />
n.d<br />
29.72<br />
8.95<br />
n.d<br />
8.17<br />
n.d<br />
n.d<br />
35.65<br />
n.d<br />
n.d<br />
9.21<br />
n.d<br />
n.d<br />
HPLC<br />
14.34<br />
8.83<br />
0.50<br />
19.08<br />
5.34<br />
n.d<br />
3.67<br />
n.d<br />
1.84<br />
36.00<br />
0.42<br />
1.75<br />
8.25<br />
n.d<br />
n.d<br />
203
4.1 Conclusions<br />
CHAPTER IV<br />
CONCLUSIONS AND RECOMMENDATIONS<br />
The voltammetry technique which is one of the electrochemical methods was<br />
successfully studied through various methods such as cyclic voltammetry (CV),<br />
differential pulse cathodic stripping voltammetry (DPCSV) and square-wave stripping<br />
voltammetry (SWSV) for determination of aflatoxin compounds. The objectives of this<br />
research were to study the electroanalytical properties of aflatoxins and developing<br />
voltammetric methods for the determination of these compounds in food samples such<br />
as groundnuts. This study met these objectives in terms of the determination of<br />
electroanalytical properties of aflatoxins and has also proven the hypothesis regarding<br />
these properties for the studied compounds such as the compounds that are actively<br />
adsorbed on mercury electrode and undergone totally irreversible reduction reaction.<br />
This study was also successful in developing the DPCSV and SWSV methods for<br />
qualitative and quantitive determinations of aflatoxins in standard solution and real<br />
groundnut samples. The study also proved that aflatoxins which are organic compounds<br />
can be determined by voltammetric techniques with convenient quantitation down to<br />
10 -9 M (or ppt) concentration level<br />
The voltammetric studies of aflatoxins reveals that the proposed DPCSV and<br />
SWSV methods are free from inteference effect by studied metal ions and organic<br />
compounds. Both techniques are successful in the determination of aflatoxin as<br />
204
individual rather than in mixed condition. An attempt to analyse them simultaneously<br />
was not possible due to the fact that the location of the peak potentials of all aflatoxins<br />
are very close each other. Harvey (2000) suggested that to get separate peaks for mixed<br />
analytes, the difference of their respective peak potential should be more than 0.08 V.<br />
All studied aflatoxins (AFB1, AFB2, AFG1 and AFG2) undergo reduction<br />
reactions at the mercury electrode with totally irreversible reaction in BRB at pH 9.0.<br />
The respective DPCSV and SWSV peak currents increase linearly with increasing<br />
concentration for all aflatoxins in the range of 0.02 to 0.32 µM and from 0.01 to 0.125<br />
µM. The peak potentials for all aflatoxins in this solution are located within -1.20 V<br />
and they are shifted towards the less negative direction with increasing concentration of<br />
aflatoxins. The aflatoxins that are adsorbed on the mercury electrode produce higher<br />
peak current with longer accumulation time until a limit is reached due to the saturation<br />
of the electrode surface.<br />
The DPCSV technique that was successfully developed for the determination of<br />
aflatoxins was one which gives a detection limit of around 2.0 ppb for all aflatoxins.<br />
This is an acceptable LOD for the determination of aflatoxin in groundnut samples.<br />
The optimum parameter conditions for the DPCSV method of the aflatoxins are Ei = -<br />
1.0 V (except for AFG1 = -0.95 V), Ef = -1.4 V, Eacc = -0.6 V, tacc = 80 s, scan rate = 50<br />
mV/s and pulse amplitude = 80 mV/s. A SWSV technique was also successfully<br />
developed for the analysis of aflatoxins which gives a lower LOD of around 0.5 ppb.<br />
The optimum parameter conditions for the SWSV for all aflatoxins are Ei = -1.0 V<br />
(except for AFG1 = -0.95 V), Ef = -1.4 V, Eacc = -0.8 V, tacc = 100 s, scan rate = 3750<br />
mV/s, frequency = 125 Hz, voltage step = 0.03 V and pulse amplitude = 50 mV/s. From<br />
the statistical analysis of the both proposed techniques, the methods are considered<br />
sensitive, accurate, precise, rugged, robust and provide shorter analysis time.<br />
From the stability studies of aflatoxins, it can be concluded that aflatoxins stock<br />
solution in acetonitrile: benzene (98%) should be kept in the dark and cool conditions<br />
for longer shelf life. For aflatoxin standard solutions prepared in BRB at pH 9.0 and<br />
205
stored in the same conditions as for the stock solutions, AFG1 and AFG2 could be used<br />
up to 2 months while AFB1 and AFB2 up to 3 months. All afaltoxins are stable in 1.0<br />
M HCl within 6 hours compared to that in 1.0 M NaOH.<br />
Both proposed technique are successfully developed and applied in the<br />
determination of aflatoxins in groundnuts. The results that were obtained by both<br />
techniques are not significantly different than those obtained by the HPLC. As<br />
compared to the latter technique, the proposed techniques gave an advantage in terms of<br />
analysis time where the voltammetric analysis need less than 2 minutes or even less<br />
than 30 s for SWSV technique to complete the analysis of one sample while the HPLC<br />
takes approximate 15 min. However, the HPLC is able to separate and analyse all<br />
aflatoxins simultaneously compared to the proposed techniques.<br />
Finally, it can be concluded that the proposed DPCSV and SWSV methods<br />
which are sensitive, accurate, precise, fast, rugged, robust and low cost methods were<br />
successfully developed for the determination of aflatoxins in groundnuts samples. Both<br />
methods have a great potential as an alternative method for this application in the<br />
future.<br />
4.2 Recommendations<br />
In this study, the mercury electrode was applied throughout the experiment. Due<br />
to the oxidation of mercury taking place at the oxidation potential of more than 0 V to<br />
form mercury (I), the study of aflatoxins were restricted in the range of 0 to -1.5 V.<br />
Further study is suggested by using alternative electrodes such as carbon paste, carbon<br />
paste with chemical modified electrode, gold, platinum or glassy carbon electrode<br />
which has a larger potential window compared to the mercury electrode. Another<br />
working electrode such as bismuth film electrode (BFE) can be further investigated for<br />
this analysis due to its performance that has been proven to compare favorably to or<br />
even surpass to that of mercury electrode (Hutton et al., 2005; Economou, 2005).<br />
206
A study on reagents that can complex with aflatoxins is suggested in order to<br />
make the simultaneous determination of aflatoxins in real sample possible. The use of<br />
surface active reagents such as alginic acid, Triton X-100 or alkaline phosphatase that<br />
can be adsorbed on mercury electrode (Wang, 2000) and inhibit one of the aflatoxins<br />
can be studied so as to observe their effect on the peak current of aflatoxins either as in<br />
standard solution or simulation samples.<br />
A study of the effect of storage condition and the storing time duration of<br />
groundnut samples to the level of aflatoxins using the DPCSV and SWSV techniques is<br />
suggested. The results from this study can provide valuable information on good<br />
practice in storing groundnuts at home and for obtaining a data base regarding the<br />
storing time of groundnuts to avoid any contamination by aflatoxins. The stability of<br />
aflatoxins which are treated at various temperatures and exposure time to ultra violet<br />
(UV) light is suggested. The reason for this study is to determine the degree of<br />
temperature and exposure time to UV light that can totally diminish the aflatoxins.<br />
Finally, in this study, the DPCSV and SWSV techniques were applied in<br />
analysed of groundnut samples but for the future works, both techniques can be<br />
explored for analysis of aflatoxins in other types of samples such as rice, cooking oil,<br />
207<br />
cigarettes tobacco, local and imported meats, bread, fish and vegetables due to higher<br />
consumption by the <strong>Malaysia</strong>n population. Some reports have been published regarding<br />
these analyses (Aycicek et al., 2005; Edinboro and Karnes, 2005; Shenasi and Candlish,<br />
2002; Arrus et al., 2004; AbdulKadar et al., 2004; Erdogan, 2004; Gowda, 2004) but<br />
unfortunately none of them are related to the local environment in <strong>Malaysia</strong> except a<br />
paper by Ali et al. (2005) which focused on the analysis of aflatoxins in commercial<br />
traditional herbal medicines used in <strong>Malaysia</strong> and Indonesia.
REFERENCES<br />
Abbas, A.N. and Mostafa, G.A.E. (2003). New Triiodomercurate-Modified Carbon<br />
Paste Electrode for the Potentiometric Determination of Mercury. Anal. Chim.<br />
Acta. 478:329-335.<br />
Abbaspour, A. and Moosavi, S.M.M.(2002). Chemically Modified Carbon Paste<br />
Electrode for Determination of Copper (II) by Potentiometric Method. Talanta.<br />
52: 91-96.<br />
Abdine, H. and Belal, F. (2002). Polarographic Behaviour and Determination of<br />
Acrivastine Capsules and Human Urine. Talanta. 56: 97-104<br />
Abdulkadar, A.H.W., Abdulla, A. A. A., Afrah M. A. and Jassim, H.A. (2004).<br />
Mycotoxins in Food Products Available in Qatar. Food Control. 15: 543-548.<br />
Aboul-Eneim, H. Y., Stefan, R-I. and Baiulescu, G-E. (2000). Quality and Realibility in<br />
Analytical Chemistry. New York: CRC Press.<br />
Abu Zuhri, A. Z., Zatar, N. A., Shubeitah, R.M. and Arafat, H.H. (2000). Voltammetric<br />
and Spectrophotometric Determination of Nizatidine in Pharmaceutical<br />
Formulations. Mikrochim. Acta.134:153-160.<br />
Ahmad, M. (1993). Pengenalan Statistik Dalam Kimia Analisis. Kuala Lumpur: Dewan<br />
Bahasa Dan Pustaka.<br />
Akiyama, H., Goda, Y. Tanaka. T, and Toyoda, M. (2001). Determination of Aflatoxins<br />
B1, B2, G1 and G2 in Spices Using a Multifunctional Column Clean-up, J. of<br />
Chromatography A. 932: 153-157.<br />
208
Alborzi, S., Pourabbas, B., Rashidi, M. and Astaneh, B. (2005). Aflatoxin M1<br />
Contaminated in Pasteurised Milk in Shiraz (south of Iran). Food Control. Article<br />
in press.<br />
Al-Ghamdi, A.H., Al-shadokhy, M.A. and Al-watan, A.A. (2004). Electrochemical<br />
Determination of Cephalothin Antibiotic by Adsorptive Stripping Voltammetric<br />
Technique. J.Pharm. Bioanal. Anal. 35(5):1001-1009.<br />
Ali, N., Hashim, N.H., Saad, B., Safan, K., Nakajima, M. and Yoshizawa, T. (2005).<br />
Evaluation of a Method to Determine the Natural Occurence of Aflatoxins in<br />
Commercial Traditional Herbal Medicines From <strong>Malaysia</strong> and Indonesia. Food<br />
and Chemical Toxicology. 43(12): 1763-1772.<br />
Almeida, l.E., Castilho, M., Maza, L.H. and Tabak, M.(1998). Voltammetric and<br />
Spectroscopic Studies of the Oxidation of the Anti-oxidant Drug Dipyridamole in<br />
Acetonitrile and Ethanol. Anal. Chim. Acta. 375: 223-231.<br />
Ammida, N.H.S., Micheli, L. and Palleschi, G. (2004). Electrochemical Immunosensor<br />
for Determination of Aflatoxin B1 inBarley. Anal. Chim. Acta. 520: 159-164.<br />
Andrieux, C.P., Hapiot, P. and Saveant, J.M.(1990). Ultramicroelectroded for Fast<br />
Electrochemical Kinetics. Electroanalysis. 2:183-193.<br />
Androu, V.G., Nikolelis, D. and Tarus, B. (1997). Electrochemistry Investigation of<br />
Transduction of Interactions of Alfatoixin M1 With Bilayer Lipid Membranes<br />
(BLMs), Anal. Chim. Acta. 350:121-127.<br />
Aoki, K. (1990). Theory of Stationary Current Potential Curves at Interdigitated<br />
Microarray Electrodes for Quasi-reversible and Totally Irreversible Electrode<br />
Reactions. Electroanalysis. 2: 229-233.<br />
209
Arancibia, V., Alarcon, L. and Sefura, R. (2004). Supercritical Fluid Extraction of<br />
Cadmium as Cd-Oxime Complex From Human Hair; Determination of Square-<br />
Wave Anodic or Adsorptive Stripping Voltammetry. Anal. Chim. Acta. 502:<br />
189-194.<br />
Arranz, A., Dolara, I., de Betono, S.F., Moreda, J. M., Cid, A. and Arranz, J.F.<br />
(1999). Electroanalytical Study and Square Wave Voltammetric Techniques for<br />
the Determination of β-blocker Timolol at the Mercury Electrode. Anal. Chim<br />
.Acta. 389: 225-232.<br />
Arranz, P., Arranz, A., Moreda, J. M., Cid, A. and Arranz, J.F. (2003). Stripping<br />
Voltammetric and Polarographic Techniques for Determination of Anti-fungal<br />
Ketoconazole on the Mercury Electrode. J. Pharm. Biomed. Anal. 33: 589-596.<br />
Arrigan, D. W. M. (1994). Voltammetric Determination of Trace Metals and<br />
Organics After Accumulation at Modified Electrodes. Analyst. 119: 1953-1966.<br />
Arrus, K., Blank, G., Abramson, D. Clear, R. and Holley, R. A. (2004). Aflatoxins<br />
Production by Aspergillus flavous in Brazil Nuts. J of Stored Products<br />
Research. 41(5): 513-527.<br />
Aslanoglu, M. and Ayne, G. (2004). Voltammetric Studies of the Interaction of<br />
Quinacrine With DNA. Anal. Bioanal.Chem. 380: 658-663.<br />
Aycicek, H., Aksoy, A. and Saygi, S.(2005). Determination of Aflatoxin Levels in<br />
Some Dairy and Food Products Which Consumed in Ankara, Turkey. Food<br />
Control. 16: 263-266.<br />
Aziz, N.H. and Moussa, L.A., (2002). Influence of Gamma-radiation on Mycotoxin<br />
Producing Moulds and Mycotoxins in Fruits. Food Control. 13: 281-288.<br />
210
Aziz, N.H., Youssef, Y.A., El-Fouly, M.Z. and Moussa, L.A., (1998).<br />
Contamination of Some Common Medicinal plant Samples and Spices by Fungi<br />
and Their Mycotoxins. Bot. Bull. Acad. Sin. 39: 279-285.<br />
Badea, M., Micheli, L., Messia, M. C., Candigliota, T., Marconi, E., Mottram, T.,<br />
Velasco-Garcia, M., Moscone, E. and Palleschi, G. (2004). Aflatoxin M1<br />
Determination in Raw Milk Using a Flow-injection Immunoassay System. Anal<br />
Chim Acta. 520: 141-148.<br />
Bakirci, I. (2001). A Study On the Occurence of Aflatoxin M1 in Milk and Milk<br />
Products Produced in Van Province of Turkey. Food Control. 12: 47-51.<br />
211<br />
Bankole, S.A., Ogunsanwo, B.M. and Eseigbe, D.A. (2005a). Aflatoxins in Nigerian<br />
Dry-roasted Groundnuts. Food Chemistry. 89: 503-506.<br />
Bankole, S.A., Ogunsanwo, B.M. and Mabekoje, O.O.(2004) Natural Occurrence of<br />
Moulds and Aflatoxin B1 in Melon Seed From Markets in Nigeria. Food and<br />
Chemical Toxicology. 42: 1309-1314.<br />
Bankole, S.A., Ogunsanwo, B.M., Osho, A. and Adewuyi, G.O. (2005b). Fungal<br />
Contamination and Aflatoxin B1 of ‘Egusi’ Melon Seeds in Nigeria. Food<br />
Control. Article in press.<br />
Barbeira, P.J.S. and Stradiotto, W.R., (1997). Simultaneous Determination of Trace<br />
Amounts of Zinc, Lead and Copper in Rum by Anodic Stripping Voltammetry.<br />
Talanta. 44: 185-188.<br />
Barker, G.C. and Jenkins, I.L. (1952). Square-wave Polarography. Analyst. 77: 685-<br />
695.
Barek, J., Fogg, A. G., Muck, A. and Zima, J. (2001a). Polarography and<br />
Voltammetry at Mercury Electrodes. Critical Reviews In Analytical Chemistry.<br />
31: 291-309.<br />
212<br />
Barek, J., Cvacka, J., Muck, A. and Quaiserova, A. (2001b). Electrochemical<br />
Methods for Monitoring of Environmental Carcinogens. Fresenius J Anal Chem.<br />
369: 556-562.<br />
Barek, J., Pumera, M., Muck. A., Kaderabkova, M. and Zima, J. (1999).<br />
Polarographic and Voltammetric Determination of Selected Nitrated Polycyclic<br />
Aromatic Hydrocarbons. Anal Chim Acta. 393: 141-146.<br />
BAS (1993) Controlled Growth Mercury Electrode Instruction Manual,<br />
Bioanalytical System, Inc. Indiana.<br />
Batista, L.B., Chalfoun, S.M., Prado, G., Schwan, R.F. and Wheals, A.E. (2003).<br />
Toxigenic Fungi Associated With Processed (green) Coffee Beans (Coffea<br />
arabica-L). Int J Of Food Microbiolog. 85: 293 – 300.<br />
Beaver, R.W. and Wilson, D.M. (1990). Comparison of Postcolumn Derivatisation-<br />
Liquid Chromatography With Thin-layer Chromatography for Determination of<br />
Aflatoxins in Naturally Contaminated Corn. J. Assoc.Off. Anal. Chem. 73(4):<br />
379 – 381.<br />
Beaver, R.W., James, M.A. and Lin, T.Y. (1991). ELISA-based Screening Test<br />
With Liquid Chromatography for the Determination of Aflatoxin in Corn. J.<br />
Assoc.Off. Anal. Chem. 74: 827 – 829.<br />
Beebe, B.M. (1978). Reverse Phase High Pressure Liquid Chromatographic<br />
Determination of Aflatoxins in Foods. J. Assoc. Off. Anal. Chem. 81: 1347-<br />
1352.
Begum, F. and Samajpati, N. (2000). Mycotoxin Production on Rice, Pulses and<br />
Oilseeds. Naturwissenschaften. 87: 275-277.<br />
Berzas, J.J., Rodriguez, J., Castaneda, G. and Villasenor, M.J. (2000).<br />
Voltammetric Behavior of Sildenafil Citrate (Viagra) Using Square-wave and<br />
Adsorptive Stripping Square-wave Techniques. Determination in<br />
Pharmaceutical Products. Anal. Chim. Acta. 417: 143-148.<br />
Betina, V. (1984). Mycotoxin – Production, Isolation, Separation and Purification.<br />
Netherland: Elsevier Science.<br />
Bicking, M.K.L., Kniseley, R.N and Svec, H.J. (1983). Coupled-Column for<br />
Quantitating Low Levels of Aflatoxins. J . Assoc. Off. Anal. Chem. 66: 905-908.<br />
Bijl, J. and Peteghen, C.V.(1985). Rapid Extraction and Sample Clean-up for the<br />
Fluorescence DensitometricDetermination of Aflatoxin M1in Milk and Milk<br />
Powder. Anal. Chim. Act. 170: 149-152.<br />
Billova, S., Kizek, R., Jelen, F. and Novotna, P. (2003). Square-wave Voltammetric<br />
Determination of Cefoperazone in a Bacterial Culture, Pharmaceutical Drug,<br />
Milk and Urine. Anal Bioanal Chem. 377: 362-369.<br />
Bingham, A.K., Huebner, H.J., Phillips, T.D. and Baver, J.E. (2004). Identification<br />
and Reduction of Urinary Aflatoxin Metabolites in Dog. Food and Chemical<br />
Toxicology. 42(11): 1851-1858.<br />
Blanc, R., Gonzalez-Casado, A., Navabu, A. and Vilchez, J.L. (2000). The Estimate<br />
of Blanks in Differential Pulse Voltammetric Technique: Application to<br />
Detection Limits Evaluation as Recommended by IUPAC. Anal. Chim. Acta.<br />
403: 117-123.<br />
213
Blesa, J., Soriano, J.M., Molto, J.C., Marin, R. and Manes, J. (2003). Determination<br />
of Aflatoxins in Peanuts by Matrix Solid-phase Dispersion and Liquid<br />
Chromatography, J of Chromatography A. 1011: 49-54.<br />
Bond, A.M., Oldham, K.B. and Zoski, C.G. (1989). Steady State Voltammetry.<br />
Anal. Chim. Acta. 216: 177-230.<br />
Brainina, Kh. (1974). Stripping Voltammetry in Chemical Analysis. New York:<br />
Wiley and Sons.<br />
Brainina, Kh., Malakhova, N.A. and Stojko, Y. (2000). Stripping Voltammetry in<br />
Environmental and Food Analysis. Fresenius J Anal Chem. 368: 307-325.<br />
214<br />
Brera, C., Caputi, R., Miraglia, M., Iavicoli, I., Salerno, A. and Carelli, G. (2002).<br />
Exposure Assessment to Mycotoxins in Workplace: Aflatoxins and Ochratoxin<br />
A Occurence in Airborne Dust and Human Sera. Microchemical J. 73(1-2): 167-<br />
173.<br />
Bressolle, F., Bromet-Petit, M. and Audron, M. (1996). Validation of Liquid<br />
Chromatography and Gas Chromatography Methods: Application to<br />
Pharmacokinetic. J. Chromatogr, B. 686: 3-10.<br />
Buffle, J. and Tercier-Waeber, M-L. (2005). Voltammetric Environmental Trace-<br />
Metal Analysis and Speciation: From Laboratory to in situ Measurements. Trend<br />
In Anal. Chem. 24(3): 172-191.<br />
Cakala, M., Mazerska, Z., Donten, M. and Stojek, Z. (1999). Electroanalytical and<br />
Acid-base Properties of Imidazoacridinanone, an Antitumor Drug (C-1311).<br />
Anal. Chim. Acta. 379: 209-215.
Canabillas, A.G., Burguillos, J.M.O., Canas, M.A.M, Caceres, M.I.R. and Lopez,<br />
F.S. (2003). Square Wave Adsorptive Stripping Voltammetric Determination of<br />
Piromidic acid. Application in Urine. J Pharm. Biomed. Anal. 33: 553-562.<br />
Carapuca, H.M., Cabral, D.J. and Rocha, L.S. (2005). Adsorptive Stripping<br />
Voltammetry of Trimethoprim: Mechanistic Studies and Application to the Fast<br />
Determination in Pharmaceutical Suspensions. J Pharm. Biomed. Anal. 38: 364-<br />
369.<br />
215<br />
Carlson, M.A. , Bargeron, C.B. , Benson, R.C., Fraser, A.B., Phillips, T.E., Velky, J.<br />
T., Groopman, J.D., Strickland, P.T. and Ko, H.W. (2000). An Automated,<br />
Handheld Biosensor for Aflatoxin. Biosensors and Bioelectronic. 14: 841-848.<br />
Carpini, G., Lucavelli, F., Marrazza, G. and Mascini, M., (2004). Oligonucleotide-<br />
Modified Screen-printed Gold Electrodes for Enzyme Amplified Sensing of<br />
Nucleic Acids. Biosensors and Bioelectronic. 20: 167-175.<br />
Castro, A.A., Wagener, A.L.R., Farias, P.A.M. and Bastos, M. B. (2004).<br />
Adsorptive Stripping Voltammetry of 1-hydroxypyrene at the Thin-film<br />
Mercury Electrode-basis for Quantitative Determination of PAH Metabolite in<br />
Biological Materials. Anal. Chim. Acta. 521: 201-207.<br />
CEN Report. (1999). Food analysis – Biotoxins – Criteria of Analytical Methods of<br />
Mycotoxins. European Committee for Standardisation CR 13505:99 E. 1-7.<br />
Cepeda, A., Franco, C.M., Fente, C.A., Vazquez, B.I., Rodriguez, J.L., Prognon, P.<br />
and Mahuzier, G. (1996). Post-collumn Excitation of Aflatoxins Using<br />
Cyclodextrins in Lliquid Chromatography for Food Analysis. J of Chromatogr.<br />
A. 721: 69-74.
Cespedez, A.E and Diaz, G.J. (1997). Analysis of Aflatoxins in Poultry and Pig<br />
Feeds and Feedstuffs used in Colombia. J. Assoc. Off. Anal. Chem. 80: 1215-<br />
1219.<br />
Chan, C.C. (2004). Potency method validation. In: Chan, C.C., Lam, H., Lee, Y.C.<br />
and Zhang, X-M. Analytical Method Validation and Instrument Performance<br />
Verification. USA: John Wiley and Sons.<br />
216<br />
Chan, D., MacDonald, S.J., Boughtflower, V. and Brereton, P. (2004). Simultaneous<br />
Determination of Aflatoxins and Ochratoxin A in Food Using a <strong>Full</strong>y<br />
Automated Immunoaffinity Column Clean-up and Liquid Chromatography-<br />
Fluorescence Detection. J of Chromatoraphy A. 1059: 13-16.<br />
Chang, H.L. and De Vries, J.W. (1983). Rapid High Performance Liquid<br />
Chromatography Determination of AFM1 in Milk and Nonfat Dry Milk. J.<br />
Assoc. Off. Anal. Chem. 66: 913-917.<br />
Chemistry Department, Ministry of Science Technology and Innovation. (2000).<br />
Standard Procedure for Determination of Aflatoxins (unpublished paper),<br />
<strong>Malaysia</strong>.<br />
Chiavaro, E., Asta, D., Galaverna, G., Biancardi, A., Gambarelli, E., Dossena, A.<br />
and Marchelli, R. (2001). New Reversed-phase Liquid Chromatography Method<br />
to Detect Aflatoxins in Food and Feed with Cyclodextrins as Fluorescence<br />
Enhancers Added to the Eluent. J of Chromatogr. A. 937: 31-40.<br />
Chu, F.S., Fan, T.S.L., Zhang, G.S., Xu, Y.S. Faust, S. and Mac Mohan, P.L.<br />
(1987). Improved Enzyme-linked Immunosorbent Assay for Aflatoxin B1 in<br />
Agricultural Commodities. J. Assoc. Anal. Chem. 70: 854-857.
Ciucu, A.A., Neguleseus, C. and Beldwin, R. P. (2003). Detection of Pesticides<br />
Using an Amperometric Biosensor Based on Ferophthalocyanine Chemically<br />
Modified Carbon Paste Electrode and Immobilised Enzymetic System.<br />
Biosensors and Bioelectronic.18: 303-310.<br />
Cole, R.O., Holland, R.D. and Sepaniak, M.J. (1992). Factors Influencing<br />
Performance in the Rapid Separation of Aflatoxins by Micellar Electrokinetics<br />
Capillary Chromatography. Talanta.39: 1139-1147.<br />
Colombo, C. and van den Berg, C.M.G. (1998). In-line Deoxygenated for Flow<br />
Analysis With Voltammetric Detection. Anal. Chim. Acta. 377: 229-240.<br />
Conesa, A. J., Pinilla, J. M. and Hernandez, L. (1996). Determination of<br />
Metbendazole in Urine by Cathodic Stripping Voltammetry. Anal. Chim. Acta.<br />
331: 111-116.<br />
Creepy, E.E. (2002). Update of Survey, Regulation and Toxic Effect of Mycotoxins<br />
in Europe. Toxicology Letter. 127: 19-28.<br />
Czae, M. Z. and Wang, J. (1999). Pushing the Detectibility of Voltammetry: How<br />
Low Can Go ?. Talanta. 50: 921-928.<br />
Dahmen, E.A.M.F. (1986). Electroanalysis: Theory and Application in Aqueous and<br />
Non-aqeuous Media and in Automated Chemical Control. New York: Elsevier.<br />
Davies, N.D. and Diener, U.L. (1980). Confirmatory Test for the High Pressure<br />
Liquid Chromatographic Determination of Aflatoxin B1. J. Assoc. Off. Anal.<br />
Chem. 63 (1): 107- 109.<br />
217
De Botono, S.F., Moreda, J.M., Arranz, A. and Arranz, J.F. (1996). Study of the<br />
Adsorptive Stripping Voltammetric Behaviour of the Antihypertensive Drug<br />
Doxazosin. Anal. Chim. Acta. 329: 25-31.<br />
De Vries, J. (1996). Food Safety and Toxicity. New York: CRC.<br />
Dean, J.A. (1995). Analytical Chemistry Handbook. USA: Mc Graw Hill.<br />
Demetriades, D., Economou, A. and Voulgaropoulos, A. (2004). A Study of Pencil-<br />
Lead Bismuth-film Electrodes for the Determination of Trace Metals by Anodic<br />
Stripping Voltammetry. Anal. Chim. Acta. 519: 167-172.<br />
Dhavan, A.S. and Choudry, M.R. (1995). Incidence of Aflatoxins in Animal<br />
Feedstuffs: A decade’s Scenario in India. J. AOAC Int. 78 (3): 693 – 698.<br />
Dragacci, S., Gleizes, E., Fremy, J.M. and Candlish A.A.G. (1995). Use of<br />
Immunoaffinity Chromatography as a Purification Step for the Determination of<br />
AFM1 in Cheese. Food Additives and Contaminants. 12(1): 59-65.<br />
Duhart, B.T., Shaw, S., Wooley, M., Allen, T. and Grimes, C. ( 1988a).<br />
Determination of Aflatoxins B1, B2, G1 and G2 by High Performance Liquid<br />
Chromatography With Electrochemical Detector. Anal. Chim. Acta. 208: 343-<br />
346.<br />
Eaton, D.L and Groopman, J.D. (1994).The Toxicity of Aflatoxin. United Kingdom:<br />
Academic Press.<br />
Economou, A. (2005). Bismuth-film Electrode: Recent Development and<br />
Potentialities for Electroanalysis. Trends Anal. Chem. 24(4): 334-340.<br />
218
Economou, A. and Fielden, P.R. (1995). A Study of Riboflavin Determination by<br />
Squarw-Wave Adsorptive Stripping Voltammetry on Mercury Film Electrode,<br />
Electroanalysis. 7: 447 – 453.<br />
Economou, A., Bolis, S.D., Efstathiou, C.E. and Volikakis, G.J. (2002). A Virtual<br />
Electroanalytical Instrument for Square-wave Voltammetry. Anal. Chim. Acta.<br />
467: 179-188.<br />
Edinboro, L.E. and Karnes, H.T. (2005). Determination of Aflatoxin B1 in<br />
Sidestream Cigarette Smoke by Immunoaffinity Column Extraction Coupled<br />
With Liquid Chromatography/mass Spectrometry. J of Chrom. A. 1083: 127-<br />
132.<br />
Egner, P.A., Munoz, A and Kensler, T.W. (2003). Chemoprevention With<br />
Chlorophylin in Individuals Exposed to Dietary Aflatoxins. Mutation Research.<br />
523: 209-216.<br />
El-Desoky, H.S. and Ghoneim, M.M. (2005). Assay of the Anti-psychotic Drug<br />
Haloperidol in Bulk Form, Pharmaceutical Formulation and Biological Fluids<br />
Using Square-wave Adsorptive Stripping Voltammetry at a Mercury Electrode.<br />
J Pharm. Biomed. Anal. 38: 543-550.<br />
El-Hady, D.A., Abdel-Hamid, M.I., Seliem, M.M., Andrisano, V. and El-Maali,<br />
N.A. (2004). Osteryoung Square Wave Stripping Voltammetry at Mercury Film<br />
Electrode for Monitoring Ultra Levels of Tarabine PFS and its Interaction With<br />
SsDNA. J Pharm. Biomed. Anal. 34: 879-890.<br />
219<br />
El-Hafnawey, G.B., El-Hallag, I.S., Ghoneim, E.M. and Ghoniem, M.M. (2004),<br />
Voltammetric Behavior and Quantification of the Sedative-hypnotic Drug<br />
Chlordiazepoxide in Bulk Form, Pharmaceutical Formulation and Human Serum<br />
at a Mercury Electrode. J of Pharm. And Biomed Anal. 34: 75-86.
El-Maali, N.A., Osman, A.H., Aly, A.A.A., Al-Hazmi, G.A.A. (2005).<br />
Voltammetric Analysis of Cu(II), Cd(II) and Zn(II) Complexes and Their Cyclic<br />
Voltammetry with Several Cephalosporin Antibiotics. Bioelectrochemistry. 65:<br />
95-104.<br />
Enker, C.G. (2003). The Art and Science of Chemical Analysis. New York: John<br />
Wiley and Sons.<br />
Ensafi, A.A., Khayamian, T. and Khaloo, S.S. (2004). Application of Adsorptive<br />
Cathodic Differential Pulse Stripping Method for Simultaneous Determination<br />
of Copper and Molybdenum Using Pyrogallol Red. Anal. Chim. Acta. 505: 201-<br />
207.<br />
Erdogan, A. (2004). The Aflatoxin Contamination of Some Pepper Types Sold in<br />
Turkey. Chemosphere. 56: 321-325.<br />
Erk, N. (2004). Voltammetric Behaviour and Determination of Moxifloxacin in<br />
Pharmaceutical Products and Human Plasma. Anal. Bioanal.Chem. 378: 1351-<br />
1356.<br />
Etzel, R.A. (2002). Mycotoxin. J of Am.Med.Assoc. 287: 425-427.<br />
220<br />
EU Commision, Commision Regulation (EC) No 466/2001 of 8 March 2001 Setting<br />
Maximum Levels for Certain Contamination Foodstuffs. (2001). J European<br />
Community. L7.1<br />
Ewing, G.W (Ed). (1997). Analytical Instrumentation Handbook: Revised and<br />
Expanded, 2 nd Ed. New York: Marcel Dekker.
Fang, Y., Gong, F., Fang, X. and Fu, C. (1998). Separation and Determination of<br />
Cyclodextrins by Capillary Electrophoresis With Aperometric Detection. Anal.<br />
Chim. Acta. 369: 39-45.<br />
Faraj, M.K., Smith, J.E. and Harren, G. (1991). Introduction of Water Activity and<br />
Temperature on Aflatoxin Production by Aspergillus flavus and Aspergillus<br />
parasiticus in Irradiated Maize Seeds. Food Additives Contaminants. 6(6): 731-<br />
736.<br />
Farghaly, O.A. and Ghandour, M.A. (2005). Square Wave Stripping Voltammetry<br />
for Direct Determination of Eight Heavy Metals in Soil and Indoor-airborne<br />
Particulate Matter. Environ. Research. 97: 229-235.<br />
221<br />
Farghaly, O.A., Taher, M.A., Naggar, A.H. and El-Sayed,A.Y., (2005). Square<br />
Wave Anodic Stripping Voltammetric Determination of Metoclopramide in<br />
Tablets and Urine at Carbon Paste Electrode. J Pharm. Biomed. Anal. 38: 14-20.<br />
Farias, P.A.M., Wargener, A.L.R., Bastos, M.B.R., de Silva, A.T. and Castro,<br />
A.G.(2004). Cathodic Adsorptive Stripping Voltammetric Behavior of Guanine<br />
in the Presence of Copper at the Static Mercury Drop Electrode. Talanta. 61:<br />
829-835.<br />
Feroncova, A., Korgova, E., Miko, R. and Labuda, J., (2001). Determination of<br />
Tricyclic Antidepressent Using a Carbon Paste Electrode Modified with β-<br />
Cyclodextrin. J. of Electroanalytical Chem. 492: 74-77.<br />
Ferreira, V.S., Zanoni, M.V.B. and Fogg, A.G. (1999). Cathodic Stripping<br />
Voltammetric Determination of Ceftazidine With Reactive Accumulation at a<br />
Poly-L-lysine Modified Hanging Mercury Drop Electrode. Anal. Chim. Acta.<br />
384: 159-166.
Fifield, F.W. and Kealey, D. (2000). Principle and Practice of Analytical<br />
Chemistry 3 rd Edition. UK: Blackwell science.<br />
Fifield, F.W. and Haines, P.J. (2000).Environmental Analytical Chemistry 2 nd Ed,<br />
UK: Blackwell Science.<br />
Foog, A.G. and Wang, J. (1999).Terminology and Convention for Electrochemical<br />
Stripping Analysis. Pure Appl. Chemistry. 71: 891-897.<br />
Fraga, J.M.G., Abizanda, A.I.J., Moreno, F.J. and Leon, J.J.A. (1998). Application<br />
of Principal Component Regression to the Determination of Captopril by<br />
Differential Pulse Polarography With no Prior Removal of Dissolved Oxygen.<br />
Talanta. 46: 73-82<br />
Franco, C.M., Fente, C.A., Vazquez, B.T., Cepede, A., Mahuzier, G. and Prognon,<br />
P. (1998). Interaction Between Cyclodextrin and Alatoxins Q1, M1 and P1<br />
Flourescence and Chromatographic Studies. J of Chromatogr. A. 815: 21-29.<br />
Fremy, J.M. and Chang, B. (1983). Rapid Determination of AFM1 in Whole Milk<br />
by Reversed-phase High Performance Liquid Chromatography. J of<br />
Chromatogr. A. 219: 156-161.<br />
222<br />
Fremy, J.M. and Chu, F.S. (1984). Direct Enzyme-linked Immunosorbent Assay for<br />
Determining Aflatoxin M1 at Picogram Levels in Dairy Products. J. Assoc.<br />
Anal. Chem. 67: 1098 – 1101.<br />
Fukayama, M. Winterli, W. and Hsieh, D.P.H (1980). Rapid Method for Analysis of<br />
Aflatoxin M1 in Dairy Products. J. Assoc. Anal. Chem. 63: 927 – 930.
Gao, W., Song, J. and Wu, N. (2004). Voltammetric Behavior and Square-wave<br />
Voltammetric Determination of Trepibutone at a Pencil Graphite Electrode. J.<br />
Electroanalytical Chem. 576(1): 1-7.<br />
Garcia-Villanova, R.J., Cordon, C., Parama,s A.M.G., Aparicio, P. and Rosales,<br />
M.E.G. (2004). Simultaneous Immunoaffinity Column Clean up and HPLC<br />
Analysis of Aflatoxins and Ochratoxin A in Spanish Bee Pollen. J Agric. Food<br />
Chem.52: 7235-7239.<br />
Garden, S.R. and Strachan, N.J.C. (2001). Novel Colorimetric Immunoassay for the<br />
Detection of Aflatoxin B1, Anal. Chim. Acta. 444: 187-191.<br />
Gauch, R., Leuenberger, U. and Baumgartne, E. (1979). Rapid and Simple<br />
Determination of Aflatoxin M1 in Milk in the Low Parts per 10 12 range. J of<br />
Chromatogr. A. 178: 543-549.<br />
Garner, R.C., Whattam, M.M. , Taylor, P.J.L. and Stow, M.W. ( 1993). Analysis of<br />
United Kingdom Purchased Spices for Aflatoxins Using Immunoaffinity<br />
Column Clean up Procedure Followed up by High-performance Liquid<br />
Chromatographic Analysis and Post-column Derivatization with Pyridium<br />
Bromide Perbromide. J. Chromatography. 648: 485-490.<br />
Gazy, A.A.K. (2004). Determination of Amlodipine Besylate by Adsorptive Square-<br />
Wave Anodic Stripping Voltammetry on Glassy Carbon Electrode in Tablets<br />
and Biological Fluids. Talanta. 62: 575-582.<br />
Ghoneim, M.M. Hassanein, A.M., Hamman, E. and Beltagi, A.M. (2000).<br />
Simultanoues Determination of Cd, Pb, Cu, Sb, Bi, Se, Zn, Mn, Ni, Cr and Fe in<br />
Water Sample by Differential Pulse Stripping Voltammetry at a Hanging<br />
Mercury Drop Electrode. Fresenius J. Anal. Chem. 367: 378-383.<br />
223
Ghoneim, M. M., Tawfik, A. and Khashaba, P.Y. (2003a). Cathodic Adsorptive<br />
Stripping Square-wave Voltammetric Determination of Nifedipine Drug in<br />
Bulk, Pharmaceutical Formulation and Human Serum. Anal. Bioanal. Chem.<br />
375: 369-375.<br />
Ghoneim, M.M., and Tawfik, H.(2004). Assay of Anti-coagulant Drug Warfarin<br />
Sodium in Pharmaceutical Formulation and Human Biological Fluids by<br />
Square-wave Adsorptive Cathodic Stripping Voltammetry. Anal. Chim. Acta.<br />
511: 63-69.<br />
Ghoneim, M.M., El Reis, M.A., Hamman, E. and Beltagi, A.M. (2004). A Validated<br />
Stripping Voltammetric Procedure for Quantification of the Anti-hypertensive<br />
and Benign Prostatic Hyperplasia Drug Terazosine in Tablets and Human<br />
Serum. Talanta. 64(3): 703-710.<br />
Ghoneim, M.M., El-Baradie, K.Y. and Tawfik, H. (2003b). Electrochemical<br />
Behavior of the Antituberculosis Drug Isonianid and its Square-wave<br />
Adsorptive Stripping Voltammetric Estimation in Bulk Form, Tablets and<br />
Biological Fluids at a Mercury Electrode. J. Pharm. Biomed. Anal. 33: 673-685.<br />
Ghoniem, M.M. and Beltagi, A.M. (2003). Adsorptive Stripping Voltammetric<br />
Determination of the Anti-inflammatory Drug Celecoxib in Pharmaceutical<br />
Formulation and Human Serum. Talanta, 60: 911-921.<br />
Ghoniem, M.M. and Tawfik A. (2004). Assay of Anti-coagulant Drug Warfarin<br />
Sodium in Pharmaceutical Formulation and Human Biological Fluids by<br />
Square-wave Adsorptive Cathodic Stripping Voltammetry. Anal. Chim. Acta.<br />
511: 63-69.<br />
224
Gimeno, A. and Martins, M. L (1983). Rapid Thin Layer Chromatographic<br />
Determination of Patulin, Citrinin and Aflatoxin in Apples and Pears and Their<br />
Juices and Jams. J. Assoc. Anal. Chem., 66: 85-91.<br />
Goldblatt L.A (1969) Aflatoxin. New York: Academic Press.<br />
Gonzalez, M.P.E., Mattusch, J. and Wennrich, R. ( 1998). Stability and<br />
Determination of Aflatoxins by High-performance Liquid Chromatography<br />
With Amperometric Detection. J.Chromatography A. 828: 439-444.<br />
Gonzalez, G., Hinojo, M.J., Mateo, R., Medina, A. and Jimenez, M. (2005).<br />
Occurrence of Mycotoxin Producing Fungi in Bee Pollen. Int. J. Food<br />
Microbiology. Article in press.<br />
Gooding, J.J., Compton, R.G., Brennan, C.M. and Atherton, J.H. (1997). A New<br />
Electrochemical Method for the Investigation of the Aggregation of Dyes in<br />
Solution. Electroanalysis. 9(10): 759-764.<br />
Gosser, D.K (1993). Cyclic Voltammetry. New York: Wiley-VCH.<br />
Goto, T., Matsui, M. and Kitsuwa, T. (1988). Determination of Aflatoxins by<br />
Capillary Column gas Chromatography. J of Chromatography. 447: 410-414.<br />
Gourama, H. and Bullerman, L. (1995). Aspergillus flavus and Aspergillus<br />
parasiticus: Aflatoxigenic Fungi of Concern in Foods and Feeds: a Review. J of<br />
Food Protection. 58: 1395-1404.<br />
Gowda, N.K.S., Malathi, V. and Suganthi, R.U. (2004). Effect of Some Chemical<br />
and Herbal Compounds on Growth of Aspergillus parasiticus and Aflatoxin<br />
Production. Anim. Feed Sci. Technol. 116(3-4): 281- 291.<br />
225
Grigoriadou, I.K., Eleftheriadou, A., Mouratidou, T. and Katikou, P. (2005).<br />
Determination of Aflatoxin M1 in Ewe’s Milk Samples and the Produced Curd<br />
and Feta Cheese. Food Control. 16: 257-261.<br />
Guiberteau, A., Galcano, T., More, N., Parilla, P. and Salinas, F., (2001). Study and<br />
Determination of the Pesticide Imidacloprid by Square-wave Adsorptive<br />
Stripping Voltammetry. Talanta. 53: 943-949.<br />
Gurbay, A., Aydin, S., Girgin, G., Engin, A.B. and Sahin, G. (2004). Assessment of<br />
Aflatoxin M1 Levels in Milk in Ankara, Turkey. Food Control. Article in press.<br />
Haghighi, B., Thorpe, C., Pohland, A.E. and Barnette, R. (1981). Development of a<br />
Sensitive High performance Liquid Chromatographic Method for Detection of<br />
Aflatoxins in Pistachio Nuts. J. of Chromatography. 206: 101-108.<br />
Hall, A.J. and Wild, C.P. (1994). The toxicity of aflatoxin: Human, Health,<br />
Veterinary and Agriculture Significance. New York: Academic.<br />
Hamilton, F.W. and Ellis, J. (1980). Determination of Arsenic and Antimony in<br />
226<br />
Electrolytic Copper by Anodic Stripping Voltammetry at a Gold Film Electrode.<br />
Anal. Chim. Acta. 119: 225-233.<br />
Harvey, D. (2000). Modern Analytical Chemistry. USA: McGraw Hill.<br />
Heathcote, J.G. (1984). Aflatoxins and Related Toxins. In: Betina, V. (Ed).<br />
Mycotoxins – Production, Isolation, Separation and Purification. Netherland:<br />
Elsevier Science.<br />
Heathcote, J.G. and Hibbert, J.R (1984) Aflatoxin: Chemical and Biological Aspect.<br />
New York: Elsevier.
Heberneh, G.G. (2004). Highlight on Plant Toxin in Toxicon. Toxicon. 44: 341-344.<br />
Hernandez, P., Dabrio-Ramos, M., Paton, F., Ballesteros, Y. and Hernandez, L.<br />
(1997). Determination of Abscisic Acid by Cathodic Stripping Square Wave<br />
Voltammetry. Talanta. 44: 1783-1792.<br />
Herrman, T. (2004). Mycotoxin in feed grains and ingredient in www.<br />
oznet.ksu.edu. Quote dated: 18 th April 2004<br />
Heyrovsky, J. and Zuman, P. ( 1968). Practical Polarography; An Intoduction for<br />
Chemistry Students. New York: Academic Press.<br />
Hilali, A., Jimenez, J.C., Callejon, M., Bello, M.A. and Guirem, A. (2003).<br />
.Electrochemical Reduction of Cefminox at the Mercury Electrode and its<br />
Voltammetric Determination in Urine. Talanta. 59(1): 137-146.<br />
Hocevar, S.B., Svancara, I., Vytras, K. and Ogorevc, B. (2005). Novel Electrode for<br />
Electrochemical Stripping Analysis Based on Carbon Paste Modified With<br />
Bismuth Powder. Electrochim. Acta. Article in press.<br />
Holcomb, M. , Wilson, D.M., Truckess, M. W. and Thompson, H. C. (1992).<br />
Determination of Aflatoxins in Food Products by Chromatography. J. of<br />
Chromatography A. 624: 341-352.<br />
Hourch, M.E., Dudoit, A. and Amiard, J-C. (2003). Optimization of New<br />
Voltammetric Method for the Determination of Metallothionein.<br />
Electrochim.Acta, 48: 4083-4088.<br />
Hussien, H.S. and Brasel, J.M. (2001). Mycotoxin, Metabolism and Impact on<br />
Humans and Animals. J Toxicology. 167(2): 101-134.<br />
227
228<br />
Hutton, E.A., Hocevar, S.B. and Ogorevc, B. (2005). Ex situ Preparation of Bismuth<br />
Film Microelectrode for Use in Electrochemical Stripping Microanalysis. Anal.<br />
Chim. Acta. 537: 285-292.<br />
Ibrahim, M.S., Kamal, M.M. and Temerk. Y.M. (2003). Comparison of the<br />
Voltammetric Studies at Mercury Electrode and Glassy Carbon Electrodes for<br />
the Interaction of Lumichrome with DNA and Analytical Application. Anal.<br />
Bioanal.Chem. 375: 1024-1030.<br />
Ibrahim, M.S., Shehatta I.S. and Sultan, M.R. (2002). Cathodic Adsorptive<br />
Stripping Voltammetric Determination of Nalidixic Acid in Pharmaceuticals,<br />
HumanUrine and Serum. Talanta. 56: 471-579.<br />
Illkovic, D. (1934). Polarography Study With the Dropping Mercury Cathode. Part<br />
XLIV- The Dependence of Limiting Currents on the Diffusion Constant, on the<br />
Rate of Dropping on the Size Electrode. Collection of Czechoslovak chemical<br />
communication. 6: 498-513.<br />
Inam, R. and Somer, G. (1998). Simultaneous Determination of Selenium and Lead<br />
in Whole Blood Samples by Differential Pulse Polarography. Talanta. 46: 1347-<br />
1355.<br />
International Agency for Research on Cancer (1993). IARC Monographs on the<br />
Evaluation of Carcinogenic Risk to Humans, vol. 56. World Health<br />
Organisation, Lyon.<br />
IUPAC. (1978). Nomenclature: Symbols, Units and Their Usage in Spectrochemical<br />
Analysis-II. Spectrochim. Acta, Part B. 32: 242.
Iwamoto, M., Webber, A. and Osteryoung, A. (1984). Cathodic Reduction of<br />
Thyroxine and Related Compounds on Silver Electrode. Anal. Chem. 56: 1203-<br />
1206.<br />
Jaimez, J., Fente, C.A., Vazquez, B.I., Franco, C.M., Cepeda, A., Mahuzier, G. and<br />
Prognon, P. (2000). Application of the Assay of Aflatoxins by Liquid<br />
Chromatography with Fluorescence Detection in Food Analysis. J.<br />
Chromatography A.. 882: 1-10.<br />
Janssens, M. M. T., Put, H. M. C. and Nout, M. J. R. (1996). In Vries, Food Safety<br />
and Toxicity. New York: CRC Press.<br />
Jeffrey, A.M. and Williams, G.M. (2005). Risk Assessment of DNA-reactive<br />
Carcinogens in Food. Toxicology and Appl. Pharmacology. 207(2): 628-635.<br />
Jeffery, H.W., Lenorich, L.M and Martin, R. Jr. (1982). Liquid Chromatography<br />
Determination of Aflatoxins in Artificially Contaminated Cocoa Beans. J.<br />
Assoc. Off. Anal. Chem. 80: 1215-1219.<br />
Jelen, F., Tomschik, M. and Palecek, E. (1997). Adsorptive Striping Square-wave<br />
Voltammetry of DNA. J. Electroanal. Chem. 423: 141-148.<br />
Ji, Z., Yuan, G., Cai, S., Liu, J. and Liu, G. (2004). Electrochemical Studies of the<br />
Oxidation Mechanism of Polyamide on Glassy Carbon Electrode, J. of<br />
Electroanalytical Chem. 570: 265-273.<br />
Jin, G-P. and Lin, X-Q. (2005). Voltammetric Behavior and Determination of<br />
Estrogens at Carbamylcholine Modified Paraffin-impregnated Graphite<br />
Electrode. Electrochim. Acta. 50: 3556-3562.<br />
229
230<br />
Johnson, W.W., Harris, T.M. and Guyerich V.P. (1996). Kinetics and Mechanism of<br />
Hydrolysis of AFB1 exo-8-9-epoxide and Rearrangement of the Dihydrodiol. J.<br />
Am. Chem. Soc. 118: 672-676.<br />
Joshua, H. (1993). Determination ofAflatoxin by Reversed-phase High Performance<br />
Liquid Chromatography with Post-column in-line Photochemical Derivatization<br />
and Fluorescence Detection. J. Chromatography A. 654: 247-254.<br />
Jurado-Gonzalez, A. J., Galindo-Riano, M. D. and Garcia-Vargas, M. (2003).<br />
Experimental Designs in the Development of a New Method for the Sensitive<br />
Determination of Cadmium in Sea Water by Adsorptive Cathodic Stripping<br />
Voltammetry. Anal. Chim. Acta. 487: 229-241.<br />
Kamal, M.M., Abu Zuhri, A.Z. and Nasser, A.A. O. (1996). Adsorptive Stripping<br />
Voltammetric Analysis of 2,4,6-tri(2 ’ -pyridyl)-1,3,5-triazine at a Mercury<br />
Electrode. Fresenius J Anal Chem. 356: 500-503.<br />
Kamimura, H., Nishijima, M., Yasuda, K., Ushiyama, H., Tabata, S., Matsumoto, S.<br />
and Nishima, T. (1985). Simple, Rapid Clean-up Method for Analysis of<br />
Aflatoxins and Comparison with Various Methods. J. Assoc. Off. Anal. Chem.<br />
68: 458-461.<br />
Kamkar A. (2004) A Study on the Occurence of Aflatoxin M1 in Raw Milk<br />
Produced in Sarab City of Iran. Food Control. 16(7): 593-599.<br />
Kamkar, A. (2005). A Study of the Occurrence of Aflatoxin M1 in Iranian Feta<br />
Cheese. Food Control. Article in press.<br />
Karadjova, I., Girousi, S. , Illadou, E. and Stratis, I. (2000). Determination of Cd,<br />
Co, Cr, Cu, Fe, Ni and Pb in Milk, Cheese and Chocolate. Mikrochim. Acta.<br />
134: 185-191.
Kefala, G., Economou, A., Voulgaropoulos, A. and Sofoniou, M.(2003). A Study of<br />
Bismuth-film Electrode for the Detection of Trace Metals by Anodic Stripping<br />
Voltammetry and Their Application to the Determination of Pb and Zn in<br />
Tapwater and Human Hair. Talanta. 61: 603-610.<br />
Khodari, M., Ghandour, M. and Taha, A.M. (1997). Cathodic Stripping<br />
Voltammetric of the Anticancer Agent 5-fluorouracil and Determination in<br />
Urine. Talanta. 44: 305-310.<br />
Kim, H. J., Chang, S-C. and Shim, Y-B., (2002). α-cyclodextrin Modified Screen<br />
Printed Graphite Electrodes for Detection of Phenols. Bull, Korean Chem. Soc.<br />
23: 427-431.<br />
Kizek, R., Masarik, M., Kramer, K.J., Potesil, D., Bailey, M., Howard, J.A.,<br />
Klejdus, B., Mikelova, R., Adam, V., Trimkova, L. and Jelan, F. (2005). An<br />
Analysis of Avidin, Biotin and Their Interaction at Attomole Levels by<br />
Voltammetric and Chromatographic Techniques. Anal. Bioanal. Chem. 381:<br />
1167-1178.<br />
Koehler, P.E., Benchat, L.R. and Chhinnan, M.S. (1985). Influence of Temparature<br />
and Water Activity on Aflatoxin Production by Aspergillus flavus in Cowpea<br />
(Vigna Ungiculata) Seeds and Meal. J of Food Protection. 48: 1040-1043.<br />
Kok, W. T., Van Neer, T.C.H., Traag, W.A. and Tuinstra, L.G.M.T. (1986).<br />
Determination of Aflatoxins in Cattle Feed by Liquid Chromtography and Postcolumn<br />
Derivatization with Electrochemically Generated Bromine. J.<br />
Chromatogr. 367: 231 – 236.<br />
231<br />
Kok, W.Th. (1994). Derivatization Reactions for the Determination of Aflatoxins by<br />
Liquid Chromatography With Fluorescence Detection. J Chromatography B<br />
659: 127 – 137.
Komorsky-Lovric, S., Lovric, M. and Branica, M. (1992). Peak Current–frequency<br />
Relationship in Adsorptive Stripping Square-wave Voltammetry. J. Electroanal.<br />
Chem. 335(1-2): 297-308.<br />
Kontoyannis, C. G., Antimisianis, S.G. and Douromis, D. (1999). Simultaneous<br />
Quantitative Determination of Diazepan and Liposomes using Differential Pulse<br />
Polarography. Anal. Chim. Acta. 391: 83-88.<br />
Kotoucek, M. Skopilova, J. and Michalkova, D. (1997). Electroanalytical Study of<br />
Salozosulfapyridine and Biseptol Components at the Mercury Electrode. Anal.<br />
Chim.Acta. 353: 61-69.<br />
Kubiak, W.W., Latonen, R.M., and Ivaska, A. (2001). The Sequential Injection<br />
System With Adsorptive Stripping Voltammetry Detection. Talanta. 53: 1211-<br />
1219.<br />
Kussak, A., Anderson, B. and Anderson, K. (1995a). Determination of Aflatoxins in<br />
Airborne Dust From Feed Factories by Automated Immunoaffinity Column<br />
Clean-up and Liquid Chromatography. J Of Chromatogr. A. 708: 55-60.<br />
Kussak, A., Anderson, B. and Anderson, K. (1995b). Immunity Column Clean-up<br />
for the High Performance Liquid Chromatographic Determination of Aflatoxins<br />
B1, B2, G1, G2, M1 and Q1 in Urine. J Of Chromatogr. B. 672: 253-259<br />
Kutner, W., Wang, J., L’Her, M. and Buck, R. (1998). Analytical Aspects of<br />
Chemically Modified Electrode: Classification, CriticalEvaluation and<br />
Recommendation. (IUPAC Recommendation 1998). Pure and Appl. Chem. 70:<br />
1301-1318.<br />
Lafleur, R.D., Myland, J.C. and Oldham, K.B. (1990). Analytical Microelectrode<br />
Voltammetry with Minimal Instrumentation. Electroanalysis. 2: 223-238.<br />
232
Lafont, P. and Siriwardana, M. C. (1981). Assay Method for Aflatoxin in Milk. J of<br />
Chromatogr. 219: 162-166.<br />
Lam, G.K., Kalvoda, R. and Kaponica, M. (1983). Determination of Uranium by<br />
Adsorption Stripping Voltammetry. Anal. Chim. Acta. 154: 79-83.<br />
Lau, P.H. and Chu, F.S. (1983). Preparation and Characterisation of Acid<br />
Dehydration Product of Aflatoxicol. J. Assoc. Off. Anal Chem. 66(1): 98-101..<br />
Lee, L.S., Wall, J.H., Cotty, P.J. and Bayman, P. (1990). Interpretation of Enzymelinked<br />
Immunosorbent Assay with Conventional Chromatography Procedures<br />
for Quantitation of Aflatoxin in Individual Cotton Bolls, Seeds and Seeds<br />
Sections. J. Assoc. Anal. Chem. 73(4): 581-584.<br />
Leontopoulos, D., Siafaka, A. and Markaki, P. (2003). Black Olives as Substrate for<br />
Aspergillus parasiticus Growth and Aflatoxin B1 Production. Food<br />
Microbiology. 20: 119-126.<br />
Leszezynska, J. Kucharska, U. and Zegota, H. (2000). Aflatoxin in Nuts Assayed by<br />
Immunological Methods. Eur Food Res Technol. 210: 213-215.<br />
Levi, C. (1980). Mycotoxins in Coffee. J Assoc. Off. Anal. Chem. 63(6): 1282-<br />
1285.<br />
Lin, L., Lawrence, N.S., Thongngamdee, S., Wang, J. and Lin, Y. (2005). Catalytic<br />
Adsorptive Stripping Determination of Trace Chromium (VI) at the Bismuth<br />
Film Electrode. Talanta. 65: 144-148.<br />
Lin, L., Thongngamdee S., Wang, J., Lin, Y., Sadik, O.A. and Ly, S-Y. (2005).<br />
Adsorptive Stripping Voltammetric Measurements of Trace Uranium at the<br />
Bismuth Film Electrode. Anal. Chim. Acta. 535: 9-13.<br />
233
Lin, L., Zhang, J., Wang, P., Wang, Y. and Chen, J. (1998). Thin-layer<br />
Chromatography of Mycotoxins and Comparison with Other Chromatographic<br />
Methods. J of Chromatogr. A. 815: 3-20.<br />
Liu, J.H., Lin, W.F. and Nicol, J.D. (1980). The application of Anodic Stripping<br />
Voltammetry to Forensic Science. II. Anodic Stripping Voltammetric Analysis<br />
of Gunshot Residues. Forensic Sci Int. 16: 53-62.<br />
Liu, Y., Jiang, Y., Song, W., Lu, N., Zou, M., Xu, H. and Yu, Z. (2000).<br />
Voltammetric Determination of 5-hydroxydole-3-acetic Acid in Human Gastric<br />
Juice. Talanta. 50: 1261-1266.<br />
234<br />
Locatelli, C. (2005). Overlapping Voltammetric Peaks – an Analytical Procedure for<br />
Simultaneous Determination of Trace Metals. Application to Food and<br />
Environmental Matrices. Anal Bioanal Chem. 381: 1073-1081.<br />
Loftsson, T. and Brewster, M.E. (1996) Pharmaceutical Applications of<br />
Cyclodextrins. 1. Drug Solubilisation and Stabilisation. J. Pharm. Sci. 85: 1017-<br />
1025.<br />
Lopez, C.E, Ramos, L.L., Ramadan, S.S. and Bulacio, L.C. (2002). Presence of<br />
Aflatoxin M1 in Milk for Human Consumption in Argentina. Food Control.<br />
14(1): 31-34.<br />
Lupu, A., Compagnone, D. and Palleschi, A. (2004). Screen-printed Enzyme<br />
Electrodes for the Detection of Marker Analytes During Wine Making. Anal.<br />
Chim. Acta. 513: 67-72.<br />
Ly, S-Y, Kim,D-H. and Kim, M-H. (2002). Square-wave Cathodic Stripping<br />
Voltammetry Analysis of RDX Using Mercury-film Plated Glassy Carbon<br />
Electrode. Talanta. 58: 919-926.
235<br />
<strong>Malaysia</strong>n Food Act (1983) Act No 281, Reviewed 2002, Food Quality Control<br />
Dept, Ministry of Health, <strong>Malaysia</strong>.<br />
Mackson, J., Wright, G., Rachaputi, N.C., Krosch, S. and Tatnell, J. (1999).<br />
Aflatoxin Research Update Workshop Proceeding. Kingaroy, Queensland.<br />
August 1999.<br />
Martins, M.L. and Martin, H.M.,(2004). Aflatoxins M1 in Yoghurts in Portugal. Int.<br />
J of Food Microbiology. 91: 315-317.<br />
Manetta, A.C., Giuseppe, L.D., Giammarco, M.,Fusaro, I., Simonella, A.,<br />
Gramenzi, A. and Formigoni, A. (2005). High-performance Liquid<br />
Chromatography With Post-column Derivatisation and Fluorescence Detection<br />
for Sensitive Determination of Aflatoxin M1 in Milk and Cheese. J Chrom. A.<br />
1083: 219-222.<br />
Mendez-Albores J.A., Arambula-Villa G., Preciado-Ortiz R.E. and Moreno-<br />
Martinez E., (2004). Aflatoxins in Pozol, a Nixtamalized Maize-based Food. Int<br />
J of Food Microbiology. 94: 211-215.<br />
Metrohm (2005). Introduction to Polarography and Voltammetry Monograph,<br />
Metrohm Ltd, Switzerland.<br />
Micheli, L. Grecco, R., Moscone, D. and Palleschi, G. (2005). An Electrochemical<br />
Immunosensor for Aflatoxin M1 Determination in Milk Using Screen-printed<br />
Electrodes. Biosensors and Bioelectronic. 21(4): 588-596.<br />
Miller, N. (1987). Toxicology Aspects of Food. New York: Elsevier Science.<br />
Miller, J.C. and Miller, J.N. (1993). Statistic for Analytical Chemistry. London: Ellis<br />
Horwood.
Miller, N., Pretorius,H.E. and Trinder, D.W. (1985). Determination of Aflatoxins in<br />
Vegetable Oils. J. Assoc. Off. Anal. Chem. 68: 136-137.<br />
Mohd. Yusoff, A.R., Ahamad, R. and Azman, S. (1998). Kaedah Voltammetri<br />
Dalam Penentuan Pewarna reaktif dan Hasil Hidrolisisnya. Malays. J. Anal. Sci.<br />
4(1): 139-146.<br />
Molina, M. and Gianuzzi, L. (2002). Modelling of Aflatoxin Production by<br />
Aspergillus parasticus in a Solid Medium at Different Temperature, pH and<br />
Propionic Acid Concentration. Food Res. Int. 35: 585-594.<br />
Moressi, M.B., Andreu, R., Calvente, J.J, Fernandez, H. and Zon, M. A. (2004).<br />
Improvement of Alterneriol Monomethyl Ether Detection at Gold Electrode<br />
Modified With a Dedocanethiol Self-assembled Monolayer. J. of<br />
Electroanalytical Chem. 570: 209-217.<br />
236<br />
Morfobos, M., Economou, A. and Voulgaropoulos, A. (2004). Simultaneous<br />
Determination of Nickel(II) and cobalt(II) by Square Wave Adsorptive Stripping<br />
Voltammetry on a Rotating-disc Bismuth-film Electrode. Anal Chim Acta. 519:<br />
57-64.<br />
Mouley, Y. (1984). Biochemical Effects of Mycotoxin. In Betina, V (Ed.).<br />
Mycotoxin – Producton, Isolation, Separation and Purification. Netherland:<br />
Elsevier Science.<br />
Nawaz, S., Coker, R.D and Haswell, S.J. (1992). Development and Evaluation of<br />
Analytical Methodology for Determination of Aflatoxins in Palm Kernel.<br />
Analyst. 117: 67 – 71.
Navalion, A., Blanc, R., Reyes, L., Navas, N. and Vikches, J.K. (2002).<br />
Determination of the Antibacterial Enrofloxacin by Differential Pulse<br />
Adsorptive Stripping Voltammetry. Anal. Chim. Acta. 454: 83-91.<br />
Neal, G.E. (1987). Influence of Metabolism: AflatoxinMetabolism and its Possible<br />
Relationships With Disease. In: Watson D.H. Natural Toxicants in Foods:<br />
Progress and prospects. London: VCH.<br />
Niedwetzki, G. Lach, G. and Ceschwill, K. (1994). Determination of Aflatoxin in<br />
Food by Use of an Automatic Work Statio. .J.Of Chromatography A. 661: 175-<br />
180.<br />
Nilufer, D. and Boyacio, D. (2002). Comparative Study of Three Different Methods<br />
for the Determination of Aflatoxins in Tahini. J. Agric. Food. Chem. 50: 3375-<br />
3379.<br />
Nouws, H.P.A., Delerue-Matos, C., Barros, A.A. and Rodrigues, J.A., (2005a).<br />
Electroanalytical Study of the Antidepressant Sertraline. J. Pharm. Biomed.<br />
Anal. 39(1-2): 290-293.<br />
Nouws, H.P.A., Delerue-Matos, C., Barros, A.A., Rodrigues, J.A. and Silva, A.S.<br />
(2005b). Electroanalytical Study of Fluvoxamine. Anal and Bioanal. Chem.<br />
382(7): 1662-1668.<br />
Official Methods of Analysis 14 th Ed. (1984) AOAC, Washington D.C.<br />
Ohfuji, K., Sato, N., Hamadansoto, N., Kabayashi, T., Imada, N., Okura, H. and<br />
Watanabe, E., (2004). Construction of a Glucose Based on a Screen-printed<br />
Electrode and a Novel Mediator Pyocyanin From Pseudomonos Aeruginosa.<br />
Biosensors and Bioelectronic. 19: 1237-1244.<br />
237
Orinakova, R., Tankova, L., Galova, M. and Supicova, A. (2004). Application of<br />
Elimination Voltammetry in the Study of Electroplating Processes on the<br />
Graphite Electrode. Electrochimica Acta. 49: 3587-3594.<br />
Ortiz, M.Z., Arcos, J., Juarros, J.V., Lopez-Palacios, J. and Sarabia, L.A. (1993).<br />
Robust Procedure for Calibration and Calculation of the Detection Limit of<br />
Trimipramine by Adsorptive Stripping Voltammetry at a Carbon Paste<br />
Electrode. Anal. Chem. 65: 678-682.<br />
Ozkan, S.A. and Uslu, B. (2002). Electrochemical Study of Fluvastatin Sodium –<br />
Analytical Application to Pharmaceutical Dosage Forms, Human Serum and<br />
Simulated Gastric Juice. Anal. Bioanal.Chem. 372: 582-586.<br />
Ozkan, S.A., Uslu, B., Aboul-Enein, H.Y. (2003). Voltammetric Investigation of<br />
Tamsulosin. Talanta. 61: 147-156.<br />
238<br />
Pacheco, W.F., Farias, P.A.M. and Aucelio, R.Q. (2005). Square-wave Adsorptive<br />
Stripping Voltammetry for the Determination of Cyclofenil After Photochemical<br />
Derivatisation. Anal. Chim. Acta. 549(1-2): 67-73.<br />
Padano, M. L. and Rivas, G. A., (2000). Amperometric Biosensor for the<br />
Quantification of Gentisic Acid using Poliphenol Oxidase Modified Carbon<br />
Paste Electrode. Talanta. 53: 489-495.<br />
Papp E., Otta K.H., Zaray G. and Mincsvics (2002). Liquid Chromatographic<br />
Determination of Aflatoxins. Microchemical J . 73(1-2): 39-46.<br />
Pare, J.R.J and Belanger, J.M.R. (1997). Instrumental Methods in Food Analysis.<br />
N.York : Elsevier.
Parham, H and Zargar, B. (2001). Determination of Isosorbic Dinitrate in Arterial<br />
Plasma, Synthetic Serum and Pharmaceutical Formulations by Linear Sweep<br />
Voltammetry on a Gold Electrode. Talanta. 55: 255-262.<br />
239<br />
Park, K.Y. and Bullerman. L.B. (1983). Effects of Cycling Temperature on<br />
Aflatoxins Production by Aspergillus parasiticus and Aspergillus flavous in Rice<br />
and Cheese. J of Food Science. 48: 889-896.<br />
Park, D.L. and Rua, S.M. (1991). Sample Collection and Preparation Techniques<br />
for Aflatoxin Determination in Whole Cottonseed. J Assoc. Off. Anal. Chem. 74:<br />
73-75.<br />
Parlim, A. and Zerger, S. (2003). Determination of Isosorbide Synthetic Serum and<br />
Pharmaceutical Formulation by Linear Sweep Voltammetry on a Gold<br />
Electrode. Talanta. 55: 255-262.<br />
Patey A.L., Sharman M. and Gilbert J (1990). Determination of Aflatoxin B1 Levels<br />
in Peanut Butter Using an Immunoaffinity Column Cleanup Procedure:<br />
Interlaboratory Study. Food Addit. Contam. 7; 515-520.<br />
Patey, A.L., Sharman, M. and Gilbert, J. (1991). Liquid Chromatographic<br />
Determination of Aflatoxin Levels in Peanut Butters Using an Immunoaffinity<br />
Column Clean up Method: International Collaborative Trial. J. Assoc. Off. Anal.<br />
Chem. 74: 76-81.<br />
Pavlova V., Mirceski V., Lovric S.K, Javanovic S.P. and Mitrevski B. (2004).<br />
Studying Electrode Mechanism and Analytical Determination of Cocaine and its<br />
Metabolites at the Mercury Electrode Using Square-wave Voltammetry. Anal<br />
Chim.Acta. 512: 49-56.
Pena, R. Alcaraz, M.C., Arce, L., Rios, A. and Valcarcel, M. (2002). Screening of<br />
Aflatoxins in Feed Samples Using a Flow System Coupled to Capillary<br />
Electrophoresis. J Of Chromatography A. 967: 303-314.<br />
Perez-Ruiz, T., Martinez-Lozano, C., Sanz, A. and Guillen, A. (2004). Successive<br />
Determination of Thiamine and Ascorbic Acid in Pharmaceuticals by Flow<br />
Injection Analysis. J.Pharm. Biomed. Anal. 34: 551-557.<br />
Pesavento, M., Domagala, S., Baldini, E. and Cucca, L. (1997). Characterisation of<br />
Enzyme Linked Immunosorbent Assay for Aflatoxin B1 Based on Commercial<br />
Reagents. Talanta. 45: 91-104.<br />
Pestka, J. and Bundy, G. (1990). Alteration of Immune Function Following Dietary<br />
Mycotoxin Exposures. Canadian J. of Physilogy and Pharmacology. 68: 1009-<br />
1016.<br />
Pezzatini, G., Midili, I., Toti, G., Loglio, F. and Innoceti, M. (2004). Determination<br />
of Chlorite in Drinking Water by Differential Pulse Voltammetry on Graphite.<br />
Anal. Bioanal.Chem. 380: 650 - 657.<br />
Pildain, M.B., Vaamonde, G. and Cabral, D. (2004). Analysis of Population<br />
Structure of Aspergillus flavus From Peanut Based Vegetative Compatibility,<br />
Geographic Origin, Mycotoxin and Sclerotia Production. Int. J. Food Microb.<br />
93: 31- 40.<br />
Plattner, R.D., Bennett, G.A. and Stubblefield, R.D. (1984). Identification of<br />
Aflatoxins by Quadrupole Mass Spectrometry/Mass Spectrometry. J. Assoc.<br />
Anal. Chem. 67(4): 734 -738.<br />
240
Pons, W.A. Jr. and Franz, A.O. Jr. (1977). High Performance Liquid<br />
Chromatography of Aflatoxins in Cottonseed Products. J Assoc off Anal Chem.<br />
60: 89 - 95.<br />
241<br />
Pournaghi-Azar, M.H. and Dastango, H. (2002). Differential Pulse Anodic Stripping<br />
Voltammetry of Copper in Dichloromethane: Application to the Analysis of<br />
Human Hair. Anal. Chim. Acta. 405:135 - 144.<br />
Rachaputi, N.C., Wright, G.C., Krosch, S. and Tatnell,J. (2001). Management<br />
Practice to Reduce Aflatoxin Contamination in Peanut. Proceedings of the 10 th<br />
Australian Agronomy Conference, Hobart. 2001.<br />
Radi, A. (2003). Square-wave Adsorptive Cathodic Stripping Voltammetry of<br />
Pantoprazole. J of Pharmaceutical and biomedical analysis. 33: 687 – 692.<br />
Radi, A. and El-Sherif, Z. (2002). Determination of Levofloxacin in Human Urine<br />
by Adsorptive Square-wave Anodic Stripping Voltammetry on a Glassy Carbon<br />
Electrode. Talanta. 58: 319 - 324.<br />
Radi, A., Beltagi, A.M. and Ghoniem, M.M. (2001). Determination of Ketorolac in<br />
Human Serum by Square-wave Adsorption Stripping Voltammetry. Talanta. 54:<br />
283 - 289.<br />
Rasooli, I. and Abnayeh, M.R.(2004). Inhibitory Effect of Thyme Oils on Growth<br />
and Aflatoxin Production by Aspergillus parasiticus. Food Control. 15: 479 -<br />
483.<br />
Rastogi, S., Das, M. and Khanna, S.K. (2001). Quantitative Determination of<br />
Aflatoxin B1-oxime by Column Liquid Chromatography With Utraviolet<br />
Detection. J Of Chromatography A. 933: 91 - 97.
Rastogi, S., Dwivedi, P.D., Khanna, S.K. and Das, M. (2004). Detection of<br />
Aflatoxin M1 Contamination in Milk and Infant milk Products From Indian<br />
Market by ELISA. Food Control. 15: 287 - 290.<br />
Reif, K. and Metzger, W. (1995). Determination of Aflatoxins in Medicinal Herbs<br />
and Plant Extracts. J Of Chromatography A. 692: 131 - 136.<br />
Reinke, R. and Simon, J. (2002). The Online Removal of Dissolved Oxygen From<br />
Aqueous Solutions Used in Voltammetric Technique by Chromatomembrane<br />
Method. Anal. Bioanal. Chem. 374: 1256 - 1260.<br />
Riley, T. and Tomlinson, C. (1984). Principles of Electroanalytical Methods<br />
(Analytical Chemistry by Open Learning). London: John Wiley.<br />
Risk assesment studies report No. 5 (1991). Chemical Hazrad – Evaluation<br />
Aflatoxin in Food. Food and Environmental Hygeine Department, Hong Kong.<br />
Rizk, M., Belal, F., Aly, F.A. and El-Enany, N.M. (1998). Differential Pulse<br />
Polarographic Determination of Ofloxacin Pharmaceuticals and Biological<br />
Fluids. Talanta. 46: 83 - 89.<br />
Rizzo I., Vedoya G., Maurutto S., Haidukowski M. and Varsavsky E., (2004).<br />
Assessment of Toxigenic Fungi on Argentinean Medicinal herbs.<br />
Microbiological Research. 159: 113 - 120.<br />
Rodriguez, J., Berzas, J.J., Castanada, G. and Rodrigues, N., (2005). Voltammetric<br />
Determination of Imanitib (Gleevec) and its Main Metabolite Using Square-<br />
wave and Adsorptive Stripping Square-wave Technique in Urine Samples.<br />
Talanta. 66: 202 - 209.<br />
242
Rodriguez, J., Berzas, J.J., Castanada, G. and Rodrigues, R. (2004). Determination<br />
of Seldenafil Citrate (Viagra) and its Metabolite (UK-103,320) by Square-wave<br />
and Adsorption Stripping Square-wave Voltammetry. Total Determination in<br />
Biological samples. Talanta. 62: 427 - 432.<br />
Sabry, S.M. and Wahbi, A.A.M. (1999). Application of Orthogonal Functions to<br />
Differential Pulse Voltammetric Analysis: Simultanuoes Determination of tin<br />
and Lead on Soft Drinks. Anal. Chim. Acta, 401: 173 - 183.<br />
Safavi, A., Maleki, N. and Shahbaazi, H.R.(2004). Indirect Determination of<br />
Cyanide Ion and Hydrogen Cyanide by Adsorptive Stripping Voltammetry at a<br />
Mercury Electrode. Anal.Chim.Acta. 503: 213 - 221.<br />
Salavagione. H.J., Arias. J., Garces. P., Marallon. E., Barbero. C. and Vazguez. J.L,<br />
(2004). Spectroelectrochemical Study of the Oxidation of Aminophenols on<br />
Platinum Electrode in Acid Medium. J. Of Electroanalytical Chem. 565: 375 -<br />
383.<br />
Saleemullah, Iqbal, A., Khalil, I.A. and Shah H. (2005). Aflatoxin Contents of<br />
Stored andArtificially Inoculated Cereals and Nuts. Food Chemistry. Article in<br />
press.<br />
Salleh, B. (1998). Mikotoksin- Implikasi Terhadap Kesihatan Manusia dan Haiwan.<br />
Pulau Pinang: <strong>Universiti</strong> Sains <strong>Malaysia</strong>.<br />
Samajpathi, N. (1979) .Aflatoxin Produced by Five Species of Aspergillus on Rice.<br />
Naturwissenschaften. 66: 365 - 366.<br />
Sandulescu, R., Mirel, S. and Oprean, R. (2000). The Development of<br />
Spectrophotometric and Electroanalytical Methods for Ascorbic Acid and<br />
243
Acetaminophen and Their Application in the Analysis of Effervescent Dosage<br />
Form. J. Pharm. Biomed. Anal. 23: 77 - 87.<br />
Sanna, G., Pilo, M.I., Pin, P.C. Tapparo, A. and Seeber, R. (2000). Determination of<br />
Heavy Metals in Honey by Anodic Stripping Voltammetry at Microelectrode.<br />
Anal. Chim. Acta. 415: 165 - 173.<br />
Santos, M.C. and Machado, S.A.S. (2004). Microgravimetric, Rotating Ring-disc<br />
and Voltammetric Studies of the Underpotential Deposition of Selenium on<br />
Polycrystalline Platinum Electrode. J. of Electroanalytical Chem. 567: 203 -<br />
210.<br />
244<br />
Sarimehmetoglu, B., Kuplulu, O. and Celik, T.H. (2004). Detection of Aflatoxin M1<br />
in CheeseSamples by ELISA. Food Control. 15: 45 - 49.<br />
Sassahara, M., Netto, D.P. and Yanaka, E.K. (2005). Aflatoxin Occurence in<br />
Foodstuff Supplied to Dairy Cattle and Aflatoxin M1 in Raw Milk in the North<br />
of Parana State. Food and Chemical Technology. 43: 981 - 984.<br />
Scholten, J.M and Spanjer, M.C. (1996). Determination of Aflatoxin B1 in<br />
Pastachio Kernels and Shells. J. Assoc. Off. Anal. Chem. 79: 1360 - 1364.<br />
Scott, P.M. and Lawrence, G.A. (1997). Determination of Aflatoxins in Beer. J.<br />
Assoc. Off. Anal. Chem. 80: 1229 - 1233.<br />
Setamou, M.K., Gardwell, F., Schulthess, S. and Hell, K. (1997). Aspergillus flavus<br />
Infection and Aflatoxin Contaminants of Preharvest Maize in Benin. Plant<br />
Disease. 81: 1327 - 1327.<br />
Shahrokhian, S. and Karimi, M. (2004). Voltammetric Studies of a cobalt(II)-4-<br />
Methylsalophen Modified Carbon-paste Electrode and its Application for the
Simultaneous Determination of Cysteine and Ascorbic Acid. Electrochim. Acta.<br />
50: 77 - 84.<br />
Shams, E., Barbei, A. and Soltaninezhad,M. (2004). Simultaneous Determination of<br />
Copper, Zinc and Lead by Adsorptive Stripping Voltammetry in the Presence of<br />
Morin. Anal. Chim. Acta. 501: 119 - 124.<br />
245<br />
Shannon, G.M., Shotwell, O.L and Kwole, W.F. (1983). Extraction and Thin Layer<br />
Chromatography of Aflatoxin B1 in Mixed Feeds. J. Assoc. Off. Anal. Chem. 66:<br />
582 - 586<br />
Shenasi, M., Aidoo, K.E. and Candlish, A.A.G. (2002). Microflora of Date Fruits<br />
and Production of Aflatoxins at Various Stages of Maturation. Int.J Food<br />
Microbiology. 79(1-2): 113 - 119.<br />
Shi K. and Shiu K.K. (2004). Adsorption of Some Quinone Derivatives at<br />
Chemically Activated Glassy Carbon Electrode. J. of Electroanalytical Chem.<br />
574(1): 63 - 70.<br />
Shotwell, O.L and Goulden, M.L (1977). Aflatoxins: Comparison of Analysis of<br />
Corn by Various Methods. J. Assoc. Off. Anal. Chem. 60: 83 - 88.<br />
Shotwell, O.L, Goulden, M.L., Benntt, G.A., Plattner, R.D. and Hesseltine, C.W<br />
(1977). Survey of 1975 Wheat and Soybeans for Aflatoxins, Zeralenone and<br />
Ochratonin, J. Assoc. Off. Anal. Chem. 60: 778 - 783.<br />
Shotwell, O.L., Hesseltin,e C. and Stubblefield, R.D. (1966). Production of aflatoxin<br />
on rice. Appl. Microbiol. 14: 425 - 428.
Simon, P., Delsaut, P., Lafontaine, M. Morele, Y. and Nicol, T. (1998). Automated<br />
Column-switching High-performance liquid chromatography for the<br />
determination of aflatoxin M1. J of Chromatogr. B. (1998). 712: 95 - 104.<br />
Skoog, D.A., West, D.M. and James, F. (1996) Fundamentals of Analytical<br />
Chemistry. 7 th Ed. New York; Saunders College Publishing,<br />
Skrzypek S., Ciesielski W., Sokolowski A., Yilmaz S. and Kazmierczak A. (2005).<br />
Square Wave Adsorptive Stripping Voltammetric Determination of Famotidine<br />
in Urine. Talanta. 66:1146 - 1151.<br />
Smith, J.E. and Moss M.O. (1985). Mycotoxins – Formation, Analysis and<br />
Significance. Chichester: John Wiley.<br />
Smyth, M. R., Lawellin, D. W. and Osteryoung, J.G (1979) Polarographic Study of<br />
Aflatoxin B1, B2, G1 and G2: Application of Differential-pulse polarography to<br />
the determination of Aflatoxin B1 in Various Foodstuff. Analyst. 104: 73 - 78.<br />
Smyth, M.R. and Vos, J.G., (1992). In Shevla, G. (Ed). Analytical Voltammetry in<br />
Comprehensive Analytical Chemistry. Amsterdam: Elsevier Science.<br />
246<br />
Smyth, M.R. and Smyth, W.F. (1978). Voltammetric Methods for the Determination<br />
of Foreign Organic Compounds of Biological Significance. A review. Analyst.<br />
103(1227): 103 - 122.<br />
Sonthalia, P., McGaw, E., Show, Y. and Swain, G.M. (2004). Metal Ion Analysis in<br />
Contaminated Water Samples Using Anodic Stripping Voltammetry and a<br />
Nanocrystalline Diamond Thin-film Electrode. Anal Chim Acta. 522: 35 - 44.
Sorensen, L.K. and Elbaek, T. (2005). Determination of Mycotoxins Bovine Milk<br />
by Liquid Chromatography Tandem Mass Spectrometry. J Chrom. B. 820:183-<br />
196.<br />
Stack, M. E. and Pohland, A.E. (1975). Collabration Study of a Method for<br />
Chemical Confirmation of the Identify of Aflatoxin. J. Assoc.Off. Anal.Chem.<br />
58: 110 - 113.<br />
Stroka, J. and Anklem, E (2002). New Strategies for the Screening and<br />
Determination of Aflatoxins and Detection of Aflatoxin-producing Moulds in<br />
Food and Feed. Trend In Anal. Chem. 21: 90 - 95.<br />
Stroka, J., Elke, A., Urban, J., John, G., Anna, B., Carlo, B., Per-Erik, C., Fiona, G.,<br />
John, G., and Loius, S. (2000). Immunoaffinity Column Cleanup With Liquid<br />
Chromatograhpy Using Post-column Bromination for Determination of<br />
Aflatoxins in Peanut Butter, Pistachio Paste, Fig Paste and Paprika Powder.<br />
Collaborative Study. J. of AOAC International. 83: 320 - 340.<br />
Stubblefield, R.D and Showell, O.L (1977). Reverse Phase Analytical and<br />
Preparative High Performance Liquid Chromatography of Aflatoxins. J. Assoc.<br />
Off. Anal. Chem. 60: 784 - 790.<br />
Stubblefield, R.D., Kwolek, W.F. and Stoloff, L (1982). Determination and Thin<br />
Layer Chromatographic Confirmation of Identity of AFB1 and AFM1 in<br />
Artificially Contaminated Beef Livers: Collaborative Study. J. Assoc. Off. Anal.<br />
Chem. 65: 1435 - 14.<br />
Sturm, J.C., Canelo, H., Nunez-Vergara, L.J. and Squella, J.A. (1997).<br />
Voltammetric Study of Ketorolac and its Differential Pulse Polarographic<br />
Determination in Pharmaceuticals. Talanta. 44: 931 - 937.<br />
247
Sun, N., Mo, W-M. Shen, Z-L and Hu, B-X. (2005). Adsorptive Stripping<br />
Voltammetric Technique for the Rapid Determination of Tobramycin on the<br />
Hanging Mercury Electrode. J. Pharm. Biomed. Anal. 38(2): 256 - 262.<br />
Sun, W. and Jiao, K. (2002). Linear Sweep Voltammetric Determination of Protein<br />
Based on its Interaction With Alizarin Red S. Talant. 56: 1073 - 1080.<br />
Taguchi, S., Fukushima, S., Summoto, T., Yoshida, S. and Nishimune, T. (1995).<br />
Aflatoxins in Foods Collected in Osaka, Japan. J AOAC Int. 78: 325 – 327.<br />
Takahashi, D.M. (1977a). Reverse Phase High Pressure Liquid Chromatographic<br />
Analytical System for Aflatoxins in Wine With Fluorescence Detection. J<br />
Chromatograph. 131: 147 - 156.<br />
Takahashi, D.M. (1977b). Reverse Phase High Pressure Liquid Chromatographic<br />
Analytical System for Aflatoxins in Wine and Fruit Juices. J. Assoc. Off. Anal.<br />
Chem. 60: 799 – 804.<br />
Tarin, A, Russell, M.G. and Guardino, X. (2004). Use of High Performance Liquid<br />
Chromatography in Assess Airborne Mycotoxins. J of Chromatogr. A. 1047(2):<br />
235 - 240.<br />
Thompson, M. (1998). Do We Really Need Detection Limit?. Analyst. 123: 405 -<br />
407.<br />
Torriero, A.A.J., Luco, J.M., Sereno, L. and Raba, J. (2004). Voltammetric<br />
Determination of Salicylic Acid in Pharmaceuticals Formulations of<br />
Acetylsalicylic Acid. Talanta. 62: 247- 254.<br />
248
Tozzi, C., Anfossi, L. Baggiani, C., Giavanalli, C. and Girandi, G. (2003). A<br />
Combinatorial Approach to Obtain Affinity Media With Binding Properties<br />
Towards the Aflatoxins. Anal. Bioanal. Chem. 375: 994 - 999.<br />
Trucksess, M. W. and Stollof, L. (1980). Thin Layer Chromatographic<br />
Determination of Alatoxins in Dry Ginger Root and Ginger Oleoresin. J. Assoc.<br />
Off. Anal. Chem.63: 1052 - 1054.<br />
Trucksess, M. W., Stack, M. E., Nesheim, S., Page, S.W. , Albert, R.H., Hansen,<br />
T.J. and Donahue, K.F. (1991). Immunoaffinity Column Coupled with Solution<br />
Fluometry or Liquid Chromatography Postcolumn Derivatization for<br />
Determination of Aflatoxins in Corn, Peanuts and Peanut butter: Collaborative<br />
Study. J. Assoc. Off. Anal. Chem. 74: 81 - 88.<br />
249<br />
Trucksess, M. W., Stollof, L., Pons, W.A., Cucullu, A.F. Lee, L.S. and Franz, A.O.<br />
(1977). Thin Layer Chromatography of AFB1 in Egg. J. Assoc. Off. Anal. Chem.<br />
60: 795 - 798.<br />
Tuinstra L.G.M. and Hassnott, W. (1983). Rapid Determination of Aflatoxin B1 in<br />
Dutch Feedingstuffs by High Performance Liquid Chromatography and Postcolumn<br />
Derivatisation. J of Chromatogr. 282: 457 - 462.<br />
Tuinstra, L.G.M., Kienhuis, P.G.M. and Dols, P. (1990). Automated Liquid<br />
Chromatographic Determination of Aflatoxin M1 in Milk Using on-line Dialysis<br />
for Sample Preparation. J. Assoc. Off. Anal. Chem. 73: 969 - 973.<br />
Turner, P.C., Sylla, A., Gong, Y.Y., Diallo, M.S., Surcliffer, A.E., Hall, A. J. and<br />
Wild, C.P. (2005). Reduction in Exposure to Carcinogenic Aflatoxins by<br />
Postharvest Intervention Measures in West Africa: Community Based<br />
Intervention Study. Lancet. 365: 1950 - 1956.
Tutour, L.B., Elaraki, A. T. and Aboussalim, A.(1984). Simultaneous Thin Layer<br />
Chromatographic Determination of Aflatoxin B1 and Ochratoxin A in Black<br />
Olives, J Assoc Off Anal Chem. 67: 611 - 620.<br />
Urano, T., Trucksess ,M.W. and Page, S.W., (1993). Automated Affinity Liquid<br />
Chromatography Sstem for On-line Isolation, Separation and Quantitation of<br />
Aflatoxins in Methanol-water Extracts of Corn or Peanuts. J.Agric. Food Chem.<br />
41: 1982 - 1985.<br />
Vahl, M. and Jorgensen, F. (1998). Determination of Aflatoxins in Food Using<br />
LC/MS/MS. Z Lebensm Unters Forsch A.. 206: 243 - 245.<br />
Van Egmond, H.P. (1989). Introduction of Mycotoxins in Dairy Products. London:<br />
Elsevier Applied Science.<br />
Verma, K.K., Jain, A., Verma, a. and Chaurasia, A. (1991). Spectrophotometric<br />
Determination of Ascorbic Acid in Pharmaceuticals by Background Correction<br />
and Flow Injection. Analyst. 116: 641 - 645.<br />
250<br />
Versantroort, C.H.M., Oomen, A.G., and Sips, A.J.A.M. (2005). Applicability of an<br />
in Vitro Digestion Model in Assessing the Bioaccessibility of Mycotoxins From<br />
Food. Food and Chemical Toxicology. 43: 31- 40.<br />
Volke, J. and Liska, F. (1994). Electrochemistry in Organic Synthesis. New York:<br />
Springer-Verlag.<br />
Volkov, A.G. and Mwesigwa, S. (2001). Electrochemistry of Soyabean: Effect of<br />
Uncouplers, Pollutant and Pesticides. J. Of Electroanalytical Chemistry. 496:<br />
153 - 157.
Wang, H. S., Huang, D. H. and Liu, R.M. (2004). Study on the Electrochemical<br />
Behavior of Epinephrine at a Poly(3-methylthiophene) Modified Glassy Carbon<br />
Electrode. J. of Electroanalytical Chem. 570: 83 - 90.<br />
Wang, J. (1985): Stripping analysis: Principles, Instrumentation and Application.<br />
USA: VCH Publishers.<br />
Wang, J., Cai, X., Fernandes, J. R., Ozsoz, M. and Grant, D. H., (1997). Adsorptive<br />
Potentiometric Stripping Analysis of Trace Tomoxifen at a Glassy Carbon<br />
Electrode, Talanta. 45: 273 - 278.<br />
Wang, J. (1988). Electroanalytical Technique in Clinical Chemistry and Laboratory<br />
Medicine. USA: VCH publisher.<br />
Wang, J. (2000). Analytical Electrochemistry. USA: WILEY-VCH.<br />
Weast, R.C and Astle, M.J. (1981). Handbook of Chemistry and Physics. 61 th Ed.<br />
Flourida: CRC Press.<br />
Wasiak, W, Cissewska, W. and Ciszewski, A. (1996). Hair Analysis Part I:<br />
Differentrial Pulse Anodic Stripping Voltammetry Determination of Lead,<br />
Cadmium, Zinc and Copper in Human Hair Samples of Persons in Permanent<br />
Contact With a Polluted Workplace Environment. Anal. Chim. Acta. 335: 201 -<br />
207.<br />
Weast, R.C and Astle, M.J. (1987). CRC Handbook of Data On Organic<br />
Compounds, Vol II. Flourida: CRC Press.<br />
Wei, R.D., Chang, S.Ch. and Lee, S.S. (1980). High Pressure Liquid<br />
Chromatography Determination of Aflatoxins in Soy Sauces anf Fermented<br />
Soybean Paste. J. Assoc. Off. Anal. Chem. 63:1269- 1274.<br />
251
White, C.E. and Argauer, R.J. (1970). Fluorescence Analysis- A Practical<br />
Approach. New York: Marcell Dekker.<br />
Wilson, T.J. and Romer, T.R (1991). Use of the Mycosep Multifunctional Clean-up<br />
Column for Liquid Chromatography Determination of Aflatoxins in Agriculture<br />
Products. J. Assoc. Off. Anal. Chem.74 : 951 - 956.<br />
Wogan, G.N., Hecht, S. S., Felton, J. S., Conney, A.H. and Loeb, L.A. (2004).<br />
Environmental and Chemical Carcinogenesis. Seminars In Cancer Biology. 14:<br />
473 - 486.<br />
Woolever, C.A. and Dewald,H.D. (2001). Differential Pulse Anodic Stripping<br />
Voltammetry of Barium and Lead in Gunshot Residues. Forensic Sci Int. 117:<br />
185-190.<br />
World Health Organisation (1987) in: IARC Monograph on the Evaluation of<br />
Carcinogenic Risk to Human, WHO, Lyon, pp 82 Supl. I.<br />
Wring S. A., Hart J.P. and Birck B.J. (1991). Voltammetric Behaviour of Screen-<br />
printed Carbon Electrode, Chemically Modified With Selected Mediatiors and<br />
Their Applications as Sensor for Detection of Reduced Gluthathione. Analyst.<br />
116 : 123-129.<br />
www.ansci.cornell.edu/toxicagents/aflatoxin. Quoted date - 30 th . July 2002.<br />
www.ccohs.ca/oshanswers/chemicals. Quoted date – 5 th February 2006<br />
www.copdockmill.co.uk/aflatoxin Quoted date – 26 th August 2001<br />
Ximenes, M.I.N., Rath, S. and Reyes, F.G.R. (2000). Polarographic Determination<br />
of Nitrate in Vegetable. Talanta. 51: 49 - 56.<br />
252
Xiulan S., Xiaolian, Z., Jian, T., Xiaohong, G., jun, Z. and Chu, F.S. (2006).<br />
Development of an Immunochromatographic Assay for Detection of Aflatoxin<br />
B1 in Foods. Food Control. 17: 256 - 262.<br />
Yardimer, C. and Ozaltin, N. (2001). Electrochemical Studies and Differential Pulse<br />
Polarographic Analysis of Lansoprazole in Pharmaceuticals. Analyst. 126: 361-<br />
366.<br />
Yardimer, C. and Ozaltin, N. (2004). Electrochemical Studies and Square-wave<br />
Voltammetric Determination of Fenofibrate in Pharmacetical Formulations.<br />
Anal. Bioanal. Chem. 378: 495 - 498.<br />
Yaacob, M.H. (1993). Polarographic Determination of Sn(II) in<br />
Radiopharmaceutical Samples. University of Manchester, Institute of Science<br />
and Technology (UMIST), United Kingdom. MSc Thesis.<br />
Yilmaz, S., Uslu, B. and Ozkan, S.A. (2001). Anodic Oxidation of Etodolac and its<br />
Square Wave and Differential Pulse Voltammetric Determination in<br />
Pharmaceuticals and Human Serum. Talanta. 54: 351 - 360.<br />
Youmens, H.L. (1973). Statistics for Chemistry. USA: Bells and Howell Publishers.<br />
Yousef, A.E and Marth, E.H. (1985). Rapid Reverse Phase Liquid Chromatography<br />
Determination of AFM1 in Milk. J. Assoc. Off. Anal. Chem. 68: 462 - 465.<br />
Zahir, M.H. and Abd. Ghani, S. (1997). Fabrication of Directly Polymerized 4vinylpyridine<br />
onto a Pencil 2B Graphite Paste Electrode for Glucose<br />
Monitoring, Anal Chim Acta, 354: 351 - 358.<br />
253
Zayed, S.I.M. and Habib, I.H.I. (2005). Adsorptive Stripping Voltammetric<br />
Determination of Triprolidine Hydrochloride in Pharmaceutical Tablets. I1<br />
Farmaco. 60(6-7): 621 - 625.<br />
254<br />
Zhang, Z.Q., Zhang, H. and H,e G. F. (2002). Preconcentration with Membrane Cell<br />
and Adsorptive Polarographic Determination of Formaldehyde in Air. Talanta.<br />
57: 317 - 322.<br />
Zhang, Z.Q, Li, Y.F., He, X.M. and Zhang, H. (1996). Electroanalytical<br />
Characteristics of Enoxican and Their Analytical Application. Talanta.43: 635 -<br />
641.<br />
Zhao, C., Pan, Y., Su, Y., Zhang, Z., Guo, Z. and Sun, L. (2003). Determination of<br />
EDTA Species in Water by Square-wave Voltammetry using a Chitosan-coated<br />
Glassy Carbon Electrode. Water Research. 37: 4270 - 4274.<br />
Zima, J., Barek, J., Moriera, J.C., Mejstrik, V. and Fogg, A.G. (2001).<br />
Electrochemical Determination of Trace Amounts of Environmentally Important<br />
Dyes. Fresenius. J. Anal. Chem. 369: 567 - 570.<br />
Zimmermann, S., Menzel A., Bernaz Z., Eckhardt J-D., Stubens D., Alt F.,<br />
Messerschmidt H., Taraschewski H. and Sures B.(2001). Trace Analysis of<br />
Platinum in Biological Samples: A Comparison Between Sector field ICP-MS<br />
and Adsorptive Cathodic Stripping Voltammetry Following Different Digestion<br />
Procedures. Anal. Chim. Acta. 439: 203 - 209.
APPENDIX A<br />
Relative fluorescence of aflatoxins in different solvents<br />
Aflatoxin<br />
B1<br />
B2<br />
G1<br />
G2<br />
Methanol<br />
0.6 (430 nm)<br />
5.3 (430 nm)<br />
1.0 (450 nm)<br />
8.7 (450 nm)<br />
Ethanol<br />
1.0 (430 nm)<br />
2.7 (430 nm)<br />
1.4 (450 nm)<br />
4.7 (450 nm)<br />
Chloroform<br />
0.20 (413 nm)<br />
0.25 (413 nm)<br />
6.2 (430 nm)<br />
6.8 (430 nm)<br />
255
APPENDIX B<br />
256
APPENDIX C<br />
257
APPENDIX D<br />
Calculation of concentration of aflatoxin stock solution<br />
Formula used for calculation of concentration of aflatoxin stock solution by UV-<br />
VIS spectrometric technique<br />
[Aflatoxin] / µg/ml = Abs x MW x 1000<br />
ε<br />
Where<br />
Abs = absorbance value<br />
MW = molecular weight<br />
ε = molar absorbtivity (cm -1 M -1 )<br />
Parameters used in this calculation;<br />
Aflatoxin<br />
AFB1<br />
AFB2<br />
AFG1<br />
AFG2<br />
Example: AFB1<br />
MW<br />
312<br />
314<br />
328<br />
330<br />
Solvent<br />
Benzene:acetonitrile<br />
(98:2)<br />
Abs = 0.640 MW = 312 ε = 19,800<br />
ε<br />
19,800<br />
20,900<br />
17,100<br />
18,200<br />
Λ (nm)<br />
[AFB1] = 0.640 x 312 x 1000 = 10.08 µg / ml = 10.08 ppm<br />
19,800<br />
353<br />
355<br />
355<br />
357<br />
258
APPENDIX E<br />
Extraction procedure for aflatoxins in real samples<br />
Extraction procedure for aflatoxins in real samples: Chemistry Dept. Penang<br />
Branch, Ministry of Science, Technology and Innovation;<br />
259<br />
1. Groundnut with shell: remove shell of entire sample. Coarse grind.<br />
Remove 50 g and regrind this portion to finer size for drawing analytical sample.<br />
2. Transfer 25 gm analytical sample into a waring blender and add 125 ml<br />
of MeOH-0.1N HCl (100:25) and blend for 2 min (timing). Stand for 5 min<br />
(timing).<br />
3. Filter through whatman No. 1 paper or equivalent. Complete filtration as<br />
soon as possible<br />
4. Collect 50 ml of filtrate in a stoppered container.<br />
(Equivalent weight: 125 ml / 25 g sample)<br />
5. Pipette 20 ml of filtrate into a stoppered or screw cap bottle<br />
(Equivalent weight: 20 ml / 4 g sample)<br />
6. Add exactly 20 ml of 15% ZnSO4 solution. Stopper or cap tightly and<br />
shake vigorously for 30 sec. Filter through diatomaceous earth into another<br />
container. (Equivalent weight: 40 ml / 4 g sample)<br />
7. Pipette 20 ml of this filtrate into a small separating funnel and add<br />
exactly 5 ml of chloroform. Stopper or cap tightly and shake vigorously for 30<br />
sec. (Equivalent weight: 20 ml / 2 g sample).Equivalent weight: 5 ml chloroform<br />
/ 2 g sample)<br />
8. Stand for a few minute to let layers separate. After separated, draw<br />
chloroform layer into a suitable container and pipette 1 ml extract accurately<br />
into amber bottle for preparation of final sample before injecting into<br />
voltammetric cell.
APPENDIX F<br />
Calculation of individual aflatoxin in groundnut sample<br />
Aflatoxin, ng/g (ppb) =<br />
where;<br />
P x C x 1000 µl x 125 ml x 1<br />
P ’ 100 µl V W<br />
P = peak height of sample (nA)<br />
P ’ = peak height of standard (after substract with peak height of sample) (nA)<br />
C = amount of aflatoxin injected into voltammetric cell (ng)<br />
V = effective volume;<br />
= 20 x volume of chloroform used for sample preparation = 20 x 1 = 2 ml<br />
2 total volume of chloroform added 2 5<br />
W = weight of sample (25 g)<br />
===> P x C x 1000 µl x 125 ml x 1<br />
P ’ 100 µl 2 ml 25 g<br />
===> P x C x 25 ( for injected volume = 100 µl)<br />
P ’<br />
260
Notes;<br />
For other injection volume;<br />
Volume (µl) Formula<br />
200 P x C x 12.5<br />
P ’<br />
300 P x C x 8.33<br />
P ’<br />
400 P x C x 6.25<br />
P ’<br />
From first equation;<br />
1000 µl = Volume of final solution prepared in BRB at pH 9.0<br />
100 µl = Injection volume of sample<br />
125 ml = Volume of solvent for mixing and blending groundnut<br />
261
APPENDIX G<br />
Cyclic voltammograms of AFB1, AFG1 and AFG2 with increasing of their<br />
concentrations<br />
Figure G-1 Effect of increasing AFB1 concentrations on the Ip of cathodic cyclic<br />
voltammetric curves in BRB at pH 9.0. (a) 1.30 µM, (b) 2.0 µM (c) 2.70 µM and (d)<br />
3.40 µM. Parameters conditions are Ei = 0, Elow = -1.5 V, Ehigh = 0, scan rate = 200<br />
mV/s.<br />
262
Figure G-2 Effect of increasing AFG1 concentrations on the Ip of cathodic cyclic<br />
voltammetric curves in BRB at pH 9.0. (a) 1.30 µM, (b) 2.0 µM (c) 2.70 µM and (d)<br />
3.40 µM. Parameters conditions are Ei = 0, Elow = -1.5 V, Ehigh = 0, scan rate = 200<br />
mV/s.<br />
Figure G-3 Effect of increasing AFG2 concentrations on the Ip of cathodic cyclic<br />
voltammetric curves in BRB at pH 9.0. (a) 1.30 µM, (b) 2.0 µM (c) 2.70 µM and (d)<br />
3.40 µM. Parameters conditions are Ei = 0, Elow = -1.5 V, Ehigh = 0, scan rate = 200<br />
mV/s.<br />
263
Ip (nA)<br />
120<br />
90<br />
60<br />
30<br />
0<br />
APPENDIX H<br />
Dependence of the peak heights of AFB1, AFG1 and AFG2 on their concentrations<br />
y = 22.451x + 10.989<br />
R 2 = 0.9899<br />
1 1.5 2 2.5<br />
[AFB1] / uM<br />
3 3.5 4<br />
Figure H-1 Dependence of the Ip of AFB1 on concentration of AFB1 in BRB<br />
solution at pH 9.0.<br />
264
Ip (nA)<br />
Ip (nA)<br />
120<br />
90<br />
60<br />
30<br />
0<br />
120<br />
100<br />
80<br />
60<br />
40<br />
20<br />
0<br />
y = 24.756x + 13.072<br />
R 2 = 0.9812<br />
1 1.5 2 2.5<br />
[AFG1] / uM<br />
3 3.5 4<br />
Figure H-2 Dependence of the Ip of AFG1 on concentration of AFG1 in BRB<br />
solution at pH 9.0.<br />
y = 28.757x + 1.4407<br />
R 2 = 0.9914<br />
1 1.5 2 2.5<br />
[AFG2] / uM<br />
3 3.5 4<br />
Figure H-3 Dependence of the Ip of AFG2 on concentration of AFG2 in BRB<br />
solution at pH 9.0.<br />
265
APPENDIX I<br />
Repetitive cyclic voltammograms and their peak height of AFB2, AFG1 and AFG2<br />
in BRB at pH 9.0<br />
Figure I-1 Repetitive cathodic cyclic voltammograms of 1.3 µM AFB1 in BRB<br />
solution at pH 9.0. Parameter conditions are Ei = 0, Elow = -1.5 V, Ehigh = 0 and scan<br />
rate = 200 mV/s<br />
266
Ip (nA)<br />
70<br />
60<br />
50<br />
40<br />
30<br />
20<br />
10<br />
0<br />
1 2 3<br />
No of cycle<br />
4 5<br />
Figure I-2 Increasing Ip of AFB1 cathodic peak obtained from repetitive cyclic<br />
voltammetry<br />
Figure I-3 Repetitive cathodic cyclic voltammograms of 1.3 µM AFG1 in BRB<br />
solution at pH 9.0. Parameter conditions are Ei = 0, Elow = -1.5 V, Ehigh = 0 and scan<br />
rate = 200 mV/s<br />
267
Ip (nA)<br />
80<br />
70<br />
60<br />
50<br />
40<br />
30<br />
20<br />
10<br />
0<br />
1 2 3<br />
No of cycle<br />
4 5<br />
Figure I-4 Increasing Ip of AFG1 cathodic peak obtained from repetitive cyclic<br />
voltammetry<br />
Figure I-5 Repetitive cathodic cyclic voltammograms of 1.3 µM AFG2 in BRB<br />
solution at pH 9.0. Parameter conditions are Ei = 0, Elow = -1.5 V, Ehigh = 0 and scan<br />
rate = 200 mV/s<br />
268
Ip (nA)<br />
70<br />
60<br />
50<br />
40<br />
30<br />
20<br />
10<br />
0<br />
1 2 3 4 5<br />
No of cycle<br />
Figure I-6 Increasing Ip of AFG2 cathodic peak obtained from repetitive cyclic<br />
voltammetry<br />
269
Ep (-mV)<br />
APPENDIX J<br />
Voltammetric plot Ep-log υ for the reduction of AFB1, AFG1 and AFG2 in BRB at<br />
pH 9.0<br />
y = 61.415x + 1171.6<br />
R2 1350<br />
1340<br />
1330<br />
1320<br />
1310<br />
1300<br />
1290<br />
1280<br />
1270<br />
1260<br />
1250<br />
1240<br />
= 0.9987<br />
1.2 1.4 1.6 1.8 2<br />
log v<br />
2.2 2.4 2.6 2.8<br />
Figure J-1 The voltammetric plot Ep – log υ for the reduction of 1.3 µM AFB1 in<br />
BRB solution at pH 9.0<br />
270
Ep (-mV)<br />
Ep (-mV)<br />
1280<br />
1270<br />
1260<br />
1250<br />
1240<br />
1230<br />
1220<br />
1210<br />
1200<br />
1190<br />
1290<br />
1280<br />
1270<br />
1260<br />
1250<br />
1240<br />
1230<br />
1220<br />
1210<br />
y = 48.484x + 1134.8<br />
R 2 = 0.9978<br />
1.2 1.4 1.6 1.8 2<br />
log v<br />
2.2 2.4 2.6 2.8<br />
Figure J-2 The voltammetric plot Ep – log υ for the reduction of 1.3 µM AFG1 in<br />
BRB solution at pH 9.0<br />
y = 49.297x + 1146<br />
R 2 = 0.9984<br />
1200<br />
1.2 1.4 1.6 1.8 2<br />
log v<br />
2.2 2.4 2.6 2.8<br />
Figure J-3 The voltammetric plot Ep – log υ for the reduction of 1.3 µM AFG2 in<br />
BRB solution at pH 9.0<br />
271
Ip (nA)<br />
80<br />
70<br />
60<br />
50<br />
40<br />
30<br />
20<br />
10<br />
0<br />
APPENDIX K<br />
Plot of peak height versus scan rate for AFB1, AFG1 and AFG2 in BRB at pH 9.0<br />
0 100 200 300 400 500 600<br />
v ( mV/sec)<br />
Figure K-1 Plot of Ip versus scan rate (υ) for 1.3 µM AFB1 in BRB at pH 9.0<br />
272
Ip (nA)<br />
110<br />
100<br />
90<br />
80<br />
70<br />
60<br />
50<br />
40<br />
30<br />
20<br />
10<br />
0<br />
0 100 200 300 400 500 600<br />
v ( mV/s )<br />
Figure K-2 Plot of Ip versus scan rate (υ) for 1.3 µM AFG1 in BRB at pH 9.0<br />
I p (nA)<br />
70<br />
60<br />
50<br />
40<br />
30<br />
20<br />
10<br />
0<br />
0 100 200 300 400 500 600<br />
v ( mv/sec)<br />
Figure K-3 Plot of Ip versus scan rate (υ) for 1.3 µM AFG2 in BRB at pH 9.0<br />
273
APPENDIX L<br />
Voltammograms of AFB2 with increasing concentrations<br />
Figure L-1 Cathodic stripping voltammograms of increasing concentration of AFB2<br />
in (a) BRB at pH 9.0, (b) 0.02 µM (c) 0.06 µM (d) 0.10 µM (e) 0.14 µM, (f) 0.18 µM<br />
(g) .22 µM (h) 0.26 µM and (i) 0.32 µM. Parameter conditions; Ei = -1.0 V, Ef = -1.4<br />
V, Eacc = -0.60 V, tacc = 80 s, υ = 50 mV/s and pulse amplitude = 80 mV.<br />
274
APPENDIX M<br />
Voltammograms of 0.1 µM and 0.2 µM AFB2 obtained on the same day<br />
measurements<br />
Figure M-1 Cathodic stripping voltammograms of 0.1µM AFB2<br />
obtained in the same day (n= 8) with RSD = 2.83% Eacc = -6.0 V, tacc= 80 s,<br />
υ = 50 mV/s and pulse amplitude = 80 mV<br />
275<br />
Figure M-2 Cathodic stripping voltammograms of 0.2 µM AFB2<br />
obtained in the same day (n= 8) with RSD = 0.72%. Eacc = -6.0 V, tacc= 80 s,<br />
υ = 50 mV/s and pulse amplitude = 80 mV
APPENDIX N<br />
Voltammogramms of AFB2 at inter-day measurements<br />
Figure N-1 Cathodic stripping voltammograms of 0.1µM AFB2<br />
obtained at day 1 ( n= 8) with RSD = 2.83% .Eacc = -6.0 V, tacc= 80 s, υ = 50<br />
mV/s and pulse amplitude = 80 mV<br />
276
Figure N-2 Cathodic stripping voltammograms of 0.1µM AFB2<br />
obtained at day 2 (n= 8) with RSD = 2.39% Eacc = -6.0 V, tacc= 80 s, υ = 50<br />
mV/s and pulse amplitude = 80 mV<br />
Figure N-3 Cathodic stripping voltammograms of 0.1µM AFB2<br />
obtained at day 3 (n= 8) with RSD = 1.31% Eacc = -6.0 V, tacc= 80 s, υ = 50<br />
mV/s and pulse amplitude = 80 mV<br />
277
APPENDIX O<br />
F test for robustness and ruggedness tests<br />
a) Two tailed F test was used to observe any significant different of variance by using<br />
small variation of a few important parameters such pH of buffer solution, Eacc and tacc..<br />
Optimum parameters Variation<br />
pH of BRB = 9.0 8.5 and 9.5<br />
Eacc = -0.60 V -0.59 V and -0.61 V<br />
tacc = 80 s 75 and 85 s<br />
0.1 µM AFB2 (n =5):<br />
For optimum and small variation in pH of BRB (as an example)<br />
pH n Ip SD<br />
9.0 5 60.62 0.88<br />
8.5 5 58.82 0.79<br />
F = (0.88) 2 / (0.79) 2 = 0.7744/ 0.6241 = 1.24 (< F tabulated at 95 % confidential level;<br />
9.60).<br />
No significant different for pH 9.0 and 8.5 at 95% confidential level.<br />
278
pH n Ip SD<br />
9.0 5 60.62 0.88<br />
9.5 5 59.30 0.44<br />
F = (0.88) 2 / (0.44) 2 = 0.7744 / 0.1936 = 4.00 (< F tabulated at 95 % confidential level;<br />
9.60).<br />
No significant different for pH 9.0 and 9.5 at 95% confidential level.<br />
b) Two tailed F test was used to observe any significant different of variance by<br />
using different voltammetric analyser which are BAS and Metrohm under optimum<br />
parameters (AFB1 as an example).<br />
AFB1<br />
Voltammetric analyser n Ip SD<br />
Metrohm 5 59.88 0.94<br />
BAS 5 58.28 2.79<br />
F(4,4) at 95% confidence level = 9.60<br />
F = (2.79) 2 / (0.94) 2 = 7.78 / 0.88 = 8.84 (< F tabulated; 9.60)<br />
279<br />
No significant difference between the results obtained for 0.1 µM AFB1 by two types of<br />
voltammetric analyser.
APPENDIX P<br />
Voltammograms of AFB1 with increasing concentration<br />
Figure P-1 Cathodic stripping voltammograms of increasing concentration of AFB1<br />
in (a) BRB at pH 9.0, (b) 0.02 µM (c) 0.04 µM (d) 0.14 µM (e) 0.18 µM, (f) 0.22 µM<br />
(g) 0.26 µM (h) 0.30 µM and (i) 0.32 µM. Parameter conditions; Ei = -1.0 V, Ef = -1.4<br />
V, Eacc = -0.60 V, tacc = 80 s, υ = 50 mV/s and pulse amplitude = 80 mV.<br />
280
APPENDIX Q<br />
Voltammograms of AFG1 with increasing concentrations<br />
Figure Q-1 Cathodic stripping voltammograms of increasing concentration of AFG1<br />
in (a) BRB at pH 9.0, (b) 0.02 µM, (c) 0.04 µM, (d) 0.06 µM, (e) 0.08 µM, (f) 0.10<br />
µM, (g) 0.14 µM, (h) 0.18 µM, (i) 0.26 µM (j) 0.30 µM and (k) 0.32 µM. Parameter<br />
conditions; Ei = -0.95 V, Ef = -1.4 V, Eacc = -0.60 V, tacc = 80 s, υ = 50 mV/s and pulse<br />
amplitude = 80 mV.<br />
281
APPENDIX R<br />
Voltammograms of AFG2 with increasing concentrations<br />
Figure R-1 Cathodic stripping voltammograms of increasing concentration of AFG2<br />
in (a) BRB at pH 9.0, (b) 0.02 µM, (c) 0.04 µM, (d) 0.06 µM, (e) 0.10 µM, (f) 0.14<br />
µM, (g) 0.18 µM, (h) 0.26 µM, (i) 0.28 µM and (j) 0.30 µM. Parameter conditions; Ei<br />
= -1.0 V, Ef = -1.4 V, Eacc = -0.60 V, tacc = 80 s, υ = 50 mV/s and pulse amplitude = 80<br />
mV.<br />
282
APPENDIX S<br />
LOD determination according to Barek et al. (2001a)<br />
By standard addition of lower concentration of analyte (AFB1, AFB2, AFG1 and<br />
AFG2) until obtaining the sample response that is significantly difference from blank<br />
sample<br />
a) AFB1; 0.5 x 10 -8 M or 1.56 ppb gave Ip = 4.3 nA at Ep = -1.250 V<br />
Figure S-1 Voltammogram of 0.5 x 10 -8 M of AFB1 in BRB at pH 9.0<br />
283
) AFB2; 0.78 x 10 -8 M or 2.5 ppb gave Ip = 5.7 nA at Ep = -1.260 V<br />
Figure S-2 Voltammogram of 0.78 x 10 -8 M of AFB2 in BRB at pH 9.0<br />
c) AFG1; 1.0 x 10 -8 M or 3.28 ppb gave Ip = 4.34 nA at Ep = -1.160 V<br />
Figure S-3 Voltammogram of 1.0 x 10 -8 M of AFG1 in BRB at pH 9.0<br />
284
d) AFG2; 0.76 x 10 -8 M or 2.5 ppb gave Ip = 6.19 nA at Ep = -1.190 V<br />
Figure S-4 Voltammogram of 0.76 x 10 -8 M of AFG2 in BRB at pH 9.0<br />
From the results, LOD for AFB1, AFB2, AFG1 and AFG2 are 0.5 x 10 -8 M (1.56 ppb),<br />
0.78 x 10 -8 M (2.50 ppb), 1.0 x 10 -8 M (3.28 ppb) and 0.76 x 10 -8 M (2.50 ppb),<br />
respectively.<br />
285
APPENDIX T<br />
LOD determination according to Barek et al. (1999)<br />
The limit of detection is calculated as threefold standard deviation from seven analyte<br />
determinations at the concentration corresponding to the lowest point on the appropriate<br />
calibation curve.<br />
AFB1 (as an example);<br />
concentration for lowest point on calibration curve is 2.0 x 10 -8 M.<br />
Ip values from seven determinations of this concentration;<br />
11.76, 12.00, 12.40, 11.80, 11.85, 11.92, 11.92<br />
Mean = 11.95 Standard deviation = 0.2142<br />
0.2142 x 3 = 0.642 x 10 -8 M or 2.00 ppb<br />
LOD for determination of AFB1 = 0.64 x 10 -8 M or 2.00 ppb.<br />
286
APPENDIX U<br />
LOD determination according to Zhang et al. (1996)<br />
The LOD is the concentration giving a signal equal to three times the standard deviation<br />
of the blank signal divided by slope from calibration curve.<br />
AFB1 as an example<br />
Regression equation for calibration curve is y = 5.4363x + 3.7245<br />
Slope = 5.4363<br />
Ip for blank from seven measurements;<br />
40.86, 42.24, 40.22, 38.53, 42.52, 41.04, 41.64<br />
standard deviation of blank (SDblk) = 1.3533<br />
3SDblk / m = (3 x 1.3533) / 5.4363 = 0.7468 x 10 -8 M or 2.35 ppb<br />
LOD for determination of AFB1 = 0.75 x 10 -8 M or 2.35 ppb.<br />
287
APPENDIX V<br />
LOD determination according to Miller and Miller (1993)<br />
LOD is the concentration giving a signal three times the standard error plus the yintercept<br />
divided by the slope of calibration curve<br />
Regression equation for peak height of analyte with their concentrations is;<br />
yi = mx + b<br />
where; yi = peak height<br />
m = slope<br />
b = y-intercept<br />
y value for calculation of standard error is y ’ i = mx + b where x is the concentration of<br />
analyte.<br />
Standard error is calculated based on following equation;<br />
Sy/x = √( ∑ (yi – yi ’ ) 2 ) / n -2<br />
LOD = (3 x Sy/x ) / m<br />
288
As example, LOD for AFB1 is calculated as below;<br />
Regression equation for AFB1; y = 5.4363x + 3.7245<br />
[AFB1] = x Peak height = y yi ’ = mx + b y – yi ’ (y – yi ’ ) 2<br />
2 11.86 14.597 -2.737 7.491<br />
4 23.77 25.470 -1.70 2.89<br />
6 36.34 36.342 -0.002 4 x 10 -6<br />
10 60.4 58.088 2.312 5.345<br />
14 82.12 79.833 2.287 5.230<br />
18 103 101.578 1.422 2.022<br />
22 125.1 123.323 1.777 3.158<br />
26 145.6 145.068 0.532 0.283<br />
30 165.2 166.814 -1.614 2.605<br />
32 175.4 177.686 -2.286 5.226<br />
(x in 10 -8 M and peak height is in nA)<br />
n = 10, m = 5.4363, ∑ (yi – yi ’ ) 2 = 34.250<br />
Sy/x = √34.250/ 8 = 2.069<br />
LOD = (3 x 2.069) / 5.4363 = 1.142 x 10 -8 M or 3.56 ppb<br />
====> LOD for AFB1 is 1.14 x 10 -8 M or 3.56 ppb.<br />
∑ (yi – yi ’ ) 2 34.250<br />
289
APPENDIX W<br />
ANOVA test (Youmens, 1973)<br />
Table W-1 LOD (in ppb) of aflatoxins obtained from three different method<br />
Aflatoxin<br />
Method 1<br />
2<br />
3<br />
Totals<br />
B1 B2 G1 G2<br />
1.56 2.50 3.28 2.50<br />
2.00 2.80 3.50 3.02<br />
2.35 2.86 3.60 2.84<br />
5.91 8.16 10.38 8.36<br />
Totals<br />
9.84<br />
11.32<br />
11.65<br />
32.81<br />
Four sums of squares were calculated in order to make up the ANOVA table. They are<br />
total, sample, method and error sums of squares. The sums of squares were calculated<br />
in five steps as follows;<br />
a) Calculation of C = (∑ Xij) 2 / kn = (32.81) 2 / 12 = 89.71<br />
b) Calculation of total sum of squares = ∑ (Xij) 2 – C = 93.63 – 89.71 = 3.92<br />
c) Calculation of sample or block sum of squares = 1 ∑ 2 j – C = 1 x 279.15 – 89.71<br />
n 3<br />
= 3.34<br />
d) Calculation of method or process sum of squares =1 ∑ 2 i– C<br />
k<br />
= 1 x 360.69 – 89.71 = 0.46<br />
4<br />
290
e) Calculation of error sum of squares<br />
Error sum of squares = total sum of squares – (block sum of squares + process sum<br />
of squares)<br />
= 3.92 – (3.34 + 0.46) = 0.12<br />
The ANOVA table was constructed as follows:<br />
Table W-2 Analysis of variance<br />
Source<br />
Total<br />
Block<br />
Process<br />
Error<br />
f) Calculation of F<br />
Degrees of freedom (f)<br />
kn – 1 = 11<br />
n – 1 = 2<br />
k – 1 = 3<br />
kn – n – k + 1 = 6<br />
F = process mean square / error mean square<br />
= 0.153 / 0.02 = 7.65<br />
g) Test of null hypothesis<br />
Sum of squares (SS)<br />
3.92<br />
3.34<br />
0.46<br />
0.12<br />
Mean squares<br />
(SS / f = MS)<br />
0.153<br />
0.02<br />
Tabular F from Fisher’s F table is 8.94 for f1 = 6 and f2 = 3. This is larger than<br />
the calculated value of F. The hypothesis was not disproved, hence the<br />
experiment indicates that the methods are not giving significantly different of<br />
LOD of aflatoxins at 95% probability level.<br />
This ANOVA test indicates that all three methods can be selected in<br />
determination of LOD of aflatoxins using proposed technique.<br />
291
Ip (nA)<br />
60<br />
50<br />
40<br />
30<br />
20<br />
10<br />
0<br />
APPENDIX X<br />
Peak height of AFB2 obtained from modification of mercury electrode with PLL<br />
Table X-1 Ip of 10 ppb all aflatoxins in BRB at pH 9.0 in presence and absence of<br />
poly-L-lysine (PLL)<br />
Aflatoxin<br />
AFB1<br />
AFB2<br />
AFG1<br />
AFG2<br />
Ip (nA)<br />
15.70<br />
14.83<br />
18.77<br />
17.60<br />
No PLL<br />
Ep (V)<br />
-1.26<br />
-1.26<br />
-1.19<br />
-1.22<br />
5 6 9 11<br />
pH of BRB<br />
Ip (nA)<br />
10.22<br />
12.20<br />
16.20<br />
13.90<br />
With PLL<br />
No PLL<br />
With PLL<br />
Ep (V)<br />
-1.22<br />
-1.26<br />
-1.19<br />
-1.22<br />
Figure X-1 Ip of 0.1 µM AFB2 (31.4 ppb) in different pH of BRB with and without<br />
PLL coated on mercury electrode.<br />
292
APPENDIX Y<br />
SWSV voltammograms of AFB1, AFB2, AFG1 and AFG2 in BRB at pH 9.0<br />
Figure Y-1 SWS voltammograms of AFB1 in BRB at pH 9.0 (n =10). Experimental<br />
parameters; Ei = -1.0 V, Ef = -1.4 V, Eacc = -0.8 V, tacc = 100 s, υ = 3750 mV/s,<br />
frequency = 125 Hz, voltage step = 0.03 s and amplitude = 50 mV. Blank is<br />
represented by broken line.<br />
Figure Y-2 SWS voltammograms of AFB2 in BRB at pH 9.0 (n=10). All<br />
experimental conditions are the same as in the Figure Z-2.<br />
293
Figure Y-3 SWS voltammograms of AFG1 in BRB at pH 9.0 (n=10). All<br />
experimental conditions are the same as in the Figure Z-2 except for Ei = -0.95 V.<br />
Figure Y-4 SWSV voltammograms of AFB2 in BRB at pH 9.0 (n=10). All<br />
experimental conditions are the same as in the Figure Z-2.<br />
294
APPENDIX Z<br />
SWSV voltammograms of 0.1 µM of AFB1, AFB2, AFG1 and AFG2 in BRB at pH<br />
9.0<br />
Figure Z-1 SWSV voltammograms of 0.10 µM of AFB1 (n =3) in BRB at pH 9.0. Ei<br />
= -1.0 V, Ef = -1.4 V, Eacc = -0.8 V, tacc = 100 s, υ = 3750 mV/s, frequency = 125 Hz,<br />
voltage step = 0.03 V and amplitude = 50 mV.<br />
Figure Z-2 SWSV voltammograms of 0.10 µM of AFB2 (n = 3) in BRB at pH 9.0.<br />
All experimental parameters are the same as in Figure Z-1.<br />
295
Figure Z-3 SWSV voltammograms of 0.10 µM of AFG1 (n=3) in BRB at pH 9.0.<br />
All experimental parameters are the same as in Figure Z-1 except for Ei = -0.95 V.<br />
Figure Z-4 SWSV voltammograms of 0.10 µM of AFG2 (n =3) in BRB at pH 9.0.<br />
All experimental parameters are the same as in Figure Z-1.<br />
296
APPENDIX AA<br />
UV-VIS spectrums of 10 ppm AFB1, AFB2, AFG1 and AFG2 stock solutions<br />
Figure AA-1 UV-VIS spectrums (n=3) of 10 ppm AFB1 in benzene: acetonitrile<br />
(98%)<br />
Figure AA-2 UV-VIS spectrums (n=3) of 10 ppm AFB2 in benzene: acetonitrile<br />
(98%)<br />
297
Figure AA-3 UV-VIS spectrums (n=3) of 10 ppm AFG1 in benzene: acetonitrile<br />
(98%)<br />
Figure AA-4 UV-VIS spectrums (n=3) of 10 ppm AFG2 in benzene: acetonitrile<br />
(98%)<br />
298
APPENDIX AB<br />
Voltammograms of AFB1, AFB2, AFG1 and AFG2 obtained from 0 to 6 months<br />
storage time in the cool and dark conditions<br />
Figure AB-1 Voltammograms of 0.10 µM AFB1 in BRB at pH 9.0 obtained from<br />
difference storage time of 0 to 6 months in the dark and cool conditions. DPCSV<br />
parameter conditions: Ei = -1.0 V, Ef = -1.4 V, Eacc = -0.6 V, tacc = 80 s, υ = 50 mV/s<br />
and pulse amplitude = 80 mV.<br />
299
Figure AB-2 Voltammograms of 0.10 µM AFB2 in BRB at pH 9.0 obtained from<br />
difference storage time of 0 to 6 months in the dark and cool conditions. DPCSV<br />
parameter conditions are the same as in Figure AB-1.<br />
Figure AB-3 Voltammograms of 0.10 µM AFG1 in BRB at pH 9.0 obtained from<br />
difference storage time of 0 to 6 months in the dark and cool conditions. DPCSV<br />
parameter conditions are the same as in Figure AB-1 except for Ei = -0.95 V.<br />
300
Figure AB-4 Voltammograms of 0.10 µM AFG2 in BRB at pH 9.0 obtained from<br />
difference storage time of 0 to 6 months in the dark and cool conditions. DPCSV<br />
parameter conditions are the same as in Figure AB-1.<br />
301
APPENDIX AC<br />
Voltammograms of AFB1, AFB2, AFG1 and AFG2 obtained from 0 to 8 hours<br />
exposure time<br />
Figure AC-1 Voltammograms of 0.10 µM AFB1 in BRB at pH 9.0 exposed to normal<br />
laboratory conditions from 0 to 8 hrs. Experimental conditions: Ei = -1.0 V, Ef = -1.4<br />
V, Eacc = -0.60 V, tacc = 80 s, υ = 50 mV/s and pulse amplitude = 80 mV.<br />
302
Figure AC-2 Voltammograms of 0.10 µM AFB2 in BRB at pH 9.0 exposed to normal<br />
laboratory conditions from 0 to 8 hrs. Experimental conditions are the same as in<br />
Figure AC-1.<br />
Figure AC-3 Voltammograms of 0.10 µM AFG1 in BRB at pH 9.0 exposed to normal<br />
laboratory conditions from 0 to 8 hrs. Experimental conditions are the same as in<br />
Figure AC-1 except for Ei = -0.95 V.<br />
303
Figure AC-4 Voltammograms of 0.10 µM AFG2 in BRB at pH 9.0 exposed to normal<br />
laboratory conditions from 0 to 8 hrs. Experimental conditions are the same as in<br />
Figure AC-1.<br />
304
APPENDIX AD<br />
UV-VIS spectrums of AFB2 and AFG2 in BRB at pH 6.0 and 11.0<br />
Figure AD-1 UV-VIS spectrums of 1.0 ppm AFB2 in BRB at pH 6.0 from 0 to 3 hrs<br />
exposure time<br />
Figure AD-2 UV-VIS spectrums of 1.0 ppm AFB2 in BRB at pH 11.0 from 0 to 3 hrs<br />
exposure time<br />
305
Figure AD-3 UV-VIS spectrums of 1.0 ppm AFG2 in BRB at pH 6.0 from 0 to 3 hrs<br />
exposure time<br />
Figure AD-4 UV-VIS spectrums of 1.0 ppm AFG2 in BRB at pH 11.0 from 0 to 3 hrs<br />
exposure time<br />
306
APPENDIX AE<br />
Voltammograms of AFB1 and AFG1 in 1.0 M HCl and 1.0 M NaOH<br />
Figure AE-1 DPCSV voltammograms of AFB1 in 1.0 M HCl from 0 to 6 hours<br />
Figure AE-2 DPCSV voltammograms of AFB1 in 1.0 M NaOH from 0 to 6 hours.<br />
307
Figure AE-3 DPCSV voltammograms of AFG1 in 1.0 M HCl from 0 to 6 hours.<br />
Figure AE-4 DPCSV voltammograms of AFG1 in 1.0 M NaOH from 0 to 4 hours.<br />
308
APPENDIX AF<br />
DPCS voltammograms of real samples added with various concentrations of AFG1<br />
(i) (ii)<br />
(iii)<br />
Figure AF-1 DPCSV voltammograms of real samples (b) added with 3 ppb (i), 9 ppb<br />
(ii) and 15 ppb (iii) AFG1 obtained in BRB at pH 9.0 (a) as the blank on the first day<br />
measurement.<br />
309
APPENDIX AG<br />
SWSV voltammograms of real samples added with various concentrations of<br />
AFB1<br />
(i) (ii)<br />
(iii)<br />
Figure AG-1 SWSV voltammograms of real samples (b) added with 3 ppb (i), 9 ppb<br />
(ii) and 15 ppb (iii) AFB1 obtained in BRB at pH 9.0 (a) as the blank on the first day<br />
measurement.<br />
310
% recovery<br />
% recovery<br />
120<br />
100<br />
80<br />
60<br />
40<br />
20<br />
0<br />
120<br />
100<br />
80<br />
60<br />
40<br />
20<br />
0<br />
APPENDIX AH<br />
Percentage of recoveries of 3 ppb and 9 ppb of all aflatoxins in real samples<br />
obtained by SWSV method.<br />
Day 1 Day 2 Day 3<br />
Day 1 Day 2 Day 3<br />
AFB1<br />
AFB2<br />
AFG1<br />
AFG2<br />
Figure AH-1 Percentage of recoveries of 3 ppb of all aflatoxins in real samples<br />
obtained by SWSV method for one to three days of measurements.<br />
AFB1<br />
AFB2<br />
AFG1<br />
AFG2<br />
Figure AH-2 Percentage of recoveries of 9 ppb of all aflatoxins in real samples<br />
obtained by SWSV method for one to three days of measurements.<br />
311
APPENDIX AI<br />
Calculation of percentage of recovery for 3.0 ppb AFG1 added into real sample.<br />
From voltammograms of real sample added with 3.0 ppb AFG1;<br />
Peak height = 5.85 nA, 6.53 nA, 6.09 nA Average = 6.16 nA<br />
Peak height for 10 ppb AFG1 in BRB pH 9.0 = 20.60 nA * . So for 1 ppb = 2.060 nA<br />
For peak height = 6.16 nA ===> (6.16 / 2.060) x 1.0 ppb = 2.99 ppb<br />
Injected AFG1 = 3.0 ppb<br />
From the above calculation, found AFG1 = 2.99 ppb<br />
Recovery (%) = (2.99 / 3.0) x 100 % = 99.67%.<br />
Summary:<br />
AFG1 added = 3. 0 ppb<br />
AFG1 found = 2.99 ppb<br />
% recovery of AFG1 in real sample = 99.67 %<br />
* Notes; For other aflatoxins, the peak heights for 10 ppb of AFB1, AFB2 and AFG2 in<br />
BRB pH 9.0 is 21.93 nA, 21.33 nA and 20.23 nA respectively.<br />
312
APPENDIX AJ<br />
HPLC chromatograms of real samples: S10 and S07<br />
Figure AJ-1 HPLC chromatogram for S10 which contains 36.00 ppb total aflatoxins.<br />
Figure AJ-2 HPLC chromatogram for S07 which contains 3.67 ppb total aflatoxins.<br />
313
1 st analysis<br />
From voltammograms of real sample ;<br />
APPENDIX AK<br />
Calculation of aflatoxin in real sample; S13<br />
Peak height = 1.78 nA, 1.80 nA, 1.79 nA Average = 1.79 nA<br />
From voltammograms of real sample added with 10 ppb AFB1 standard solution.<br />
Peak height = 22.5 nA, 22.6 nA, 22.8 nA Average = 22.63 nA<br />
From equation as stated in Appendix F;<br />
Aflatoxin content = [(1.79) / (22.63 – 1.79)] x 12.5 = 10 .74 ppb<br />
2 nd analysis<br />
From voltammograms of real sample ;<br />
Peak height = 1.80 nA, 1.79 nA, 1.82 nA Average = 1.80 nA<br />
From voltammograms of real sample added with 10 ppb AFB1 standard solution.<br />
Peak height = 22.7 nA, 22.5 nA, 22.8 nA Average = 22.67 nA<br />
From equation as stated in Appendix F;<br />
Aflatoxin content = [(1.80) / (22.67 – 1.80)] x 12.5 = 10 .78 ppb<br />
Average for duplicate analysis = (10.74 + 10.78) / 2 = 10.74 ppb<br />
Total aflatoxins content in S13 = 10.76 ppb<br />
314
APPENDIX AL<br />
List of papers presented or published to date resulting from this study<br />
1. Yaacob, M.H., Mohd. Yusoff, A.R. and Ahamad, R. Cylic voltammetry study of<br />
AFB2 at the mercury electrode. Paper presented at SKAM -16, Kucing, Sarawak, 9 –<br />
11 th September 2003.<br />
2. Yaacob, M.H., Mohd. Yusoff, A.R. and Ahamad, R. Cylic voltammetry study of<br />
AFB2 at the mercury electrode. <strong>Malaysia</strong>n J. Anal. Sci. In press.<br />
3. Yaacob, M.H., Mohd. Yusoff, A.R. and Ahamad, R. Differential pulse stripping<br />
voltammetric technique for determination of AFB2 at the mercury electrode. J. Collect.<br />
Czech. Chem. Common. In press<br />
4. Yaacob, M.H., Mohd. Yusoff, A.R. and Ahamad, R. Stability studies of<br />
aflatoxin G1 (AFG1) using differential pulse stripping voltammetric technique. Paper<br />
presented at Symposium Life Science II, USM Penang. 31 st to 3 rd April 2004.<br />
5. Yaacob, M.H., Mohd. Yusoff, A.R. and Ahamad, R. Developement of<br />
differential pulse stripping voltammetric (DPCSV) technique for determination of<br />
AFG1 at the mercury electrode. Chemical Analysis (Warsaw). In press<br />
6. Yaacob, M.H., Mohd. Yusoff, A.R. and Ahamad, R. Cyclic voltammetry study<br />
of AFG1 at the mercury electrode. Paper presented at KUSTEM 3 rd Annual Seminar on<br />
Sustainability Science and Management, Kuala Terengganu, Terengganu. 4 – 5 th May<br />
2004.<br />
7. Yaacob, M.H., Mohd. Yusoff, A.R. and Ahamad, R. Stability studies of<br />
aflatoxins using differential pulse stripping voltammetric (DPCSV) technique. Paper<br />
presented at SKAM-17, Kuantan, Pahang, 24 – 26 th August 2004.<br />
315
8 Yaacob, M.H., Mohd. Yusoff, A.R. and Ahamad, R. Stability studies of<br />
aflatoxins using differential pulse stripping voltammetric (DPCSV) technique.<br />
<strong>Malaysia</strong>n J. Anal. Sci. In press.<br />
9. Yaacob, M.H., Mohd. Yusoff, A.R. and Ahamad, R. Voltammetric<br />
determination of aflatoxins: Differential pulse voltammetric (PCSV) versus Squarewave<br />
stripping voltammetry (SWSV) techniques. Paper presented at KUSTEM 4 th<br />
Annual Seminar on Sustainibility Science and Management, Kuala Terengganu, 2 nd –<br />
3 rd May 2005.<br />
10. Yaacob, M.H., Mohd. Yusoff, A.R. , Ahamad, R. and Misni, M. Determination<br />
of the aflatoxin B1 in groundnut samples by differential pulse cathodic stripping<br />
voltammetry (DPCSV) technique. Paper presented at Seminar Nasional Kimia II,<br />
<strong>Universiti</strong> Sumatera Utara, Medan, Indonesia. 14 th April 2005.<br />
11. Yaacob, M.H., Mohd. Yusoff, A.R. Ahamad, R., and Misni, M. Development of<br />
differential pulse cathodic stripping voltammetry (DPCSV) technique for the<br />
determination of aflatoxin B1 in groundnut samples. J Sains Kimia. 9(3): 31-36.<br />
12. Yaacob, M.H., Mohd. Yusoff, A.R. and Ahamad, R. Application of differential<br />
pulse cathodic stripping voltammetry (DPCSV) technique in studying stability of<br />
aflatoxins. J Sains Kimia. 9(3): 64-70.<br />
13. Yaacob, M.H., Mohd. Yusoff, A.R. and Ahamad, R. Square-wave cathodic<br />
stripping voltammetric (SWSV) technique for determination of aflatoxin B1 in<br />
groundnut samples. Paper presented at SKAM-18, JB, Johor. 12 – 14 th September<br />
2005.<br />
14. Yaacob, M.H., Mohd. Yusoff, A.R. and Ahamad, R. Square-wave cathodic<br />
stripping voltammetric (SWSV) technique for determination of aflatoxin B1 in<br />
groundnut samples. <strong>Malaysia</strong>n J. Anal. Sci. In press.<br />
316
APPENDIX AM<br />
ICP-MS results on analysis of BRB at pH 9.0<br />
Figure AM-1 ICP-MS results on analysis of BRB at pH 9.0<br />
317
Introduction Experimental Results & Discussion Problem Future Works<br />
PRESENTED AT<br />
1 st ASSESMENT<br />
SEMINAR.<br />
3/1/2007 1st ASSESSMENT REPORT 1
STRIPPING VOLTAMMETRIC STUDY FOR DETERMINATION<br />
OF AFLATOXIN COMPOUNDS<br />
MOHAMAD HADZRI YAACOB (PS023001)<br />
SUPERVISOR:<br />
AP DR ABDUL RAHIM HJ MOHD YUSOFF<br />
CO-SUPERVISOR:<br />
PROF RAHMALAN AHAMAD
Introduction Experimental Results & Discussion Problem Future Works<br />
TOPICS FOR DISCUSSION<br />
� INTRODUCTION<br />
AFLATOXIN COMPOUNDS<br />
RESEARCH BACKGROUND<br />
OBJECTIVES<br />
SCOPE OF RESEARCH<br />
� EXPERIMENTAL<br />
� RESULTS AND DISCUSSION<br />
� CONCLUSION<br />
� PROBLEMS<br />
� SUGGESTIONS FOR FUTURE<br />
WORKS<br />
� FLOW CHART OF FUTURE<br />
PLANNING<br />
� ACKNOWLEDGEMENT<br />
AFLATOXINS<br />
3/1/2007 1st ASSESSMENT REPORT 3
Introduction Experimental Results & Discussion Problem Future Works<br />
� AFLATOXINS:<br />
Mycotoxin group<br />
Produced by two fungi;<br />
Aspergillus flavus and<br />
Aspergillus parasiticus<br />
Types of aflatoxins:<br />
AFB1<br />
AFB2<br />
AFG1<br />
AFG2<br />
AFM1<br />
AFM2<br />
INTRODUCTION<br />
Raw peanuts, peanuts products,<br />
wheat, maize, vegetable oils, dried<br />
fruites, barley, pear, cocoa, coffee,<br />
herbs, spices, wine, cottonseeds.<br />
Cow milk and its products, eggs<br />
and meat product<br />
3/1/2007 1st ASSESSMENT REPORT 4
Introduction Experimental Results & Discussion Problem Future Works<br />
INTRODUCTION …cont<br />
� AFLATOXINS:<br />
Occurs naturally in commodities used for animal and human<br />
Carcinogenic, teratogenic and mutagenic<br />
IARC (1988): Class I carcinogenic materials<br />
Dangerous to health: will cause aflatoxicosis disease.<br />
Effect the economy of commodities export countries<br />
3/1/2007 1st ASSESSMENT REPORT 5
Introduction Experimental Results & Discussion Problem Future Works<br />
INTRODUCTION…cont<br />
� AFLATOXINS<br />
Its growth depends on temperature and medium (acidity)<br />
Contamination of feed through infection and seed damaged by insects<br />
Enter into human body through consumption of contaminated food<br />
and skin absorption.<br />
Regulatory level in <strong>Malaysia</strong>:<br />
Raw peanuts < 15 ppb<br />
Milk < 0.5 ppb<br />
Others < 5 ppb<br />
3/1/2007 1st ASSESSMENT REPORT 6
Introduction Experimental Results & Discussion Problem Future Works<br />
� CHEMICAL STRUCTURES<br />
O<br />
O<br />
O<br />
O<br />
O<br />
O<br />
AFB1<br />
INTRODUCTION… cont<br />
O<br />
O<br />
O<br />
O O<br />
O<br />
O<br />
AFB2<br />
AFG1 AFG2<br />
3/1/2007 1st ASSESSMENT REPORT 7<br />
O<br />
O<br />
O<br />
O<br />
O<br />
O<br />
O<br />
O<br />
O<br />
O<br />
O O<br />
O
Introduction Experimental Results & Discussion Problem Future Works<br />
RESEARCH BACKGROUND<br />
� Very dangerous to human health<br />
� Its actual amount must be determined by<br />
fast, accurate and relatively low cost<br />
technique / method.<br />
� Analytical level must be at ppb or ppt ( In<br />
<strong>Malaysia</strong>: HPLC with LOD:2.0 ppb and<br />
analysis time: 20 mins)<br />
3/1/2007 1st ASSESSMENT REPORT 8
Introduction Experimental Results & Discussion Problem Future Works<br />
RESEARCH BACKGROUND…cont<br />
Methods that have been used:<br />
� TLC ( 0.03 – 5.0 ppb)<br />
� HPLC (UVD, AD or FD) ( 0.014 – 7.0 ppb)<br />
� Enzyme linked immunosorbant assay (ELISA):<br />
( 0.01 – 5.0 ppb)<br />
� Immunoaffinity chromatography (IAC):<br />
( 0.2 – 2.0 ppb)<br />
� Micellar electrokinetic’s capillary chromatography (MECC):<br />
( 0.02 – 0.09 ppb)<br />
� Differential pulse polagoraphy (DPP): ( 25 ppb)<br />
LOD of aflatoxins depends on the type of:<br />
aflatoxins, samples and extraction techniques<br />
3/1/2007 1st ASSESSMENT REPORT 9
Introduction Experimental Results & Discussion Problem Future Works<br />
RESEARCH BACKGROUND… cont<br />
� Problems/disadvantages:<br />
TLC<br />
HPLC<br />
ELISA<br />
RIA<br />
Longer analysis time, accuracy problem,<br />
aflatoxins absorption problem<br />
Longer analysis time, need a lot of toxic<br />
organic solvents, high cost for instruments,<br />
and maintenance<br />
Reagents /kits are costly. Suitable for screen<br />
test.<br />
Antibodies are costly, using dangerous<br />
radioisotopes, need special precaution for<br />
dealing with radioisotopes and its waste. It<br />
has certain half life.<br />
3/1/2007 1st ASSESSMENT REPORT 10
Introduction Experimental Results & Discussion Problem Future Works<br />
RESEARCH BACKGROUND… cont<br />
VOLTAMMETRY<br />
Until now, no study has been performed<br />
using voltammetric techniques either cyclic<br />
voltammetry, cathodic/anodic stripping<br />
voltammetry or absorption stripping<br />
Voltammetric technique has been chosen as an alternative method<br />
to be studied for determination of aflatoxins<br />
3/1/2007 1st ASSESSMENT REPORT 11
Introduction Experimental Results & Discussion Problem Future Works<br />
RESEARCH BACKGROUND …cont<br />
� Voltammetric technique: sensitive, high<br />
accuracy, low cost and easy to use<br />
3/1/2007 1st ASSESSMENT REPORT 12
Introduction Experimental Results & Discussion Problem Future Works<br />
OBJECTIVES OF RESEARCH<br />
(1)<br />
TO STUDY<br />
ELECTROCHEMICAL<br />
PROPERTIES OF<br />
AFLATOXINS (AFB1, AFB2,<br />
AFG1 AND AFG2) USING<br />
VOLTAMMETRIC<br />
TECHNIQUE TOGETHER<br />
WITH CONTROL GROWTH<br />
MERCURY ELECTRODE<br />
(CGME) AS THE WORKING<br />
ELECTRODE<br />
3/1/2007 1st ASSESSMENT REPORT 13<br />
(2)<br />
TO DEVELOPE A<br />
DETECTION METHOD FOR<br />
DETERMINATION OF<br />
AFLATOXINS IN FOOD<br />
SAMPLES WHICH IS<br />
SENSITIVE, SIMPLE,<br />
ACCURATE AND<br />
ECONOMIC TECHNIQUE.<br />
CV DPSV
Introduction Experimental Results & Discussion Problem Future Works<br />
SCOPE OF STUDY<br />
� Using cyclic voltammetry (CV):-<br />
� Determine the type of aflatoxins reaction at<br />
mercury electrode when anodic or cathodic<br />
scanning is performed.<br />
3/1/2007 1st ASSESSMENT REPORT 14
Introduction Experimental Results & Discussion Problem Future Works<br />
SCOPE OF STUDY…cont<br />
� Identify the peak or peaks obtained either<br />
oxidation peak or reduction peak or both for<br />
developing a technique for analysis of<br />
aflatoxins.<br />
3/1/2007 1st ASSESSMENT REPORT 15
Introduction Experimental Results & Discussion Problem Future Works<br />
SCOPE OF STUDY…cont<br />
� Using voltammetric technique:<br />
� study the effect of pH of electrolyte<br />
solution on reduction/oxidation<br />
aflatoxin peaks.<br />
� determine the best electrolyte for the<br />
process of reduction / oxidation of<br />
aflatoxins at mercury electrode.<br />
3/1/2007 1st ASSESSMENT REPORT 16
Introduction Experimental Results & Discussion Problem Future Works<br />
SCOPE OF STUDY…cont<br />
�Parameters optimisation to obtain<br />
maximum peak height and linear with<br />
addition of aflatoxins concentration.<br />
�Use optimum parameters for<br />
determination of AFB2, AFB1, AFG1 and<br />
AFG2<br />
3/1/2007 1st ASSESSMENT REPORT 17
Introduction Experimental Results & Discussion Problem Future Works<br />
1) Literature survey<br />
PLANNING ACTIVITIES<br />
2) Cyclic voltammetric study of AFB2<br />
3) Stripping voltammetric study of<br />
AFB2<br />
4) Parameters optimisation:<br />
4a) using high concentration<br />
4b) using low concentration<br />
Activity 2002<br />
3/1/2007 1st ASSESSMENT REPORT 18<br />
M<br />
J<br />
J<br />
O<br />
S<br />
O<br />
N<br />
D
Introduction Experimental Results & Discussion Problem Future Works<br />
PLANNING ACTIVITIES…cont<br />
1) Determination of<br />
AFB1, AFB2, AFG1<br />
and AFG2<br />
1a) Prepare<br />
calibration curve<br />
1b) Determine<br />
analytical parameters<br />
2) Interference study<br />
3) Complexing of<br />
aflatoxins study<br />
Activity 2003<br />
J F M A M J J O<br />
3/1/2007 1st ASSESSMENT REPORT 19<br />
S<br />
O<br />
N<br />
D
Introduction Experimental Results & Discussion Problem Future Works<br />
1) Determination of mixing<br />
aflatoxins<br />
4)Determination by HPLC<br />
5) Study using different<br />
working electrodes<br />
5) Comparison study<br />
6) Thesis writting up<br />
1) Analysis of contaminated<br />
food samples<br />
2) Thesis writting up<br />
PLANNING ACTIVITIES…cont<br />
2)Determination of aflatoxins<br />
in artificially contaminated<br />
samples<br />
3)Determination of aflatoxins<br />
in real samples<br />
Activity 2004<br />
J F M A M J J O<br />
Activity 2005<br />
3/1/2007 1st ASSESSMENT REPORT 20<br />
S<br />
O<br />
N<br />
D
Introduction Experimental Results & Discussion Problem Future Works<br />
STUDY FLOW CHART<br />
AFLATOXIN COMPOUNDS<br />
AFB1 AFB2 AFG1 AFG2<br />
Cyclic voltammetric, voltammetric,<br />
anodic/cathodic<br />
anodic/ cathodic<br />
Direct measurement<br />
Complexing with metals<br />
(Zn, Pb, Pb,<br />
Cu) or<br />
Organic materials<br />
(Cystein Cystein)<br />
Method optimisation<br />
Differential pulse stripping<br />
Voltammetric, Voltammetric,<br />
anodic / cathodic<br />
Modified electrode /<br />
Screen printed electrode<br />
3/1/2007 1st ASSESSMENT REPORT 21
Introduction Experimental Results & Discussion Problem Future Works<br />
Optimise;E acc, tacc,<br />
Ei, Ef, scan rate,<br />
pulse amplitude<br />
STUDY FLOW CHART…cont<br />
Method validation<br />
Limit of detection Linearity Precision Accuracy<br />
By<br />
experiment<br />
By<br />
graph Intra-day Intra day<br />
Inter-day Inter day<br />
3/1/2007 1st ASSESSMENT REPORT 22
Introduction Experimental Results & Discussion Problem Future Works<br />
Mixing aflatoxins std<br />
(AFB1,AFB2,AFG1,AFG2)<br />
STUDY FLOW CHART…cont<br />
Method testing<br />
Real samples<br />
Compare the results with that obtained by HPLC<br />
Method is tested at different laboratory / analyser<br />
Method is accepted<br />
Artificially contaminated<br />
samples<br />
3/1/2007 1st ASSESSMENT REPORT 23
Introduction Experimental Results & Discussion Problem Future Works<br />
EXPERIMENTAL: INSTRUMENTS AND REAGENTS<br />
� INSTRUMENTS: BAS CGME<br />
(consist of Ag/AgCl as RE, Pt<br />
wire as AE and HMDE as WE)<br />
interface with BAS C50W<br />
Voltammetric Analyser<br />
� Electrolyte solutions: BRB 0.04M<br />
at various pH (2.0,3.0, 4.0, 5.0,<br />
6.0, 7.0, 8.0, 9.0,10.0,11.0, 12.0<br />
dan 13.0). 0.1M HCl for pH 1.0<br />
� Standard solutions: AFB1,<br />
AFB2, AFG1 dan AFG2<br />
10 ppm (10ml) – SIGMA<br />
� Techniques: CV dan DPCSV<br />
3/1/2007 1st ASSESSMENT REPORT 24
Introduction Experimental Results & Discussion Problem Future Works<br />
EXPERIMENTAL FLOW CHART<br />
10 ML BRB SOLUTION<br />
BLANK SOLUTION<br />
BLANK<br />
VOLTAMMOGRAM<br />
SPIKE INTO 20 ML<br />
VOLTAMMETRIC CELL<br />
SOLUTION IS<br />
DEGASSED<br />
SOLUTION IS<br />
SCANNED<br />
OBTAINED<br />
VOLTAMMOGRAM<br />
NITROGEN GAS IS FLOWED IN AFLATOXINS<br />
SOLUTION, REDISSOLVED IN BRB SOLUTION<br />
BLANK SOLUTION +<br />
AFLATOXIN<br />
SAMPEL<br />
VOLTAMMOGRAM<br />
3/1/2007 1st ASSESSMENT REPORT 25
Introduction Experimental Results & Discussion Problem Future Works<br />
RESULTS AND DISCUSSION<br />
� CV STUDY ( [AFB2] = 1.3 x 10 -6 M in BRB pH 9.0)<br />
Scan rate = 200mV/s<br />
1 = cathodic direction 2 = anodic direction<br />
No anodic peak<br />
Ip for AFB2 = 30 nA<br />
Ep = -1315 1315 mV<br />
Irreversible reaction<br />
3/1/2007 1st ASSESSMENT REPORT 26
Introduction Experimental Results & Discussion Problem Future Works<br />
RESULTS AND DISCUSSION…cont<br />
� CV : to confirm the cathodic peak<br />
� [AFB2] = 1.3 x 10 -6 M in BRB pH = 9.0<br />
1. Anodic direction<br />
2. Cathodic direction<br />
Ip AFB2 = 35 nA<br />
Ep = -1311 1311 mV<br />
No anodic peak<br />
Irreversible reaction<br />
3/1/2007 1st ASSESSMENT REPORT 27
Introduction Experimental Results & Discussion Problem Future Works<br />
RESULTS AND DISCUSSION…cont<br />
� CV : to confirm the cathodic peak<br />
� By [AFB2] standard addition and cathodic scanning in BRB pH 9.0<br />
(a) 1.3 uM 30nA, -1315 1315 mV<br />
(b) 2.0 uM 47 nA, nA,<br />
-1313 1313 mV<br />
(c) 2.7 uM 67 nA, nA,<br />
-1306 1306 mV<br />
(d) 3.4 uM 79 nA, nA,<br />
-1303 1303 mV<br />
y = 26.541x - 3.035<br />
R 2 = 0.9895<br />
3/1/2007 1st ASSESSMENT REPORT 28<br />
Ip (nA)<br />
100<br />
80<br />
60<br />
40<br />
20<br />
0<br />
0 1 2<br />
[AFB2] X 10-6M<br />
3 4
Introduction Experimental Results & Discussion Problem Future Works<br />
RESULTS AND DISCUSSION…cont<br />
� Repeatitive cathodic<br />
scanning using single<br />
mercury drop, 1.3 x 10 -6 M<br />
AFB2 in BRB pH = 9.0<br />
O<br />
AFB2<br />
O<br />
O<br />
O<br />
O<br />
O<br />
i p cath o d ic ( nA)<br />
3/1/2007 1st ASSESSMENT REPORT 29<br />
60<br />
50<br />
40<br />
30<br />
20<br />
10<br />
0<br />
1 3 5<br />
no of cycle<br />
7 9<br />
No of<br />
cycle<br />
Adsorption process at mercury electrode<br />
1<br />
3<br />
5<br />
7<br />
9<br />
Diffusion current is influenced<br />
by adsorption process at<br />
mercury electrode<br />
E p<br />
(-mV)<br />
1314<br />
1310<br />
1309<br />
1307<br />
1304
Introduction Experimental Results & Discussion Problem Future Works<br />
RESULTS AND DISCUSSION…cont<br />
� Effect of scan rate (V) on I p and E p of AFB2<br />
log Ep<br />
1.9<br />
1.7<br />
1.5<br />
1.3<br />
1.1<br />
0.9<br />
0.7<br />
0.5<br />
(1) Log E p vs log V<br />
y = 0.5097x + 0.4115<br />
R 2 = 0.995<br />
1.2 1.4 1.6 1.8 2<br />
log V<br />
2.2 2.4 2.6 2.8<br />
Linear with m >0.5:<br />
�Diffusion current produced<br />
by reduction process of<br />
aflatoxins which is influenced<br />
by adsorption process at<br />
mercury electrode.<br />
3/1/2007 1st ASSESSMENT REPORT 30
Introduction Experimental Results & Discussion Problem Future Works<br />
RESULTS AND DISCUSSION…cont<br />
� Effect of scan rate (V) on I p and E p of AFB2<br />
(2) E p vs log V<br />
Ep (-mV)<br />
1340<br />
1330<br />
1320<br />
1310<br />
1300<br />
1290<br />
1280<br />
1270<br />
y = 40.065x + 1223.3<br />
R 2 = 0.9936<br />
1.2 1.4 1.6 1.8 2<br />
log V<br />
2.2 2.4 2.6 2.8<br />
Linear :<br />
E p AFB2 changing with<br />
Increasing of V.<br />
�Irreversible reaction<br />
3/1/2007 1st ASSESSMENT REPORT 31
Introduction Experimental Results & Discussion Problem Future Works<br />
RESULTS AND DISCUSSION…cont<br />
� Effect of scan rate (V) on I p<br />
of AFB2<br />
(3) I p vs V<br />
Ip (nA)<br />
70<br />
60<br />
50<br />
40<br />
30<br />
20<br />
10<br />
0<br />
0 50 100 150 200 250 300 350 400 450 500 550<br />
V (mv/s)<br />
Linear : two different regions<br />
due to different scan rate<br />
(1) 100 – 500 mV/s (fast) :<br />
m = 0.076 R = 0.9917<br />
(2) 20 – 100 mV/s (slow):<br />
m = 0.264 R = 0.9979<br />
Linear for both regions: AFB2 is<br />
adsorped at mercury electrode.<br />
� Reduction and adsorption<br />
processes at electrode are<br />
influenced by the rate of<br />
reaction which prefers the slow<br />
reaction.<br />
3/1/2007 1st ASSESSMENT REPORT 32
Introduction Experimental Results & Discussion Problem Future Works<br />
RESULTS AND DISCUSSION…cont<br />
� AFB2 reduction<br />
reaction:<br />
: Irreversible<br />
: Diffusion<br />
current is<br />
influenced by<br />
adsorption<br />
process with<br />
prefer the slow<br />
reaction<br />
1. CV produces only<br />
cathodic peak.<br />
2. Graph Ep vs log V: linear<br />
Cathodic Stripping Volltammetric is selected<br />
1. graph log Ep vs log V: linear,<br />
m = >0.5<br />
2. graph Ip vs V: linear with<br />
higher m at slow V compare<br />
to the m at fast V<br />
3. I p increases with repeatitive<br />
cathodic scanning.<br />
3/1/2007 1st ASSESSMENT REPORT 33
Introduction Experimental Results & Discussion Problem Future Works<br />
RESULTS AND DISCUSSION…cont<br />
� Differential Pulse Cathodic<br />
Stripping Voltammetric<br />
(DPCSV) technique<br />
(1)Scan [AFB2] = 1.0 nM<br />
Ei = 0, Ef = -1500 mV, Eacc =0 mV<br />
T acc = 0, v = 50 mv/s, pulse<br />
amplitude: 100 mV (in BRB pH<br />
=9.0)<br />
(2)Scan [AFB2] = 1.0 nM<br />
Ei = 0, Ef = -1500 mV, Eacc =0 mV<br />
T acc = 30s, v = 50 mv/s, pulse<br />
amplitude: 100 mV (In BRB pH =<br />
9.0)<br />
Accumulation time greatly effect on<br />
peak height (Ip ) of AFB2<br />
3/1/2007 1st ASSESSMENT REPORT 34<br />
(1)<br />
(2)<br />
-1256mV, 5nA<br />
-1244mV, 25nA
Introduction Experimental Results & Discussion Problem Future Works<br />
RESULTS AND DISCUSSION…cont<br />
� Study effect of pH of supporting electrolyte ( BRB )<br />
Aims:<br />
a) To study the pH of BRB that gives maximum I p of AFB2<br />
without giving any extra peak.<br />
b) To study either hidrogen ion is greatly involved in the<br />
reduction reaction of AFB2 or not.<br />
[AFB2] = 2.0 uM, BRB with pH = 2.0 to 13.0, use 0.1M HCl<br />
for pH = 1.0<br />
Method: DPCSV<br />
Parameters:<br />
Ei = 0, E f = -1500 mV, E acc = 0, t acc = 15 s, v = 50 mV/s<br />
3/1/2007 1st ASSESSMENT REPORT 35
Introduction Experimental Results & Discussion Problem Future Works<br />
RESULTS AND DISCUSSION…cont<br />
[AFB2] = 2.0 uM, BRB with pH = 2.0 to 13.0, 0.1 M HCl for pH=1.0<br />
Method: DPCSV<br />
Parameters:<br />
E i = 0, E f = -1500 mV, E acc = 0, t acc = 15s, v = 50 mV/s<br />
Ip (nA)<br />
60<br />
50<br />
40<br />
30<br />
20<br />
10<br />
0<br />
4 6 8 10 12<br />
pH<br />
BRb pH 9.0 is selected<br />
pH =9.0, optimum pH<br />
� I p = 48 nA, E p = -1192 mV<br />
pH < 5.0, > 12.0 : no AFB2 peak<br />
pH: 5.0 – 9.0: I p increased<br />
pH: 9.0 – 12.0: I p decreased<br />
The reaction is effected by pH of<br />
supporting electrolyte.<br />
=� proton ion is greatly involve in<br />
reduction reaction of AFB2.<br />
3/1/2007 1st ASSESSMENT REPORT 36
Introduction Experimental Results & Discussion Problem Future Works<br />
RESULTS AND DISCUSSION…cont<br />
� Voltammograms of AFB2 with changing pH<br />
pH = 4.0<br />
No peak<br />
pH = 7.0<br />
( - 1168 mV, 42 nA)<br />
3/1/2007 1st ASSESSMENT REPORT 37
Introduction Experimental Results & Discussion Problem Future Works<br />
RESULTS AND DISCUSSION…cont<br />
� Voltammograms of AFB2 with changing pH<br />
Interfered by blank<br />
( BRb pH = 9.0 )<br />
pH = 9.0 ( -1192 mV, 48 nA) pH = 11.0 (-1193 mV, 32 nA)<br />
3/1/2007 1st ASSESSMENT REPORT 38
Introduction Experimental Results & Discussion Problem Future Works<br />
RESULTS AND DISCUSSION…cont<br />
� Effect of pH of BRB on E p of AFB2<br />
Ep (-m V)<br />
1250<br />
1200<br />
1150<br />
1100<br />
4 6 8 10 12 14<br />
pH<br />
pH: 5.0 – 8.0: linear:<br />
R = 0.9777<br />
pH: 9.0 – 12.0: nearly constant<br />
E p shifted towards more negative<br />
direction<br />
=� At or before optimum pH (9.0),<br />
reaction is effected by H + ion<br />
3/1/2007 1st ASSESSMENT REPORT 39
Introduction Experimental Results & Discussion Problem Future Works<br />
RESULTS AND DISCUSSION…cont<br />
� Parameters optimisation:<br />
� Scan rate (v)<br />
� Accumulation potential ( E acc)<br />
� Accumulation time (t acc)<br />
� Scanning potential window( E i and E f)<br />
� Pulse amplitude<br />
3/1/2007 1st ASSESSMENT REPORT 40
Introduction Experimental Results & Discussion Problem Future Works<br />
RESULTS AND DISCUSSION…cont<br />
� Parameters optimisation steps<br />
Using two different concentrations of AFB2<br />
(1) High:<br />
[AFB2] = 2.0 uM<br />
(2) Low:<br />
[AFB2] = 0.06 uM<br />
Optimum parameters for determination<br />
of AFB2 using DPCSV technique<br />
3/1/2007 1st ASSESSMENT REPORT 41
Introduction Experimental Results & Discussion Problem Future Works<br />
RESULTS AND DISCUSSION…cont<br />
Initial parameters:<br />
E i = 0,E f = -1500 mV,E acc = 0, t acc = 15 s, V = 20 mv/s and<br />
P.A = 100 mV. [AFB2] = 2.0 uM<br />
Effect of Hg oxidation<br />
-1240 mV , 29 nA<br />
H2 overpotential<br />
Interfered by blank<br />
( BRb pH 9.0 )<br />
3/1/2007 1st ASSESSMENT REPORT 42
Introduction Experimental Results & Discussion Problem Future Works<br />
RESULTS AND DISCUSSION…cont<br />
� Effect of scan rate (v)<br />
Ip (nA)<br />
Ep (-mV)<br />
50<br />
40<br />
30<br />
20<br />
10<br />
0<br />
1320<br />
1290<br />
1260<br />
1230<br />
0 20 40 60 80 100 120<br />
Scan rate (mV/s)<br />
0 30 60 90 120<br />
Scan rate (mV/s)<br />
V = 40 mV/s<br />
Optimum V : 40 mv/s<br />
I p = 36 nA, E p = -1256 mV<br />
Initial I p : 29 nA<br />
1) At higher v, I p decreased due to<br />
uncomplete reaction.<br />
2) Higher v caused E p linearly<br />
( R 2 = 0.9868) shifted to more<br />
negative direction.<br />
reduction reaction of AFB2 at<br />
mercury electrode prefered slow<br />
reaction<br />
3/1/2007 1st ASSESSMENT REPORT 43
Introduction Experimental Results & Discussion Problem Future Works<br />
RESULTS AND DISCUSSION…cont<br />
� Effect of accumulation time (t acc )<br />
Ip (nA )<br />
60<br />
40<br />
20<br />
0<br />
0 20 40 60<br />
Accumulation time (s)<br />
Optimum t acc : 40s<br />
Ip = 45 nA, Ep = -1256 mV<br />
Initial I p : 36 nA<br />
T acc > 40s: I p decreased due to<br />
the formation of saturated<br />
layer at mercury electrode.<br />
2. Amount of analyte (AFB2)<br />
in the bulk solution is lower<br />
due to the adsorption process<br />
at mercury electrode<br />
3/1/2007 1st ASSESSMENT REPORT 44
Introduction Experimental Results & Discussion Problem Future Works<br />
RESULTS AND DISCUSSION…cont<br />
� Effect of accumulation potential(E acc )<br />
Ip (nA )<br />
60<br />
40<br />
20<br />
0<br />
0 400 800 1200 1600<br />
Accumulation potential (-mV)<br />
Optimum E acc : -800 mv<br />
Ip = 51nA, Ep = -1248 mV<br />
Initial I p : 45 nA<br />
When:<br />
E acc = E i ( 0 mV): I p lower<br />
E acc = E f ( -1500 mV): no peak<br />
was observed<br />
At E acc = -800 mV, AFB2 maximum adsorped at mercury electrode<br />
3/1/2007 1st ASSESSMENT REPORT 45
Introduction Experimental Results & Discussion Problem Future Works<br />
RESULTS AND DISCUSSION…cont<br />
� Effect of initial potential<br />
Ip (n A )<br />
70<br />
60<br />
50<br />
40<br />
30<br />
20<br />
10<br />
0<br />
0 300 600 900 1200<br />
Ei (-mV)<br />
Optimum E i : -1000 mv<br />
I p = 53 nA, Ep = -1256 mV<br />
Initial I p : 51 nA<br />
Scanning from E i =-1000 mV increasing<br />
I p of AFB2 because it can minimised<br />
the effect of blank (which give a peak<br />
around -950mV)<br />
E i at -1000 mV will save scanning time<br />
E i = -1000 mV and E f = -1500 mV is selected as an opimum<br />
potential window.<br />
3/1/2007 1st ASSESSMENT REPORT 46
Introduction Experimental Results & Discussion Problem Future Works<br />
RESULTS AND DISCUSSION…cont<br />
� Effect of pulse amplitude (P.A)<br />
Ip (nA )<br />
80<br />
60<br />
40<br />
20<br />
0<br />
0 30 60 90 120 150<br />
Pulse amplitude (mV)<br />
Optimum P.A: 100 mv<br />
Ip = 53 nA, Ep = -1256 mV<br />
Initial I p : 53 nA (same P.A)<br />
Not selected eventhough I p<br />
increased because:<br />
a) Very small increment of I p, only<br />
1nA ( 54nA)<br />
b) Peak broader and produces<br />
higher noise level<br />
P.A =100 mV is selected as the optimum P.A<br />
3/1/2007 1st ASSESSMENT REPORT 47
Introduction Experimental Results & Discussion Problem Future Works<br />
RESULTS AND DISCUSSION…cont<br />
2.0 µM AFB2<br />
in BRB pH 9.0<br />
E i = -1000 mV, E f = -1500 mV,<br />
E acc =-800 mV, t acc = 40 s,<br />
Scan rate = 40 mV/s and<br />
P.A = 100 mV,<br />
Initial parameters<br />
E i = 0, E f = -1500 mV, E acc = 0, t acc = 15 s,<br />
scan rate = 20 mv/s and P.A = 100 mV<br />
I p = 29 nA, E p = -1240 mV<br />
Optimum parameters<br />
I p = 53 nA (↑83%) , E p = -1208 mV<br />
3/1/2007 1st ASSESSMENT REPORT 48
Introduction Experimental Results & Discussion Problem Future Works<br />
RESULTS AND DISCUSSION…cont<br />
Using lower concentration of AFB2<br />
0.06µM AFB2<br />
In BRB pH 9.0<br />
Reoptimisation steps<br />
Obtained new optimum<br />
parameters<br />
E i = -1000 mV, E f = -1400 mV,<br />
E acc =-600 mV, t acc = 80 s,<br />
s.rate = 50 mV/s and P.A = 80 mV<br />
( Final optimum parameters)<br />
Using previous optimum parameters<br />
E i = -1000 mV, E f = -1500 mV,<br />
E acc =-800 mV, t acc = 40 s,<br />
s.rate = 40 mV/s and P.A = 100 mV<br />
13.9nA, -1232 mV<br />
38.18 nA, ( ↑200%), -1220mV<br />
3/1/2007 1st ASSESSMENT REPORT 49
Introduction Experimental Results & Discussion Problem Future Works<br />
RESULTS AND DISCUSSION…cont<br />
Before optimised:<br />
E i = -1000 mV, E f = -1500 mV,<br />
E acc =-800 mV, t acc = 40 s,<br />
s.rate = 40 mV/s and P.A = 100 mV<br />
After optimised:<br />
E i = -1000 mV, E f = -1400 mV,<br />
E acc =-600 mV, t acc = 80 s,<br />
s.rate = 50 mV/s and P.A = 80 mV<br />
Optimum parameters for<br />
determination of AFB2<br />
-1232 mV, 13.90 nA<br />
-1220 mV, 38.18 nA<br />
[AFB2] = 0.06 µM<br />
3/1/2007 1st ASSESSMENT REPORT 50
Introduction Experimental Results & Discussion Problem Future Works<br />
RESULTS AND DISCUSSION…cont<br />
� Preparation of calibration curve ( AFB2 in BRB pH 9.0)<br />
E i = -1000 mV, E f = -1400 mV,<br />
E acc =-600 mV, t acc = 80 s,<br />
s.rate = 50 mV/s and P.A = 80 mV<br />
E p AFB2 (0.1 uM) = -1230 mV<br />
y = 5.55x + 3.6435<br />
R 2 = 0.9978<br />
3/1/2007 1st ASSESSMENT REPORT 51<br />
ip (nA)<br />
200<br />
150<br />
100<br />
50<br />
0<br />
0 10 20<br />
[AFB2] X10-8M<br />
30 40<br />
Linear range: 0.02 – 0.32 µM<br />
LOD: 0.0159 µM ( 5.0 ppb)<br />
Sensitivity: 0.555 µA / µM
Introduction Experimental Results & Discussion Problem Future Works<br />
RESULTS AND DISCUSSION…cont<br />
� From calibration curve:<br />
1) Precision :<br />
Determine the AFB2 with concentrations of (1) 0.06 µM and (2)<br />
0.10 µM. Calculate relative standard deviation (RSD) for each<br />
determination.<br />
( repeatibility ) ( RSD < 5%)<br />
2) Accuracy:<br />
Determine the recovery by scanning a known amount of AFB2<br />
and calculate the actual amount of AFB2 using regression<br />
equation which was obtained from the calibration curve. The<br />
obtained value is compared with amount of spiked AFB2.<br />
(recovery)<br />
3/1/2007 1st ASSESSMENT REPORT 52
Introduction Experimental Results & Discussion Problem Future Works<br />
RESULTS AND DISCUSSION…cont<br />
� Precision:<br />
(1)<br />
[AFB2] =0.06 µM, n = 8, RSD = 2.80%<br />
3/1/2007 1st ASSESSMENT REPORT 53<br />
(2)<br />
[AFB2] =0.20 µM, n = 8, RSD = 2.53%<br />
RSD = < 5%: Proposed method is high precision
Introduction Experimental Results & Discussion Problem Future Works<br />
RESULTS AND DISCUSSION…cont<br />
� Precision: (inter-day)<br />
[AFB2] = 0.1 uM<br />
Day 1<br />
Day 1: 72.70 +/- 0.521 ( 0.72% ) , n = 8<br />
Day 2: 72.22 +/- 0.533 ( 0.74% ) ,,<br />
Day 3: 72.91 +/- 0.706 ( 0.97% ) ,,<br />
Average: 72.61 +/- 0.587 ( 0.81% ) ,,<br />
High precision for intra and inter day measurements<br />
Day 2<br />
Day 3<br />
3/1/2007 1st ASSESSMENT REPORT 54
Introduction Experimental Results & Discussion Problem Future Works<br />
RESULTS AND DISCUSSION…cont<br />
� Accuracy (recovery) n = 3<br />
No of<br />
experiment<br />
1<br />
2<br />
Amount<br />
added<br />
(x 10-8M) 10.0<br />
25.0<br />
Peak<br />
current<br />
(nA)<br />
51.70<br />
52.77<br />
51.03<br />
134.4<br />
133.3<br />
135.6<br />
Amount<br />
found<br />
(x 10-8M) 8.66<br />
8.84<br />
8.55<br />
23.56<br />
23.36<br />
23.77<br />
Recovery (%)<br />
(RSD)<br />
86.83 +/- 1.46<br />
( 1.68%)<br />
94.26 +/- 0.81<br />
(0.86%)<br />
3/1/2007 1st ASSESSMENT REPORT 55
Introduction Experimental Results & Discussion Problem Future Works<br />
RESULTS AND DISCUSSION…cont<br />
� Application to determine AFG2, AFB1 and AFG1<br />
AFG2, AFB1 and AFG1 :<br />
CV � In BRB pH 9.0, all aflatoxins are reduced at mercury electrode<br />
produced single cathodic peak and the reactions are irreversible. Diffusion<br />
currents are effected by adsorption process at electrode surface<br />
=AFB2<br />
DPCSV � used the same optimum parameters as used for AFB2 to<br />
determine AFG2, AFB1 dan AFG1<br />
3/1/2007 1st ASSESSMENT REPORT 56
Introduction Experimental Results & Discussion Problem Future Works<br />
RESULTS AND DISCUSSION…cont<br />
Voltammograms of AFB1 (A), AFB2 (B), AFG1 (C) and AFG2 (D)<br />
obtained from individual measurement at concentration of 0.1 uM<br />
in BRB pH 9.0<br />
E i =-1000 mV ( except for AFG1 = -950 mV), E f = -1400 mV,<br />
E acc = -600 mV, t acc = 80 s, v = 50 mV/s and p.amplitude = 80 mV<br />
(A) AFB1 = -1220 mV ( 62.57 nA ), (B) AFB2 = -1230 mV ( 63.79 nA )<br />
(C) AFG1 = -1150 mV ( 62.29 nA ), (D) AFG2 = -1170 mV ( 63.14 nA )<br />
3/1/2007 1st ASSESSMENT REPORT 57
Introduction Experimental Results & Discussion Problem Future Works<br />
RESULTS AND DISCUSSION…cont<br />
� AFG2:<br />
Ip (nA)<br />
300<br />
250<br />
200<br />
150<br />
100<br />
50<br />
0<br />
0 10 20 30 40 50 60 70 80 90<br />
[AFG2] / X10-8M<br />
y = 6.3464x + 9.8329<br />
R 2 = 0.999<br />
3/1/2007 1st ASSESSMENT REPORT 58<br />
E p = -1170mV<br />
Saturation effect at electrode surface<br />
Ip (nA)<br />
200<br />
150<br />
100<br />
50<br />
0<br />
0 5 10 15 20 25 30 35<br />
[AFB2]X10-8M<br />
y = 6.346x + 9.8329 ( R =0.9990)<br />
Linear range: 0.024 uM – 0.288 uM<br />
LOD: 0.0160 uM (5.28 ppb)<br />
Sensitivity: 0.635 uA/uM<br />
Ei = -1000 mV, Ef = -1400 mV,<br />
Eacc =-600 mV, tacc = 80 s,<br />
s.rate = 50 mV/s and P.A = 80 mV
Introduction Experimental Results & Discussion Problem Future Works<br />
RESULTS AND DISCUSSION…cont<br />
� AFB1<br />
Ip (n A )<br />
300<br />
250<br />
200<br />
150<br />
100<br />
50<br />
0<br />
0 10 20 30 40 50 60 70 80 90 100<br />
[AFB1]X10-8M<br />
Ip (nA)<br />
y = 4.4296x + 3.0034<br />
R 2 = 0.9972<br />
3/1/2007 1st ASSESSMENT REPORT 59<br />
250<br />
200<br />
150<br />
100<br />
50<br />
0<br />
0 10 20 30 40 50<br />
[AFB1]X10-8M<br />
Y = 4.4296x + 3.0034 ( R =0.9972)<br />
Linear range : 0.0321 uM – 0.5778 uM<br />
LOD: 0.0161 uM ( 5.00 ppb)<br />
Sensitivity: 0.443 uA/uM<br />
Parameters for AFB1 = AFG2 = AFB2<br />
E p = -1220 mV
Introduction Experimental Results & Discussion Problem Future Works<br />
RESULTS AND DISCUSSION…cont<br />
� AFG1<br />
Ip (nA)<br />
200<br />
175<br />
150<br />
125<br />
100<br />
75<br />
50<br />
25<br />
0<br />
0 10 20 30 40 50 60<br />
[AFG1] X 10-8M<br />
y = 5.5958x + 3.7725<br />
R 2 = 0.998<br />
3/1/2007 1st ASSESSMENT REPORT 60<br />
Ip (nA)<br />
160<br />
140<br />
120<br />
100<br />
80<br />
60<br />
40<br />
20<br />
0<br />
0 5 10 15 20 25 30<br />
[AFG1]X10-8M<br />
y = 5.5958x + 3.7725<br />
Linear range: 0.02 uM – 0.260 uM<br />
LOD: 0.0150 uM ( 4.92 ppb)<br />
Sensitivity: 0.560 uA/uM<br />
Ei = -950 mV, Ef = -1400 mV,<br />
Eacc =-600 mV, tacc = 80 s,<br />
s.rate = 50 mV/s and P.A = 80 mV Ep = -1150mV
Introduction Experimental Results & Discussion Problem Future Works<br />
RESULTS AND DISCUSSION…cont<br />
� Voltammograms of AFG1<br />
E i = -950 mV, E f = -1400 mV,<br />
E acc =-600 mV, t acc = 80 s,<br />
s.rate = 50 mV/s and P.A = 80 mV<br />
E p AFG1 (0.1 uM) = -1150 mV<br />
y = 5.5958x + 3.7725<br />
R 2 = 0.998<br />
3/1/2007 1st ASSESSMENT REPORT 61<br />
Ip (nA)<br />
160<br />
140<br />
120<br />
100<br />
80<br />
60<br />
40<br />
20<br />
0<br />
0 5 10 15 20 25 30<br />
[AFG1]X10-8M<br />
y = 5.5958x + 3.7725<br />
R = 0.9980
Aflatoxin<br />
AFB1<br />
AFB2<br />
AFG1<br />
AFG2<br />
Introduction Experimental Results & Discussion Problem Future Works<br />
RESULTS AND DISCUSSION…cont<br />
� AFB1, AFB2, AFG1 dan AFG2:<br />
E p (mV) *<br />
-1220<br />
-1230<br />
-1150<br />
-1170<br />
Y = mx + c<br />
(y = nA, x = x 10 -8 M,<br />
c = nA)<br />
Y = 4.4296x + 3.0034<br />
Y =5.5500x + 3.6435<br />
Y = 5.5958x + 3.7725<br />
Y = 6.3464x + 9.8329<br />
Sensitivity<br />
(uA/uM)<br />
0.443<br />
0.555<br />
0.560<br />
0.635<br />
* [aflatoxins] = 0.1 uM<br />
1.606/<br />
5.00<br />
1.580/<br />
5.00<br />
1.500/<br />
4.92<br />
1.600/<br />
5.28<br />
Linear range<br />
(x 10-8M) /<br />
ppb<br />
3.00 – 45.00/<br />
10 - 150<br />
2.00 – 32.00/<br />
6 - 100<br />
2.00 – 26.00/<br />
6 - 90<br />
2.00 – 29.00/<br />
6 -96<br />
0.9972<br />
0.9976<br />
0.9980<br />
0.9990<br />
3/1/2007 1st ASSESSMENT REPORT 62<br />
LOD<br />
( x 10 -8 M)/<br />
ppb<br />
R 2
Introduction Experimental Results & Discussion Problem Future Works<br />
CONCLUSION<br />
� From the CV study, AFB1, AFB2, AFG1<br />
and AFG2 have reduced at a mercury<br />
electrode which produced diffusion<br />
current that controlled by adsorption<br />
process at electrode surface. The<br />
reduction reaction was totally irreversible<br />
and prefered the slow reaction.<br />
3/1/2007 1st ASSESSMENT REPORT 63
Introduction Experimental Results & Discussion Problem Future Works<br />
CONCLUSION…cont<br />
� From the DPCSV, in BRB pH 9.0, AFB1,<br />
AFB2, AFG1, AFG2 have reduced at<br />
peak potentials of -1220 mV, -1230 mV, -<br />
1150 mV and -1170 mV ( versus<br />
Ag/AgCl) respectively.<br />
� The proposed method provides high<br />
precision and accuracy for determination<br />
of AFB2.<br />
3/1/2007 1st ASSESSMENT REPORT 64
Introduction Experimental Results & Discussion Problem Future Works<br />
PROBLEMS<br />
1. Blank BRB pH 9.0 gives a peak ( around -950 mV to -1100 mV)<br />
with unconsistent I p (15 nA – 40 nA)<br />
(a)<br />
E i = 0, E f = -1500 mv<br />
E acc = 0 t acc = 20 s<br />
E i = 0, E f = -1500 mv<br />
E acc = 0 t acc = 20 s<br />
E i = -1000 mv, E f = -1400 mv<br />
E acc = -600 mv t acc = 80 s<br />
3/1/2007 1st ASSESSMENT REPORT 65<br />
(b)<br />
(c)
Introduction Experimental Results & Discussion Problem Future Works<br />
PROBLEMS…cont<br />
2. Initial analysis of mixing aflatoxins sample:<br />
: AFB2 + AFG2 � 1 overlap peak<br />
: AFB1+ AFB2 � 1 overlap peak<br />
3. Initial analysis of real sample (uncontaminated<br />
green nut powder ):<br />
The sample supress AFB2 standard peak<br />
almost 50%. ( recovery: 50%)<br />
3/1/2007 1st ASSESSMENT REPORT 66
Introduction Experimental Results & Discussion Problem Future Works<br />
FUTURE WORKS<br />
� Further study on suitable technique to<br />
reduce LOD / enhance sensitivity.<br />
� Analysis of accuracy ( recovery) at interday<br />
for AFB2.<br />
� Analysis of precision and accuracy at<br />
intra-day and inter-day for AFG2, AFB1<br />
dan AFG1<br />
3/1/2007 1st ASSESSMENT REPORT 67
Introduction Experimental Results & Discussion Problem Future Works<br />
FUTURE WORKS…cont<br />
�Complexing of aflatoxin for the<br />
selectivity of analysis.<br />
�Study interference effect;<br />
1. Analysis the mixing of aflatoxins<br />
sample.<br />
2. Standard aflatoxin solution will be<br />
mixed with other ketone compounds.<br />
3/1/2007 1st ASSESSMENT REPORT 68
Introduction Experimental Results & Discussion Problem Future Works<br />
FUTURE WORKS…cont<br />
� Study the stability of aflatoxins ( shelf life<br />
study) and the effect of exposure time to the<br />
aflatoxins peak current ( aflatoxins will be left<br />
in voltammetric cell subject to the laboratory<br />
conditions for 8 hrs and measurement will be<br />
carried out for every hour)<br />
� Study other type of working electrodes such as<br />
carbon paste and screen printed electrodes.<br />
� Robustness test of the proposed method.<br />
3/1/2007 1st ASSESSMENT REPORT 69
Introduction Experimental Results & Discussion Problem Future Works<br />
FUTURE WORKS…cont<br />
� Analysis an artificially and real<br />
contaminated samples.<br />
� Compare the results with that obtained<br />
using accepted technique such as<br />
HPLC-FD.<br />
3/1/2007 1st ASSESSMENT REPORT 70
Introduction Experimental Results & Discussion Problem Future Works<br />
1) Determination of<br />
AFB1, AFB2, AFG1<br />
and AFG2<br />
1a) Prepare<br />
calibration curve<br />
1b) Determine<br />
analytical parameters<br />
2) Interference study<br />
3) Complexing of<br />
aflatoxins study<br />
FUTURE WORKS…cont<br />
Activity 2003<br />
J F M A M J J O<br />
3/1/2007 1st ASSESSMENT REPORT 71<br />
S<br />
O<br />
N<br />
finished<br />
D
Introduction Experimental Results & Discussion Problem Future Works<br />
1) Determination of mixing<br />
aflatoxins<br />
2)Determination of aflatoxins<br />
in artificially contaminated<br />
samples<br />
3)Determination of aflatoxins<br />
in real samples<br />
4)Determination by HPLC<br />
5) Study using different<br />
working electrodes<br />
5) Comparison study<br />
6) Thesis writting up<br />
1) Analysis of contaminated<br />
food samples<br />
2) Thesis writting up<br />
FUTURE WORKS…cont<br />
Activity 2004<br />
J F M A M J J O<br />
Activity 2005<br />
3/1/2007 1st ASSESSMENT REPORT 72<br />
S<br />
O<br />
N<br />
D
Introduction Experimental Results & Discussion Problem Future Works<br />
WHAT EXPERTS SAID ABOUT VOLTAMMETRY?<br />
Prof Barek (2001):<br />
“Polarographic and voltammetric methods can play a useful role<br />
in the analysis as an alternative to chromatographic and<br />
spectrophotometric techniques, however, their relationship to<br />
other methods is complimentry rather than competitive”<br />
Prof Wang (1999):<br />
“Stripping analysis to the 21th century: faster, smaller,<br />
cheaper, simpler and better”.<br />
Jaroslav Heyrovsky (1890-1967)<br />
Hopefully this will come true!!!<br />
3/1/2007 1st ASSESSMENT REPORT 73
Introduction Experimental Results & Discussion Problem Future Works<br />
ACKNOWLEDGEMENT<br />
SUPERVISOR:<br />
AP DR ABDUL RAHIM MOHD YUSOFF<br />
CO-SUPERVISORS:<br />
1. PROF RAHMALAN AHAMAD<br />
2. DR ABD. RAHIM YAACOB<br />
STAFF OF CHEMISTRY DEPT, UTM<br />
CHEM. DEPT, MOSTE ( EN.RODWAN )<br />
ELECTROANALYSIS GROUP,<br />
CHEM. DEPT, UTM<br />
USM ( STUDY LEAVE UNDER<br />
ASHES)<br />
3/1/2007 1st ASSESSMENT REPORT 74
Introduction Experimental Results & Discussion Problem Future Works<br />
THANK YOU<br />
Wassalam<br />
Mohd Hadzri, Hadzri<br />
PPSains Kesihatan<br />
20 Ogos 2003/<br />
22 Rejab 1424H<br />
3/1/2007 1st ASSESSMENT REPORT 75
Introduction Experimental Results & Discussion Problem Future Works<br />
3/1/2007 1st ASSESSMENT REPORT 76
Introduction Experimental Results & Discussion Problem Future Works<br />
3/1/2007 1st ASSESSMENT REPORT 77
Introduction Experimental Results & Discussion Problem Future Works<br />
LOD DETERMINATION<br />
LOD = limit of detection<br />
LOD of an analyte is the concentration<br />
which gives an instrumental signal (y)<br />
significantly different from the blank or<br />
background signal<br />
( Miller J. C. and Miller J. N. 1993)<br />
3/1/2007 1st ASSESSMENT REPORT 78
Introduction Experimental Results & Discussion Problem Future Works<br />
LOD DETERMINATION…cont<br />
� By Barek’s and Miller’s methods<br />
� Barek’s method: a) experiment<br />
b) graph<br />
1a) Experiment:<br />
By standard addition of lower<br />
concentration of analyte until obtaining<br />
the sample response that is significantly<br />
difference from blank signal<br />
3/1/2007 1st ASSESSMENT REPORT 79
Introduction Experimental Results & Discussion Problem Future Works<br />
LOD DETERMINATION…cont<br />
� 1b)By graph: The limit of determination<br />
was calculated as the tenfold standard<br />
deviation from seven analyte<br />
determinations at the concentration<br />
corresponding to the lowest point on<br />
the appropriate calibration straight line<br />
� Miller’s method: By graph; 3SD/b<br />
3/1/2007 1st ASSESSMENT REPORT 80
Introduction Experimental Results & Discussion Problem Future Works<br />
Aflatoxin<br />
AFB1<br />
AFB2<br />
AFG1<br />
AFG2<br />
LOD DETERMINATION…cont<br />
x 10 -8 M<br />
1.606<br />
1.580<br />
1.500<br />
1.600<br />
By Barek’s Method<br />
Experiment<br />
ppb<br />
5.00<br />
5.00<br />
4.92<br />
5.28<br />
x 10 -8 M<br />
2.160<br />
1.837<br />
2.050<br />
1.345<br />
Graph<br />
ppb<br />
6.70<br />
5.77<br />
6.72<br />
4.44<br />
By Miller’s<br />
Method<br />
Graph; 3SD/b<br />
x 10 -8 M<br />
45.36<br />
28.59<br />
23.88<br />
27.47<br />
ppb<br />
141.5<br />
89.0<br />
78.33<br />
90.67<br />
3/1/2007 1st ASSESSMENT REPORT 81
Introduction Experimental Results & Discussion Problem Future Works<br />
BLANK PEAK PROBLEM<br />
� Attempt to illiminate;<br />
1. Used dionised water from different lab;<br />
(Analytical, biological, FKKKSA,<br />
Biotechnology) and R.O water from<br />
personal used….failed<br />
3/1/2007 1st ASSESSMENT REPORT 82
Introduction Experimental Results & Discussion Problem Future Works<br />
BLANK PEAK PROBLEM…cont<br />
2. Add 1.0 M HCl … failed<br />
3. Add 1.0 M EDTA…failed<br />
4. Used different voltammetry model<br />
(Metrohm) peak still existed<br />
3/1/2007 1st ASSESSMENT REPORT 83
Introduction Experimental Results & Discussion Problem Future Works<br />
STABILITY STUDY OF AFLATOXINS<br />
� AFB1, hour to hour stability study<br />
Ip (nA )<br />
60<br />
58<br />
56<br />
54<br />
52<br />
50<br />
Stability study of AFB1 in BRb pH=9.0<br />
[AFB1] = 10 x 10-8M<br />
0 1 2 3 4 5 6 7 8<br />
Standing time (hrs)<br />
I p=58.53 +/- 0.62 nA<br />
( 1.06%)<br />
3/1/2007 1st ASSESSMENT REPORT 84
Introduction Experimental Results & Discussion Problem Future Works<br />
STABILITY STUDY OF AFLATOXINS…cont<br />
� AFB2, hour to hour stability study<br />
Ip (nA)<br />
73.5<br />
73<br />
72.5<br />
72<br />
71.5<br />
71<br />
70.5<br />
70<br />
Stability study of AFB2 in BRB pH 9.0<br />
[AFB2] =12 x 10-8M<br />
1 2 3 4 5 6 7 8 9<br />
Standing time (hrs)<br />
I p = 72.74 +/- 0.94<br />
( 1.29 % )<br />
3/1/2007 1st ASSESSMENT REPORT 85
Introduction Experimental Results & Discussion Problem Future Works<br />
CV OF AFB1<br />
� Cyclic voltammogram of AFB1 in BRB pH 9.0,<br />
scan rate 200 mV/s<br />
I p = 50 nA, E p = -1305 mV<br />
3/1/2007 1st ASSESSMENT REPORT 86
Introduction Experimental Results & Discussion Problem Future Works<br />
CV OF AFG1<br />
� Cyclic voltammogram of AFG1 in BRB pH 9.0,<br />
scan rate 200 mV/s<br />
I p = 48 nA, E p = -1245 mV<br />
3/1/2007 1st ASSESSMENT REPORT 87
Introduction Experimental Results & Discussion Problem Future Works<br />
CV OF AFG2<br />
� Cyclic voltammogram of AFG2 in BRB pH 9.0,<br />
scan rate 200 mV/s<br />
I p = 52 nA, E p = -1254 mV<br />
3/1/2007 1st ASSESSMENT REPORT 88
Introduction Experimental Results & Discussion Problem Future Works<br />
VOLTAMMOGRAMS OF AFB2<br />
� DPSV voltammograms of AFB2 in BRB pH<br />
9.0 (blank), scan rate 50 mV/s<br />
AFB2 ( 2.0 uM )<br />
Blank, BRB pH 9.0<br />
3/1/2007 1st ASSESSMENT REPORT 89
Introduction Experimental Results & Discussion Problem Future Works<br />
VOLTAMMOGRAMS OF STD AFB2 AND REAL SAMPLE<br />
USED OPTIMISED PARAMETERS FOR AFB2<br />
AFB2, 0.07 uM<br />
( 35.83 nA, -1240 mV<br />
AFB2 + REAL SAMPLE<br />
( 16.90 nA, -1245 mV)<br />
BLANK<br />
REAL SAMPLE: EXTRACT FROM GREEN NUT POWDER<br />
3/1/2007 1st ASSESSMENT REPORT 90
Introduction Experimental Results & Discussion Problem Future Works<br />
VOLTAMMOGRAM OF MIXED AFLATOXINS<br />
� AFG2 + AFB2<br />
0.1 uM AFG2 ( before mix)<br />
( 64 nA, -1170 mV)<br />
+ 0.1 uM AFB2 ( 61.5 nA, -1170mV)<br />
+ 0.2 uM AFB2 (60.8 nA, -1200 mV)<br />
3/1/2007 1st ASSESSMENT REPORT 91
Introduction Experimental Results & Discussion Problem Future Works<br />
VOLTAMMOGRAM OF MIXED AFLATOXINS…cont<br />
� AFG2 + AFB2<br />
+ 0.3 uM AFB2<br />
( 76 nA, -1210)<br />
+ 0.4 uM AFB2<br />
( 79 nA, -1210 mV)<br />
3/1/2007 1st ASSESSMENT REPORT 92
Introduction Experimental Results & Discussion Problem Future Works<br />
VOLTAMMOGRAM OF MIXED AFLATOXINS…cont<br />
0.1 uM AFG2 ( before mixed): -1170 mV, 64.0 nA<br />
+ 0.05 uM AFB2: -1170 mV, 62.7 nA<br />
+ 0.10 uM AFB2: -1170 mV, 61.5 nA<br />
+ 0.15 uM AFB2: -1170 mV, 58.2 nA<br />
+ 0.20 uM AFB2: -1200 mV, 60.8 nA<br />
+ 0.25 uM AFB2: -1210 mV, 69.9 nA<br />
+ 0.30 uM AFB2: -1210 mV, 76.0 nA<br />
+ 0.35 uM AFB2: -1210 mV, 79.0 nA<br />
+ 0.40 uM AFB2: -1210 mV, 79.0 nA<br />
3/1/2007 1st ASSESSMENT REPORT 93
Introduction Experimental Results & Discussion Problem Future Works<br />
3/1/2007 1st ASSESSMENT REPORT 94
WILL BE<br />
PRESENTED FOR<br />
PhD VIVA<br />
PRESENTATION<br />
3/1/2007 PhD viva presentation
STRIPPING VOLTAMMETRIC<br />
METHOD TO DETERMINE<br />
AFLATOXIN COMPOUNDS<br />
BY<br />
MOHAMAD HADZRI YAACOB<br />
PS 023001
Mycotoxin group<br />
Produced by two fungi;<br />
Aspergillus spergillus flavus flavus<br />
and<br />
Aspergillus parasiticus<br />
Types of aflatoxins: aflatoxins<br />
INTRODUCTION<br />
AFB1, AFB2, AFG1, AFG2<br />
AFM1 and AFM2<br />
3/1/2007 PhD viva presentation<br />
Aspergillus spergillus flavus flavus<br />
Contaminated<br />
corn
INTRODUCTION…cont<br />
Chemical structures;<br />
AFB1<br />
O<br />
O<br />
O<br />
AFG1<br />
O<br />
O<br />
O<br />
O<br />
3/1/2007 PhD viva presentation<br />
O<br />
O<br />
O O<br />
O<br />
O<br />
O<br />
O<br />
AFB2<br />
O<br />
AFG2<br />
O<br />
O<br />
O<br />
O<br />
O<br />
O<br />
O<br />
O O<br />
O
OBJECTIVE<br />
• To study electroanalytical properties of aflatoxin<br />
compounds (AFB1, AFB2, AFG1 and AFG2) at<br />
the working electrode.<br />
• To develop a new alternative technique for high<br />
sensitive determination of aflatoxin compounds<br />
3/1/2007 PhD viva presentation
SCOPE OF STUDY<br />
• Studies on the voltammetric behaviour of<br />
aflatoxins using cyclic voltammetric (CV)<br />
technique.<br />
• Studies on the differential pulse cathodic and<br />
anodic stripping voltammetry of all aflatoxins<br />
and parameters optimisation<br />
• Studies on the effect of increasing concentration<br />
of the aflatoxins to their peak height<br />
3/1/2007 PhD viva presentation
SCOPE OF STUDY…cont<br />
• Interference studies by metal ions and organic<br />
compounds<br />
• Studies on the square wave stripping voltammetry<br />
technique for the determination of aflatoxin<br />
compounds<br />
• Application of the proposed methods for the<br />
determination of aflatoxin compounds in real samples.<br />
The results were compared with HPLC results<br />
• Stability studies of aflatoxin solutions<br />
3/1/2007 PhD viva presentation
RESULTS AND DISCUSSION<br />
• By CV technique;<br />
�� Britton Robinson<br />
Buffer (BRB) at pH 9.0<br />
was the best supporting<br />
electrolyte<br />
For 0.6 µM AFB1;<br />
pH = 9.0, Ip = 24.5 nA<br />
I p (nA)<br />
3/1/2007 PhD viva presentation<br />
30<br />
25<br />
20<br />
15<br />
10<br />
5<br />
0<br />
5 6 7 8 9 10 11 12 13<br />
pH of BRB
RESULTS AND DISCUSSION…cont<br />
• Suggested mechanism (Smyth et al.,1979) al., 1979)<br />
2<br />
O<br />
O<br />
OCH 3<br />
3/1/2007 PhD viva presentation<br />
O<br />
2e -<br />
2<br />
O<br />
O<br />
OCH 3<br />
2 H 2O<br />
Dimer + 2 OH -<br />
O
RESULTS AND DISCUSSION…cont<br />
�� All aflatoxin compounds are undergo irreversible<br />
reduction reaction at mercury electrode<br />
For 1.3 µM M AFB2;<br />
Ip = 30 nA<br />
Ep = -1.315 1.315 V (Ag/AgCl (Ag/ AgCl)<br />
3/1/2007 PhD viva presentation
RESULTS AND DISCUSSION…cont<br />
�� All aflatoxin compounds adsorb on the surface of the mercury<br />
electrode.<br />
Repetitive CV; Ip increased with the number of cycle<br />
3/1/2007 PhD viva presentation<br />
I p (nA)<br />
60<br />
50<br />
40<br />
30<br />
20<br />
10<br />
0<br />
1 2 3 4 5<br />
No of cycle
RESULTS AND DISCUSSION…cont<br />
• From DPCSV experiment<br />
�� Optimised parameters:<br />
Ei = -1.0 1.0 V (except for AFG1; -0.95 0.95 V), Ef = -1.4 1.4 V, Eacc acc<br />
= -0.6 0.6 V, tacc = 80 s, scan rate = 50 mV/s and pulse<br />
amplitude = 80 mV.<br />
0.06 0.06 µM µM AFB2 0.06 µM AFB2 in BRB at<br />
AFB2<br />
pH 9.0<br />
3/1/2007 PhD viva presentation<br />
(a) Unoptimised<br />
(b)Optimised
RESULTS AND DISCUSSION…cont<br />
�� Method validation<br />
AFB1 AFB2 AFG1 AFG2<br />
LOD/ppb 1.56 2.50 3.28 2.50<br />
LOQ/ppb 5.20 8.33 10.93 8.33<br />
Linearity Range/ ppb<br />
6 – 100 6 – 100 6 – 105 6 – 105<br />
R2 0.9989 0.9980 0.9992 0.9989<br />
3/1/2007 PhD viva presentation
RESULTS AND DISCUSSION…cont<br />
��Method Method validation<br />
Accuracy:<br />
% Recovery > 95% �� High accuracy<br />
Precision:<br />
%RSD for n = 8 < 3.0% �� High precsion<br />
3/1/2007 PhD viva presentation
RESULTS AND DISCUSSION…cont<br />
Robustness;<br />
Small influences of important conditions (pH of BRB,<br />
Eacc acc and tacc ) were not significantly affect the peak<br />
height � Method is robust<br />
Ruggedess;<br />
No significant different in the peak heights obtained by<br />
using two different voltammetric analysers (BAS vs<br />
Metrohm) � Method is rugged<br />
3/1/2007 PhD viva presentation
RESULTS AND DISCUSSION…cont<br />
• Interference studies;<br />
Metal ions (Al, Cu, Pb, Pb,<br />
Ni and Zn) and organic<br />
compounds (ascorbic acid, β-cyclodextrin cyclodextrin and L-<br />
cysteine) cysteine)<br />
were not interfere up to 10 times<br />
concentration as compared with aflatoxin<br />
compounds<br />
3/1/2007 PhD viva presentation
RESULTS AND DISCUSSION…cont<br />
Using SWSV technique<br />
• For all aflatoxins, aflatoxins,<br />
the peak heights were<br />
increased > 10 times �� More sensitive<br />
• Analysis can be completed within a few second<br />
�� Faster technique<br />
• LOD and LOQ lower than DPCSV technique<br />
�� More sensitive<br />
3/1/2007 PhD viva presentation
RESULTS AND DISCUSSION…cont<br />
• Voltammograms of aflatoxins (DPCSV vs SWSV)<br />
AFB1 AFB2 AFG1 AFG2<br />
<strong>Text</strong>: page no - 191<br />
3/1/2007 PhD viva presentation
RESULTS AND DISCUSSION…cont<br />
• From stability studies;<br />
10 ppm aflatoxin stock solutions (in benzene:acetonitrile,<br />
benzene:acetonitrile,<br />
98%) stored in the dark and cool condition: stable up to 1<br />
year.<br />
1 ppm aflatoxin standard solutions (in BRB pH 9.0 ) stored<br />
in the dark and cool conditions: stable up to 3 months for<br />
AFB1 and AFB2 while for AFG1 and AFG2 stable up to 2<br />
months..<br />
3/1/2007 PhD viva presentation
RESULTS AND DISCUSSION…cont<br />
1 ppm aflatoxins in BRB pH 9.0 exposed to<br />
normal laboratory condition; AFB1 and AFB2<br />
were stable up to 8 hrs but for AFG1 and AFG2<br />
were stable up to 3 hrs.<br />
Aflatoxin prepared in basic condition were less<br />
stable as compared to those prepared in acidic<br />
and neutral media.<br />
3/1/2007 PhD viva presentation
RESULTS AND DISCUSSION…cont<br />
• Analysis real sample (groundnuts)<br />
Followed extraction and clean-up clean up procedure as applied by<br />
Chem. Dept. MOSTI.<br />
Recovery studies: studies:<br />
Aflatoxins standard solutions were<br />
spiked into the groundnut eluates; eluates<br />
80-99% 80 99% for 1 st day analysis, 80 -90% 90% for 2 nd day and 75- 75<br />
85% for 3 rd day analysis.<br />
3/1/2007 PhD viva presentation
RESULTS AND DISCUSSION…cont<br />
• Analysis of 15 samples by DPCSV, SWSV and HPLC (result: total<br />
aflatoxins in ppb level)<br />
Sample DPCSV SWSV HPLC Notes<br />
S01 12.73 13.02 14.34 -ve ve<br />
S02 7.12 8.36 8.83 -ve ve<br />
S03 n.d n.d 0.50 -ve ve<br />
S04 21.46 29.72 19.08 +ve ve<br />
3/1/2007 PhD viva presentation
RESULTS AND DISCUSSION…cont<br />
Sample DPCSV SWSV HPLC Notes<br />
S05 9.90 8.95 5.34 -ve ve<br />
S06 n.d n.d n.d -ve ve<br />
S07 5.90 8.17 3.67 -ve ve<br />
S08 n.d n.d n.d -ve ve<br />
3/1/2007 PhD viva presentation
RESULTS AND DISCUSSION…cont<br />
Sample DPCSV SWSV HPLC Notes<br />
S09 n.d n.d 1.84 -ve ve<br />
S10 31.93 35.63 36.00 +ve ve<br />
S11 n.d n.d 0.42 -ve ve<br />
S12 n.d n.d 1.75 -ve ve<br />
3/1/2007 PhD viva presentation
RESULTS AND DISCUSSION…cont<br />
Sample DPCSV SWSV HPLC Notes<br />
S13 10.76 9.21 8.25 -ve ve<br />
S14 n.d n.d n.d -ve ve<br />
S15 n.d n.d n.d -ve ve<br />
+ve ve : > 15 ppb ( 2 out of 15 samples: 13%)<br />
3/1/2007 PhD viva presentation
CONCLUSIONS<br />
The study has achieved the objective;<br />
A sensitive, accurate, robust, rugged, fast and<br />
low cost technique was successfully developed<br />
and applied for the determination of aflatoxins<br />
in groundnut samples<br />
The hypothesis regarding electroanalytical<br />
properties of aflatoxins was also proven.<br />
3/1/2007 PhD viva presentation
SUGGESTIONS<br />
• Use other types of the working electrode (CPE,<br />
GCE or BFE)<br />
• Study the reagents that can be complexed with<br />
aflatoxins<br />
• Study the effect of storage time and conditions<br />
of groundnuts to the level of aflatoxins<br />
• Analyse aflatoxins in other type of samples (rice,<br />
bread, fish, vegetables and cigarretes tobacco)<br />
using the proposed technique.<br />
3/1/2007 PhD viva presentation
ACKNOWLEDGEMENT<br />
• Supervisors: AP Dr Abdull Rahim Hj. Hj.<br />
Mohd. Mohd.<br />
Yusoff and Prof Rahmalan Ahamad<br />
• USM: study leave and fellowship<br />
• UTM: Short term grant (Vot ( Vot No: 75152/2004)<br />
• Chemistry Dept staff<br />
3/1/2007 PhD viva presentation
3/1/2007 PhD viva presentation
ORAL PRESENTED AT<br />
KUSTEM 3 rd ANNUAL<br />
SEMINAR ON<br />
SUSTAINABLE SCIENCE<br />
AND MANAGEMENT<br />
(TERENGGANU; 4 - 5 th<br />
MAY 2004)
CYCLIC VOLTAMMETRIC STUDY OF<br />
AFLATOXIN G1 (AFG1) AT THE MERCURY<br />
ELECTRODE<br />
BY<br />
Mohd Hadzri Yaacob, Abd.Rahim Yusoff and<br />
Rahmalan Ahamad<br />
UTM, SKUDAI
• INTRODUCTION<br />
• OBJECTIVE<br />
• EXPERIMENTAL<br />
• RESULTS AND<br />
DISCUSSION<br />
• CONCLUSION<br />
TOPICS FOR DISCUSSION<br />
• ACKNOWLEDGEMENT<br />
AFLATOXINS
• AFLATOXINS:<br />
Mycotoxin group.<br />
Produced by two fungi;<br />
Types of aflatoxins:<br />
AFB1, AFB2, AFG1<br />
and AFG2:<br />
AFM1 and AFM2<br />
INTRODUCTION<br />
Aspergillus flavus Aspergillus parasiticus<br />
Raw peanuts, peanuts products, wheat,<br />
maize, corn, vegetable oils, dried fruites,<br />
barley, pear, cocoa, coffee, herbs, spices,<br />
wine, cottonseeds.<br />
Cow milk and its products, eggs<br />
and meat product
INTRODUCTION …cont<br />
• AFLATOXINS:<br />
Occurs naturally in commodities used for animal and<br />
human<br />
Carcinogenic, teratogenic and mutagenic<br />
IARC (1988): Class I carcinogenic materials<br />
Dangerous to health: causes aflatoxicosis disease.<br />
Effect the economy of commodities export countries
AFLATOXIN G1 ( AFG1):<br />
Chemical and physical properties<br />
O<br />
O<br />
O<br />
O<br />
O O<br />
O<br />
Chemical name: 3,4,7a, 10a-tetrahydro-5-methoxy-1H,<br />
12H furo[3’,2’:4,5]furo[2,3-h]pyrano[3,4-c][l]-benzopyran-<br />
1,12-dione<br />
Yellowish crystal.<br />
C 17 H 12 O 7<br />
MW = 328<br />
Odorless, tasteless and colorless solution ( in organic<br />
solvent).
AFLATOXIN G1 ( AFG1):<br />
Chemical and physical properties…cont<br />
Solubility: Dissolve in methanol, water:acetonitrile (9:1),<br />
trifluoroactic acid, DMSO and acetone. In water: 10-20 mg /<br />
liter<br />
m.p; 244 – 246 0 C<br />
Produces green color under UV light<br />
UV abs (max) in methanol: 216, 242, 265 and 362 nm<br />
IR spectrum ( in chloroform): 1760, 1695, 1630 and 1595<br />
cm -1
Stability of AFG1<br />
In crystal form: extremely stable in the absence of<br />
light or UV radiation, even at T = > 100 0 C<br />
Solution in water, DMSO, 95% acetone or ethanol<br />
stable for 24 hrs under normal condition. Stable for<br />
years if kept in cool and dark place<br />
Stable in most food process; not destroy by normal<br />
cooking process since it heat stable
ELECTROCHEMICAL PROPERTIES OF AFG1<br />
Based on chemical structure:<br />
Ketone groups in lactone ring can be reduced and<br />
produce cathodic wave.<br />
Unsaturated terminal furan ring can be reduced<br />
and produce cathodic wave.<br />
O<br />
O<br />
O<br />
O<br />
O O<br />
O<br />
Can forms<br />
anionic<br />
radical
WHAT AND WHY CYLIC VOLTAMMETRY (CV)?<br />
CV: Voltammetric technique that consist of scanning<br />
linearly the potential of a stationary working electrode<br />
( forward and reverse ) and the current flowing through<br />
the cell is measured as a function of that potential.<br />
Three parameters needed to be characteristiced; starting<br />
potential of the scan, finishing / switching potential and<br />
scan rate ( rate of change of potential with the time)<br />
A plot of current as a function of applied potential is<br />
called a voltammogram ( as in figure below)
Typical cyclic voltammogram for a reversible redox<br />
process<br />
O = oxidised form R = reduced form
Why CV?<br />
1. To aquire qualitative information about<br />
electrochemical reactions<br />
2. Ability to rapidly provide information on;<br />
@ thermodynamic of redox process<br />
@ the kinetic of heterogeneous electron-transfer<br />
@ coupled chemical reactions<br />
@ adsorption processes at electrode surface<br />
3. Offer a rapid location of redox potentials of the<br />
electroactive species and convenient for evaluation<br />
of the effect of media upon the redox process<br />
� Initial experiment performed in electroanalytical<br />
study
OBJECTIVE<br />
1) To get information about electrochemical<br />
properties of aflatoxin G1 (AFG1) on the mercury<br />
electrode.<br />
2) From this information, other voltammetric<br />
technique can be developed ( such as differential<br />
pulse stripping voltammetric ) for quantitatively<br />
determination of AFG1 ( AFG1 standard or AFG1<br />
in real samples)
EXPERIMENTAL: INSTRUMENTS AND REAGENTS<br />
BAS C50W<br />
Voltammetric<br />
Analyser<br />
BAS CGME consist of<br />
Ag/AgCl as RE, Pt wire as<br />
AE, CGME as WE, 20 ml<br />
cell and magnetic stirrer.<br />
Reagents: AFG1 ( MERCK); 10 ppm in benzene:<br />
acetonitrile (98%), 1 ppm: prepared in BRb pH 9.0.
EXPERIMENT<br />
A) Cathodic and anodic scan of AFG1<br />
1. 10 ml of supporting electrolyte (BRb pH = 9.0 ) in voltammetric<br />
cell was degassed for at least 10 min.<br />
2. Scanned using CV technique; Ei = 0 mV, E high = 0 mV, E low = -<br />
1500 mV, scan rate = 200 mV/s to obtain voltammogram of blank.<br />
3. The AFG1 standard solution was spiked into the cell (<br />
concentration of AFG1 in the cell = 1.5 uM), was degassed for at<br />
least 3 min and scanned follows the same procedure as 2.0 to<br />
obtain voltammogram of AFG1 in BRb solution.<br />
4. Experiment no 2 and 3 were repeated with different parameters (<br />
Ei = -1500 mV, E high = 0 mV and E low = -1500 mV ). Other<br />
parameters remain unchanged.
B) Repeatitive scan<br />
EXPERIMENT…Cont<br />
Repeatitive scan ( n = 5 ) for cathodic direction was<br />
performed and the peak height of AFG1 was observed<br />
C) Standard Addition of AFG1<br />
Using the same parameters as no 2, the concentration of<br />
AFG1 was added ( 1.5, 2.25 , 3.0, 3.75 and 4.5 M). The<br />
peak current and peak potential of AFG1 was observed.<br />
D) Effect of scan rate<br />
The scan rate was changed ( 25, 50, 100, 150, 200, 250, 300,<br />
400, 500, 700 mV/s ) while other parameters remain<br />
unaltered. The peak current and peak potential of AFG1<br />
was observed due to the various applied scan rate.
EXPERIMENT…Cont<br />
E) Effect of pH of BRb solution<br />
The pH of supporting electrolyte (BRb solution ) was<br />
adjusted from 3.0 to 13.0 ( using 1.0 M NaOH or 1.0<br />
M HCl ) and the AFG1 standard solution was<br />
scanned in various pH of BRB. The peak current and<br />
peak potential of AFG1 was observed.
RESULTS AND DISCUSSION<br />
A) Cathodic and anodic scan of AFG1<br />
Ip = 45.2 nA, Ep = -1245 mV<br />
Ei = 0 mV, E high = 0 mV, E low = -1500<br />
mV, s.rate = 200 mV/s, [AFG1] = 1.5 uM<br />
in BRb pH =9.0<br />
Ip = 58.5 nA, Ep = -1243 mV<br />
Ei = -1500 mV, E high = 0 mV, E low<br />
= -1500 mV, s.rate = 200 mV/s,<br />
[AFG1] = 1.5 uM<br />
Both scan directions gave only single cathodic peak ( no anodic<br />
wave ) �AFG1 undergoes irreversible reduction reaction at<br />
mercury electrode.
RESULTS AND DISCUSSION… cont<br />
B) Repeatitive cathodic scan ( n = 5 or 10 segments)<br />
Peak heights of AFG1 increased with the number of scans with<br />
no extra peak neither anodic nor anodic peak was observed.<br />
Peak potentials of AFG1 were – 1245 to -1220 mV.<br />
=� Progressive adsorptive accumulation of AFG1 at the<br />
mercury electrode surface<br />
Ip (nA)<br />
80<br />
60<br />
40<br />
20<br />
0<br />
1 2 3 4 5<br />
No of cycle
RESULTS AND DISCUSSION… cont<br />
C) Standard Addition of AFG1<br />
Ei = 0 mV, E high = 0 mV, E low = -1500<br />
mV, s.rate = 200 mV/s, [AFG1] = 1.5, 2.25,<br />
3.0, 3.75 and 4.5 uM in BRB pH =9.0<br />
The peak potential at –1245 mV was confirmed due to the<br />
reduction of AFG1 in BRB pH =9.0.<br />
Ip (nA)<br />
150<br />
120<br />
90<br />
60<br />
30<br />
0<br />
y = 24.756x + 13.072<br />
R 2 = 0.9812<br />
1 1.5 2 2.5 3 3.5 4 4.5 5<br />
[AFG1] / uM<br />
Ip of AFG1 increased and peak<br />
potentials shifted toward less<br />
negative direction with<br />
increasing of AFG1<br />
concentration.
D) Effect of scan rate<br />
RESULTS AND DISCUSSION… cont<br />
i) Log peak height versus log scan rate, [AFG1] = 1.5 uM<br />
Lop Ip<br />
2.1<br />
1.9<br />
1.7<br />
1.5<br />
1.3<br />
1.1<br />
0.9<br />
0.7<br />
0.5<br />
y = 0.5623x + 0.446<br />
R 2 = 0.9919<br />
1.2 1.4 1.6 1.8 2 2.2 2.4 2.6 2.8<br />
log scan rate<br />
Linear relationship was observed between log Ip versus log<br />
scan rate with the slope of 0.56 ( > 0.5 ) =� Diffusion current<br />
is influenced by an adsorption of AFG1 on the electrochemical<br />
process at mercury electrode surface.
RESULTS AND DISCUSSION… cont<br />
ii) Peak potential versus log scan rate, [AFG1] = 1.5 uM<br />
Ep (-mV)<br />
1275<br />
1260<br />
1245<br />
1230<br />
1215<br />
1200<br />
1185<br />
y = 48.484x + 1134.8<br />
R 2 = 0.9978<br />
1.2 1.4 1.6 1.8 2 2.2 2.4 2.6 2.8<br />
log scan rate<br />
Plot of peak potential versus log scan rate is a linear graph ( R 2 = 0.9978)<br />
=� confirmed that the reduction of AFG1 on the electrode surface is<br />
totally irreversibe.
Ip (nA)<br />
110<br />
100<br />
90<br />
80<br />
70<br />
60<br />
50<br />
40<br />
30<br />
20<br />
10<br />
0<br />
RESULTS AND DISCUSSION… cont<br />
iii) Peak height versus scan rate, [AFG1] = 1.5 uM<br />
0 50 100 150 200 250 300 350 400 450 500 550<br />
Scan rate ( m V/s )<br />
1) Slow scan rate:<br />
Ip = 0.2298x + 14.164 ( R 2 = 0.9757, n = 5)<br />
2) Fast scan rate:<br />
Ip = 0.1598x + 19.18 ( R2 = 0.9892, n = 5)<br />
Based on the slopes of the regression equations for two different<br />
regions, the reduction and adsorption of AFG1 on the electrode<br />
surface is governed by the speed of reaction which preferred slow<br />
reaction.
Ip (nA )<br />
60<br />
50<br />
40<br />
30<br />
20<br />
10<br />
0<br />
RESULTS AND DISCUSSION… cont<br />
E) Effect of different pH of BRb solution, [AFG1] = 1.5 uM<br />
i) Effect on peak height<br />
2 3 4 5 6 7 8 9 10 11 12<br />
pH<br />
Peak height and peak potential<br />
of AFG1 are pH dependent<br />
except for pH 6,7, 8 and 9, peak<br />
potential are unchanged at -1245<br />
mV<br />
At pH = 9.0, highest peak<br />
current was observed<br />
ii) Effect on peak potential<br />
Ep (-mV)<br />
1270<br />
1250<br />
1230<br />
1210<br />
1190<br />
1170<br />
1150<br />
2 3 4 5 6 7<br />
pH<br />
8 9 10 11 12
CONCLUSION<br />
1. AFG1 is reduced at mercury electrode. The<br />
reduction reaction is totally irreversible reaction<br />
which gives maximum peak height in BRb at pH<br />
of 9.0. The diffusion current produced by this<br />
reaction is affected by adsorption process of<br />
AFG1 at the mercury electrode surface which<br />
prefer a slow reaction.<br />
2. All information on electrochemical properties of<br />
AFG1 are useful for development of other<br />
voltammetric technique for determination of<br />
AFG1 in standard solution and real samples.
ACKNOWLEDGEMENT<br />
SUPERVISOR:<br />
AP DR ABDUL RAHIM MOHD YUSOFF<br />
CO-SUPERVISORS:<br />
1. PROF RAHMALAN AHAMAD<br />
2. AP DR ABD. RAHIM YAACOB<br />
ELECTROANALYSIS GROUP AND<br />
STAFF OF CHEMISTRY DEPT<br />
SCHOOL OF HEALTH SCIENCES, USM ,<br />
HEALTH CAMPUS, KUBANG KRIAN,<br />
KELANTAN
THANK YOU
2<br />
O<br />
Proposed mechanisme of the reduction of AFG1 that<br />
may take place at mercury electrode as reported by<br />
Smyth et al. (1979);<br />
O<br />
O<br />
O<br />
O O<br />
O<br />
2e -<br />
O<br />
O<br />
O<br />
Θ<br />
O<br />
O O<br />
O<br />
2H 2 O<br />
Dimer + 2OH -
ORAL PRESENTED AT<br />
SYMPOSIUM LIFE SCIENCE II<br />
(USM PENANG; 31 st MAC – 3 rd<br />
APRIL 2004)<br />
3/1/2007 2nd Life PostCon USM Penang 1
STABILITY STUDY OF AFLATOXIN G1<br />
(AFG1) USING DIFFERENTIAL PULSE<br />
STRIPPING VOLTAMMETRIC TECHNIQUE<br />
BY<br />
Mohd Hadzri Yaacob, Abd.Rahim Yusoff and<br />
Rahmalan Ahamad<br />
UTM, SKUDAI<br />
3/1/2007 2nd Life PostCon USM Penang 2
• INTRODUCTION<br />
• OBJECTIVE<br />
• EXPERIMENTAL<br />
• RESULTS AND<br />
DISCUSSION<br />
• CONCLUSION<br />
TOPICS FOR DISCUSSION<br />
• ACKNOWLEDGEMENT<br />
AFLATOXINS<br />
3/1/2007 2nd Life PostCon USM Penang 3
• AFLATOXINS:<br />
Mycotoxin group.<br />
Produced by two fungi;<br />
Types of aflatoxins:<br />
AFB1, AFB2, AFG1<br />
and AFG2:<br />
AFM1 and AFM2<br />
INTRODUCTION<br />
Aspergillus flavus Aspergillus parasiticus<br />
Raw peanuts, peanuts products, wheat,<br />
maize, corn, vegetable oils, dried fruites,<br />
barley, pear, cocoa, coffee, herbs, spices,<br />
wine, cottonseeds.<br />
Cow milk and its products, eggs<br />
and meat product<br />
3/1/2007 2nd Life PostCon USM Penang 4
INTRODUCTION …cont<br />
• AFLATOXINS:<br />
Occurs naturally in commodities used for animal and<br />
human<br />
Carcinogenic, teratogenic and mutagenic<br />
IARC (1988): Class I carcinogenic materials<br />
Dangerous to health: causes aflatoxicosis disease.<br />
Effect the economy of commodities export countries<br />
3/1/2007 2nd Life PostCon USM Penang 5
AFLATOXIN G1 ( AFG1):<br />
Chemical and physical properties<br />
O<br />
O<br />
O<br />
O<br />
O O<br />
O<br />
Chemical name: 3,4,7a, 10a-tetrahydro-5-methoxy-1H,<br />
12H furo[3’,2’:4,5]furo[2,3-h]pyrano[3,4-c][l]-benzopyran-<br />
1,12-dione<br />
Yellowish crystal.<br />
C 17 H 12 O 7<br />
MW = 328<br />
Odorless, tasteless and colorless solution ( in organic<br />
solvent).<br />
3/1/2007 2nd Life PostCon USM Penang 6
AFLATOXIN G1 ( AFG1):<br />
Chemical and physical properties…cont<br />
Solubility: Dissolve in methanol, water:acetonitrile (9:1),<br />
trifluoroactic acid, DMSO and acetone. In water: 10-20 mg /<br />
liter<br />
m.p; 244 – 246 0 C<br />
Produces green color under UV light<br />
UV abs (max) in methanol: 216, 242, 265 and 362 nm<br />
IR spectrum ( in chloroform): 1760, 1695, 1630 and 1595<br />
cm -1<br />
3/1/2007 2nd Life PostCon USM Penang 7
Stability of AFG1<br />
In crystal form: extremely stable in the absence of<br />
light or UV radiation, even at T = > 100 0 C<br />
Solution in water, DMSO, 95% acetone or ethanol<br />
stable for 24 hrs under normal condition. Stable for<br />
years if kept in cool and dark place<br />
Stable in most food process; not destroy by normal<br />
cooking process since it heat stable<br />
3/1/2007 2nd Life PostCon USM Penang 8
Based on chemical structure:<br />
In strong alkali: lactone ring- susceptible to<br />
alkaline hydrolysis<br />
In acid: acid catalytic addition of water across the<br />
double bond of the furan ring.<br />
O<br />
Stability of AFG1… cont<br />
O<br />
O O<br />
3/1/2007 2nd Life PostCon USM Penang 9<br />
O<br />
O<br />
O
OBJECTIVE<br />
To study the stability of AFG1 in;<br />
a) Britton-Robinson buffer (BRB) pH 9.0; AFG1<br />
prepared in BRB pH 9.0, measured in same<br />
buffer, exposed to normal condition ( 0 to 6<br />
hrs).<br />
b) BRB pH 9.0: kept in cool and dark place ( 0 to<br />
6 months )<br />
c) AFG1 prepared in BRB pH 9.0, measured in<br />
BRB with different pH, expose to normal<br />
condition ( 0 to 3 hrs).<br />
Using Differential pulse cathodic stripping<br />
voltammetric technique (DPCSV)<br />
3/1/2007 2nd Life PostCon USM Penang 10
VOLTAMMETRY:<br />
From Voltage- Amperometry<br />
-Measure amount of current at different voltage<br />
-Electroanalytical technique : sensitive, high accuracy, low cost<br />
and easy to use<br />
-2 important parameters; peak height (Ip) and peak potential (Ep)<br />
-result: voltammogram ( e.g; Differential Pulse Cathodic Stripping<br />
Voltammogram of AFG1)<br />
[AFG1] = 0.1 uM = 30 ppb in<br />
BRB pH 9.0<br />
Ep = -1150 mV<br />
Ip = 55.45 nA<br />
Analysis date: 26 th Jan 2004<br />
3/1/2007 2nd Life PostCon USM Penang 11
EXPERIMENTAL: INSTRUMENTS AND REAGENTS<br />
BAS C50W<br />
Voltammetric<br />
Analyser<br />
BAS CGME consist of<br />
Ag/AgCl as RE, Pt wire as<br />
AE, CGME as WE, 20 ml<br />
cell and magnetic stirrer.<br />
Reagents: AFG1 ( MERCK); 10 ppm in benzene:<br />
acetonitrile (98%), 1 ppm: prepared in BRB pH 9.0. BRB<br />
pH ( 3.0 to 13.0)<br />
3/1/2007 2nd Life PostCon USM Penang 12
EXPERIMENTAL FLOW CHART<br />
10 ML BRB SOLUTION<br />
BLANK SOLUTION<br />
BLANK<br />
VOLTAMMOGRAM<br />
SPIKE INTO 20 ML<br />
VOLTAMMETRIC CELL<br />
SOLUTION IS<br />
DEGASSED<br />
SOLUTION IS<br />
SCANNED<br />
OBTAINED<br />
VOLTAMMOGRAM<br />
NITROGEN GAS IS FLOWED IN AFLATOXIN G1<br />
SOLUTION, REDISSOLVED IN BRB SOLUTION<br />
BLANK SOLUTION +<br />
AFLATOXIN<br />
SAMPEL<br />
VOLTAMMOGRAM<br />
3/1/2007 2nd Life PostCon USM Penang 13
RESULTS<br />
a) 0.1 uM AFG1 in BRB pH =9.0, exposed to normal<br />
condition<br />
0 to 3 hrs: Peak current: 60.26 to 57.7 nA<br />
4 hrs: 43.67 nA ( 78%)<br />
6 hrs: 33.56 nA ( 56%)<br />
8 hrs: 29.02 nA ( 45%)<br />
Stability study of AFG1 in BRB pH 9<br />
3/1/2007 2nd Life PostCon USM Penang 14<br />
Ip (n A )<br />
80<br />
60<br />
40<br />
20<br />
0<br />
0 1 2 3 4 5 6 7 8<br />
Standing time (hrs)<br />
AFG1 stable up to 3 hrs in<br />
BRB pH 9.0, exposed to<br />
normal condition
) 0.1 uM AFG1 from 1 ppm AFG1 in BRB pH 9.0 kept in cool and<br />
dark place, measured in BRB pH 9.0<br />
(a) 0 (b) 1 m (c) 2 m (d) 3 m<br />
(e) 4 m (f) 5 m (g) 6 m<br />
0 to 3 m : 57.50 – 39.50 nA ( 70%)<br />
4 m : 36.5 nA (60%) 6 m ( 25%)<br />
Ip (nA)<br />
3/1/2007 2nd Life PostCon USM Penang 15<br />
60<br />
50<br />
40<br />
30<br />
20<br />
10<br />
0<br />
0 1 2 3 4 5 6<br />
Storage time (month)<br />
AFG1 in BRB pH 9.0,<br />
kept in cool and dark<br />
place �stable up to 3<br />
m keeping time
c) 0.1 uM AFG1 ( from 1 ppm AFG1 in BRB pH 9.0)<br />
measured in different pH of BRB and exposed to normal<br />
condition<br />
Ip (nA)<br />
70<br />
60<br />
50<br />
40<br />
30<br />
20<br />
10<br />
0<br />
0 1 2 3<br />
Standing time (hrs)<br />
pH = 6.0<br />
pH = 7.0<br />
pH = 9.0<br />
pH = 11.0<br />
Stability order for<br />
AFG1 in different pH of<br />
BRB exposed to<br />
normal condition up to<br />
3 hrs;<br />
pH 11.0 < 9.0 < 6.0 < 7.0<br />
In BRB pH = 6.0, 7.0 : peak current increases with time<br />
In BRB pH = 9.0: peak current slowly decreases with<br />
time<br />
In BRB pH = 11.0 peak current sharply decreases with<br />
time where after 2 hrs no peak was observed<br />
3/1/2007 2nd Life PostCon USM Penang 16
CONCLUSION<br />
1) AFG1 stable up to 3 hrs in BRB pH 9.0 when<br />
exposed to normal condition.<br />
2) AFG1 in BRB pH 9.0, stable up to 3 m when<br />
kept in cool and dark place<br />
3)Stability order for AFG1 in different pH of BRB<br />
exposed to normal condition up to 3 hrs;<br />
pH 11.0 < 9.0 < 6.0 < 7.0<br />
3/1/2007 2nd Life PostCon USM Penang 17
FURTHER WORKS<br />
1. Stability study of AFG1 using different<br />
concentration of AFG1 ( 0.05 uM and 1.0 uM)<br />
2. Stability study of AFG1, keep in room<br />
temperature and expose to light from 0 to 6<br />
months.<br />
3. Stability study of other aflatoxins (AFB1, AFB2<br />
and AFG2)<br />
3/1/2007 2nd Life PostCon USM Penang 18
ACKNOWLEDGEMENT<br />
SCHOOL OF HEALTH SCIENCES, USM<br />
( STUDY LEAVE AND FELLOWSHIP<br />
UNDER ASHES: May 2002 – May 2005)<br />
MR RODWAN MAT AIL, CHEM<br />
DEPT, MOSTE, PENANG.<br />
SUPERVISOR:<br />
AP DR ABDUL RAHIM MOHD YUSOFF<br />
CO-SUPERVISORS:<br />
1. PROF RAHMALAN AHAMAD<br />
2. AP DR ABD. RAHIM YAACOB<br />
ELECTROANALYSIS GROUP AND<br />
STAFF OF CHEMISTRY DEPT<br />
3/1/2007 2nd Life PostCon USM Penang 19
THANK YOU<br />
Wassalam<br />
Mohd Hadzri, Hadzri<br />
Sains Forensik, Forensik,<br />
PPSains Kesihatan<br />
USM KELANTAN<br />
3/1/2007 2nd Life PostCon USM Penang 20
ORAL PRESENTED AT<br />
SKAM-17<br />
(KUANTAN, 24-26 th<br />
AUGUST 2004)
STABILITY STUDIES OF AFLATOXINS<br />
USING DIFFERENTIAL PULSE CATHODIC<br />
STRIPPING VOLTAMMETRIC (DPCSV)<br />
TECHNIQUE<br />
BY<br />
Mohd Hadzri Yaacob, Abd.Rahim Yusoff and<br />
Rahmalan Ahamad<br />
UTM, SKUDAI
C=O groups<br />
Electroactive<br />
property of<br />
aflatoxins<br />
INTRODUCTION<br />
AFLATOXINS<br />
Electroactive<br />
species can be<br />
determined<br />
using<br />
voltammetric<br />
technique
• AFLATOXINS:<br />
Mycotoxin group.<br />
Produced by two fungi;<br />
Types of aflatoxins:<br />
AFB1, AFB2, AFG1<br />
and AFG2:<br />
AFM1 and AFM2<br />
INTRODUCTION…cont<br />
Aspergillus flavus Aspergillus parasiticus<br />
Raw peanuts, peanuts products, wheat,<br />
maize, corn, vegetable oils, dried fruites,<br />
barley, pear, cocoa, coffee, herbs, spices,<br />
wine, cottonseeds.<br />
Cow milk and its products, eggs<br />
and meat product
INTRODUCTION …cont<br />
• AFLATOXINS:<br />
Occurs naturally in commodities used for animal and<br />
human<br />
Carcinogenic, teratogenic and mutagenic<br />
IARC (1988): Class I carcinogenic materials<br />
Dangerous to health: causes aflatoxicosis disease.<br />
Effect the economy of commodities export countries
O<br />
O<br />
AFB1<br />
O<br />
O<br />
AFLATOXIN:<br />
Chemical and physical properties<br />
O<br />
O<br />
C 17H 12O 6, MW = 312<br />
O<br />
O O<br />
C 17H 12O 7 MW = 328<br />
O<br />
O<br />
O<br />
O<br />
O<br />
O<br />
AFB2<br />
O<br />
C 17 H 14 O 6<br />
AFG1 AFG2<br />
O<br />
C 17 H 14 O 7<br />
O<br />
O<br />
O<br />
O<br />
O<br />
MW = 314<br />
O<br />
O O<br />
O<br />
MW = 330
AFLATOXIN:<br />
Chemical and physical properties…cont<br />
Solubility: Dissolve in methanol, water:acetonitrile (9:1),<br />
trifluoroactic acid, DMSO and acetone. In water: 10-20<br />
mg / liter<br />
Yellowish crystal<br />
Odorless, tasteless and colorless solution ( in organic<br />
solvent).
AFLATOXIN:<br />
Chemical and physical properties…cont<br />
AFB1 AFB2 AFG1 AFG2<br />
m.point 269 0 C 287 0 C 245 0 C 237 0 C<br />
UV abs (max) 360 362 362 362<br />
in methanol/<br />
nm<br />
IR spectrum 1760, 1684 1760, 1684 1760, 1695 1760, 1695<br />
( in chloroform) 1632, 1598 1632, 1598 1630, 1595 1630, 1595<br />
/ cm -1 1562 1562
Stability of aflatoxins<br />
In crystal form: extremely stable in the absence of<br />
light or UV radiation, even at T = > 100 0 C<br />
Solution in water, DMSO, 95% acetone or ethanol:<br />
stable for 24 hrs under normal condition. Stable for<br />
years if kept in cool and dark place<br />
Stable in most food process; not destroy by normal<br />
cooking process since it heat stable.
OBJECTIVE<br />
To study the stability of aflatoxins which were;<br />
a) exposed to normal laboratory condition for 8 hours in<br />
BRb pH=9.0.<br />
b) exposed to normal laboratory condition for 3 hours in<br />
BRb pH=6.0, 7.0, 9.0 and 11.0<br />
c) stored under cool temperature for 6 months in BRb<br />
pH =9.0<br />
using DPCSV technique<br />
( a small portion of my research study in developing<br />
voltammetric technique for determination of aflatoxins)
EXPERIMENTAL: INSTRUMENTS AND REAGENTS<br />
BAS C50W<br />
Voltammetric<br />
Analyser<br />
BAS CGME consist of<br />
Ag/AgCl as RE, Pt wire as<br />
AE, CGME as WE, 20 ml<br />
cell and magnetic stirrer.<br />
Reagents: AFB1, B2, G1, G2 ( MERCK); 10 ppm in<br />
benzene: acetonitrile (98%), 1 ppm: prepared in BRb at<br />
required pH.
EXPERIMENT<br />
A) General procedure for DPCSV analysis<br />
1. 10 ml of supporting electrolyte (BRb pH = 9.0 ) in<br />
voltammetric cell was degassed for at least 15 min.<br />
2. Scanned using DPCSV technique; Ei = -1000 mV, Ef = -<br />
1400 mV, Eacc = -600 mV, tacc = 80 s, scan rate = 50<br />
mV/s, pulse amplitude = 80 mV and rest time = 10 s to<br />
obtain voltammogram of blank ( for all aflatoxins<br />
except for AFG1, Ei = -950 mV)<br />
3. The aflatoxins standard solution was spiked into the cell<br />
( concentration of aflatoxins in the cell = 0.1 uM),<br />
redegassed for at least 2 min and rescanned follows the<br />
same procedure as no 2.0 to obtain voltammograms of<br />
aflatoxins in BRb solution.
EXPERIMENT…Cont<br />
B) Procedures for stability studies<br />
1) 8 hours exposed to normal condition<br />
Each aflatoxin was scanned every hour from 0 to<br />
8 hours. ( aflatoxin in BRb pH =9.0 solution<br />
remained in the voltammetric cell).<br />
2) 3 hours exposed to normal condition<br />
Each aflatoxin was scanned every hour from 0 to<br />
3 hours in different pH of BRb ( 6.0, 7.0, 9.0 and<br />
11.0)<br />
3) Shelf life of aflatoxins ( 1 ppm) stored in freezer<br />
Each aflatoxin ( 0.1 uM) was scanned every<br />
month from 1 st to 6 th month storage period in<br />
BRb pH =9.0
RESULTS AND DISCUSSION<br />
A) Voltammograms of aflatoxins<br />
AFB1<br />
AFB2<br />
blank<br />
blank<br />
[AFB1] = 0.1 uM / 31.2 ppb<br />
In BRb pH =9.0<br />
Ep = -1210 mV<br />
Ip = 63.19 +/- 1.64 nA<br />
n = 8 RSD = 2.60%<br />
[AFB2] = 0.1 uM / 31.5 ppb<br />
In Brb pH 9.0<br />
Ep = -1230 mV<br />
Ip = 65.67 +/- 1.28 nA<br />
n = 8 RSD = 1.95%
AFG1<br />
AFG2<br />
blank<br />
RESULTS AND DISCUSSION…cont<br />
blank<br />
[AFG1] = 0.1 uM / 32.8 ppb<br />
In BRb pH 9.0<br />
Ep = -1150 mV<br />
Ip = 60.76 +/- 0.99 nA<br />
n = 8 RSD = 1.63%<br />
[AFG2] = 0.1 uM / 33.0 ppb<br />
In BRb pH 9.0<br />
Ep = -1170 mV<br />
Ip = 58.88 +/- 0.88 nA<br />
n = 8 RSD = 1.50%
RESULTS AND DISCUSSION… cont<br />
( STABILITY STUDIES)<br />
A) 8 hours exposed to normal laboratory condition<br />
Peak height (nA)<br />
70<br />
60<br />
50<br />
40<br />
30<br />
20<br />
10<br />
0<br />
0 1 2 3 4 5 6 7 8 9<br />
Exposure time (hrs)<br />
AFB1<br />
AFB2<br />
AFG1<br />
AFG2<br />
Peak currents of AFB1 and AFB2 remained unchanged up to 8<br />
hours but for AFG1 and AFG2 peak currents started decrease<br />
after 1 st hour exposure time. After 3 hours it gradually<br />
decreased with AFG2 gave lower peak current compared to<br />
AFG1.<br />
�Up to 8 hrs, AFB1=AFB2 > AFG1, AFG2. AFG1> AFG2
RESULTS AND DISCUSSION… cont<br />
( STABILITY STUDIES)<br />
Voltammograms of aflatoxins at 0 to 8 hours in BRb pH 9.0.<br />
0.1 uM AFB1 0.1 uM AFB2
RESULTS AND DISCUSSION… cont<br />
( STABILITY STUDIES)<br />
Voltammograms of aflatoxins at 0 to 8 hours in BRb pH 9.0...cont<br />
AFG1 = 0.1 uM AFG2 = 0.1 uM
Peak height (nA)<br />
50<br />
45<br />
40<br />
35<br />
30<br />
25<br />
20<br />
15<br />
10<br />
5<br />
0<br />
RESULTS AND DISCUSSION… cont<br />
(STABILITY STUDIES)<br />
B) In different pH of BRb ( pH 6.0 and (7.0)<br />
pH = 6.0<br />
0 1 2 3<br />
Exposure time (hrs)<br />
AFB1<br />
AFB2<br />
AFG1<br />
AFG2<br />
In pH 6.0 and 7.0, all aflatoxins are stable within<br />
3 hours in the cell.<br />
Peak height (nA)<br />
70<br />
60<br />
50<br />
40<br />
30<br />
20<br />
10<br />
0<br />
pH = 7.0<br />
0 1 2 3<br />
Exposure time (hrs)<br />
In BRb pH = 6.0 In BRb pH = 7.0<br />
AFB1<br />
AFB2<br />
AFG1<br />
AFG2
Ip (nA)<br />
70<br />
60<br />
50<br />
40<br />
30<br />
20<br />
10<br />
0<br />
RESULTS AND DISCUSSION… cont<br />
(STABILITY STUDIES)<br />
B) In different pH of BRb ( pH 9.0 and 11.0)<br />
Stability of aflatoxins in BRB pH 9<br />
0 1 2 3<br />
Exposure time (hrs)<br />
AFB1<br />
AFB2<br />
AFG1<br />
AFG2<br />
In BRb pH 9.0<br />
In pH 9.0, all aflatoxins stable<br />
within 3 hours in the cell.<br />
Ip (nA)<br />
45<br />
40<br />
35<br />
30<br />
25<br />
20<br />
15<br />
10<br />
5<br />
0<br />
Stability of aflatoxins in BRB pH 11<br />
0 1 2 3<br />
Exposure time (hrs)<br />
In BRb pH11.0<br />
AFB1<br />
AFB2<br />
AFG1<br />
AFG2<br />
In pH 11.0, AFG1 and AFG2<br />
significantly decreased within<br />
3 hours compared to AFB1<br />
and AFB2.
AFB2<br />
AFB1<br />
RESULTS AND DISCUSSION… cont<br />
(STABILITY STUDIES)<br />
B) 6 months kept in freezer<br />
Peak height (nA)<br />
80<br />
70<br />
60<br />
50<br />
40<br />
30<br />
20<br />
10<br />
0 1 2 3 4 5 6 7<br />
Storage time in freezer (months)<br />
Stability order:<br />
AFB1<br />
AFB2<br />
AFG1<br />
AFG2<br />
AFB1=AFB2>AFG2>AFG1<br />
( in BRb pH =9.0)<br />
AFG1<br />
AFG2
Peak height (nA)<br />
80<br />
70<br />
60<br />
50<br />
40<br />
30<br />
20<br />
10<br />
RESULTS AND DISCUSSION… cont<br />
(STABILITY STUDIES)<br />
B) 6 months kept in freezer<br />
0 1 2 3 4 5 6 7<br />
Storage time in freezer (months)<br />
AFB1<br />
AFB2<br />
AFG1<br />
AFG2<br />
Peak height vs time Percent left vs time<br />
3 rd MONTH: AFB1 (72%), AFB2 (83%), AFG1 (66%), AFG2 (56%)<br />
6 th MONTH: AFB1 (50%), AFB2 (59%), AFG1 (42%), AFG2 (37%)<br />
Percent left<br />
100<br />
90<br />
80<br />
70<br />
60<br />
50<br />
40<br />
30<br />
0.1 uM in BRb pH = 9.0<br />
0 1 2 3 4 5 6 7<br />
Storage time in freezer (months)<br />
AFB1<br />
AFB2<br />
AFG1<br />
AFG2
CONCLUSION<br />
1. In BRb pH 9.0, AFB1 and AFB2 are stable up to<br />
8 hours while AFG1 and AFG2 are stable up to 3<br />
hours when exposed to normal condition in<br />
voltammetric cell.<br />
2. Within 3 hours exposed to normal condition, all<br />
aflatoxins are stable in BRb pH 6, 7 and 9.0 but<br />
in BRb pH 11.0, AFG1 is very unstable<br />
compared to other aflatoxins. The proposed<br />
stability order for aflatoxins in BRb pH 11.0 is:<br />
AFB2 > AFB1 > AFG2 > AFG1
CONCLUSION…. cont<br />
3. AFB1 and AFB2 solution in BRb pH 9.0 kept in freezer have<br />
shelf life of 3 months while AFG1 and AFG2 only 2 months.<br />
After this period of time, the new aflatoxins solution should<br />
be prepared.
ACKNOWLEDGEMENT<br />
SUPERVISOR:<br />
AP DR ABDUL RAHIM MOHD YUSOFF<br />
CO-SUPERVISORS:<br />
1. PROF RAHMALAN AHAMAD<br />
2. AP DR ABD. RAHIM YAACOB<br />
ELECTROANALYSIS GROUP AND<br />
STAFF OF CHEMISTRY DEPT<br />
SCHOOL OF HEALTH SCIENCES, USM ,<br />
HEALTH CAMPUS, KUBANG KRIAN,<br />
KELANTAN
THANK YOU
Based on chemical structure:<br />
In strong alkali: lactone ring- susceptible to<br />
alkaline hydrolysis<br />
In acid: acid catalytic addition of water across the<br />
double bond of the furan ring.<br />
O<br />
Stability of AFG1… cont<br />
O<br />
O<br />
O<br />
O O<br />
O
ELECTROCHEMICAL PROPERTIES OF AFG1<br />
Based on chemical structure:<br />
Ketone groups in lactone ring can be reduced and<br />
produce cathodic wave.<br />
Unsaturated terminal furan ring can be reduced<br />
and produce cathodic wave.<br />
O<br />
O<br />
O<br />
O<br />
O O<br />
O<br />
Can forms<br />
anionic<br />
radical
2<br />
O<br />
Proposed mechanisme of the reduction of AFG1 that<br />
may take place at mercury electrode as reported by<br />
Smyth et al. (1979);<br />
O<br />
O<br />
O<br />
O O<br />
O<br />
2e -<br />
2H +<br />
O<br />
O<br />
O<br />
Θ<br />
O<br />
O O<br />
O<br />
2H 2 O<br />
Dimer + 2OH -
UV-VIS SPECTRUM OF AFB1<br />
BRb pH 6.0 BRb pH 7.0<br />
BRb pH 9.0<br />
BRb pH 11.0
UV-VIS SPECTRUM OF AFB2<br />
BRb pH 6.0 BRb pH 7.0<br />
BRb pH 9.0<br />
BRb pH 11.0
UV-VIS SPECTRUM OF AFG1<br />
BRb pH 6.0 BRb pH 7.0<br />
BRb pH 9.0<br />
BRb pH 11.0
UV-VIS SPECTRUM OF AFG2<br />
BRb pH 6.0 BRb pH 7.0<br />
BRb pH 9.0<br />
BRb pH 11.0
ORAL PRESENTED AT<br />
SKAM-18<br />
(JOHOR BAHRU, JOHOR ;<br />
12 -14 th SEPTEMBER 2005)
SQUARE-WAVE STRIPPING<br />
VOLTAMMETRIC TECHNIQUE FOR THE<br />
DETERMINATION OF AFLATOXIN B1 IN<br />
GROUNDNUT SAMPLES<br />
BY<br />
MOHAMAD HADZRI YAACOB<br />
AP DR ABDULL RAHIM MOHD YUSOFF<br />
PROF RAHMALAN AHAMAD<br />
(UTM)
OBJECTIVE OF THIS STUDY<br />
TO DEVELOP SWSV TECHNIQUE FOR<br />
THE DETERMINATION OF AFB1
• AFLATOXINS:<br />
Mycotoxin group<br />
Produced by two fungi;<br />
Aspergillus flavus and<br />
Aspergillus parasiticus<br />
Types of aflatoxins:<br />
AFB1<br />
AFB2<br />
AFG1<br />
AFG2<br />
AFM1<br />
AFM2<br />
INTRODUCTION<br />
Raw peanuts, peanuts products,<br />
wheat, maize, vegetable oils, dried<br />
fruites, barley, pear, cocoa, coffee,<br />
herbs, spices, wine, cottonseeds.<br />
Cow milk and its products, eggs<br />
and meat product
Carcinogenic, teratogenic and mutagenic<br />
IARC (1988): Class I carcinogenic materials<br />
Regulatory level in <strong>Malaysia</strong>:<br />
Groundnuts < 15 ppb<br />
Milk < 0.5 ppb<br />
Others < 5 ppb
Chemical structure of AFB1<br />
O<br />
O<br />
(2,3,6a,9a-tetrahydro-4-methoxycyclo penta[c] furo<br />
[3 ’ ,2 ’ :4,5] furo [2,3-h][1] benzopyran-1,11-dione)<br />
Produces blue colour under UV light<br />
MW = 312<br />
O<br />
O<br />
O<br />
O
INSTRUMENTS;<br />
VA 757 Metrohm Voltammetry<br />
analyser + MME Stand<br />
Working electrode = HMDE<br />
Ref electrode: Ag/AgCl, 3M KCl<br />
REAGENTS;<br />
a) Britton-Robinson buffer(BRB) pH = 9.0 and AFB1 std<br />
b) Methanol, 0.1 N HCl, 15% ZnSO 4, diatomoceus earth<br />
powder, chloroform (for extraction and clean-up)<br />
SAMPLES:<br />
EXPERIMENTAL<br />
Groundnut from different shops
EXPERIMENTAL FLOW CHART<br />
1) Scan a blank 2) Scan AFB1 std<br />
10 ML BRB SOLUTION<br />
BLANK SOLUTION<br />
BLANK<br />
VOLTAMMOGRAM<br />
SPIKE INTO 20 ML<br />
VOLTAMMETRIC CELL<br />
SOLUTION IS<br />
DEGASSED<br />
SOLUTION IS<br />
SCANNED<br />
OBTAINED<br />
VOLTAMMOGRAM<br />
NITROGEN GAS IS FLOWED IN AFLATOXINS<br />
SOLUTION, REDISSOLVED IN BRB SOLUTION<br />
BLANK SOLUTION +<br />
AFB1<br />
SAMPEL<br />
VOLTAMMOGRAM
Study effect of<br />
Method optimisation;<br />
pH of BRB (6.0 to 13.0)<br />
potential window (E i and E f ) (0.4 to -1.2 V)<br />
Accumulation potential (E acc ) (0 to -1.4 V)<br />
Accumulation time (t acc ) (0 to 150 s)<br />
Frequency (25 to 125 Hz)<br />
Voltage step (0.01 to 0.04 V)<br />
Amplitude (0.025 to 0.1 V)<br />
Scan rate<br />
to peak height (I p ) and peak potential (E p )<br />
of AFB1
RESULTS AND DISCUSSION<br />
Initial parameters (from optimum DPCSV parameters):<br />
E i = -1.0 V, E f = -1.4 V, E acc = -0.6 V, t acc = 80 s, scan<br />
rate = 50 mV/s and pulse amplitude = 80 mV.<br />
Supporting electrolyte = BRB pH 9.0. [AFB1] = 0.1 uM<br />
Single cathodic peak<br />
Ep = -1.23 1.23 V<br />
Ip = 230 nA<br />
Compare to DPCSV;<br />
E p = -1.24 V; I p = 60 nA
I p (nA)<br />
300<br />
250<br />
200<br />
150<br />
100<br />
50<br />
0<br />
a) Effect of pH of BRB (use 0.1 uM AFB1)<br />
5 6 7 8 9 10 11 12 13 14<br />
pH of BRB<br />
1. pH 9.0 gave maximum Ip 2. Ep shifted towards negative direction at higher<br />
pH �� Hydrogen ion involves in reduction process<br />
Ep (-V)<br />
1.34<br />
1.32<br />
1.3<br />
1.28<br />
1.26<br />
1.24<br />
1.22<br />
1.2<br />
1.18<br />
5 6 7 8 9 10 11<br />
pH
Proposed mechanism;<br />
a) pH 6-8<br />
O<br />
b) pH 9-12<br />
2<br />
O<br />
O<br />
O<br />
OCH 3<br />
O<br />
OCH 3<br />
2H +<br />
(Ref: Smyth et al. (1979): used DPP<br />
technique)<br />
O<br />
2e -<br />
2e -<br />
2<br />
O<br />
O<br />
O<br />
OCH 3<br />
O<br />
H H<br />
O<br />
OCH 3<br />
2 H 2O<br />
Dim er + 2 OH -<br />
O
I p (nA)<br />
300<br />
250<br />
200<br />
150<br />
100<br />
b) Effect of Ei 50<br />
0<br />
0.2 0.4 0.6 0.8 1 1.2 1.4<br />
E i (-V)<br />
Ei = -1.0 1.0 V gave highest Ip ( 285 nA) nA)<br />
��<br />
optimum Ei for further experiments<br />
BRB pH 9.0<br />
Ei = -1.0 1.0 V
Ip (nA)<br />
400<br />
350<br />
300<br />
250<br />
200<br />
150<br />
100<br />
50<br />
0<br />
c) Effect of Eacc acc<br />
0 0.2 0.4 0.6 0.8 1 1.2 1.4 1.6<br />
Eacc (-V)<br />
Eacc acc = - 0.8 V gave highest Ip (366 nA). nA).<br />
�� Eacc acc - 0.8 V was selected as optimum Eacc acc<br />
BRB pH 9.0<br />
Ei= = -1.0 1.0 V<br />
Eacc acc = -0.8 0.8 V
Ip (nA)<br />
450<br />
400<br />
350<br />
300<br />
250<br />
200<br />
150<br />
100<br />
50<br />
0<br />
d) Effect of tacc acc<br />
0 40 80 120 160 200<br />
T acc (s)<br />
100 s is optimum tacc. acc.<br />
It gave<br />
maximum Ip (400 nA) nA<br />
BRB pH 9.0<br />
Ei= = -1.0 1.0 V<br />
Eacc acc = -0.8 0.8 V<br />
tacc acc = 100 s
e) Effect of frequency<br />
Ip (nA)<br />
1000<br />
800<br />
600<br />
400<br />
200<br />
0<br />
0 25 50 75 100 125 150<br />
Frequency (Hz)<br />
Frequency = 125 gave maximum<br />
Ip(820 (820 nA). nA).<br />
> 125 Hz, not possible due to<br />
instrument limitation. Too fast.<br />
BRB pH 9.0<br />
Ei= = -1.0 1.0 V<br />
Eacc acc = -0.8 0.8 V<br />
tacc acc = 100 s<br />
Freq = 125 Hz
Ip is depend linearly on the square root of frequency<br />
( 5 to 125 Hz);<br />
y = 107.91x - 424.7 R 2 = 0.9919, n = 5.<br />
�� AFB1 absorbed on the mercury electrode<br />
Ip (nA)<br />
1000<br />
800<br />
600<br />
400<br />
200<br />
0<br />
y = 107.91x - 424.7<br />
R 2 = 0.9919<br />
3 5 7 9 11<br />
(Frequency) 1/2
f) Effect of voltage step<br />
Ip (nA)<br />
1200<br />
1000<br />
800<br />
600<br />
400<br />
200<br />
0<br />
0 0.01 0.02 0.03 0.04 0.05<br />
Voltage step (V)<br />
Voltage step = 0.03 V which gave maximum Ip (956 nA) nA)<br />
was selected as the optimum v.step<br />
BRB pH 9.0<br />
Ei= = -1.0 1.0 V<br />
Eacc acc = -0.8 0.8 V<br />
tacc acc = 100 s<br />
Freq = 125 Hz<br />
V.Step = 0.03 V
g) Effect of pulse amplitude<br />
Ip (nA)<br />
1200<br />
1000<br />
800<br />
600<br />
400<br />
200<br />
0<br />
0 0.025 0.05 0.075 0.1 0.125<br />
Amplitude (V)<br />
Amplitude = 0.05 V gave<br />
maximum Ip (956 nA) nA)<br />
BRB pH 9.0<br />
Ei= = -1.0 1.0 V<br />
Eacc acc = -0.8 0.8 V<br />
tacc acc = 100 s<br />
Freq = 125 Hz<br />
V.Step = 0.03 V<br />
Amplitude = 0.05 V
Square-wave Square wave frequency, voltage step and<br />
scan rate are interrelated;<br />
For frequency = 125 Hz and voltage step =<br />
0.030 V �� scan rate = 3750 mV/s<br />
Optimum parameters for the SWSV<br />
determination of AFB1<br />
BRB pH 9.0, Ei = -1.0 1.0 V, Ef = -1.4 1.4 V, Eacc acc = -0.8 0.8 V, tacc acc =<br />
100 s, Freq = 125 Hz, V.Step = 0.03 V, Amplitude = 0.05<br />
V and scan rate = 3750 mV/s
Optimum SWSV parameters<br />
I p= 956 nA (E p = -1.30 V)<br />
Non-optimum Non optimum SWSV<br />
Ip= = 230 nA (Ep= = 1.23 V)<br />
Increases 4 times<br />
Compare to optimum DPCSV<br />
parameters<br />
I p= 60 nA ( E p= -1.24 V).<br />
Increases 16 times.<br />
��SWSV SWSV more sensitive and faster<br />
(scan rate = 3750 mV/s) compare<br />
to DPCSV.<br />
(* For DPCSV: 50 mV/s)<br />
(a)<br />
(b)<br />
(a) DPCSV (b) SWSV
Calibration curve for AFB1 and method validation<br />
I p ( nA)<br />
1200<br />
1000<br />
800<br />
600<br />
400<br />
200<br />
0<br />
y = 70.97x + 76.588<br />
R 2 = 0.9984<br />
0 5 10 15 20<br />
[AFB1] x 10-8 M<br />
Linearity range: 0.01 µM to 0.15<br />
µM / 3.12 ppb to 46.8 ppb AFB1<br />
LOD; 0.125 x 10⁻⁸ M / 0.39 ppb /<br />
390 ppt<br />
* By DPCSV; LOD: 0.5 x 10⁻⁸ M / 1.56 ppb.
Precision / repetibility;(0.1 µM / 31.2 ppb) (n =5)<br />
I p ±SD / nA(RSD) E p (V)<br />
Day 1: 932 ± 7.92 (0.85%) -1.30<br />
Day 2: 933 ± 7.74 (0.83%) -1.30<br />
Day 3: 933 ± 7.84 (0.84%) -1.30<br />
SWSV voltammograms of AFB1 (n=5): Day 1
Accuracy / Recovery:<br />
0.05 uM: 99.67 ± 0.48% (n=3) -1.30 V<br />
0.10 uM: 100.47 ± 0.34% (n=3) -1.30 V<br />
(a)<br />
(b)<br />
Voltammograms of (a) 0.05 and (b) 0.10 uM AFB1 (n=3)
Analysis of AFB1 in groundnut sample<br />
1) Extracted and cleaned-up: follows Chemistry<br />
Dept, MOSTI procedure.<br />
2) Recovery studies – AFB1 in groundnut eluate<br />
Result;<br />
Amount added / ppb Amount found /ppb Recovery (%), n=3<br />
3.00 2.82 ± 0.02 94.00 ± 0.67<br />
9.00 8.21 ± 0.14 91.22 ± 1.56<br />
15.00 13.88 ± 0.30 92.53 ± 2.00<br />
Recovery: > 90 % is considered good recovery.
SAMPLE<br />
INJECT 200 ul<br />
SAMPLE INTO CELL<br />
(+10 Ml BRB pH = 9.0)<br />
SCAN USING<br />
SWSV TECHNIQUE<br />
FLOW CHART OF SAMPLE ANALYSIS<br />
EXTRACTION<br />
AND CLEAN UP<br />
(FOLLOW CHEM DEPT, MOSTI<br />
PROCEDURE)<br />
STD ADDITION OF<br />
10 ppb OF AFB1<br />
PREPARE FINAL<br />
SOLUTION IN BRB<br />
pH = 9.0<br />
RESCAN<br />
USING SWSV<br />
TECHNIQUE
Voltammogram of real sample + 10 ppb AFB1,<br />
compare with HPLC result<br />
(a)<br />
(c)<br />
(b)<br />
(a) Blank (b) 200 ul real sample (c) real<br />
sample + 10 ppb afb1<br />
SWSV; 36.30 ppb HPLC; 36.00 ppb
Voltammogram of real sample + 10 ppb afb1 compare with HPLC<br />
result<br />
(a) Blank (b) 200 ul real sample (c) real<br />
sample + 10 ppb afb1<br />
SWSV; ND HPLC; ND<br />
No peak for AFB1: Not detected.
Results; AFB1 in groundnut samples (duplicate analysis)<br />
No of sample By SWSV/ ppb By HPLC/ppb<br />
1 ND ND<br />
2 ND ND<br />
3 ND ND<br />
4 9.21 8.25<br />
5 13.92 14.34<br />
6 36.30 36.00<br />
t test: No significant different between both<br />
techniques (t cal = 0.51 < t cri (p : 0.05) = 2.57)
CONCLUSION<br />
SWSV technique for the determination of<br />
AFB1 in groundnut sample was<br />
successfully developed. The technique<br />
is precise, accurate, high sensitive, fast<br />
and low cost technique.
ACKNOWLEDGEMENT<br />
SUPERVISORS:<br />
AP DR ABDUL RAHIM MOHD YUSOFF<br />
PROF RAHMALAN AHAMAD<br />
SHORT TERM GRANT: 75152/2004<br />
SCHOOL OF HEALTH SCIENCES, USM ,<br />
HEALTH CAMPUS, KUBANG KRIAN,<br />
KELANTAN<br />
MR RADWAN, CHEM DEPT. MOSTI,<br />
PENANG BRANCH.
CV result for 1.3 uM AFB1 in BRB pH 9.0<br />
Single cathodic peak at E p = -1.310 V �<br />
Irreversible reduction reaction at mercury electrode
FORMULA FOR CALCULATION AMOUNT<br />
OF AFB1 IN GROUNDNUT SAMPLE;<br />
ppb aflatoxin =<br />
P ’ / P x C x * 12.5 ( for injection vol = 200 ul)<br />
( P’ = I p of sample (nA), P = I p of std (nA)<br />
C = conc of injected std, 10 ppb)<br />
*For other injection volume;<br />
100 ul = x 25 300 ul = x 8.33<br />
400 ul = x 6.25 500 ul = x 5
Voltammogram of real sample+ 10 ppb afb1, compare<br />
with HPLC result<br />
(a) Blank (b) 200 ul real sample (c) real<br />
sample + 10 ppb afb1<br />
SWSV; 36.30 ppb<br />
Afb1 (ppb) = 94.3 x 10 x 12.5 = 36.30 ppb<br />
419 – 94.3<br />
(c)<br />
(b)<br />
(a)<br />
HPLC; 36.00 ppb
ces, herbs,<br />
uces blue<br />
anol : 360<br />
tor.<br />
assed with<br />
1.1<br />
l o<br />
70<br />
60<br />
50<br />
40<br />
I p ( n A )<br />
30<br />
20<br />
0.9<br />
0.7<br />
0.5<br />
y = 0.5097x + 0.4115<br />
R 2 = 0.995<br />
1.2 1.4 1.6 1.8 2 2.2 2.4 2.6 2.8<br />
log scan rate<br />
nEp<br />
of AFB2 chang<br />
r<br />
eincreasing<br />
scan ra<br />
wp<br />
a�Reduction<br />
of AF<br />
ie<br />
rirriversible<br />
reactio<br />
td<br />
h<br />
g<br />
4.3) I vs Va<br />
p r<br />
t<br />
a<br />
h<br />
pL<br />
em<br />
h i<br />
e<br />
n<br />
nr<br />
( e<br />
uc<br />
Ra<br />
mu<br />
2�AFB2<br />
r was adso
TION<br />
xin, dangerous<br />
ype I carcinogen<br />
tures;<br />
O<br />
O<br />
O O<br />
OCH 3<br />
O<br />
O O<br />
OCH 3<br />
AFG1 AFG2<br />
measures<br />
applied. Simple,<br />
and low cost<br />
IMENT<br />
6 processor and<br />
e electrode (MME)<br />
O<br />
O<br />
O<br />
4.<br />
a) DPCSV voltammogr<br />
i p = 61.71 nA ip = 59.97n<br />
b) SQWSV voltammogr<br />
ip = 833 nA ip = 816nA<br />
c) DPCSV and SQWSV
Paper will be published in<br />
<strong>Malaysia</strong>n Journal of Analytical Science<br />
1
SQUARE WAVE CATHODIC STRIPPING VOLTAMMETRIC TECHNIQUE FOR<br />
DETERMINATION OF AFLATOXIN B1 IN GROUND NUT SAMPLE<br />
Mohamad Hadzri Yaacob 1 , Abdull Rahim Hj. Mohd. Yusoff 2 and Rahmalan Ahamad 2<br />
1 School of Health Sciences, USM, 16150 Kubang Krian, Kelantan, <strong>Malaysia</strong><br />
2 Chemistry Dept., Faculty of Sciences, UTM, 81310 Skudai, Johor, <strong>Malaysia</strong><br />
Abstract An electroanalytical method has been developed for the detection and determination of the<br />
2,3,6a,9a-tetrahydro-4-methoxycyclo penta[c] furo[3’,2’:4,5] furo [2,3-h][l] benzopyran-1,11-dione<br />
(aflatoxin B1, AFB1) by a square wave cathodic stripping voltammetric (SWSV) technique on a hanging<br />
mercury drop electrode (HMDE) in aqueous solution with Britton-Robinson Buffer (BRB) at pH 9.0 as<br />
the supporting electrolyte. Effect of instrumental parameters such as accumulation potential (Eacc),<br />
accumulation time (tacc), scan rate (v), square wave frequency, step potential and pulse amplitude were<br />
examined. The best condition were found to be Eacc of -0.8 V, tacc of 100 s, v of 3750 mV/s, frequency of<br />
125 Hz, voltage step of 30 mV and pulse amplitude of 50 mV. Calibration curve is linear in the range of<br />
0.01 to 0.15 uM with a detection limit of 0.125 x 10 -8 M. Relative standard deviation for a replicate<br />
measurements of AFB1 (n = 5) with a concentration of 0.01 uM was 0.83% with a peak potential of -1.30<br />
V (against Ag/AgCl). The recovery values obtained in spiked ground nut elute sample were 94.00 +/-<br />
0.67 % for 3.0 ppb, 91.22 +/- 1.56 % for 9 ppb and 92.56 +/- 2.00 % for 15.0 ppb of AFB1. The method<br />
was applied for determination of the AFB1 in ground nut samples after extraction and clean-up steps. The<br />
results were compared with that obtained by high performance liquid chromatography (HPLC) technique.<br />
Abstrak Satu kaedah elektroanalisis telah dibangunkan untuk mengesan dan menentukan 2,3,6a,9atetrahydro-4-methoxycyclo<br />
penta[c] furo[3’,2’:4,5] furo [2,3-h][l] benzopyran-1,11-dione (aflatoxin B1,<br />
AFB1) menggunakan teknik voltammetri perlucutan katodik denyut pembeza di atas elektrod titisan raksa<br />
tergantung (HMDE) di dalam larutan akuas dengan larutan penimbal Britton-Robinson (BRB) pada pH<br />
9.0 bertindak sebagai larutan penyokong. Kesan parameter peralatan seperti keupayaan pengumpulan<br />
(Eacc), masa pengumpulan (tacc), kadar imbasan (v), frekuensi gelombang bersegi, kenaikan keupayaan dan<br />
amplitud denyut telah dikaji. Keadaan terbaik yang diperolehi adalah Eacc; -0.8 V, tacc; 100 s, v; 3750<br />
mV/s, frekuensi; 125 Hz, kenaikan keupayaan; 30 mV dan amplitud denyut; 50 mV. Keluk kalibrasi<br />
adalah linear pada julat di antara 0.01 ke 0.15 uM dengan had pengesan pada 0.125 x 10 -8 M. Sisihan<br />
piawai relatif untuk 5 kali pengukuran AFB1 dengan kepekatan 0.01uM ialah 0.83 %. Nilai perolehan<br />
semula di dalam larutan elusi sampel kacang yang disuntik dengan 3.0 ppb, 9 ppb dan 15.0 ppb AFB1<br />
adalah 94.00 +/- 0.67 %, 91.22 +/- 1.56 % dan 92.56 +/- 2.00 % masing-masingnya. Kaedah ini telah<br />
digunakan untuk menentukan kandungan AFB1 di dalam sampel kacang tanah selepas proses<br />
pengekstraksian dan pembersihan dijalankan. Keputusan yang diperolehi telah dibanding dengan<br />
keputusan dari kaedah kromatografi cecair berprestasi tinggi.<br />
Keywords: square wave stripping voltammetry, HMDE, aflatoxin B1, ground nut<br />
Introduction<br />
Aflatoxins (AF), the mycotoxin produced mainly by Aspergillus flavus and parasiticus and<br />
display strong carcinogenicity [1]. They are dangerous food and contaminants and represent a worldwide<br />
threat to public health. AFB1, B2, G1 and G2 and their metabolites M1 and M2 are the most common,<br />
1 Corresponding address:<br />
Chemistry Dept, Faculty of Science, UTM,<br />
81310 Skudai, Johor, <strong>Malaysia</strong><br />
tel: 07-553 4492<br />
2
and of these, AFB1 and AFG1 are observed most frequently in food [2]. Of these, researches have shown<br />
AFB1 (Fig 1) exhibits most toxic [3] with the order of toxicity is AFB1 > AFG1 > AFB2 > AFG2<br />
indicates that the terminal furan moiety of AFB1 is a critical point for determining the degree of<br />
biological activity of this group of mycotoxins [4]. Many countries including <strong>Malaysia</strong> have stringent<br />
regulatory demands on the level of aflatoxins permitted in imported and traded commodities.<br />
O<br />
O<br />
Figure 1 Chemical structure of AFB1<br />
O<br />
O<br />
One of the foodstuffs which is most occurrence of AFB1 is ground nut. In <strong>Malaysia</strong>, the AFB1<br />
level in peanut is regulated with maximum level that cannot be greater than 15 ppb [5]. Several analytical<br />
techniques for quantitative determination of the AFB1 in ground nut have been proposed such as thin<br />
layer chromatograhpy [6], high performance liquid chromatography[ 7,8,9 ]and an enzyme-linked<br />
immunosorbent assay, ELISA [10], All these methods, however, require specialist equipment operated<br />
by skilled personel and expensive instruments and high maintenance cost [11].<br />
Due to all these reasons, a voltammetric technique which is fast, accurate and require low cost<br />
equipment [12,13] is proposed. A square wave cathodic stripping which is presented in this paper is one<br />
of the voltammetric technique that in particularly, has a few advantages compared to other voltammetric<br />
technique such as high speed, increased analytical sensitivity and relative insensitivity to the presence of<br />
dissolved oxygen [14]. Previous experiment using cyclic voltammetric technique showed that AFB1<br />
reduced at mercury electrode and the reaction is totally irreversible [15]. This work aimed to study and<br />
develop a SWSV method for determination of AFB1 at trace levels and to determine this aflatoxin in<br />
ground nut samples. No such report has been published regarding this experiment until now.<br />
Experiment<br />
Apparatus<br />
Square-wave voltammograms were obtained with Metrohm 693 VA Processor coupled with a<br />
Metrohm 694 VA stand. Three electrode system consisted of a hanging mercury drop electrode (HMDE)<br />
was used as the working electrode, Ag/AgCl/3 M KCl reference electrode and a platinum wire auxiliary<br />
electrode. A 20 ml capacity measuring cell was used for placing supporting electrolyte and sample<br />
analytes. All measurements were carried out at room temperature. All pH measurements were made<br />
with Cyberscan pH meter, calibrated with standard buffers at room temperature.<br />
Reagents<br />
AFB1 standard (1mg per bottle) was purchased from Sigma Co. and was used without further<br />
purification. Stock solution (10 ppm or 3.21 x 10 -5 M) in benzene:acetonitrile (98:2) were prepared and<br />
stored in the dark at 14 0 C. The diluted solution were prepared daily by using certain volume of stock<br />
solution, degassed by nitrogen until dryness and redissolved in Britton-Robinson buffer (BRB) solution at<br />
O<br />
O<br />
3
pH 9.0. Britton-Robinson buffer solutions (prepared from a stock solution 0.04 M phosphoric (Merck),<br />
boric (Merck) and acetic (Merck) acids; and by adding sodium hydroxide (Merck) 1.0 M up to pH of 9.0.<br />
All solutions were prepared in double distilled dionised water (~ 18M Ω cm). All chemicals were of<br />
analytical grade reagents.<br />
Procedure<br />
For voltammetric experiments, 10 ml of Britton-Robinson buffer solution with pH 9.0 was placed<br />
in a voltammetric cell, through which a nitrogen stream was passed for 600 s before recording the<br />
voltammogram. The selected Eacc = - 800 mV was applied during the tacc = 100 s while the solution was<br />
kept under stirring. After the accumulation time had elapsed, stirring was stopped and the selected<br />
accumulation potential was kept on mercury drop for a rest time (tr = 10 s), after which a potential scan<br />
was performed between -1.00 as initial potential (Ei) and finished at -1.400 V as final potential (Ef ) by<br />
SWSV technique.<br />
Procedure for the determination in ground nut samples<br />
AFB1 was extracted according to the standard procedure developed by Chemistry Department,<br />
Penang Branch, Ministry Of Science, Technology and Innovation, <strong>Malaysia</strong> [16]. 1ml of the final<br />
solution from extraction and clean-up steps in chloroform was pipette into amber bottle, degassed with<br />
nitrogen and redissolved in 1ml of BRB solution. 200 ul of this solution was spiked into 10 ml supporting<br />
electrolyte in volumetric cell. After that, the general procedure was applied and voltammogram of sample<br />
was recorded. This experiment was followed by a standard addition of 10 ppb of AFB1 standard addition<br />
and voltammogram of sample with AFB1 standard was recorded.<br />
Result and discussion<br />
Using previous differential pulse stripping voltammetry (DPCSV) optimum parameters [17],<br />
SWSV was run to determine 0.1 uM AFB1 in BRB pH 9.0. It gave a single reduction signal with peak<br />
height (Ip) of 250 nA at peak potential (Ep) of -1.26 V (against Ag/AgCl). The SWS voltammograms<br />
shows improved Ip compared to that obtained bt DPCSV where the Ip was increased almost 4 times as<br />
shown in Figure 2.<br />
Cyclic voltammogram of AFB1 in BRB pH 9.0 is shown in Figure 3 which only produced a<br />
cathodic peak that indicates the non-reversibility of the electrode process [18].<br />
Figure 2 Voltammograms of 0.1 uM AFB1 obtained by (a) DPCSV and (b) SWSV techniques.<br />
Experimental condition; for DPCSV: Ei = -1.0 V, Ef = -1.4 V, Eacc = -0.6 V, tacc = 80 s, υ = 50 mV/s and<br />
4
pulse amplitude = 80 mV and for SWSV: Ei = -1.0 V, Ef = -1.4 V, Eacc = -0.6 V, tacc = 80 s, frequency =<br />
50 Hz, voltage step = 0.02, amplitude = 50 mV and υ = 1000 mV/s.<br />
Figure 3 Cyclic voltammogram of AFB1 in BRB pH 9.0. Experimental conditions: Ei = 0, Elow = -1.5<br />
V, Ehigh = 0 and scan rate = 200 mV/s.<br />
The effect of the pH of the BRB on the stripping was studied in a pH range of 6 – 13 (Figure 4).<br />
The Ip increased slowly with increasing pH up to 8.0 followed with sharply increased for pH 8.0 to 9.0,<br />
then decreased in pH 10.0 and continuously decreased in a range of 10 – 13. Thus pH 9.0 was chosen for<br />
the analysis. This result is not contradicted with that found by Smyth et al. (1979) when they performed<br />
polarographic study of AFB1 [19].<br />
Ip (nA)<br />
300<br />
250<br />
200<br />
150<br />
100<br />
50<br />
0<br />
5 6 7 8 9 10 11 12 13 14<br />
pH of BRB<br />
Figure 4 Influence of pH of BRB on the Ip of 0.10 uM AFB1 using SWSV technique. The instrumental<br />
parameters are the same as in Figure 2.0.<br />
Figure 5 shows a dependence of the Ep on pH. Shifting of the Ep towards the negative direction at<br />
higher pH implies that the reduction process takes up hydrogen ions [20]. A double bond in aromatic ring<br />
conjugates with ketone group, in general, undergoes a reduction at mercury electrode. The suggested<br />
mechanism of this reaction in BRB pH 9.0 is illustrated in Figure 6 as reported by Smyth et al. (1979)<br />
[21].<br />
5
Ep (-V)<br />
1.34<br />
1.32<br />
1.3<br />
1.28<br />
1.26<br />
1.24<br />
1.22<br />
1.2<br />
1.18<br />
5 6 7 8 9 10 11<br />
Figure 5 Relationship between Ep of AFB1 with pH of BRB<br />
2<br />
O<br />
O<br />
CH 3<br />
O<br />
2e -<br />
2H +<br />
pH<br />
O<br />
2 H 2O<br />
O<br />
Dimer + 2 OH -<br />
Figure 6 Mechanism for reduction of AFB1 at mercury electrode in BRB pH 9.0<br />
Optimisation of condition for the stripping analysis<br />
The voltammetric determination of analytes at trace levels normally involves very small current<br />
response. For that reason it is important to optimise all those parameters which may have an influence on<br />
the measured current. The effect of Ei , Eacc , tacc, frequency, voltage step and amplitude were studied.<br />
Square-wave voltammetric technique was used with stirring. For this study, 1.0 x 10 -7 M of AFB1 was<br />
spiked into supporting electrolyte.<br />
A study of the influence of Ei showing a peak height (Ip) was obtained for Ei = -1.0 V (Figure 7).<br />
The Ip was slowly decreased for Ei more negative than -1.0 V. This value was chosen for subsequent<br />
studies further optimisation step. Influence of Eacc to Ip of AFB1 was investigated where the Eacc was<br />
varied between 0 to -1.4 V. The maximum value of Ip obtained at -0.8 V (366 nA) as shown in Figure 8.<br />
This value was selected for subsequent experiments.<br />
2<br />
CH 3<br />
O<br />
6
The dependence of Ip on tacc was studied. The effect of tacc on the Ip was studied where tacc was<br />
varied from 0 to 160 s. The result is shown in Figure 9 which reveals that there is linearly up to 100s<br />
according to equation y = 3.8557x + 21.383 (n=6) with R 2 = 0.9936, then it increased rather slowly<br />
leveling off at about 140 s. At 160 s, Ip decreased which may be due to the electrode saturation [21].<br />
Thus, 100 s was appeared to be an optimum tacc for the pre-concentration prior to stripping.<br />
I p (nA)<br />
I p (nA)<br />
300<br />
250<br />
200<br />
150<br />
100<br />
50<br />
0<br />
0.2 0.4 0.6 0.8<br />
Ei (-V)<br />
1 1.2 1.4<br />
Figure 7 Effect of Ei on the Ip of 0.1 uM AFB1 in BRB pH 9.0<br />
I p (nA)<br />
400<br />
350<br />
300<br />
250<br />
200<br />
150<br />
100<br />
50<br />
0<br />
0 0.2 0.4 0.6 0.8 1 1.2 1.4 1.6<br />
Eacc (-V)<br />
Figure 8 Effect of Eacc on the Ip of 0.1 uM AFB1 in BRB pH 9.0<br />
450<br />
400<br />
350<br />
300<br />
250<br />
200<br />
150<br />
100<br />
50<br />
0<br />
0 40 80 120 160 200<br />
Tacc (s)<br />
Figure 9 Effect of tacc on the Ip of 0.1 uM AFB1 in BRB pH 9.0<br />
7
For other instrumental condition such as square wave frequency, step potential and pulse<br />
amplitude were examined, varying one of them and maintaining constant others. The variable ranges<br />
were: 25 to 125 Hz for the frequency, 0.01 to 0.04 for the voltage step and 25 – 100 mV for pulse<br />
amplitude. Generally, the Ip increase by increasing all of these instrumental parameters [22]. At higher<br />
potential values the peak width increase; at higher frequency values the current background increases.<br />
Finally, the condition selected were: frequency = 125 Hz, voltage step = 0.03 V and pulse amplitude = 50<br />
mV (Figures 10 to 12). Under optimised parameters, Ip of AFB1 was 956 nA which is 16 times higher<br />
compared to that obtained by DPCSV. Figure 13 shows voltammograms of 0.1 uM AFB1 obtained by<br />
SWSV and DPCSV techniques.<br />
I p (nA)<br />
1000<br />
800<br />
600<br />
400<br />
200<br />
0<br />
1200<br />
1000<br />
800<br />
600<br />
400<br />
200<br />
0<br />
0 25 50 75 100 125 150<br />
Frequency (Hz)<br />
Figure 10 Dependence of the Ip of AFB1 on SWSV frequency<br />
I p (nA)<br />
0 0.01 0.02 0.03 0.04 0.05<br />
Voltage step (V)<br />
Figure 11 Dependence of the Ip of AFB1 on SWSV voltage step<br />
8
I p (nA)<br />
1200<br />
1000<br />
800<br />
600<br />
400<br />
200<br />
0<br />
0 0.025 0.05 0.075 0.1 0.125<br />
Amplitude (V)<br />
Figure 12 Dependence of the Ip of AFB1 on SWSV pulse amplitude<br />
Figure 13 Voltammograms of AFB1 obtained by (a) DPCSV and (b) SWSV techniques in BRB pH 9.0.<br />
Voltammetric determination of AFB1 and analytical characteristics of the method<br />
Using the selected conditions already mentioned, a study was made of the relationship between Ip<br />
and concentration. There is a linear relationship in the concentration range 0.01 to 0.15 uM as shown in<br />
Figure 14. Limit of detection (LOD) was 0.389 ppb (0.125 x 10 -8 M) which was determined by standard<br />
addition of low concentration of AFB1 until obtaining the sample response that is significantly difference<br />
from blank [23]. Relative standard deviation (RSD) of the analytical signals at several measurement<br />
(n=5) of 0.10 uM was 0.83%.<br />
I p (nA)<br />
1400<br />
1200<br />
1000<br />
800<br />
600<br />
400<br />
200<br />
0<br />
y = 62.373x + 246.15<br />
R 2 = 0.9956<br />
0 5 10<br />
[AFB1] / 10<br />
15 20<br />
-8 M<br />
Figure 14 Calibration plot of AFB1 in BRB pH 9.0 obtained by SWSV technique.<br />
9
Determination of AFB1 in ground nut samples<br />
The proposed method was applied to the analysis of the AFB1 in ground nut samples. Recovery<br />
studies were performed by spiked with difference concentration levels of AFB1 standard into eluate of<br />
ground nut sample. In this case the concentrations used were 3 ppb (0.963 x 10 -8 M), 9 ppb (2.889 x 10 -8<br />
M) and 15 ppb (4.815 x 10 -8 M). The results of these studies are shown in Table 1. For analysis of AFB1<br />
in ground nut samples, the standard addition method was used in order to eliminate the matrix effects.<br />
Figure 15 show voltammograms of real sample together with spiked AFB1 standard. Table 2 listed the<br />
content of AFB1 in 6 samples obtained by proposed technique compared with that obtained by HPLC.<br />
The results show that there are no significant different of AFB1 content obtained by both techniques.<br />
Table 1 Percent recovery of AFB1 spiked in real samples (n=3)<br />
Amount added (ppb)<br />
3.00<br />
9.00<br />
15.00<br />
Amount found (ppb)<br />
2.82 +/- 0.02<br />
8.21 +/- 0.14<br />
13.88 +/- 0.30<br />
Recovery (%) n=3<br />
94.00 +/- 0.67<br />
91.22 +/- 1.56<br />
92.53 +/- 2.00<br />
Figure 15 SWS voltammograms of real sample (b) and spiked AFB1 (c) obtained in BRB pH 9.0 as the<br />
supporting electrolyte (a)<br />
10
Table 2 AFB1 content in ground nut samples by proposed technique compared with those obtained by<br />
HPLC.<br />
Conclusion<br />
No of sample<br />
1<br />
2<br />
3<br />
4<br />
5<br />
6<br />
By SWSV<br />
ND<br />
ND<br />
ND<br />
9.21<br />
13.92<br />
36.30<br />
AFB1 content in real sample<br />
By HPLC<br />
ND<br />
ND<br />
ND<br />
8.25<br />
14.34<br />
36.00<br />
A SWSV technique was successfully developed for the determination of AFB1 in ground nut as<br />
an alternative method for determination of AFB1 which is sensitive, accurate and fast technique. The<br />
results are not significant different with that obtained by accepted technique used for routine analysis of<br />
AFB1.<br />
Acknowledgement<br />
One of the author would like to thank University Science <strong>Malaysia</strong> for approving his study leave<br />
and financial support to carry out his further study at Chemistry Dept., UTM. We also indebt to UTM for<br />
short term grant (Vot No 75152/2004) and to Chemistry Department, Penang Branch, Ministry of<br />
Science, Technology and Innovation (MOSTI) for their help in analysis of aflatoxin in ground nut<br />
samples using HPLC technique.<br />
References<br />
1. Akiyama, H. Goda, Y. Tanaka, T and Toyoda, M. (2001). “Determination of aflatoxinsB1, B2,<br />
G1 and G2 in spices using a multifunctional column clean-up” J. Of Chromatography A, 932.<br />
153-157.<br />
2. Yoruglu, T, Oruc, H.H. and Tayar, M. (2005) “Aflatooxin M1 levels in cheese samples from<br />
some provinces of Turkey” Food Control. 16(10): 883-895.<br />
3. World Health Organisation in: IARC Monograph on the evaluation of carcinogenic risk to<br />
human, WHO, Lyon, 1987.<br />
11
4. Hall, A.J., Wild, C.P in: Eaton, D.L., Groopman, J.D. (Eds). “The toxicology of aflatoxins:<br />
Human Health, Veterrinary and Agricultural Significance” Academic, New York, 1994.<br />
5. <strong>Malaysia</strong>n Food Act (1983) Act No 281, Reviewed 2002, Food Quality Control Dept, Ministry of<br />
Health, <strong>Malaysia</strong>.<br />
6. Bicking,M.K.L., Kniseley, R.N and Svec, H.J (1983) “Coupled-Column for quantitating low<br />
levels of aflatoxins” J . Assoc. Off. Anal. Chem. 66, 905-908.<br />
7. Beebe, B.M. (1978). “Reverse phase high pressure liquid chromatographic determination of<br />
aflatoxins in foods” J. Assoc. Off. Anal. Chem. 81. 1347-1352.<br />
8. Cepeda, A., Franco, C.M., Fente, C.A., Vazquez, B.I., Rodriguez, J.L., Prognon, P. and<br />
Mahuzier, G. (1996) “Postcolumn excitation of aflatoxins using cyclodextrins in liquid<br />
chromatography for food analysis” J Of Chrom A. 721. 69-74.<br />
9. Garner, R.C., Whattam, M.M. , Taylor, P.J.L. and Stow, M.W ( 1993) “Analysis of United<br />
Kingdom purchased spices for aflatoxins using immunoaffinity column clean up procedure<br />
followed up by high-performance liquid chromatographic analysis and post-column derivatization<br />
with pyridium bromide perbromide” J. Chromatography, 648. 485-490<br />
10. Beaver, R.W., James, M.A. and Lin ,T.Y. (1991). “ELISA-based screening test with liquid<br />
chromatography for the determination of aflatoxin in corn” J. Assoc.Off. Anal. Chem , 74: 827 –<br />
829<br />
11. Garden, S.R. and Strachan, N.J.C.(2001). “Novel colorimetric immunoassay for the detection of<br />
aflatoxin B1” Anal Chim Acta, 444. 187-191.<br />
12. Braitina, Kh. Z., Malakhova, N.A. and Stojko, Y. (2000) “Stripping voltammetry in<br />
environmental and food analysis” Fresenius J Anal Chem 368. 307-325<br />
13. Skrzypek, S., Ciesielski, W., Sokolowski, A., Yilmaz, S. and Kazmierczak, D. (2005) “Square<br />
wave adsorption stripping voltammetric determination of famotidine in urine”Talanta. Article in<br />
press.<br />
14. Economou, A., Bolis, S.D., Efstathiou, C.E. and Volikakis, G.J (2002) “A virtual electrochemical<br />
instrument for square wave voltammetry”.Anal. Chim. Act. 467. 179-188.<br />
15. Yaacob, M.H., Mohd Yusoff, A.R. and Ahmad, R. (2003). “Cyclic voltammetry of AFB2 at the<br />
mercury electrode”. Paper presented at Simposium Kimia <strong>Malaysia</strong> ke 13 (SKAM-13), 9 – 11 th<br />
September 2003, Kucing, Sarawak, <strong>Malaysia</strong>.<br />
16. Standard procedure for determination of aflatoxins (2000). Chemistry Dept. Penang Branch,<br />
Ministry of Science, Technology and Innovation (MOSTI), <strong>Malaysia</strong> – unpublished paper.<br />
17. Yaacob, M.H., Mohd Yusoff, A.R. and Ahamad, R. (2005). “Determination of the aflatoxin B1 in<br />
ground nut by differential pulse cathodic stripping voltammetry technique”. Paper presented at<br />
2 nd National Seminar On Chemistry, 14 th April 2005, <strong>Universiti</strong> Sumatera Utara, Medan,<br />
Indonesia.<br />
12
18. Rodriguez, J., Berzas, J.J., Casteneda, G. and Rodriguez, N. (2005). “Voltammetric determination<br />
of Imatinib (Gleevec) and its main metabolite using square-wave and adsorptive stripping squarewave<br />
techniques in urine samples”. Talanta. 66. 202-209.<br />
19. Smyth, M. R., Lawellin, D. W. and Osteryoung, J.G. (1979). “Polarographic study of Aflatoxin<br />
B1, B2, G1 and G2: Application of differential pulse polarography to the determination of<br />
Aflatoxin B1 in various foodstuffs” Analyst. 104. 73-78<br />
20. Sun, N., Mo, W-M., Shen, Z-L. and Hu, B-X. (2005). “Adsorptive stripping voltammetric<br />
technique for the rapid determination of tobramycin on the hanging mercury electrode”. J Pharm.<br />
Biomed. Anal. Article in press.<br />
21. Wang J. (1994) “Analytical Electrochemistry” VCH Publisher, USA.<br />
22. Komorsky-Lovric, S., Lovric, M. and Branica, M. (1992). “Peak current-frequency relationship in<br />
adsorptive stripping square-wave voltammetry”. J of Electroanal. Chem. 335(1-2). 297-308.<br />
23. Barek, J. , Fogg, A. G., Muck, A. and Zima, J. (2001). “Polarography and Voltammetry at<br />
Mercury Electrodes”, Critical Reviews In Analytical Chemistry, 31. 291-309<br />
13
PAPER SENT TO PROF BAREK<br />
TO BE PUBLISHED IN<br />
J. COLLECT. CZECH. CHEM. COMMON<br />
( IN PRESS )<br />
1
DEVELOPMENT OF DIFFERENTIAL PULSE STRIPPING VOLTAMMETRIC<br />
(DPSV) TECHNIQUE FOR DETERMINATION OF AFLATOXIN G1 AT THE<br />
MERCURY ELECTRODE<br />
Mohamad Hadzri Yaacob 1 , Abdull Rahim Hj. Mohd. Yusoff 2 and Rahmalan<br />
Ahamad 2<br />
1 School of Health Sciences, USM, 16150 Kubang Krian, Kelantan<br />
2 Chemistry Dept., Faculty Of Sciences, UTM, 81310 Skudai, Johor<br />
Abstract<br />
DPSV technique was developed for determination of aflatoxin G1 (AFG1) in<br />
Britton-Robinson Buffer (BRB). Controlled Growth Mercury Electrode (CGME)<br />
and Ag/AgCl have been used as working and reference electrodes respectively.<br />
In this experiment, the analyte was initially scanned from -200 mV to -1500 mV in<br />
BRB from pH 2.0 to 9.0. The effect of pH of supporting electrolyte, scan rate,<br />
accumulation potential, accumulation time and pulse amplitude on the peak<br />
potential and peak current of the analyte were studied. The results showed that<br />
AFG1 compound undergoes reduction at potential -1175 mV ( versus Ag / AgCl ).<br />
Maximum peak height was observed in BRB pH 9.0 with the optimised<br />
parameters such as scan rate; 50 mV/s, accumulation potential; -600 mV,<br />
accumulation time; 80s and pulse amplitude; 80 mV . Under the optimum<br />
condition, the peak height of AFG1 was proportional to the concentrations of the<br />
AFG1 in the range of 0.02 to 0.26 uM with a limit of detection of 0.015 uM.<br />
Relative standard deviation for a replicate measurements of AFG1 ( n= 8) with<br />
the concentrations of 0.06 and 0.20 uM were 3.52% and 1.54% respectively.<br />
Recoveries of the different AFG1 concentrations in prepared standard solutions<br />
were found to be 85% to 95% with the precision around 0.4% to 1.0%.<br />
1 Correspondence address;<br />
Chemistry Dept, Faculty Of Science,<br />
UTM 81310 Skudai Johor<br />
2
O<br />
O<br />
Introduction<br />
Aflatoxin G1 ( 3,4,7a,10a-tetrahydro-5-methoxy-1H, 12H furo[3’,2’:4,5]furo[2,3h]pyrano[3,4-c][1]-benzopyran-1,12-dione),<br />
structural formula is shown in Figure<br />
1.0, is one of the type of aflatoxin which is naturally occurance (1). It is one of the<br />
compound in mycotoxin group (2) that is produced by Aspergillus flavus and<br />
Aspergillus parasticus fungi (3,4). It is found in various contaminated food such<br />
as peanuts and peanut products, barley, maize, cottonseed, coffee beans and<br />
others (5). It produces green color under ultraviolet light (6,7). In health aspect, it<br />
is considered as human carcinogen by the International Agency for Research on<br />
Cancer (IARC) as reported in World Health Organisation (WHO)’s monograph<br />
(8). It has been reported to be teratogenic, tremorogenic, and haemorrhagic to<br />
wide range of organisms and to cause hepatic carcinoma in man (9)<br />
Consequently, AFG1 level in animal feed and various human food is now<br />
monitored and tightly regulated by various countries. In this country, regulatory<br />
level for AFG1 and total aflatoxins is 15 ppb in raw peanuts and 5 ppb for others<br />
(10). Due to all these reasons, selecting appropriate and accurate method of<br />
analysis of AFG1 is absolutely necessary to determine AFG1 at the part-of-billion<br />
(ppb) level.<br />
O<br />
O<br />
O O<br />
Figure 1.0 Chemical structure of AFG1<br />
There have been several reports for the determination of AFG1 including thin<br />
layer chromatography (11,12), high performance liquid chromatography with<br />
various type of detectors ( 13,14,15, 16 ) and polarographic technique (17) but<br />
O<br />
3
no report has been published concerning the use of stripping voltammetric<br />
technique. The development of new method capable of determining AFG1 in<br />
food sample is important. Stripping voltammetric technique was selected for this<br />
study due to its simple, easy to use, sensitive and accurate technique (18). This<br />
technique applies pre-concentration step that will increase sensitivity of the<br />
method (19). This paper will describe the development of DPSV technique for<br />
determination of AFG1 using CGME as the working electrode.<br />
Materials and Methods<br />
All reagents employed were of analytical grade. Water purified from a Nano Pure<br />
Ultrapure water system ( Branstead / Thermolyne) was used for all dilution and<br />
sample preparation. AFG1 was purchased from SIGMA: 1 mg was dissolved in<br />
hexane: acetonitrile (98:2) to produce 10 ppm solution. A stock of Britton-<br />
Robinson buffer (BRB) solution 0.04 M was prepared as follows: 2.47 g boric<br />
acid (Fluka), 2.30 ml acetic acid (MERCK) and 2.70 ml orthophosphoric acid (<br />
Ashland Chemical ) were dissolved in 1 l deionised water. The pH of the solution<br />
was adjusted to the desired values by adding 1 M sodium hydroxide (BDH) or 1<br />
M hydrochloric acid ( MERCK). Hexadistilled mercury, grade 9N, used for<br />
working electrode was purchased from MERCK.<br />
All voltammograms were recorded with a BAS CV-50W Voltammetric Analyser<br />
in connection with a Controlled Growth Mercury Electrode (CGME) stand<br />
equipped with a three-electrode system consisting of an Ag / AgCl reference<br />
electrode, a platinum wire counter electrode and the CGME as working<br />
electrode. A 20 ml capacity BAS MR-1208 cell was used. In all voltammetric<br />
analysis, the supporting electrolyte solution was deaerated by a stream of<br />
nitrogen for at least 10 min. A pH meter Cyber-scan model equipped with a<br />
glass electrode combined with an Ag / AgCl reference electrode, was employed<br />
for the pH measurements.<br />
Differential pulse stripping voltammograms (DPSVs) of AFG1 were run after<br />
purging the test solution for at least 5 min. The DPSVs were scanned from -200<br />
to -1500 mV with scan rate of 40 mV/s, accumulation potential ( Eacc ) -800 mV,<br />
4
accumulation time ( tacc ) 40 s, pulse amplitude 50 mV, pulse width 50-ms and<br />
pulse period 200-ms.<br />
Results and Discussion<br />
From our previous studies on the cyclic voltammograms of AFG1 in BRB pH 9.0,<br />
a reduction peak was observed at -1245 mV ( against Ag / AgCl) and no anodic<br />
peak at oxidation wave. The results of this CVs showed that AFG1 underwent<br />
irreversible reduction reaction at the mercury electrode (20). Due to this<br />
electroanalytical properties, differential pulse cathodic stripping voltammetric<br />
technique was applied in this study using the same supporting electrolyte. By<br />
using initial parameters as mentioned before, the peak potential ( Ep ) of 0.15 uM<br />
AFG1 was obtained at -1175 mV with peak current ( Ip ) of 34.73 nA ( Figure<br />
2.0 ). Several parameters have been optimised so as to obtain a more<br />
symmetrical and higher reduction peak.<br />
Figure 2.0 Voltammograms of 0.15 uM AFG1 (b) in BRb pH 9.0 (a) . Condition;<br />
scan rate; 40 mV/s, accumulation potential ( Eacc ); -800 mV, accumulation time<br />
( tacc ); 40 s, pulse amplitude; 50 mV, pulse width; 50-ms and pulse period; 200ms.<br />
Effect of pH of BRB<br />
The effect of different pH medium of BRB have been studied. The results<br />
showed that a reduction peak was first observed at pH 5.0 which increases in<br />
5
peak height as the pH increases. It reaches its optimum height at pH 9.0. At pH<br />
more than 9.0, the peak height decreases rapidly and no peak was observed at<br />
pH more than 12.0 ( Fig 3.0 ). This results suggested that proton ion played a<br />
significant role in the reduction of AFG1 on mercury electrode. Hence, BRB with<br />
pH 9.0 was applied in this experiment..<br />
Ip (nA)<br />
50<br />
40<br />
30<br />
20<br />
10<br />
0<br />
4 6 8<br />
pH of BRb<br />
10 12<br />
Figure 3.0 The effect of pH of BRB on peak current of AFG1. [AFG1] = 0.15 uM<br />
Condition: scan rate; 40 mV/s, accumulation potential ( Eacc ); -800 mV,<br />
accumulation time ( tacc ); 40 s, pulse amplitude; 50 mV, pulse width; 50-ms and<br />
pulse period; 200-ms.<br />
Effect of potential windows, accumulation potential ( Eacc ) and<br />
accumulation time ( tacc) )<br />
The influence of potential windows on the cathodic peak current of AFG1 was<br />
studied by varying the potential windows from -200 to -1000 mV and from -1400<br />
to -1500 mV for initial ( Ei ) and final potential ( Ef ) respectively. The results<br />
showed that with Ei = -950 mV and Ef = -1400 mV, the peak current at Ep = -<br />
1160 mV was 41.50 nA which is higher than using initial potential windows as<br />
described in previous experiment. Therefore, this potential window was used for<br />
all subsequent measurements. The dependence of the cathodic peak current on<br />
Eacc was also studied. The highest peak current was found when Eacc was -600<br />
mV and when Eacc changed to more negative than -600 mV, the Ip decreases<br />
6
( Figure 4.0 ) which indicated that maximum accumulation of AFG1 at mercury<br />
electrode occurred when potential of -600 mV was applied on it in BRB pH 9.0.<br />
The effect of tacc on Ip of AFG1 also was studied. The Ip of AFG1 was found to<br />
increase with increasing tacc ( Figure 5.0 ) indicating continueous accumulation<br />
of AFG1 at the electrode surface with increasing accumulation time. Normally,<br />
the increase in the response current continued until a maximum signal level<br />
presumable corresponding to a saturation electrode surface was attained (21).<br />
The results thus obtained indicated that the optimum tacc for AFG1 was 80 s.<br />
Hence 80 s accumulation time was employed throughout this experiment.<br />
I p ( nA)<br />
60<br />
40<br />
20<br />
0<br />
ip (nA)<br />
0 200 400 600 800<br />
Eacc (-mV)<br />
1000 1200 1400 1600<br />
Figure 4.0 Effect of accumulation potential on Ip of AFG1<br />
80<br />
60<br />
40<br />
20<br />
0<br />
0 50 100<br />
tacc (s)<br />
150 200<br />
Figure 5.0 Effect of accumulation time on Ip of AFG1<br />
7
Effect of instrumental parameters<br />
As the scan rate was varied from 20 to 100 mV s -1 , the Ip increases and reached<br />
it maximum value at scan rate of 50 mV s -1 , after which the peaks became<br />
broader with undesired tail at their end. A similar pattern for Ip was obtained with<br />
increasing pulse amplitude ( from 30 to 120 mV ). A pulse amplitude of 80 mV<br />
with scan rate of 50 mV s -1 were chosen for further studies. Using all optimised<br />
parameters ( Ei = -950 mV, Ef = 1400 mV, Eacc = -600 mV, tacc = 80 s, scan rate =<br />
50 mV s -1 , pulse amplitude = 80 mV ) the Ip of 0.15 uM AFG1 was 75.10 nA<br />
with Ep at -1150 mV was obtained<br />
Calibration graph, detection limit, precision and recovery<br />
The differential pulse cathodic stripping voltammograms at different<br />
concentrations of AFG1 under optimum conditions are shown in Fig. 6.0. The Ip<br />
of AFG1 increased linearly with increasing concentration up to 0.26 uM. A linear<br />
calibration graph was obtained in the concentration range 0.02 to 0.26 uM AFG1<br />
( n = 10, r = 0.9980). At higher concentrations Ip tend to level off which may be<br />
due to electrode surface saturation (20). The detection limit ( three times signalto-noise<br />
) was found to be 0.015 uM AFG1. For eight successive determinations<br />
of 0.06 and 0.20 uM AFG1, relative standard deviations were 3.52 and 1.54 %<br />
respectively which indicated that the precision of the method was good.<br />
Recovery of the different AFG1 concentrations in prepared standard solutions<br />
were found to be 85 to 95% with precision around 0.4 to 1.0 % as listed in Table<br />
1.0.<br />
8
Ip (nA )<br />
160<br />
140<br />
120<br />
100<br />
80<br />
60<br />
40<br />
20<br />
0<br />
y = 5.5958x + 3.7725<br />
R 2 = 0.998<br />
0 0.05 0.1 0.15 0.2 0.25 0.3<br />
[AFG1] / uM<br />
(A) (B)<br />
Figure 6.0 (A) : Differential pulse cathodic stripping voltammograms of AFG1 at<br />
mercury electrode. AFG1 concentrations in (a) BRB pH 9.0; (b) 0.02 uM, (c)<br />
0.04 uM, (d) 0.06 uM, (e) 0.08 uM, (f) 0.1 uM, (g) 0.12 uM, (h) 0.14 uM, (i) 0.18<br />
uM, (j) 0.22 uM, (k) 0.26 uM. (B) The related calibration graph. Conditions: Ei = -<br />
950 mV, Ef = -1400 mV, Eacc = -600 mV, tacc = 80 s, scan rate = 50 mV s -1 , pulse<br />
amplitude = 80 mV .<br />
9
Table 1.0 Recovery of spiked AFG1 standard in BRB pH 9.0<br />
[AFG1]<br />
injected<br />
0.10 uM<br />
0.15 uM<br />
0.20 uM<br />
Ip (nA)<br />
56.35<br />
56.84<br />
56.62<br />
78.21<br />
77.19<br />
77.20<br />
98.42<br />
99.23<br />
98.14<br />
Ep (-mV)<br />
1150<br />
1150<br />
1150<br />
1140<br />
1140<br />
1140<br />
1140<br />
1140<br />
1140<br />
[AFG1]<br />
obtained<br />
0.0940 uM<br />
0.0948 uM<br />
0.0942 uM<br />
0.1330 uM<br />
0.1313 uM<br />
0.1313 uM<br />
0.1691 uM<br />
0.1705 uM<br />
0.1686 uM<br />
% recovered<br />
94.00<br />
94.80<br />
94.20<br />
x = 94.50 +/- 0.41<br />
(RSD = 0.43%)<br />
88.68<br />
87.51<br />
87.51<br />
x = 87.91 +/- 0.58<br />
(RSD = 0.77%)<br />
84.57<br />
85.75<br />
84.30<br />
x = 84.87 +/- 0.77<br />
(RSD = 0.91%<br />
10
Conclusion<br />
A differential pulse cathodic stripping voltammetric technique using mercury<br />
electrode as the working electrode for determination of AFG1 has been<br />
developed. The method presented here is fast, reliable and sensitive technique<br />
for analysis of AFG1 with good precision and recovery. Further study is currently<br />
been carried out for analytical application of this method for quantitation of AFG1<br />
in food sample.<br />
Acknowledgement<br />
The author gratefully acknowledge the University Science <strong>Malaysia</strong> for giving me<br />
a study leave together with a scholarship under the Academic Staff For Higher<br />
Education Scheme (ASHES). Also we would like to thank all Electroanalytical<br />
group and Chemistry Department staff, UTM for their fully cooperation.<br />
References<br />
[1] Goldblatt L.A. 1969. Aflatoxin:Scientific background, control and implication.<br />
Academic Press, New York, pp 5-10<br />
[2] Salleh B. 1998. Mikotoksin: Implikasinya terhadap kesihatan manusia dan<br />
haiwan, USM, Penang, pp 32 - 49<br />
[3] Begum F and Samajpathi N. 2000. Mycotoxin production in rice, pulses and<br />
oilseeds, Naturwissenschaften, 87: 275-277.<br />
[4] Ordaz J.J., Fente C.C., Vazquez B.I., Franco C.M. and Cepeda A. 2003.<br />
Development of a method for direct visual determination of aflatoxin production<br />
by colonies of the Asperfillus flavus group, Int. J. Food Microbiology, 83, 219-<br />
225.<br />
[5] Batista L. R., Chalfoun S.M., Prado G. Schwan R.F. and Wheals A. E. 2003.<br />
Toxigenic fungi associated with processed (green) coffee beans ( Coffea arabica<br />
L.) . Int. J. Food Microbiology, 85, 293-300.<br />
11
[6] Akiyama H. Goda Y. Tanaka T and Toyoda M. 2001. Determination of<br />
aflatoxins B1, B2, G1 and G2 in spices using a multifunctional column clean-up,<br />
J. Of Chromatography A, 932. 153-157<br />
[7] Aziz N.H., Youseff Y.A., El-Fouly M.Z. and Mousse L.A. 1998. Contamination<br />
of some common medicinal plant samples and spices by fungi and their<br />
mycotoxins. Bot. Bull. Acad. Sin 39, 279-285.<br />
[8] World Health Organisation 1987 in: IARC Monograph on the Evaluation of<br />
Carcinogenic Risk to Human, WHO, Lyon , pp 82 Supl. I<br />
[9] Refai M.K. 1988. Aflatoxins and aflatoxicosis. J. Egypt Vet. Med. Ass. 48, 1-<br />
19<br />
[10] Ministry of Health, <strong>Malaysia</strong>, Food Act No 231. 1983. Reviewed 2003<br />
[11] Shotwell O.L and Goulden M.L. 1977. Aflatoxins: Comparison of analysis of<br />
corn by various methods, J. Assoc. Off. Anal. Chem 60: 83-88<br />
[12] Gimeno A. and Martins M. L. 1983 Rapid thin layer chromatographic<br />
determination of patulin, citrinin and aflatoxin in apples and pears and their juices<br />
and jams, J. Assoc. Anal. Chem, 66, 85-91.<br />
[13] Scholten J.M and Spanjer M.C. 1996. Determination of aflatoxin B1, B2, G1<br />
and G2 in pastachio kernels and shells, , J. Assoc. Off. Anal. Chem 79: 1360-<br />
1364<br />
[14] Jeffery H.W., Lenorich L.M and Martin R. Jr. 1982. Liquid chromatography<br />
determination of aflatoxins in artificially contaminated cocoa beans. , J. Assoc.<br />
Off. Anal. Chem 80: 1215-1219<br />
[15] Joshua, H. 1993 Determination of aflatoxin by reversed-phase high<br />
performance liquid chromatography with post-column in-line photochemical<br />
derivatization and fluorescence detection, J. Chromatography A, 654: 247-254<br />
[16] Gonzalez M.P.E., Mattusch J. and Wennrich R 1998. Stability and<br />
determination of aflatoxins by high-performance liquid chromatography with<br />
amperometric detection, J. Chromatography A, 828: 439-444<br />
[17] Smyth M. R., Lawellin D. W. and Osteryoung J.G 1979. Polarographic<br />
Study of Aflatoxin B1, B2, G1 and G2: Application of Differential-pulse<br />
12
Polarography to the Determination of Aflatoxin B1 in Various Foodstuffs, Analyst,<br />
104: 73-78<br />
[18] Braitina Kh. Z., Malakhova N.A. and Stojko Y. 2000 Stripping voltammetry<br />
in environmental and food analysis, Fresenius J Anal Chem 368: 307-325<br />
[19] Fifield, F.W. and Haines, P.J. 2000. .Environmental Analytical Chemistry<br />
2 nd Ed, Balckwell Science UK, pp 241-242<br />
[20] Yaacob M.H., Mohd Yusof A.R., Ahamad R. and Yakob A.R. 2004. Cyclic<br />
Voltammetry of AFG1 at mercury electrode, Paper will be presented at 3rd<br />
Annual Seminar on Sustainable Science and Management, KUSTEM,<br />
Terengganu, 4 – 5 May 2004.<br />
[21] Wang. 2000. Analytical Electrochemistry. Wiley-VCH, USA.<br />
13
PAPER SENT TO PROF BAREK<br />
TO BE PUBLISHED IN<br />
CHEMICAL ANALYSIS (WARSAW)<br />
( IN PRESS)
DIFFERENTIAL PULSE STRIPPING VOLTAMMETRIC TECHNIQUE FOR<br />
THE DETERMINATION OF AFLATOXIN B2 AT THE MERCURY<br />
ELECTRODE<br />
Mohamad Hadzri Yaacob, Abdull Rahim Hj. Mohd. Yusoff and Rahmalan Ahamad<br />
Chemistry Dept., Faculty Of Sciences, UTM, 81310 Skudai, Johor<br />
ABSTRACT<br />
Differential pulse voltammetric technique was developed for determination of aflatoxin<br />
B2 standard (AFB2) in Britton-Robinson Buffer (BRB). Hanging mercury drop electrode<br />
and Ag/AgCl have been used for working and reference electrodes respectively. In this<br />
experiment, the analyte was initially scanned from -1000 mV to -1500 mV in BRB pH<br />
9.0. The effect of pH of supporting electrolyte, scan rate, accumulation potential,<br />
accumulation time and pulse amplitude on the peak potential and peak current of the<br />
analyte were observed. The results showed that AFB2 compound undergoes reduction<br />
reaction at a potential of -1230 mV ( versus Ag/AgCl ). BRB pH 9.0 was the best<br />
supporting electrolyte with the optimised parameters such as scan rate; 50 mV/s,<br />
accumulation potential; -800 mV, accumulation time; 80s and pulse amplitude; 80 mV<br />
which gave the maximum peak height. Under the optimum condition, the peak height of<br />
AFB2 was proportional to the concentrations of the AFB2 in the range of 0.02 to 0.32 uM<br />
with a limit of detection was 0.0159 uM. Relative standard deviation for a eplicate<br />
measurements of AFB2 ( n= 8) with the concentrations of 0.06 and 0.20 uM were 2.80%<br />
and 2.53% respectively. Recoveries of the different AFB2 concentrations in prepared<br />
standard solutions were found to be 85% to 95% with the precision around 0.7% to 2.0%.<br />
Keywords: aflatoxin B2 compound, differential pulse stripping voltammetry, Britton-Robinson buffer and<br />
hanging mercury drop electrode (HMDE)<br />
1. INTRODUCTION<br />
Aflatoxins are mycotoxins produced by certain fungi, especially, Aspergillus flavus and<br />
Aspergillus parasiticus which are found on crops and foodstuffs under certain conditions<br />
(1). They display strong carcinogenicity. Therefore, they are dangerous food<br />
contaminants. They were first identified as the causative agent of the severe outbreak of<br />
“Turkey X” disease, a toxicosis that killed more than 100,000 turkey poults in England in<br />
1960 (2) There are a major concern as human hepatocarcinogens and are considered to<br />
play an important role in the high incidence of human hepatocellular carcinoma in certain<br />
areas of the world. Due to this reason, many countries including <strong>Malaysia</strong> have set<br />
regulatory demands on the level of aflatoxins permitted in imported and trade<br />
commodities.<br />
2
There are six main aflatoxin compounds such as Aflatoxin B1, B2, G1 and G2 (<br />
designated as AFB1, AFB2, AFG1 and AFG2 ) and aflatoxin M1 and M2 ( designated as<br />
AFM1 and AFM2). The former four compounds are naturally prevalent and the others are<br />
hydroxylated metabolite of AFB1 and AFB2 and were found in the milk of lactating<br />
animals following ingestion of B1 and B2- contaminated feeds (3)<br />
Among them AFB1 exhibits potent carcinogenic and mutagenic characteristics in a<br />
numbers of human and animals. AFB2 has a similar chemical structure with AFB1<br />
whereby the presence of an 8,9-double bond in the form of a vinyl ether at the terminal<br />
furan ring in AFB1, but not in AFB2. The chemical structure of AFB2 is shown in Figure<br />
1.0. This small difference in structure is associated with very significant change in<br />
activity; whereby AFB1 is more toxic than AFB2 (4).<br />
O<br />
O<br />
O<br />
O<br />
Figure 1.0: Chemical structure of AFB2<br />
Due to their toxicity, it is important that the level of these contaminants be controlled in<br />
food, soils and water to prevent toxic effect. The way to achieve this is by monitor<br />
samples so that any problem can be identified and dealt with, by doing analysis of<br />
aflatoxins using the analytical techniques at the parts-per-billon (ppb) level. Current<br />
analysis is done by various methods including thin-layer chromatography (TLC) (5),<br />
liquid chromatography (LC) and high-performance liquid chromatography (6,7) and<br />
microtitre plate enzyme-linked immunosorbant assay (ELISA) (8). All these methods<br />
require special equipments operated by skilled personnel and time consume. With the aim<br />
of rapid, simple, accurate and relative low cost analysis, the voltammetric technique is<br />
proposed for this purposes (9).<br />
Voltammetric technique generally refer to a system that combines a triple electrodes<br />
system with a potentiostate for controlling applied potential. It measures the current<br />
response generated by mass transport of electroactive species in the solution to the<br />
working electrode while potential is scanned. The total current response is proportional<br />
to the amount of analyte present in the solution (10). This paper reports the differential<br />
pulse voltammetric determination of AFB2 at a mercury electrode using a cathodic<br />
stripping voltammetric technique.<br />
O<br />
O<br />
3
2.1 Reagents<br />
2. EXPERIMENT<br />
All reagents employed were of analytical grade. Water purified from a Nano Pure<br />
Ultrapure water system ( Barnstead / Thermolyne) was used for all dilution and sample<br />
preparation. AFB2 was purchased from SIGMA ( 1 mg per bottle ) and dissolved in<br />
hexane:acetonitrile (98:2) produced 10 ppm standard solution. The stock solutions were<br />
placed in small amber glass tubes and kept in a freezer at -4.0 o C.<br />
A stock solution of 0.04 M Britton-Robinson Buffer (BRB) solution was prepared as<br />
follows: 2.47 g boric acid (Fluka), 2.30 ml acetic acid (MERCK) and 2.70 ml<br />
orthoposphoric acid ( Ashland Chemical ) were diluted to 1 l with deionised water.<br />
Britton-Robinson Buffer of pH 2.0 to 13.0 were prepared by adding sodium hydroxide<br />
1.0 M (MERCK) into the stock solution and was used as the supporting electrolyte.<br />
Hexadistilled mercury, grade 9 N, used in a control growth mercury electrode ( CGME )<br />
stand, was purchased from MERCK. The purging was carried out with 99.99% nitrogen.<br />
2.2 Instruments<br />
A BAS CV-50W voltammetric analyser in connection with a CGME stand equipped with<br />
a three-electrode system and a 20 ml capacity BAS MR-1208 cell were used for all the<br />
voltammetric determination. The working electrode was a hanging mercury drop<br />
electrode ( HMDE ). A silver-silver chloride (Ag / AgCl ) and a platinum wire were used<br />
as the reference and counter-electrode respectively. BAS CV-50W was connected to a<br />
computer for data processing. A pH meter Cyber-scan model equipped with a glass<br />
electrode combined with an Ag/AgCl reference electrode, was used for all pH<br />
measurements.<br />
2.3 Procedure<br />
2.3.1 General procedure<br />
The general procedure used to obtain cathodic stripping voltammograms was following<br />
this procedure. A 10 ml aliquot of supporting electrolyte solution was put in a<br />
voltammographic cell. The stir was switched on and the solution was purged with<br />
nitrogen gas for 25 minutes. After forming a new HMDE, accumulate was effected for<br />
the required time at the appropriate potential while stirring the solution. At the end of the<br />
accumulation time the stirring was switched off and after 10 s had elapsed to allow the<br />
solution to become quiescent, the negative going potential was initiated. Ag/AgCl<br />
saturated was used as the reference electrode throughout this study.<br />
4
2.3.2 Procedure for determination of aflatoxin<br />
For the aflatoxin stock standard solution, organic solvent was removed by flowing<br />
nitrogen to dryness followed by addition of the BRB supporting electrolyte solution. The<br />
solution was placed in small amber tube. This solution has been freshly prepared before<br />
voltammetric experiment started. When further volume of aflatoxin were added using a<br />
micropipette into the cell, the solution was redegassed with nitrogen for another 5<br />
minutes before further voltammetric experiment was carried out.<br />
3. RESULTS AND DISCUSSION<br />
3.1 The effect of pH of supporting electrolyte<br />
From our previous cyclic voltammetric studies of AFB2 compound, it was capable of<br />
undergoing reduction process at the mercury electrode in BRB pH 9.0 (11). In the present<br />
study, 2.0 uM AFB2 was cathodically scanned in BRB solution in the pH range of 3.0 to<br />
13.0. This study was carried out with the aim to determine if protons are directly<br />
involved in the reduction process of AFB2. The result showed that in the BRB with pH <<br />
4.0 , no peak was observed. The single and characteristic AFB2 peak was initially<br />
observed starting from pH 5.0 with Ip and Ep were 11.0 nA and -1119mV respectively.<br />
The effect of the pH of supporting electrolyte on the Ip of the AFB2 peak is shown in<br />
Figure 1.0<br />
Ip (nA)<br />
60<br />
50<br />
40<br />
30<br />
20<br />
10<br />
0<br />
4 6 8 10 12<br />
pH<br />
Figure 1.0: Dependence of the peak height of AFB2 on the pH of 0.04 M BRB<br />
solution. AFB2 concentration: 2.0 uM, Ei = 0, Ef = -1.5 V, Eacc = 0, tacc =<br />
15 s and υ = 50 mV/s.<br />
The Ip increased with increasing pH and the highest peak ( 52 nA at Ep of -1192 mV) was<br />
obtained in pH 9.0. The Ip sharply decreased at pH 10.0 to 12.0 and no peak was<br />
significantly appeared the pH 13.0. These results show that the reduction of AFB2 was<br />
totally depends on the pH of supporting electrolyte. The Ep of AFB2 was shifted toward<br />
5
more negative direction with increasing of the pH of the BRB solution which indicates<br />
that in more alkali solution, the reduction of AFB2 was much difficult to take place.<br />
3.2 Optimisation of conditions for the stripping analysis<br />
The voltammetric determination of analyte at trace level normally involves very small<br />
current response. For that reason it is important to optimise all the parameters which may<br />
have influence on the measured current. The effect of initial potential ( Ei), final potential<br />
(Ep) accumulation potential (Eacc ), accumulation time (tacc ), scan rate (υ ) and pulse<br />
amplitude to the Ep and Ip of the AFB2 peak have been studied in BRB pH 9.0. In this<br />
optimisation procedures, 0.06 uM AFB2 was used with initial parameters as follows; Ei<br />
= -1000 mV, Ef = -1500 mV, Eacc = -800 mV, tacc = 80 s, υ = 40 mV/s and pulse<br />
amplitude = 100 mV/s. Using these parameters, the Ip and Ep of 0.06 uM AFB2 were<br />
found to be 13.90 nA and -1250 mV ( vs Ag/AgCl ) respectively.<br />
Effect of Eacc, Ei and Ef<br />
For Ei = -1000 mV and Ef = -1500 mV, the effect of Eacc on the Ip and Ep of AFB2 was<br />
studied. The results revealed that the Ip of AFB2 obtained by using Eacc of -200 mV, -400<br />
mV, -600 mV, -800 mV and -1000 mV were not significantly different which were about<br />
14 nA. To get the maximum response, the Ef was changed from -1500 mV to -1400<br />
mV. The result is shown in Figure 2.0<br />
Ip (nA)<br />
25<br />
20<br />
15<br />
10<br />
5<br />
0<br />
A B<br />
200 400 600 800 1000<br />
Accumulation potential (-mV)<br />
Figure 2.0: Effect of Eacc on the Ip of 0.06 uM AFB2 obtained using different<br />
scan potential windows. (A) Ei = -1000 mV, Ef = -1500 mV and<br />
(B) Ei = -1000 mV, Ef = -1400mV.<br />
Using Ef = -1400 mV, the optimum Eacc was -600mV which gave the Ip of 16.84 nA.<br />
The Ep of AFB2 was not changed with different Eacc used in this experiment.<br />
Effect of tacc<br />
6
The effect of the tacc to the Ip of AFB2 (Figure 3.0) shows that by increasing tacc , the Ip<br />
linearly increases following this equation:-<br />
Ip (nA) = 0.4038x ( x s ) - 0.2847 ( R 2 = 0.9990, n = 5)<br />
for the range of 20 to 80 s. The maximum peak current ( 31.86 nA) was obtained when<br />
tacc = 80 s. When AFB2 was longer deposited at mercury electrode, the Ip was not<br />
significantly increased, hence the tacc at 80s was chosen as the optimum tacc. The Ep of<br />
AFB2 shifted toward less negative direction with increasing tacc.<br />
Ip (nA)<br />
50<br />
40<br />
30<br />
20<br />
10<br />
0<br />
Ip (nA )<br />
50<br />
40<br />
30<br />
20<br />
10<br />
0 20 40 60 80 100<br />
Scan rate (mV/s)<br />
0<br />
[AFB2]=0.6X10⁻⁷M<br />
[AFB2]=0.6X10⁻⁷M<br />
0 30 60 90 120 150<br />
Accumulation time (s)<br />
Figure 3.0: Effect of tacc on the Ip of 0.06 uM, Ei = - 1000 mV, Ef = -1400 mV,<br />
tacc = 80 s, υ = 40 mV/s and P.A = 100 mV.<br />
Effect of υ<br />
Relationship between υ and the Ip of the AFB2 also was investigated which revealed that<br />
when the υ increased, the Ip increased as shown in Figure 4a. The Ip was not significantly<br />
different when the υ was more than 60 mV/s. Therefore, 50 mV/s has been selected as<br />
the best υ for determination of AFB2 in BRB pH 9.0. The peak potential of AFB2 has<br />
linearly shifted toward more negative direction for the range of 20 to 50 mV/s and<br />
became level off for the υ of 60 and 80 mV/s as shown in Figure 4b. For the υ of 50<br />
mV/s, the pulse amplitude has to be changed to 80 mV instead of 100 mV otherwise, the<br />
Ip cannot be calculated by software. The maximum Ip obtained from this optimisation was<br />
38.18 nA which was about 200% higher than before being optimised. Figure 6.0<br />
illustrates the voltammogramms of 0.06 uM AFB2 obtained under optimum and<br />
unoptimum conditions.<br />
Ep (-mV)<br />
1225<br />
1220<br />
1215<br />
1210<br />
1205<br />
1200<br />
[AFB2]=0.6X10⁻⁷M<br />
7<br />
0 20 40 60 80 100<br />
Scan rate (mV/s)
(a) (b)<br />
Figure 4.0: Effect of υ on the Ip (a) and Ep (b) of AFB2. Ei = - 1000 mV,<br />
Ef = -1400 mV, Eacc = -600 mV, tacc = 80s and P.A = 100 mV<br />
Figure 5.0: Voltammogramms of 0.06 uM AFB2 obtained under<br />
unoptimum (a) and optimum (b) parameters.<br />
From this optimisation procedures, the selected optimum parameters for determination of<br />
AFB2 compound in BRb pH 9.0 were Ei = -1000 mV, Ef = -1400 mV, Eacc = -600 mV,<br />
tacc = 80 s, υ = 50 mV/s, pulse amplitude = 80 mV and quite time = 10 sec.<br />
3.2.4 Calibration curve of AFB2<br />
Using the optimum parameters, a calibration curve has been prepared by a series of<br />
standard addition of AFB2 as shown in Figure 6.0. The range of linearity was found to be<br />
from 0.02 u M to 0.32 u M with the limit of detection of 0.0158 uM. Figure 7.0 shows<br />
the voltammograms of AFB2 obtained by this standard addition.<br />
8
ip (nA)<br />
200<br />
180<br />
160<br />
140<br />
120<br />
100<br />
80<br />
60<br />
40<br />
20<br />
0<br />
y = 5.55x + 3.6435<br />
R 2 = 0.9978<br />
0 10 20<br />
[AFB2] X10-8M<br />
30 40<br />
Figure 6.0: Linear plot of Ip versus concentration of AFB2 in BRb pH=9.0<br />
Figure 7.0: Cathodic stripping voltammograms for increasing concentration<br />
of AFB2 (1) background (2) 0.02 (3) 0.06 (4) 0.10 (5) 0.14 (6) 0.18<br />
(7) 0.22 (8) 0.26 and (9) 0.32 uM. E acc = -600 mV, t acc = 80 s, υ = 50<br />
mV/s, P.A = 80 mV and BRB of pH 9.0<br />
For determination of accuracy of the proposed method, the reproducibility was calculated<br />
from 8 independent runs of 0.06 uM and 0.20 uM of AFB2 solution, obtaining the<br />
relative standard deviation (RSD) of 2.80 % and 2.53 % respectively. In order to check<br />
the precision of the method, a recovery study has also been carried out by adding of the<br />
different concentration of AFB2 (0.10 uM and 0.25 uM) into the voltammetric cell and<br />
measuring the peak currents of the respective concentrations. The actual amount of AFB2<br />
found in the cell were calculated using a regression equation obtained from prepared<br />
calibration curve. The recovery obtained were 86% to 95% with RSD of 1.68% and<br />
0.86% ( n = 3) respectively as shown in Table 3.1. The recovery study using real sample<br />
will be performed in future work..<br />
9
Table 1.0: Mean values for the recovery of AFB2 (n =3) in prepared AFB2 standard<br />
solution ( n = 3 )<br />
No of experiment Amount added<br />
( uM)<br />
Peak current<br />
(nA)<br />
Amount found<br />
(uM)<br />
Recovery (%)<br />
1 0.10 51.85 8.683 86.83 +/- 1.46<br />
2 0.25 134.43 23.56 94.26+/0.81<br />
4. CONCLUSION<br />
The use of the DPCSV technique has been proved to be a useful, simple, accurate and<br />
efficient alternative in the quantitative assay of trace amounts of AFB2. The sensitivity of<br />
this approach is much greater than obtained by differential pulse polarographic technique<br />
(12). The optimised parameters will be applied to determine other aflatoxin compounds<br />
such as AFB1, AFG1 and AFG2. Further experiment will be performed to increase it’s<br />
sensitivity in future work together with a recovery study of AFB2 using real samples such<br />
as ground nut and nut products. An alternative approach will also be studied by using<br />
different working electrode such as screen print electrode.<br />
5. ACKNOWLEDGEMENTS<br />
The author gratefully acknowledge the <strong>Universiti</strong> Sains <strong>Malaysia</strong> (USM) for granting a<br />
study leave together with a scholarship under the Academic Staff For Higher Education<br />
Scheme (ASHES). Also we would like to thank all Chemistry Department staff, UTM<br />
for their fully cooperation.<br />
6. REFERENCES<br />
1. Eaton D.L and Groopman J.D. (Eds) (1994), The toxicity of aflatoxin. Academic<br />
Press, United Kingdom.<br />
2. Goldblatt L.A (1972) Aflatoxin: Scientific background, control and implication,<br />
Academic Press, New York (1972)<br />
3. Andeou V.G., Nikolelis D. and Tarus B. (1997). Electrochemistry investigation of<br />
transduction of interactions of alfatoixin M1 with bilayer lipid membranes (BLMs),<br />
Anal. Chim. Acta, 350. 121-127.<br />
10
4. Jaimez J., Fente C.A., Vazquez B.I., Franco C.M., Cepeda A., Mahuzier G. and<br />
Prognon P (2000). Application of the assay of aflatoxins by liquid chromatography<br />
with fluorescence detection in food analysis. J. Chromatography A.” 882: 1-10<br />
5. Gimeno A. and Martins M. L (1983) Rapid thin layer chromatographic determination<br />
of patulin, citrinin and aflatoxin in apples and pears and their juices and jams, J.<br />
Assoc. Anal. Chem, 66, 85-91.<br />
6. Vahl M. and Jorgensen (1998). Determination of aflatoxins in food using LC/MS/MS,<br />
Z Lebensm Unters Forsch A , 206. 243-245<br />
7. Kussak A., Anderson B and Anderson K. (1995). Determination of aflatoxins in<br />
airborne dust from feed factories by automated immunoaffinity column clean-up and<br />
liquid chromatography, J Of Chromatography A, 708. 55-60<br />
8. Pesavento M., Domagala S., Baldini E. and Cucca L. (1997). Characterisation of<br />
enzyme linked immunosorbent assay for aflatoxin B1 based on commercial reagents,<br />
Talanta, 45. 91-104.<br />
9. Braitina Kh.Z Malakhova N.A. and Stojko Y. (2000) Stripping voltammetry in<br />
environmental and food analysis, Fresenius J Anal Chem 368: 307-325<br />
10 Fifield F.W. and D. Kealey (2000), Principle and practice of analytical chemistry 3 rd<br />
Edition, Blackwell science, UK<br />
11.Yaacob M.H, Yusoff A.R, Ahamad R and Yaakob A.R (2003), Cyclic voltammetric<br />
study of aflatoxin B2 at the mercury electrode, Paper presented at 16 th Symposium Of<br />
Chemical Analysis, 9-11 th September 2003, Kucing, Sarawak, <strong>Malaysia</strong>.<br />
12. Smyth M. R., Lawellin D. W. and Osteryoung J.G (1979) Polarographic Study of<br />
Aflatoxin B1, B2, G1 and G2: Application of Differential-pulse Polarography to the<br />
Determination of Aflatoxin B1 in Various Foodstuffs, Analyst, 104: 73-78<br />
11
Paper will be published in<br />
<strong>Malaysia</strong>n Journal of Analytical Science
CYCLIC VOLTAMMETRIC STUDY OF AFLATOXIN B2 AT THE MERCURY<br />
ELECTRODE<br />
Mohamad Hadzri Yaacob a , Abdull Rahim Hj. Mohd. Yusoff b and Rahmalan<br />
Ahamad b<br />
a School Of Health Sciences, USM, 16150 Kubang Krian, Kelantan<br />
b Chemistry Dept., Faculty Of Sciences, UTM, 81310 Skudai, Johor<br />
ABSTRACT<br />
A cyclic voltammetry (CV) study of aflatoxin B2 (AFB2) in Britton-Robinson<br />
buffer using a HMDE is described. CV was carried out by anodic and cathodic potential<br />
scan through within the range of 0 to -1500 mV with no accumulation time. The effect of<br />
the different scan rate on the peak height and peak potential of the analyte were also<br />
studied. The results from this study showed that the reduction process on the hanging<br />
mercury electrode gives a single characteristic cathodic peak at -1315 mV ( versus<br />
Ag/AgCl ) in pH of 9.0. Effect of the scan rate on both responses has proved that the<br />
reduction of AFB2 is irreversible reaction and the limiting current is adsorption<br />
controlled.<br />
Keywords: aflatoxin B2 compound, cyclic voltammetry, Britton-Robinson buffer and hanging mercury<br />
drop electrode (HMDE)<br />
1. INTRODUCTION<br />
Aflatoxins are mycotoxins produced by certain fungi, especially, Aspergillus<br />
flavus and Aspergillus parasiticus which are found on crops and foodstuffs under certain<br />
conditions (1). They were first identified as the causative agent of the severe outbreak of<br />
“Turkey X” disease, a toxicosis that killed more than 100,000 turkey poults in England in<br />
1960 (2) They display strong carcinogenicity. Therefore, they are dangerous food<br />
contaminants and many countries including <strong>Malaysia</strong> have set regulatory demands on the<br />
level of aflatoxins permitted in imported and trade commodities.<br />
Aflatoxin B2 (AFB2) is one of the naturally occurrence aflatoxins. The chemical<br />
structure of this compound is shown in Figure 1.0.<br />
a Corresponding Address:<br />
Chemistry Dept, Faculty of Science, UTM, 81300 Skudai, Johor<br />
Tel: 07- 553 4540 e-mail: mhy02psk@yahoo.com<br />
2
O<br />
O<br />
Figure 1.0: Chemical structure of AFB2<br />
O<br />
Due to its toxicity, it is important that the level of this contaminant be controlled<br />
in food, soils and water to prevent toxic effect. The way to achieve this is to monitor<br />
samples so that any problem can be identified and dealt with by doing analysis of<br />
aflatoxin using the analytical techniques that are necessary to determine aflatoxin at the<br />
parts-per-billon (ppb) level. Currently, analysis is done by various methods including<br />
thin-layer chromatography (TLC) (3), liquid chromatography (LC) and high-performance<br />
liquid chromatography (4,5) and microtitre plate enzyme-linked immunosorbant assay<br />
(ELISA) (6). All these methods are time consuming and require special equipments<br />
operated by skilled personnel.<br />
The proposed voltammetric technique generally refer to a system that combines a<br />
triple electrodes system with potentiostat for controlling applied potential. This technique<br />
is rapid, simple and relative low cost (7). It measures the current response generated by<br />
mass transport of electroactive species in solution to the working electrode while<br />
potential is scanned The total current response is proportional to the amount of analyte<br />
present in the solution (8). This paper reports the results from the cyclic voltammetric<br />
study of AFB2 at a mercury electrode.<br />
2.1 Reagents<br />
O<br />
2. EXPERIMENT<br />
All reagents employed were of analytical grade. Water purified from a Nano Pure<br />
Ultrapure water system ( Barnstead / Thermolyne) was used for all dilution and sample<br />
preparation. AFB2 was purchased from SIGMA: 1 mg was dissolved in hexane:<br />
acetonitrile (98:2) to produce 10 ppm each. The stock solutions were placed in small<br />
glass tubes covered with an aluminum foil and kept in a freezer at -4.0 o C. A stock of<br />
Britton-Robinson Buffer (BRB) solution 0.04 M was prepared as follows: 2.47 g boric<br />
acid (Fluka), 2.30 ml acetic acid (MERCK) and 2.70 ml orthoposphoric acid ( Ashland<br />
Chemical ) and were diluted to 1 l with deionised water. Hexadistilled mercury, grade<br />
O<br />
O<br />
3
9N, used by the Controlled Growth Mercury Electrode (CGME) stand, was purchased<br />
from MERCK. The purging was carried out with nitrogen gas with purity 99.99%.<br />
2.2 Instruments<br />
A BAS CV-50W voltammetric analyser in connection with a Control Growth<br />
Mercury Electrode (CGME) stand equipped with a three-electrode system and a 20 ml<br />
capacity BAS MR-1208 cell was used for all the voltammetric determination. The<br />
working electrode was a Hanging Mercury Drop Electrode (HMDE). As reference and<br />
counter-electrode, a silver-silver chloride (Ag / AgCl) and a platinum wire were used,<br />
respectively. All potentials are quoted relative to this reference electrode. BAS CV-50W<br />
was connected to a computer for data processing. A pH meter Cyber-scan model<br />
equipped with a glass electrode combined with an Ag/AgCl reference electrode, was<br />
employed for the pH measurements.<br />
2.3 Procedure<br />
Cyclic voltammetry was studied within the range of 0 to -1500 mV with different<br />
scan rate from 20 to 500 mV/s in BRB pH 9.0 as the supporting electrolyte. The HMDE<br />
and Ag/AgCl were used as the working and reference electrode respectively through out<br />
this experiment . The general procedure used to obtain cyclic voltammograms was as<br />
follows. A 10 ml aliquot of buffer solution was placed in a voltammographic cell using a<br />
micropipette. The stir was switched on and the solution was purged with nitrogen gas for<br />
10 minute. After forming a new HMDE, potential scan was effected using different scan<br />
rate while stirring the solution. For the aflatoxin standard stock solution, organic solvent<br />
was removed by flowing nitrogen gas to dryness followed by adding of the BRB<br />
supporting electrolyte solution. When further volume of aflatoxin were added to the cell,<br />
the solution was redeoxygenated with nitrogen gas for 5 minute before carried out further<br />
voltammetry followed the mentioned procedures.<br />
3. RESULTS AND DISCUSSION<br />
Cathodic cyclic voltammogrammes of 1.3 X 10 -6 M AFB2 in BRB solution at<br />
pH=9.0 and a scan rate (υ) of 200 mV/s can be observed in Figure 2.0. A sharp and well<br />
defined cathodic wave around -1.315 V ( against Ag/AgCl ) with a peak current of 30 nA<br />
is observed due to the reduction of the AFB2. No oxidation wave appears in the anodic<br />
branch, which indicates that the AFB2 reduction is irreversible. This was confirmed by<br />
anodic cyclic voltammetric that gave the same results as shown in Figure 3.0<br />
4
Figure 2.0: Cathodic cyclic voltammogram for 1.3 X10 -6 M AFB2,<br />
obtained at υ of 200 mV/s, Ei = 0, Elow = -1.5 V and Ehigh = 0<br />
in BRB solution at pH=9.0. ( 1 ) cathodic and (2) anodic scans<br />
Figure 3.0: Anodic cyclic voltammogram for 1.3 X10 -6 M AFB2, obtained at υ<br />
of 200 mV/s, Ei = -1.5, Elow = -1.5 V and Ehigh = 0 in BRB solution at<br />
pH=9.0. ( 1 ) anodic and (2) cathodic scans<br />
Standard additions of AFB2 was carried out to confirm that the observed peak is<br />
related to the reduction of AFB2. Figure 4.0 shows that the Ep at around -1.315 V is<br />
referred to the AFB2 peak since there are no significant change in location of the peak<br />
and the Ip increases with increasing of the AFB2 concentration. There are no extra peak<br />
apparently observed with this standard addition. The corresponding equation of this<br />
5
dependence of Ip to concentration of AFB2 for cathodic cyclic voltammetric is at pH<br />
=9.0,<br />
Ip (nA) = 23.839 x ( x 10 -6 M) + 4.44 ( r = 0.9817, n = 4 )<br />
The regression equation shows that the Ip of AFB2 does not very linearly with the<br />
concentration of AFB2 suggesting formation of a compact film on the electrode surface<br />
(9).<br />
Figure 4.0 Effect of AFB2 concentration on the Ip of cathodic cyclic<br />
voltammetric curve in BRB at pH =9.0. (a) 1.3 X10 -6 M ,<br />
(b) 2.0 X 10 -6 M (c) 2.7 X10 -6 M and (d) 3.4 X 10 -6 M.<br />
A result from repetitive cathodic stripping voltammetry experiment is shown in<br />
Figure 5.0. The result showed that the reduction peak of AFB2 increases with number of<br />
cycles indicating irreversible reduction with adsorption of AFB2 at the mercury electrode<br />
surface. No other cathodic peak was observed.<br />
6
Figure 5.0: Repetitive cathodic cyclic voltammograms of 1.3 X 10 -6 M AFB2 in<br />
BRB solution at pH of 9.0.<br />
The adsorption of AFB2 on the electrode surface is expected due to the AFB2<br />
chemical structure, that consists of functional groups such as ketone, ester and ether. The<br />
presence of these groups increases the polarity and enhance absorption of molecules at<br />
the electrode surface (10). Ip increases with the number of cycle. However, a further<br />
increases in the repetitive cycle tend to slow down the increment of the Ip due to the<br />
deformation of double layer at the mercury electrode surface (11).<br />
The effect of increasing scan rate from 20 to 500 mV/s to the Ep and Ip of AFB2<br />
cathodic peak were observed under the same experiment conditions. Linear relationship<br />
was observed between the log Ip versus log υ with a slope of 0.5097 ( R 2 = 0.995, n = 9 )<br />
as shown in Figure 6.0. The slope of more than 0.5 indicates that the diffusion current is<br />
influenced by an adsorption on the electrochemical process at the electrode surface (12,<br />
13). The plot of Ep versus log scan rate which is a linear graph as shown in Figure 7.0<br />
( R 2 = 0.9936, n = 9 ) confirmed that the reduction of AFB2 on the electrode surface is<br />
totally irreversible. This irreversible reaction is also confirmed by observing the shifted<br />
of Ep towards more negative direction when the υ is increased, according to the following<br />
equation:<br />
Ep (-mV) = 40.065log υ + 1223.2 ( R = 0.9936, n = 9)<br />
log Ep<br />
1.9<br />
1.7<br />
1.5<br />
1.3<br />
1.1<br />
0.9<br />
0.7<br />
y = 0.5097x + 0.4115<br />
R 2 = 0.995<br />
0.5<br />
1.2 1.4 1.6 1.8 2<br />
log V<br />
2.2 2.4 2.6 2.8<br />
Figure 6.0: Plot of log Ip versus log υ for 1.3 X10 -6 M AFB2 in BRB solution at pH 9.0<br />
7
Ep (-mV)<br />
1340<br />
1330<br />
1320<br />
1310<br />
1300<br />
1290<br />
1280<br />
1270<br />
y = 40.065x + 1223.3<br />
R 2 = 0.9936<br />
1.2 1.4 1.6 1.8 2<br />
log V<br />
2.2 2.4 2.6 2.8<br />
Figure 7.0: Plot of Ep versus log υ for 1.3 X10 -6 M AFB2 in BRB solution at pH 9.0<br />
4. CONCLUSION<br />
From the CV study the AFB2 reduced at the mercury electrode produced a single<br />
and well characteristic cathodic peak at -1.315 V ( versus Ag/AgCl) . The reduction is<br />
totally irreversible reaction and the diffusion current is controlled by adsorption process.<br />
Further work on stripping voltammetric study of this compound will be carried out.<br />
5. ACKNOWLEDGEMENTS<br />
The author gratefully acknowledge the University Science <strong>Malaysia</strong> for giving me a<br />
study leave together with a scholarship under the Academic Staff For Higher Education<br />
Scheme (ASHES). Also we would like to thank all Chemistry Department staff, UTM for<br />
their fully cooperation.<br />
6. REFERENCES<br />
1. Eaton D.L and Groopman J.D. (Eds) (1994), The toxicity of aflatoxin. Academic<br />
Press, United Kingdom.<br />
2. Goldblatt L.A (1972) Aflatoxin: Scientific background, control and implication,<br />
Academic Press, New York (1972)<br />
8
3. Gimeno A. and Martins M. L (1983) Rapid thin layer chromatographic determination<br />
of patulin, citrinin and aflatoxin in apples and pears and their juices and jams, J.<br />
Assoc. Anal. Chem, 66, 85-91.<br />
4. Vahl M. and Jorgensen (1998). Determination of aflatoxins in food using LC/MS/MS,<br />
Z Lebensm Unters Forsch A , 206. 243-245<br />
5. Kussak A., Anderson B and Anderson K. (1995). Determination of aflatoxins in<br />
airborne dust from feed factories by automated immunoaffinity column clean-up and<br />
liquid chromatography, J Chromatography A, 708. 55-60<br />
6. Pesavento M., Domagala S., Baldini E. and Cucca L. (1997). Characterisation of<br />
enzyme linked immunosorbent assay for aflatoxin B1 based on commercial reagents,<br />
Talanta, 45. 91-104.<br />
7. Braitina Kh.Z Malakhova N.A. and Stojko Y. (2000) Stripping voltammetry in<br />
environmental and food analysis, Fresenius J Anal Chem, 368. 307-325<br />
8. Harvey, D (2000). Modern Analytical Chemistry, McGraw Hill, USA<br />
9. Laviron E in Bard A (Eds) (1982) Electroanalytical Chemistry, Marcell Decker, New<br />
York .<br />
10. Volke J and Liska F (1994) Electrochemistry In Organic Synthesis, Springer-<br />
Verlag, New York.<br />
11. Fifield F.W. and Kealey D (2000) Principle and Practice of Analytical Chemistry 3 rd<br />
Edition, Balckwell Science, U.K<br />
12. Gosser D.K (1993) Cyclic voltammetry, Wiley-VCH, New York<br />
13. Yaridimer C. and Ozaltin N. (2001) Electrochemical studies and differential pulse<br />
polarographic analysis of lansoprazole in pharmaceuticals, Analyst, 126. 361-366<br />
9
PAPER WAS PUBLISHED IN<br />
J. Kimia Analisis (<strong>Universiti</strong> Sumatera Utara, Medan, Indonesia)<br />
Yaacob, M.H., Mohd. Yusoff, A.R. and Ahamad, R. (2005). Application of Differential<br />
Pulse Cathodic Stripping voltammetry (DPCSV) Technique in Studying Stability of<br />
Aflatoxins. J. Sains Kimia. 9(3): 64-70.<br />
1
APPLICATION OF DIFFERENTIAL PULSE CATHODIC<br />
STRIPPING VOLTAMMETRIC TECHNIQUE IN STUDYING<br />
STABILITY OF AFLATOXINS<br />
Mohamad Hadzri Yaacob 1 , Abdull Rahim Hj. Mohd. Yusoff 2 and Rahmalan Ahamad 2<br />
1 School Of Health Sciences, USM, 16150 Kubang Krian, Kelantan, <strong>Malaysia</strong><br />
2 Dept of Chemistry , Faculty of Sciences, UTM, 81310 UTM, Skudai, Johor, <strong>Malaysia</strong><br />
Abstract A stability studies of aflatoxins (AFB1, AFB2, AFG1 and AFG2 ) in Britton-Robinson buffer (BRb) using a<br />
Differential Pulse Cathodic Stripping Voltammetric (DPCSV) technique is described. The DPCSV was performed by<br />
cathodic potential scan through within the range of -950 to -1400 mV with 80s accumulation time using a BRb at pH<br />
9.0 as the supporting electrolyte. The samples were exposed for 0 to 8 hrs to normal laboratory condition before being<br />
scanned under optimised voltammetric parameters. Using the same procedure, aflatoxins in different pH of BRb were<br />
also studied after 0 to 3 hours exposed to the same condition. Other stability study was performed by scanning<br />
aflatoxins in BRb solution which were kept in freezer from first to six months of storage time. The results from these<br />
studies showed that AFB1 and AFB2 in BRb pH 9.0 were stable within 8 hours exposure time while AFG1 and AFG2<br />
were stable up to a few hours. All aflatoxins scanned in BRB pH 6.0, 7.0 and 9.0 were more stable as compared when<br />
there were scanned in BRB pH 11.0 within 3 hours exposure time. The results also showed that the stability of the<br />
samples which were prepared in BRB pH 9.0 was affected by longer storage time in freezer.<br />
Abstrak Satu kajian terhadap kestabilan aflatoksin (AFB1, AFB2, AFG1 and AFG2 ) di dalam larutan penimbal<br />
Britton-Robinson (BRb) menggunakan teknik Voltammetri Perlucutan Kethodik Denyut Pembeza (DPCSV) adalah<br />
dilaporkan. Kaedah ini dijalankan dengan cara mengimbas keupayaan katodik di dalam julat di antara -950 ke -1400<br />
mV dengan masa penjerapan 80 s menggunakan larutan penimbal pada pH 9.0 sebagai larutan penyokong. Sampel<br />
didedahkan kepada persekitaran makmal dari 0 hingga 8 jam sebelum diimbas menggunakan parameter voltammetri<br />
yang optimum. Menggunakan prosedur yang sama, aflatoksin yang disediakan di dalam larutan penimbal yang<br />
berbeza pH juga dikaji kestabilan dari 0 hingga 3 jam terdedah kepada kondisi yang sama. Kajian kestabilan yang lain<br />
yang dijalankan termasuk mengimbas aflatoksin yang disediakan di dalam larutan penimbal dan disimpan di dalam<br />
penyejukbeku dari bulan pertama hingga ke bulan keenam. Keputusan dari kajian ini menunjukkan bahawa AFB1 dan<br />
AFB2 di dalam larutan BRb stabil di dalam tempuh 8 jam terdedah kepada keadaan biasa makmal dan AFG1 serta<br />
AFG2 hanya stabil di dalam tempuh beberapa jam sahaja. Semua aflatoksin yang diimbas di dalam pH 6.0, 7.0 dan 9.0<br />
di dalam tempuh 3 jam masa pendedahan adalah lebih stabil berbanding jika ianya diimbas di dalam pH 11.0.<br />
Keputusan juga menunjukkan bahawa kestabilan sampel yang disediakan di dalam BRb dengan pH 9.0 adalah<br />
dipengaruhi oleh jangkamasa simpanan di dalam penyejukbeku.<br />
Keywords: AFB1, AFB2, AFG1, AFG2 compounds, stability studies and differential pulse cathodic<br />
stripping voltammetry<br />
INTRODUCTION<br />
Aflatoxins are a group of secondary metabolites produced by Aspergillus flavus and Aspergillus<br />
parisiticus, which are found on crops and foodstuffs under certain conditions [[1]. Aflatoxins B1, B2, G1<br />
and G2 have been found to be naturally and they display strong carcinogenicity. There are dangerous food<br />
contaminants and have been classified as Type I toxic materials by International Agency for Research<br />
1 Corresponding Address:<br />
Chemistry Dept, Faculty of Science, UTM, 81300 Skudai, Johor<br />
Tel: 07- 553 4540 or 019-939 2440 or e-mail: mhy02psk@yahoo.com<br />
( Note: A part of this paper was presented in Simposium Kimia Analisis <strong>Malaysia</strong> ke 17 (SKAM-17), 24 –<br />
26 th August 2004 at Kuantan, Pahang, <strong>Malaysia</strong>)<br />
2
Cancer (IARC) in 1984 [2]. Due to its toxicity, many countries have set stringent regulatory demands on<br />
the level of aflatoxins permitted and traded commodities. In our country, the regulatory levels for total<br />
aflatoxins in raw peanuts are 15 ppb and 5 ppb for other foodstuffs [3].Aflatoxins are not totally diminished<br />
by normal and cooking temperatures [4,5]. The chemical structures of AFB1, AFB2, AFG1 and AFG2 are<br />
shown in Figure 1.0 [6].<br />
O<br />
O<br />
O<br />
O<br />
O<br />
O<br />
O<br />
O<br />
O O<br />
O<br />
O<br />
O<br />
(a) (b)<br />
(c) (d)<br />
O<br />
O<br />
O<br />
O<br />
O<br />
O<br />
O<br />
O<br />
O O<br />
Figure 1.0: Chemical structures of (a) AFB1, (b) AFB2, (c) AFG1 and (d) AFG2<br />
Many methods have been used for quantitative determination of aflatoxins includes thin layer<br />
chromatography (TLC) [7-9], high performance liquid chromatography (HPLC) with different type of<br />
detectors such as ultra-violet [10-12], fluorescence [13-15] and amperometer detectors [ 16]<br />
In this study, all aflatoxins have been investigated for its stability in BRB pH 9.0 using DPSV<br />
technique. This technique was chosen rather than UV-VIS spectrophotometer because it uses the principle<br />
of the measurement of peak height of electro active species in sample solution when potential was applied<br />
into it [17]. It can avoid problem arise from weak fluorescence property of AFB1 and AFG1 [16]. This<br />
technique also offers shorter time analysis compare to the HPLC technique [17].<br />
In the present paper, we describe the results of stability studies on AFB1, AFB2, AFG1 and AFG2<br />
which were prepared in BRB pH 9.0 and underwent hour to hour monitoring and also for shelf life of all<br />
aflatoxins in BRB pH 9.0 which was kept in fridge for six months.<br />
O<br />
O<br />
O<br />
3
Reagents<br />
EXPERIMENTAL<br />
All reagents employed were of analytical grade. Water purified from a Nano Pure Ultrapure water<br />
system ( Barnstead / Thermolyne) was used for all dilution and sample preparation. Aflatoxins were<br />
purchased from SIGMA ( 1 mg per bottle ) and dissolved in benzene:acetonitrile (98:2) to produce 10 ppm<br />
standard solution each. The stock solutions were placed in small amber glass tubes and kept in a freezer at -<br />
4.0 o C. The solution was measured under UV-VIS spectrometer for it absorbance at 365 +/- nm before<br />
being used for voltammetric analysis.<br />
A stock solution of 0.04 M Britton-Robinson Buffer (BRB) solution was prepared as follows: 2.47<br />
g boric acid (Fluka), 2.30 ml acetic acid (MERCK) and 2.70 ml orthophosphoric acid ( Ashland Chemical )<br />
were diluted to 1 l with deionised water. Britton-Robinson Buffer of pH 5, 7.0 and 11.0 were prepared by<br />
adding sodium hydroxide 1.0 M (MERCK) into the stock solution.. Hexadistilled mercury, grade 9 N, used<br />
in a control growth mercury electrode ( CGME ) stand, was purchased from MERCK. The purging was<br />
carried out with 99.99% nitrogen.<br />
Instruments<br />
A BAS CV-50W voltammetric analyser in connection with a CGME stand equipped with a threeelectrode<br />
system and a 20 ml capacity BAS MR-1208 cell were used for all the voltammetric<br />
determination. The working electrode was a hanging mercury drop electrode (HMDE). A silver-silver<br />
chloride (Ag / AgCl) and a platinum wire were used as the reference and counter-electrode respectively.<br />
BAS CV-50W was connected to a computer for data processing. A pH meter Cyber-scan model equipped<br />
with a glass electrode combined with an Ag/AgCl reference electrode, was used for all pH measurements.<br />
Procedure<br />
General procedure<br />
The general procedure used to obtain cathodic stripping voltammograms was as follows. A 10 ml<br />
aliquot of supporting electrolyte solution was put in a voltammographic cell. The stir was switched on and<br />
the solution was purged with nitrogen gas for at least 10 minutes. After forming a new HMDE, accumulate<br />
was effected for the required time at the appropriate potential while stirring the solution. At the end of the<br />
accumulation time the stirring was switched off and after 10 s had elapsed to allow the solution to become<br />
quiescent, the negative going potential was initiated. Ag/AgCl saturated was used as the reference electrode<br />
throughout this study.<br />
Procedure for determination of aflatoxin<br />
The aflatoxin standard solutions have been freshly prepared by removing of organic solvent in<br />
aflatoxin stock solutions until dryness followed by the addition of the BRb supporting electrolyte solution.<br />
The solution was placed in small amber bottles. When further volume of aflatoxin were added using a<br />
micropipette into the voltammetric cell, the solution was purged with nitrogen for another 2 minutes before<br />
further voltammetric experiment was carried out.<br />
Procedure for stability studies<br />
For hour to hour stability studies, 312 ul, 315 ul, 328 ul and 330 ul of 1 ppm AFB1, AFB2,<br />
AFG1 and AFG2 standard solution in BRB pH 9.0 respectively were injected into 10 ml supporting<br />
electrolyte in the voltammetric cell separately and were scanned following the above stated procedures.<br />
4
Eight measurements have been made. The peak heights and peak potential of each aflatoxins were<br />
recorded. After these measurements, the aflatoxins standard solutions in voltammetric cell were exposed to<br />
normal laboratory condition without purging. Measurements were taken every hour up to 8 hours exposure<br />
time.<br />
For shelf life stability studies, all aflatoxin standard solutions which were kept in freezer were<br />
subjected to the voltammetric measurement in BRb pH 9.0 every month up to 6 months keeping period.<br />
For aflatoxins in different pH of BRB, the stability studies were performed by scanning aflatoxins<br />
solution (prepared in BRB pH 9.0) in four difference pH of BRB as the supporting electrolytes which were<br />
6.0, 7.0, 9.0 and 11.0. The voltammetric determination procedures were followed the same procedures as<br />
for the hour to hour stability studies except the exposure time was limited up to 3 hours.<br />
RESULTS AND DISCUSSION<br />
From our previous experiment using a cyclic voltammetry technique , AFB1, AFB2, AFG1 and<br />
AFG2 show an irreversible reduction peak at -1235 +/- 10 mV, ( all against Ag/AgCl) respectively [18,<br />
19]. Based on this electro active property, differential pulse cathodic stripping voltammetry (DPCSV)<br />
technique was applied in this study.<br />
Voltammograms of aflatoxins<br />
The voltamograms of 0.1 uM AFB1, AFB2, AFG1 and AFG2 scanned in BRb pH = 9.0 are<br />
shown in figures 2.0a -2.0d. Replicate measurements of peak height of respective aflatoxins give the<br />
repeatability results of 63.19 nA, 65.67 nA, 60.76 nA and 61.79 nA respectively with coefficient variation<br />
of 1.50 to 2.60 % for all aflatoxins. The results show that the DPSV technique give high consistent results<br />
with very small error and could be applied in stability studies of aflatoxins.<br />
(a) (b)<br />
(c) (d)<br />
Figure 2.0 :Voltammograms ( n = 8) of 0.1 uM AFB1 (a), AFB2 (b), AFG1 (c) and AFG2 (d) in BRb pH = 9.0.<br />
5
Hour to hour stability studies;<br />
The results of these studies using 0.10 uM AFB1, AFB2, AFG1 and AFG2 in BRB pH 9.0 are<br />
represented in Figure 3.0.<br />
Peak height (nA)<br />
80<br />
70<br />
60<br />
50<br />
40<br />
30<br />
20<br />
Peak height (nA)<br />
70<br />
60<br />
50<br />
40<br />
30<br />
20<br />
10<br />
0<br />
0 1 2 3 4 5 6 7 8 9<br />
Exposure time (hrs)<br />
10<br />
0 1 2 3 4 5 6 7<br />
Storage time in freezer (months)<br />
AFB1<br />
AFB2<br />
AFG1<br />
AFG2<br />
AFB1<br />
AFB2<br />
AFG1<br />
AFG2<br />
Figure 3.0: Peak heights of AFB1, AFB2, AFG1 and AFG2 in BRb pH = 9.0 exposed to normal condition up to 8<br />
hours.<br />
The results show that AFB1 and AFB2 in BRb pH 9.0 were stable within 8 hours exposure time<br />
where the peak heights for both aflatoxins were reduced only 15%. In contrast, AFG1 and AFG2 gave<br />
significant reduced of peak heights within the same period of exposure time where the peak height of<br />
AFG1 and AFG2 were reduced to 50% and 58% respectively. The results show that AFG1 and AFG1 were<br />
less stable in BRb pH 9.0 as compared to AFB1 and AFB2. Based on their chemical structures, the most<br />
reactive functional groups for ease of attack by chemical reagents are two lactones rings of AFB1 and<br />
AFG1 and cyclopentanone rings in AFB2 and AFG2. These lactones can be readily opened by hydrolysis<br />
with strong alkalis such as sodium hydroxide. Other functional group of this aflatoxin is less readily<br />
attacked by chemical reagents. The methyl ether and furan ether groups would be cleaved only by very<br />
strong acids such as hydriodic acid. The double bond of terminal furan rings of AFB1 and AFG1 are<br />
susceptible to attack by electrophilic reagents and can be reduced or oxidised [20].<br />
Shelf life stability studies<br />
For shelf life stability studies, the results are shown in Figure 4.0<br />
Figure 4.0: Peak heights of aflatoxins in BRb pH 9.0 which were kept up to 6 months in freezer.<br />
6
The results showed that after three months storage in freezer, the peak heights of AFG1 and AFG2<br />
in BRB pH 9.0 were decreased to about 70% from original peak height measured at first day of preparation.<br />
AFB2 was the most stable within 2 months keeping period. These results revealed that AFB1 and AFB2<br />
were stable within 3 months kept in fridge but gradually decreased after that time. Peak heights of AFG1<br />
and AFG1 were gradually decreased since first month keeping time up to 6 months.<br />
Stability studies in different buffer solutions<br />
The results for these studies are shown in Figure 5.0a to 5.0d. The results show that in acid and<br />
neutral conditions, peak heights of all aflatoxins were increased when the exposure time were longer. In<br />
BRb pH 9.0, the peak heights were not significantly affected by longer exposure time. This phenomenon<br />
may be because of all aflatoxins need enough time to be completely dissolved in acid and neutral condition<br />
compared in basic medium. In strong base, the peak height was significantly decreased where AFG2 has<br />
not given any peak after 3 hours exposure time. These results indicate that in neutral and acid conditions,<br />
aflatoxins take time to stabilise themselves and at strong base, it was slowly reacted while cyclopentanone<br />
and lactone groups slowly damaged (21). AFG1 and AFG2 show decreasing in peak height faster than<br />
aFB1 and AFB2. This was due to the easy of lactones group in both compounds attacked in strong basic<br />
condition compared to acidic condition. Other chemical group was not affected in acid or neutral medium<br />
as can be observed from the peak heights of all aflatoxins in BRB pH 6.0 and 7.0 within 3 hours standing<br />
time. At 0 hrs standing time, the peak heights of all aflatoxins in BRB pH 6.0, 7.0 and 11.0 were lower as<br />
compared in BRb pH 9.0 due to those pH were not an optimum pH for DPCSV analysis of aflatoxins as<br />
found in our previous experiment [22].<br />
Ip (nA)<br />
Ip (nA)<br />
70<br />
60<br />
50<br />
40<br />
30<br />
20<br />
10<br />
0<br />
70<br />
60<br />
50<br />
40<br />
30<br />
20<br />
10<br />
0<br />
0 1 2 3<br />
Standing time (hrs)<br />
0 1 2 3<br />
Standing time (hrs)<br />
AFB1<br />
AFB2<br />
AFG1<br />
AFG2<br />
(a) (b)<br />
AFB1<br />
AFB2<br />
AFG1<br />
AFG2<br />
(c) (d)<br />
Ip (nA)<br />
Ip (nA)<br />
45<br />
40<br />
35<br />
30<br />
25<br />
20<br />
15<br />
10<br />
5<br />
0<br />
70<br />
60<br />
50<br />
40<br />
30<br />
20<br />
10<br />
0<br />
0 1 2 3<br />
Standing tim e (hrs)<br />
0 1 2 3<br />
Standing time (hrs)<br />
Figure 4.0: Peak heights of 0.1 uM aflatoxins in BRb at pH (a) 6.0, (b) 7.0, (c) 9.0 and (d) 11.0 exposed to normal<br />
laboratory condition up to 3 hrs standing time.<br />
AFB1<br />
AFB2<br />
AFG1<br />
AFG2<br />
AFB1<br />
AFB2<br />
AFG1<br />
AFG2<br />
7
CONCLUSION<br />
Using DPCSV technique, stability studies of aflatoxins have been successfully performed. It was<br />
concluded that AFB1 and AFB2 in BRb pH 9.0 which were exposed to normal condition were more stable<br />
as compared to AFG1 and AFG2 in the same medium. Shelf life of AFB1 and AFB2 keeping in freezer<br />
were longer compared to AFG1 and AFG2. All aflatoxins in BRb pH 6.0, 7.0 and 9.0 which were exposed<br />
to normal condition up to three hours were stable but in BRb pH 11.0, their peak heights were<br />
significantly decreased.<br />
ACKNOWLEDGEMENT<br />
One of the author is gratefully acknowledge the University Science <strong>Malaysia</strong> for approved him a<br />
study leave and financial support for his study at UTM. Also we would like to thank UTM for a<br />
fundamental research grant (Vot No 75152) to carry out this study.<br />
REFERENCES<br />
1. Begum F and Samajpathi N (2000), Mycotoxin production in rice, pulses and oilseeds,Naturwissenschaften, 87:<br />
275-277<br />
2. International Agency for Research on Cancer (1993) IARC monographs on the evaluation of carcinogenic risk to<br />
humans, vol. 56. World Health Organisation, Lyon.<br />
3. <strong>Malaysia</strong>n Food Act (1983) Act No 281, Reviewed 2002, Food Quality Control Dept, Ministry Of Health,<br />
<strong>Malaysia</strong><br />
4. Creepy E.E (2002). Update of survey, regulation and toxic effect of mycotoxins Europe, Toxicology Letter, 127:<br />
19-28<br />
5 Samarajeewa U., Sen A.C., Cohen M.D. and Wei C.L (1990). Detoxification of Aflatoxins in foods and feeds by<br />
physical and chemical methods Food Protection, 53, 489-501.<br />
6. Goldblatt L.A (1969) Aflatoxin: Scientific background, control and implication, Academic Press, New York<br />
7. Gimeno A. and Martins M. L (1983) Rapid thin layer chromatographic determination of patulin, citrinin and<br />
aflatoxin in apples and pears and their juices and jams, J. Assoc. Anal. Chem, 66, 85-91.<br />
8. Bicking M.K.L., Kniseley R.N and Svec H.J (1983), Coupled-Column for quantitating low levels of aflatoxins, J .<br />
Assoc. Off. Anal. Chem. 66, 905-908.<br />
9. Tutour L.B., Elaraki A. T. and Aboussalim A.,(1984). Simultaneous thin layer chromatographic determination of<br />
aflatoxin B1 and ochratoxin A in black olives, J Assoc Off Anal Chem 67: 611-620.<br />
10. Rastogi S., Das M. and Khanna S.K. (2001). Quantitative determination of aflatoxin B1-oxime by column liquid<br />
chromatography with ultraviolet detection. J Of Chromatography A, 933: 91-97<br />
11. Joshua, H (1993) Determination of aflatoxin by reversed-phase high performance liquid chromatography with<br />
post-column in-line photochemical derivatization and fluorescence detection, J. Chromatography A, 654: 247-254<br />
12 Miller N, Pretorius H.E. and Trinder D.W (1985). Determination of aflatoxins in vegetable oils, J. Assoc. Off. Anal.<br />
Chem, 68 : 136-137<br />
13. Scholten J.M and Spanjer M.C (1996) Determination of aflatoxin B1 in pistachio kernels and shells, , J. Assoc. Off.<br />
Anal. Chem 79: 1360-1364<br />
8
14. Brera C., Caputi R., Miraglia M., Iavicoli I., Salerno A. and Carelli G. (2002). Exposure assessment to mycotoxins<br />
in workplace: aflatoxins and ochratoxin A occurrence in airborne dusts and human sera, Micro chemical J<br />
(uncorrected proof).<br />
15. Garcia-Villanova R.J., Cordon C., Paramas A.M.G., Aparicio P. and Rosales M.E.G., (2004). Simultaneous<br />
immunoaffinity column clean up and HPLC analysis of aflatoxins and ochratoxin A in Spanish bee pollen, J<br />
Agric. Food Chem.52; 7235-7239<br />
16. Gonzalez M.P.E., Mattusch J. and Wennrich R ( 1998) Stability and determination of aflatoxins by highperformance<br />
liquid chromatography with amperometric detection, J.Chromatography A, 828: 439-444<br />
17. Fifield F.W. and Kealey D (2000) Principle and practice of analytical chemistry 3 rd Edition, Blackwell science,<br />
UK<br />
18. Yaacob M.H., Mohd Yusof A.R., and Ahamad R (2003), Cyclic Voltammetry of AFB2 at mercury electrode,<br />
Paper presented at SKAM –VI, Unimas, Kucing, Sarawak, <strong>Malaysia</strong>, 9-11 September 2003<br />
19. Yaacob M.H., Mohd Yusof A.R., and Ahamad R. (2004), Cyclic Voltammetry of AFG1 at mercury electrode,<br />
Paper presented at 3rd Annual Seminar on Sustainable Science and Management, KUSTEM, Terengganu,<br />
<strong>Malaysia</strong>, 4 – 5 May 2004.<br />
20. Jaimez J., Fente C.A., Vazquez B.I., Franco C.M., Cepeda A., Mahuzier G. and Prognon P (2000). “Application of<br />
the assay of aflatoxins by liquid chromatography with fluorescence detection in food analysis.” J.<br />
Chromatography A.” 882: 1-10<br />
21. Miller K (1987) Toxicology aspects of food. Elsevier Applied Science, New York<br />
2.2. Yaacob M.H., Mohd Yusof A.R. and Ahamad R (2005). Differential pulse stripping voltammetric (DPSV)<br />
technique for determination of AFB2 at the mercury electrode. To be published in Collection of Czechoslovak<br />
Chemical Communication. In process.<br />
9
PAPER WAS PUBLISHED IN<br />
J. Kimia Analisis (<strong>Universiti</strong> Sumatera Utara, Medan, Indonesia)<br />
Yaacob, M.H., Mohd. Yusoff, A.R. and Ahamad, R. (2005). Development of Differential<br />
Pulse Cathodic Stripping voltammetry (DPCSV) Technique for the Determination of<br />
AFB1 in Ground Nut Samples. J. Sains Kimia. 9(3): 31-36.<br />
1
DETERMINATION OF THE AFLATOXIN B1 IN GROUND NUT BY<br />
DIFFERENTIAL PULSE CATHODIC STRIPPING VOLTAMMETRY (DPCSV)<br />
TECHNIQUE<br />
Mohamad Hadzri Yaacob 1 , Abdull Rahim Hj. Mohd. Yusoff 2 , Rahmalan Ahamad 2<br />
and Marpongahton Mismi 3<br />
1 School of Health Sciences, USM, 16150 Kubang Krian, Kelantan, <strong>Malaysia</strong><br />
2 Dept. of Chemistry, Faculty of Sciences, UTM, 81310 UTM, Skudai, Johor, <strong>Malaysia</strong><br />
3 Dept. of Chemistry, Faculty of Mathematic and Science, USU, Medan, Indonesia<br />
ABSTRACT<br />
An electro analytical method has been developed for the detection and<br />
determination of the 2,3,6a,9a-tetrahydro-4-methoxycyclo penta[c] furo[3’,2’:4,5] furo<br />
[2,3-h][l] benzopyran-1,11-dione (aflatoxin B1, AFB1) by a differential pulse cathodic<br />
stripping voltammetry on a hanging mercury drop electrode (HMDE) in aqueous solution<br />
with Britton-Robinson buffer (BRb) as supporting electrolyte. Effect of instrumental<br />
parameters such as accumulation potential (Eacc), accumulation time (tacc) and scan rate<br />
(v) were examined. The best condition were found to be pH 9.0, Eacc of -0.6 V, tacc of 80<br />
s and v; 50 mV/s. Calibration curve is linear in the range of 0.02 to 0.32 uM with a<br />
detection limit of 0.75 x 10 -8 M (3SDblank/m). Relative standard deviation for a replicate<br />
measurements of AFB1 ( n= 8) with the concentrations of 0.02 and 0.20 uM were 1.27%<br />
and 0.83% respectively. The method is applied for determination of the AFB1 in ground<br />
nut samples after extraction and clean-up steps. The recovery values obtained in spiked<br />
ground nut sample are 90.93 +/- 2.53 % for 3.0 ppb and 86.15 +/- 2.03 % for 15.0 ppb of<br />
AFB1.<br />
ABSTRAK<br />
Satu kaedah elektroanalisis telah dibangunkan untuk mengesan dan menentukan<br />
2,3,6a,9a-tetrahydro-4-methoxycyclo penta[c] furo[3’,2’:4,5] furo [2,3-h][l] benzopyran-<br />
1,11-dione (aflatoxin B1, AFB1) menggunakan teknik voltammetri perlucutan katodik<br />
denyut pembeza di atas elektrod titisan raksa tergantung (HMDE) di dalam larutan akuas<br />
dengan larutan penimbal Britton-Robinson bertindak sebagai larutan penyokong. Kesan<br />
parameter peralatan seperti keupayaan pengumpulan (Eacc), masa pengumpulan (tacc) dan<br />
kadar imbasan (v) telah dikaji. Keadaan terbaik yang diperolehi adalah pH 9.0, Eacc; -0.6<br />
V, tacc; 80 s dan v; 50 mV/s. Keluk kalibrasi adalah linear pada julat di antara 0.02 ke<br />
0.32 uM dengan had pengesan pada 0.75 x 10 -8 M (3SDblank/ m). Sisihan piawai relatif<br />
1 Corresponding address:<br />
Chemistry Dept, Faculty of Science, UTM,<br />
81300 Skudai, Johor, <strong>Malaysia</strong><br />
tel: 07-553 4492 or 016-926 0354<br />
or e-mail address: mhy02psk@yahoo.com<br />
2
untuk pengukuran AFB1 dengan kepekatan 0.02 dan 0.2 M sebanyak 8 kali ialah 1.27 %<br />
dan 0.83 % masing-masingnya. Kaedah ini telah digunakan untuk menentukan<br />
kandungan AFB1 di dalam sampel kacang tanah selepas proses pengekstraksian dan<br />
pembersihan. Nilai perolehan semula di dalam sampel kacang yang disuntik dengan 3.0<br />
ppb dan 15.0 ppb AFB1 adalah 90.93 +/- 2.53 % dan 86.15 +/- 2.03 % masingmasingnya.<br />
Keywords: Cathodic stripping voltammetry; aflatoxin B1; ground nut<br />
O<br />
INTRODUCTION<br />
Aflatoxins are mycotoxin produced by certain fungi especially, Aspergillus flavus<br />
and parasiticus , and they display strong carcinogenicity [1]. Therefore, they are<br />
dangerous food contaminants and many countries have stringent regulatory demands on<br />
the level of aflatoxins permitted in imported and traded commodities. Aflatoxin B1, B2,<br />
G1 and G2 are the main toxins and may be present in many foodstuff or animal feed<br />
such as maize, peanuts, nuts, copra and cottonseeds [2]. Of these, AFB1 (Fig 1) is the<br />
most commonly occurring variety and one of the most toxic [3]. The order of toxicity ,<br />
AFB1 > AFG1 > AFB2 > AFG2, indicates that the terminal furan moiety of AFB1 is a<br />
critical point for determining the degree of biological activity of this group of mycotoxins<br />
[4].<br />
O<br />
O<br />
Figure 1. Structural formula of AFB1<br />
O<br />
One of the foodstuff which is most occurrence of AFB1 is ground nut. In<br />
<strong>Malaysia</strong>, the AFB1 level in peanut is regulated with maximum level that cannot be<br />
greater than 15 ppb [5]. Several analytical techniques for quantitative determination of<br />
the AFB1 in ground nut have been proposed such as thin layer chromatography [6], high<br />
performance liquid chromatography, where a derivatisation is required either using<br />
trifluoroacetic acid [7], iodine [8] or bromine [9], and an enzyme-linked immunosorbent<br />
assay, ELISA [10], All these methods, however, require specialist equipment operated<br />
by skilled personnel and expensive instruments and high maintenance cost [11].<br />
Due to all these reasons, a voltammetric technique which is fast, accurate and<br />
requires low cost equipment [12] is proposed. This technique uses the concept where the<br />
O<br />
O<br />
3
peak height of reduction peak of AFB1 is measured when a certain potential is applied<br />
[13]. Previous experiment using cyclic voltammetric technique showed that AFB1<br />
reduced at mercury electrode and the reaction is totally irreversible [14]. This work aimed<br />
to study and develop a DPCSV method for determination of AFB1 at trace levels and to<br />
determine this aflatoxin in ground nut samples. No such report has been published<br />
regarding the determination of AFB1 in ground nut using this technique until now.<br />
Apparatus<br />
EXPERIMENTAL<br />
Voltammetric measurements were performed using BAS CV-50W voltammetric<br />
analyzer with Control Growth Mercury Electrode (CGME) stand. The three-electrode<br />
system consisted of a CGME as working electrode, Ag/AgCl2 reference electrode and<br />
platinum wire as the auxiliary electrode. A 20 ml capacity measuring cell was used for<br />
placing supporting electrolyte and sample analytes. All measurements were carried out at<br />
room temperature. All pH measurements were made with Cyberscan pH meter,<br />
calibrated with standard buffers (pH 4, 7 and 10) at room temperature.<br />
Reagents<br />
AFB1 standard. (1mg per bottle) was purchased from Sigma Co. and was used<br />
without further purification. Stock solution ( 10 ppm) in hexane:acetonitrile (98:2) were<br />
prepared and was stored in the dark at -4 0 C. The diluted solution were prepared daily<br />
by using certain volume of stock solution, degassed by nitrogen until dryness and<br />
redissolved in Britton-Robinson solution at pH 9.0.<br />
Britton-Robinson buffer solution was prepared from a stock solution 0.04 M<br />
phosphoric (Merck), boric (Merck) and acetic (Merck) acids. BRb solution with other<br />
pH also was prepared by adding sodium hydroxide (Merck) 1.0 M up to pH value<br />
required. All solutions were prepared in double distilled dionised water. All chemicals<br />
were of analytical grade reagents.<br />
General procedure<br />
For voltammetric experiments, 10 ml of Britton-Robinson buffer solution was<br />
placed in a voltammetric cell, through which a nitrogen stream was passed for 600 s<br />
before recording the voltammogram. The selected Eacc = - 600 mV was applied during<br />
the tacc = 80 s while the solution was kept under stirring. After the accumulation time had<br />
elapsed, stirring was stopped and the selected accumulation potential was kept on<br />
mercury drop for a rest time (tr = 10 s), after which a potential scan was performed<br />
between -0.950 and -1.500 V by DPCSV.<br />
4
Procedure for the determination in ground nut samples<br />
Four batches of ground nut included an artificial contaminated have been<br />
analysed for AFB1 content. AFB1was extracted from ground nut samples according to<br />
the standard procedure developed by Chemistry Department, Penang Branch, Ministry<br />
Of Science, Technology and Innovation (MOSTI), <strong>Malaysia</strong> [15]. 1ml of the final<br />
solution from extraction and clean-up steps in chloroform was pipette into an amber<br />
bottle, degassed with nitrogen and re-dissolved in 1ml of Britton-Robinson. 200 ul of<br />
this solution was spiked into 10 ml supporting electrolyte in volumetric cell. After that,<br />
the general procedure was applied and voltammogram of sample was recorded. A 10 ppb<br />
of AFB1 standard solution was then spiked into the sample solution before general<br />
procedure for voltammetric analysis The content of AFB1 in ground nut sample was<br />
calculated based on standard addition method to minimize any matrix effect.<br />
Cyclic voltammetric determination of AFB1<br />
RESULT AND DISCUSSION<br />
Cyclic voltammogram of 1.3 uM AFB1 in Britton-Robinson buffer solution as<br />
shown in Figure 2.0 indicates the non-reversibility of the electrode process. It is also<br />
confirmed by the study of the influence of the scan rate in this technique, where a linear<br />
relationship between peak potential (Ep ) and log scan rate was found as Ep (-mV) =<br />
61.41x + 1171.6 (R 2 = 0.9967).<br />
Figure 3.0 Typical repetitive cyclic voltammogram of 1.3 uM AFB1 in BRb<br />
pH 9.0; scan rate = 200 mV/s.<br />
5
Effect of pH<br />
The influence of pH on the voltammetric behaviour of AFB1 has been studied<br />
using DPCSV. AFB1 gave a single reduction signal in the pH range of 5.0 to 12.0 where<br />
at pH 9.0, the highest peak height has been obtained as shown in Figure 3.0. This can be<br />
assigned to the reduction of the ketone group to give the corresponding alcohol [19].<br />
Ip (nA)<br />
60<br />
50<br />
40<br />
30<br />
20<br />
10<br />
0<br />
4 6 8 10 12<br />
pH<br />
Figure 3.0 Effect of pH of BRb on peak height of 1.0 uM AFB1<br />
Optimisation of condition for the stripping analysis<br />
The voltammetric determination of analytes at trace levels normally involves very<br />
small current response. For that reason it is important to optimise all those parameters<br />
which may have an influence on the measured peak height. The effect of various<br />
parameters such as accumulation potential (Eacc ), accumulation time (tacc) and scan rate<br />
on the peak height of AFB1 have been studied. The results of these optimization were<br />
Eacc; -0.6 V, tacc ; 80 s and scan rate 50 mV/s. Other parameters are initial potential (Ei )<br />
= -0.1 V, final potential (Ef ) = -1.4 V and pulse amplitude = 80 mV. Using these<br />
optimized parameters, 0.1 uM of AFB1 has produced a single and sharp peak at Ep of -<br />
1.21 V with Ip of 60 +/- 5 nA ( n=5) as shown in Figure 4.0.<br />
Figure 4.0 Voltammogram of 0.1 uM AFB1 in BRb pH 9.0 (n=5). Condition;<br />
Eacc = -0.6 V, tacc = 80 s and scan rate = 50 mV/s<br />
6
Effect of standard addition of AFB1 and analytical characteristics of the method<br />
Using the optimized conditions that already mentioned, a study was made of the<br />
relationship between peak current and concentration. There is a linear relationship in the<br />
concentration range 0.02 uM and 0.32 uM with a regression equation of y = 5.4363x +<br />
3.7245 ( R 2 = 0.9989) as shown in Figure 5.0a and 5.0b. The relative standard deviations<br />
(RSD) of the analytical signals at several concentration values were 1.27% and 0.83% for<br />
AFB1 at concentration of 0.02 uM and 0.20 uM respectively. The analytical sensitivity<br />
has been calculated as 3SDblank / m (16) and was found as 0.75 x 10 -8 M. SDblank is the<br />
standard deviation from 8 measurements of blank and m is slope from calibration curve.<br />
ip (n A )<br />
200<br />
150<br />
100<br />
(i) (ii)<br />
50<br />
0<br />
y = 5.4363x + 3.7245<br />
R 2 = 0.9989<br />
0 10 20 30 40<br />
[AFB1] x 10-8M<br />
Figure 5.0 (i) Voltammograms of AFB1 with increasing concentration (b) 0.02 uM ,<br />
(c) 0.04 uM, (d) 0.06 uM, (e) 0.10 uM, (f) 0.14 uM, (g) 0.18 uM (h) 0.22 uM, (i) 0.26<br />
uM, (j) 0.30 uM and (k) 0.32 uM in (a) BRb pH 9.0; (ii) it’s calibration curve.<br />
Conditions: Eacc= -0.6 V, tacc = 80 s, scan rate = 50 mV/s.<br />
Determination of AFB1 in ground nut samples<br />
The proposed method was applied to the analysis of the AFB1 in eluate of ground<br />
nut samples, spiked with different concentration of AFB1 for recovery studies. In this<br />
7
study, the concentrations used were 3.0 ppb and 15.0 ppb The results of this studies are<br />
represented in Table 1.0. The results show that the accuracy of the method is good.<br />
Table 1.0 Recovery study of AFB1 spiked in eluate of ground nut<br />
samples (n = 3)<br />
No<br />
1<br />
2<br />
Amount added<br />
(ppb)<br />
3.00<br />
15.00<br />
Amount found<br />
(ppb)<br />
2.73 +/- 0.08<br />
12.92 +/- 0.30<br />
% of recovery<br />
90.93 +/- 2.53<br />
88.15 +/- 2.03<br />
Analyses of AFB1 content in ground nut samples were determined by standard<br />
addition in order to eliminate the matrix effects. Voltammograms of ground nut samples<br />
are shown in Figures 6(i) to 6(iv). AFB1 was not detected in three samples while in<br />
artificial contaminated sample, 333 ppb of AFB1 was found. The results were compared<br />
to that obtained by HPLC technique as stated in Table 2.0 which show a good agreement<br />
between them. It was concluded that the proposed technique is good, accurate and<br />
reliable for determination of AFB1 in ground nut samples.<br />
Table 2.0 The results of DPCSV analysis of AFB1 in ground nut samples<br />
compared with HPLC technique.<br />
Sample<br />
1<br />
2<br />
3<br />
4<br />
Note: ND = not detected<br />
By DPCSV technique<br />
ND<br />
ND<br />
ND<br />
333 ppb<br />
By HPLC technique<br />
ND<br />
ND<br />
ND<br />
337 ppb<br />
8
(i) (ii)<br />
(iii) (iv)<br />
Figure 6.0 Voltammograms of ground nut sample No. 1 (i), sample No. 2 (ii),<br />
sample No. 3 (iii) and sample No. 4 with standard addition of 10 ppb AFB1 (iv) in<br />
BRb pH 9.0 as the blank. Condition; Eacc = -0.6 V, tacc = 80 s and scan rate = 50<br />
mV/s.<br />
ACKNOWLEDGEMENT<br />
One of the author would like to thank University Science <strong>Malaysia</strong> for approving<br />
his study leave and financial support to carry out his further study at Dept of Chemistry,<br />
UTM. We also indebt to UTM for fundamental short term grant (Vot No 75152) and to<br />
Chemistry Department, Penang Branch, Ministry of Science, Technology and<br />
Innovation(MOSTI), <strong>Malaysia</strong> for the procedure of extraction and clean-up of ground nut<br />
samples.<br />
9
REFERENCES<br />
1. Akiyama H. Goda Y. Tanaka T and Toyoda M. (2001). Determination of<br />
aflatoxinsB1, B2, G1 and G2 in spices using a multifunctional column clean-up,<br />
J. Of Chromatography A, 932. 153-157.<br />
2. Chiavaro E., Dall’Asta C., Galaverna G., Biancardi A., Gambarelli E., Dossena A.<br />
and Marchelli R. (2001). New reversed-phase liquid chromatographic method to<br />
detect aflatoxins in food and feed with cyclodextrins as fluorescence enhancers<br />
added to the eluent, J Of Chromatography A, 937. 31-40.<br />
3. World Health Organisation in: IARC Monograph on the evaluation of<br />
carcinogenic risk to human, WHO, Lyon, 1987.<br />
4. Hall A.J., Wild C.P in: Eaton D.L., Groopman J.D. (Eds). The toxicology of<br />
aflatoxins: Human Health, Veterinary and Agricultural Significance, Academic<br />
New York, 1994.<br />
5. <strong>Malaysia</strong>n Food Act (1983) Act No 281, Reviewed 2002, Food Quality Control<br />
Dept, Ministry of Health, <strong>Malaysia</strong>.<br />
6. Bicking M.K.L., Kniseley R.N and Svec H.J (1983), Coupled-Column for<br />
quantization low levels of aflatoxins, J . Assoc. Off. Anal. Chem. 66, 905-908.<br />
7. Beebe B.M. (1978). Reverse phase high pressure liquid chromatographic<br />
determination of aflatoxins in foods, J. Assoc. Off. Anal. Chem. 81. 1347-1352.<br />
8. Cepeda A., Franco C.M., Fente C.A., Vazquez B.I., Rodriguez J.L., Prognon P.<br />
and Mahuzier G. (1996). Post column excitation of aflatoxins using cyclodextrins<br />
in liquid chromatography for food analysis. J Of Chrom A. 721. 69-74.<br />
9. Garner R.C., Whattam, M.M. , Taylor, P.J.L. and Stow M.W ( 1993) Analysis of<br />
United Kingdom purchased spices for aflatoxins using immunoaffinity column<br />
clean up procedure followed up by high-performance liquid chromatographic<br />
analysis and post-column derivatization with pyridium bromide per bromide, J.<br />
Chromatography, 648: 485-490<br />
10. Blesa J., Soriano J.M., Molto J.C., Marin R. and Manes J. (2003). Determination<br />
of aflatoxins in peanuts by matrix solid-phase dispersion and liquid<br />
chromatography. J Of Chrom A. 1011. 49-54.<br />
11. Garden S.R. and Strachan N.J.C.(2001). Novel colorimetric immunoassay for the<br />
detection of aflatoxin B1, Anal Chim Acta, 444. 187-191.<br />
10
12. Braitina Kh. Z., Malakhova N.A. and Stojko Y. (2000) Stripping voltammetry in<br />
environmental and food analysis, Fresenius J Anal Chem 368: 307-325<br />
13. Fifield F.W. and Kealey D (2000) Principle and practice of analytical chemistry<br />
3 rd Edition, Blackwell science, UK<br />
14. Yaacob M.H., Mohd Yusoff A.R. and Ahmad R. (2003). Cyclic voltammetry of<br />
AFB2 at the mercury electrode. Paper presented at Simposium Kimia <strong>Malaysia</strong> ke<br />
13 (SKAM-13), 9 – 11 th September 2003, Kucing, Sarawak, <strong>Malaysia</strong>.<br />
15. Standard procedure for determination of aflatoxins (2000). Chemistry<br />
Department, Penang Branch, Ministry of Science, Technology and Innovation<br />
(MOSTI), <strong>Malaysia</strong> (unpublished paper).<br />
16. Smyth M. R., Lawellin D. W. and Osteryoung J.G (1979) Polarographic Study of<br />
Aflatoxin B1, B2, G1 and G2: Application of Differential-pulse Polarography to<br />
the Determination of Aflatoxin B1 in Various Foodstuffs, Analyst, 104: 73-78<br />
17. Sabry S.M. (1999). Adsorptive stripping voltammetric assay of phenazopyridine<br />
hydrochloride in biological fluids and pharmaceutical preparation, Talanta 50:<br />
133-140.<br />
11