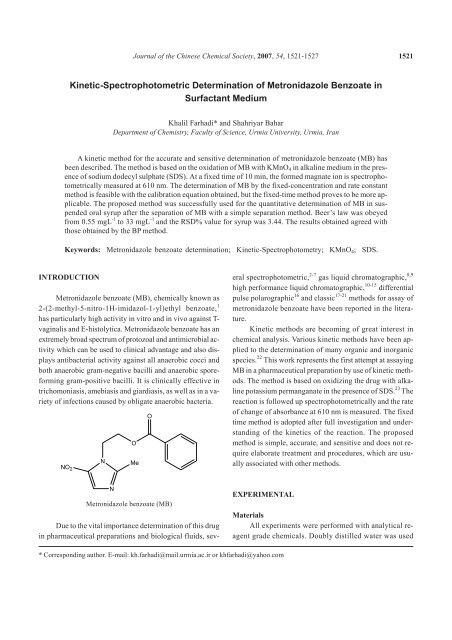
Kinetic-Spectrophotometric Determination of Metronidazole Benzoate
Kinetic-Spectrophotometric Determination of Metronidazole Benzoate
Kinetic-Spectrophotometric Determination of Metronidazole Benzoate

You also want an ePaper? Increase the reach of your titles
YUMPU automatically turns print PDFs into web optimized ePapers that Google loves.
<strong>Kinetic</strong>-<strong>Spectrophotometric</strong> <strong>Determination</strong> <strong>of</strong> <strong>Metronidazole</strong> <strong>Benzoate</strong> in<br />
Surfactant Medium<br />
Khalil Farhadi* and Shahriyar Bahar<br />
Department <strong>of</strong> Chemistry, Faculty <strong>of</strong> Science, Urmia University, Urmia, Iran<br />
A kinetic method for the accurate and sensitive determination <strong>of</strong> metronidazole benzoate (MB) has<br />
been described. The method is based on the oxidation <strong>of</strong> MB with KMnO4 in alkaline medium in the presence<br />
<strong>of</strong> sodium dodecyl sulphate (SDS). At a fixed time <strong>of</strong> 10 min, the formed magnate ion is spectrophotometrically<br />
measured at 610 nm. The determination <strong>of</strong> MB by the fixed-concentration and rate constant<br />
method is feasible with the calibration equation obtained, but the fixed-time method proves to be more applicable.<br />
The proposed method was successfully used for the quantitative determination <strong>of</strong> MB in suspended<br />
oral syrup after the separation <strong>of</strong> MB with a simple separation method. Beer’s law was obeyed<br />
from 0.55 mgL -1 to 33 mgL -1 and the RSD% value for syrup was 3.44. The results obtained agreed with<br />
those obtained by the BP method.<br />
Keywords: <strong>Metronidazole</strong> benzoate determination; <strong>Kinetic</strong>-Spectrophotometry; KMnO4; SDS.<br />
INTRODUCTION<br />
<strong>Metronidazole</strong> benzoate (MB), chemically known as<br />
2-(2-methyl-5-nitro-1H-imidazol-1-yl)ethyl benzoate, 1<br />
has particularly high activity in vitro and in vivo against Tvaginalis<br />
and E-histolytica. <strong>Metronidazole</strong> benzoate has an<br />
extremely broad spectrum <strong>of</strong> protozoal and antimicrobial activity<br />
which can be used to clinical advantage and also displays<br />
antibacterial activity against all anaerobic cocci and<br />
both anaerobic gram-negative bacilli and anaerobic sporeforming<br />
gram-positive bacilli. It is clinically effective in<br />
trichomoniasis, amebiasis and giardiasis, as well as in a variety<br />
<strong>of</strong> infections caused by obligate anaerobic bacteria.<br />
NO 2<br />
N<br />
N<br />
Due to the vital importance determination <strong>of</strong> this drug<br />
in pharmaceutical preparations and biological fluids, sev-<br />
Journal <strong>of</strong> the Chinese Chemical Society, 2007, 54, 1521-1527 1521<br />
O<br />
Me<br />
O<br />
<strong>Metronidazole</strong> benzoate (MB)<br />
eral spectrophotometric, 2-7 gas liquid chromatographic, 8,9<br />
high performance liquid chromatographic, 10-15 differential<br />
pulse polarographic 16 and classic 17-21 methods for assay <strong>of</strong><br />
metronidazole benzoate have been reported in the literature.<br />
<strong>Kinetic</strong> methods are becoming <strong>of</strong> great interest in<br />
chemical analysis. Various kinetic methods have been applied<br />
to the determination <strong>of</strong> many organic and inorganic<br />
species. 22 This work represents the first attempt at assaying<br />
MB in a pharmaceutical preparation by use <strong>of</strong> kinetic methods.<br />
The method is based on oxidizing the drug with alkaline<br />
potassium permanganate in the presence <strong>of</strong> SDS. 23 The<br />
reaction is followed up spectrophotometrically and the rate<br />
<strong>of</strong> change <strong>of</strong> absorbance at 610 nm is measured. The fixed<br />
time method is adopted after full investigation and understanding<br />
<strong>of</strong> the kinetics <strong>of</strong> the reaction. The proposed<br />
method is simple, accurate, and sensitive and does not require<br />
elaborate treatment and procedures, which are usually<br />
associated with other methods.<br />
EXPERIMENTAL<br />
* Corresponding author. E-mail: kh.farhadi@mail.urmia.ac.ir or khfarhadi@yahoo.com<br />
Materials<br />
All experiments were performed with analytical reagent<br />
grade chemicals. Doubly distilled water was used
1522 J. Chin. Chem. Soc., Vol. 54, No. 6, 2007 Farhadi and Bahar<br />
throughout. Reagent grade metronidazole benzoate and its<br />
syrup were obtained from Tehran Shimi Pharmaceutical<br />
Company, Tehran, Iran.<br />
Reagents and Solutions<br />
Stock solution <strong>of</strong> MB (10 -3 M) was prepared by dissolving<br />
27.53 mg <strong>of</strong> pure drug in 100 mL <strong>of</strong> 0.6 M HCl. The<br />
solution was stable for at least 5 days when kept in a refrigerator<br />
(at 4 �C). The working solutions were prepared by<br />
stepwise dilution as required. Potassium permanganate solution,<br />
10 -2 M, was prepared in distilled water. Sodium hydroxide<br />
solution, 2.5 M, was prepared and kept as a stock<br />
solution. Stock solution <strong>of</strong> SDS (10 -2 M)was prepared daily<br />
by dissolving 1.4419 g <strong>of</strong> SDS in water and diluting to 500<br />
mL.<br />
Apparatus<br />
The study was conducted using an LKB 4054 UV/<br />
VIS recording spectrophotometer and 1.00-cm matched<br />
silica cells. All pH measurements were made with a digital<br />
WTW Multilab 540 Ionalyzer (Germany) pH/mV meter using<br />
a combined glass electrode.<br />
Procedures<br />
General Procedure for <strong>Kinetic</strong>-<strong>Spectrophotometric</strong><br />
<strong>Determination</strong> <strong>of</strong> MB<br />
Transfer 6 mL <strong>of</strong> 10 -2 M potassium permanganate, 5<br />
mL <strong>of</strong> 2.5 M sodium hydroxide and 1 mL <strong>of</strong> 10 -2 MSDSsolutions<br />
into 25 mL calibrated flasks. Accurate volumes <strong>of</strong><br />
working solution <strong>of</strong> MB, over the concentration range<br />
0.55-33 mgL -1 , were added and the solutions were diluted<br />
to volume with distilled water. At a fixed time <strong>of</strong> 10 min,<br />
the absorbance was measured directly at 610 nm against an<br />
appropriate blank sample. The calibration graph was constructed<br />
by plotting the final concentration <strong>of</strong> the drug<br />
against the absorbance values.<br />
Procedure for <strong>Determination</strong> <strong>of</strong> MB in Syrup<br />
An accurately measured 2.0 mL aliquot <strong>of</strong> the mixed<br />
contents <strong>of</strong> three syrups was transferred into a 5 mL test<br />
tube containing 1 mL 0.5 M NaOH and then centrifuged at<br />
a rate <strong>of</strong> 5000 rpm for 5 min. The residue was washed at<br />
least three or more times with mild alkaline solution, then<br />
was quantitatively transferred into a 100 mL calibrated<br />
flask, and after the complete dissolution in 0.6 M HCl, diluted<br />
to the mark. The recommended kinetic-spectrophotometric<br />
procedure for the determination <strong>of</strong> MB was fol-<br />
lowed on appropriate amounts <strong>of</strong> this solution at room temperature.<br />
RESULTS AND DISCUSSION<br />
<strong>Kinetic</strong>s and Optimization <strong>of</strong> the Reaction Conditions<br />
MB was found to react with alkaline potassium permanganate<br />
in the presence <strong>of</strong> SDS producing a green color<br />
as a result <strong>of</strong> manganate species, which absorbs at 610 nm.<br />
As the intensity <strong>of</strong> color increases with time, it was deemed<br />
useful to elaborate a kinetically-based method for the determination<br />
<strong>of</strong> MB. At 610 nm, changing each variable in turn,<br />
while keeping all others constant, optimized the various experimental<br />
parameters affecting the development and stability<br />
<strong>of</strong> the reaction product.<br />
Effect <strong>of</strong> the KMnO4 Concentration on the Reaction<br />
The effect <strong>of</strong> potassium permanganate concentration<br />
on the reaction was studied over the range <strong>of</strong> 4 × 10 -4 -3.2×<br />
10 -3 M<strong>of</strong>KMnO4 and five selected concentrations <strong>of</strong> MB<br />
according to the obtained calibration graph (Fig. 1). The reaction<br />
rate and absorbance increased with increasing<br />
KMnO4 concentration and leveled <strong>of</strong>f at 2.4 × 10 -3 Mfora<br />
maximum concentration <strong>of</strong> MB in the calibration carve.<br />
Therefore 2.4 × 10 -3 MKMnO4 was chosen as the most<br />
suitable concentration.<br />
Fig. 1. Effect <strong>of</strong> KMnO4 concentration on the reaction<br />
product <strong>of</strong> MB (A) 2.0 × 10 -6 M, (B) 2.0 × 10 -5<br />
M, (C) 4.0 × 10 -5 M, (D) 8.0 × 10 -5 Mand(E)1.2<br />
×10 -4 M measured at room temperature after 10<br />
min.
<strong>Kinetic</strong> <strong>Determination</strong> <strong>of</strong> <strong>Metronidazole</strong> <strong>Benzoate</strong> J. Chin. Chem. Soc., Vol. 54, No. 6, 2007 1523<br />
Effect <strong>of</strong> the SDS Concentration on the Reaction<br />
The ability <strong>of</strong> surfactants to dissolve organic compounds,<br />
which are insoluble or only slightly soluble in water,<br />
is a distinctive feature <strong>of</strong> solubilization. They are usually<br />
incorporated into a hydrocarbon environment in the interior<br />
<strong>of</strong> micelles. 24 Therefore, in this study, we used a solution<br />
<strong>of</strong> surfactants as suitable medium for the complete dissolving<br />
<strong>of</strong> MB. For this purpose, several anionic, cationic<br />
and non-ionic surfactants were tested. Among the tested<br />
surfactants in an alkaline mixture <strong>of</strong> MB, the obtained solutions<br />
using SDS were completely transparent, so MB solutions<br />
were prepared in alkaline-SDS media.<br />
The effect <strong>of</strong> various concentrations <strong>of</strong> SDS on maximum<br />
absorbance at different amounts <strong>of</strong> MB was studied<br />
between 4 × 10 -5 –1.2×10 -3 M (Fig. 2). As seen, in all<br />
cases, a maximum absorbance was obtained using concentrations<br />
above 4 × 10 -4 M <strong>of</strong> SDS. Therefore, the optimum<br />
concentration <strong>of</strong> SDS was selected as 4 × 10 -4 M in all solutions.<br />
Effect <strong>of</strong> the NaOH Concentration on the Reaction<br />
The influence <strong>of</strong> the medium alkalinity was investigated<br />
between 0.1-1 M sodium hydroxide (Fig. 3). It was<br />
observed that increasing NaOH concentration increases the<br />
reaction rate with maximum absorbance being a shorter<br />
time. It was also found that there was no significant difference<br />
in the absorbance <strong>of</strong> reaction solution at NaOH concentrations<br />
above 0.5 M, while decreasing NaOH concen-<br />
Fig. 2. Effect <strong>of</strong> SDS concentration on the reaction<br />
product <strong>of</strong> MB (A) 2.0 × 10 -6 M, (B) 2.0 × 10 -5<br />
M, (C) 4.0 × 10 -5 M, (D) 8.0 × 10 -5 Mand(E)1.2<br />
×10 -4 M measured at room temperature after 10<br />
min.<br />
tration resulted in lower absorbance values. Therefore, 0.5<br />
M NaOH was chosen for all subsequent experiments.<br />
<strong>Determination</strong> <strong>of</strong> the Molar Ratio between KMnO4<br />
and MB in the Reaction<br />
The limiting logarithmic method was used for the determination<br />
<strong>of</strong> the molar ratio between KMnO4 and MB in<br />
the reaction. This method depends on measuring the optical<br />
densities <strong>of</strong> solution <strong>of</strong> KMnO4 andMBinwhichtheconcentration<br />
<strong>of</strong> the two species are varied in turn at a constant<br />
total ionic strength.<br />
The ratio may be found by plotting the logarithms <strong>of</strong><br />
the absorbance (A) <strong>of</strong> the two sets <strong>of</strong> solutions versus composition,<br />
one with constant KMnO4 concentration and variable<br />
MB concentration, the other with constant MB and<br />
variable KMnO4 concentration (Fig. 4). The slope <strong>of</strong> the<br />
curve in case 1 yields the number <strong>of</strong> moles <strong>of</strong> MB while that<br />
in case 2 gives the number <strong>of</strong> moles <strong>of</strong> KMnO4 andsothe<br />
composition <strong>of</strong> the compound produced can be evaluated.<br />
The molar ratio was found to be 1:2 for MB/KMnO4.<br />
<strong>Determination</strong> <strong>of</strong> the Reaction Order<br />
The rate <strong>of</strong> the reaction was also found to be [MB]dependent.<br />
The rates were followed at room temperature<br />
with various concentrations <strong>of</strong> MB in the range <strong>of</strong> 0.55-33<br />
mgL -1 , keeping KMnO4, NaOH and SDS constant at high<br />
concentrations as above.<br />
Fig. 3. Effect <strong>of</strong> NaOH concentration on the reaction<br />
products <strong>of</strong> MB (A) 2.0 × 10 -6 M, (B) 2.0 × 10 -5<br />
M, (C) 4.0 × 10 -5 M, (D) 8.0 × 10 -5 Mand(E)1.2<br />
×10 -4 M measured at room temperature after 10<br />
min.
1524 J. Chin. Chem. Soc., Vol. 54, No. 6, 2007 Farhadi and Bahar<br />
The graphs shown in Fig. 5 were obtained, from which<br />
it is clear that the rate increases as the MB concentration increases,<br />
indicating that the reaction rate obeys the following<br />
equation:<br />
Rate = k� [MB] n<br />
Fig. 4. <strong>Determination</strong> <strong>of</strong> the molar ratio between<br />
KMnO4/MB by limiting logarithmic method. 1.<br />
Set <strong>of</strong> solutions with constant MB concentration<br />
and variable KMnO4 concentration. 2. Set<br />
<strong>of</strong> solutions with co4nstant KMnO4 concentration<br />
and variable MB concentrations.<br />
Fig. 5. Absorbance versus time graphs for the reaction<br />
<strong>of</strong> MB and alkaline potassium permanganate<br />
showing the dependence <strong>of</strong> the reaction on MB<br />
concentration. Concentration <strong>of</strong> MB (A) 0.55<br />
mgL -1 , (B) 5.5 mgL -1 , (C) 11.0 mgL -1 , (D) 16.5<br />
mgL -1 , (E) 22.0 mgL -1 , (F) 27.5 mgL -1 and (G)<br />
33.0 mgL -1 .<br />
(1)<br />
where k� is the pseudo-order constant <strong>of</strong> the reaction.<br />
Apparently, the reaction proceeds in two steps. The<br />
first step is fast and the second is the rate-determining step.<br />
From Fig. 5, the rate may be estimated by the variable-time<br />
method measurements(25), as �A/�t, taking logarithms<br />
<strong>of</strong> rates and concentrations; Eq. 1 is transformed<br />
into:<br />
log (rate) = log �A/�t=logk� +nlog[MB] (2)<br />
Regression <strong>of</strong> log [MB] versus log (rate) by the least<br />
squares method yielded the calibration equation:<br />
log (rate) = 1.5753 + 1.0175 log [MB] (3)<br />
with correlation coefficient r = 0.9896. Hence k� = 37.61 s -1<br />
and the reaction is pseudo first order (n � 1) with respect to<br />
MB.<br />
Evaluation <strong>of</strong> the <strong>Kinetic</strong> Methods<br />
Initial-Rate Method (Pseudo-zero-order Method)<br />
In this method, graphs <strong>of</strong> the rate (at the beginning <strong>of</strong><br />
the reaction) versus MB concentration were not easy to obtain,<br />
because the first step <strong>of</strong> the reaction was too fast to follow,<br />
so tangents <strong>of</strong> the curve were not easy to draw. This<br />
method was therefore abandoned.<br />
Rate Constant Method<br />
Graphs <strong>of</strong> log (absorbance) versus time for MB concentration<br />
in the range <strong>of</strong> 0.55-33 mgL -1 were plotted and<br />
all appeared to be rectilinear. Pseudo first-order-rate constants<br />
(K�) corresponding to different MB concentrations<br />
(C) were calculated from the slopes, multiplied by 2.303<br />
and are presented in Table 1. Regression <strong>of</strong> C versus k� gave<br />
the equation:<br />
K� = 15.506 C + 0.002 (R 2 = 0.8671) (4)<br />
The value <strong>of</strong> R indicates poor linearity, which is probably<br />
due to slight changes in the temperature <strong>of</strong> the reaction.<br />
Variable-Time Method<br />
Reaction rates were recorded for different MB concentrations<br />
in the range <strong>of</strong> 0.55-33 mgL -1 . A pre-selected<br />
value <strong>of</strong> the absorbance was fixed and the time was mea-
<strong>Kinetic</strong> <strong>Determination</strong> <strong>of</strong> <strong>Metronidazole</strong> <strong>Benzoate</strong> J. Chin. Chem. Soc., Vol. 54, No. 6, 2007 1525<br />
Table 1. Values <strong>of</strong> k' calculated from slopes <strong>of</strong> log (Abs.) versus<br />
t (second) graphs multiplied by 2.303 for different<br />
concentrations <strong>of</strong> MB at a constant concentration <strong>of</strong><br />
NaOH, KMnO4 and SDS at room temperature<br />
K' (s -1 ) [MB] (moleL -1 )<br />
1.9 � 10 -3<br />
2 � 10 -6<br />
2.0 � 10 -3<br />
2 � 10 -5<br />
2.8 � 10 -3<br />
4 � 10 -5<br />
3.0 � 10 -3<br />
6 � 10 -5<br />
3.6 � 10 -3<br />
8 � 10 -5<br />
3.5 � 10 -3<br />
1 � 10 -4<br />
3.5 � 10 -3<br />
1.2 � 10 -4<br />
Table 2. Values <strong>of</strong> reciprocal time taken at fixed absorbance for<br />
the different rates <strong>of</strong> variable concentration <strong>of</strong> MB at<br />
constant concentrations <strong>of</strong> NaOH, KMnO4 and SDS at<br />
room temperature<br />
(1/t) (s -1 ) [MB] (moleL -1 )<br />
3.33 � 10 -4<br />
2 � 10 -6<br />
1.74 � 10 -3<br />
2 � 10 -5<br />
5.86 � 10 -3<br />
4 � 10 -5<br />
8.63 � 10 -3<br />
6 � 10 -5<br />
9.90 � 10 -3<br />
8 � 10 -5<br />
1.10 � 10 -2<br />
1 � 10 -4<br />
1.15 � 10 -2<br />
1.2 � 10 -4<br />
sured next. The reciprocal <strong>of</strong> time (1/t) versus the initial<br />
concentrations <strong>of</strong> MB (Table 2) was plotted and the following<br />
equation <strong>of</strong> the calibration graph was obtained:<br />
1/t = 100.76 C + .00009 (R 2 = 0.9260) (5)<br />
The range <strong>of</strong> MB concentrations giving the most acceptable<br />
calibration graph with the above equation was<br />
very limited and showed poor linearity, which could be a<br />
disadvantage.<br />
Fixed-Time Method<br />
Reaction rates were determined for different concentrations<br />
<strong>of</strong> MB. At a pre-selected fixed-time, which was accurately<br />
determined, the absorbance was measured. Calibration<br />
graphs <strong>of</strong> absorbance versus initial concentration <strong>of</strong><br />
MB were established at fixed times <strong>of</strong> 2, 5, 10, 15, 20 and<br />
25 min with the regression equations assembled in Table 3.<br />
It is clear that the slope increases with time and the most acceptable<br />
values <strong>of</strong> r and the intercept were obtained for a<br />
fixed time <strong>of</strong> 10 min, which was therefore chosen as the<br />
most suitable time interval for measurement.<br />
Table 3. Calibration equations at different fixed-times for MB<br />
concentrations in the range <strong>of</strong> 0.55-33 �gmL -1<br />
Time (min) Calibration equation Correlation coefficient<br />
2 A = 0.0084 C + 0.0669 0.9455<br />
5 A = 0.0252 C + 0.0099 0.9991<br />
10 A = 0.0315 C + 0.0237 0.9989<br />
15 A = 0.0354 C + 0.0286 0.9986<br />
20 A = 0.0376 C + 0.0276 0.9984<br />
25 A = 0.0390 C + 0.0297 0.9981<br />
Table 4. Analytical data for the kinetic determination <strong>of</strong> MB<br />
Parameter Value<br />
Volume <strong>of</strong> KMnO4 6mL<br />
Volume <strong>of</strong> SDS 1 mL<br />
Volume <strong>of</strong> NaOH 5 mL<br />
Temperature 25 �C<br />
Reaction time 10 min<br />
Concentration range 0.55-33 mgL -1<br />
Molar absorptivity 8669.56<br />
Regression equation A = 0.0315 C + 0.0237<br />
Correlation coefficient 0.9989<br />
Sy/x 0.0225<br />
Sa 0.0160<br />
Sb 0.0009<br />
RSD for syrup 3.44%<br />
Linearity<br />
The kinetic curves obtained at different concentrations<br />
<strong>of</strong> MB, under the optimized conditions, were processed<br />
by the fixed time method. 26 A calibration graph <strong>of</strong><br />
absorbance versus initial concentration <strong>of</strong> MB was established<br />
at different fixed-time intervals. It was found that the<br />
slopes increase with time and the most acceptable values <strong>of</strong><br />
the correlation coefficient (R) and the intercept were obtained<br />
at a fixed-time <strong>of</strong> 10 min that was, therefore, chosen<br />
as the most suitable time intervals for measurement. The<br />
calibration graph was linear over the concentration range <strong>of</strong><br />
0.55-33 mgL -1 . Regression analysis indicated a linear relationship<br />
with negligible intercept. Table 4 presents the analytical<br />
parameters, molar absorptivity and the results <strong>of</strong> the<br />
statistical analysis <strong>of</strong> the experimental data regression<br />
equation calculated from the calibration graphs along with<br />
standard deviation <strong>of</strong> the slope (Sb) and intercept (Sa) on the<br />
ordinate and the standard deviation <strong>of</strong> residuals (Sy/x). The<br />
high values <strong>of</strong> the correlation coefficient <strong>of</strong> regression<br />
equation equations indicate good linearity and conformity<br />
to Beer’s law. The detection limit <strong>of</strong> the proposed method<br />
was calculated according to a reported method. 27 The de-
1526 J. Chin. Chem. Soc., Vol. 54, No. 6, 2007 Farhadi and Bahar<br />
tection limit was 0.24 µg mL -1 while the quantification<br />
limit was 0.71 µg mL -1 for MB.<br />
Accuracy and Precision<br />
Three replicate determinations at different concentration<br />
levels <strong>of</strong> MB were carried out to test the precision and<br />
accuracy <strong>of</strong> the proposed method. The relative standard deviation<br />
(RSD) is shown in Table 4. The figures obtained<br />
point to the good accuracy and repeatability <strong>of</strong> the method.<br />
The effects <strong>of</strong> common excipients and other substances<br />
were tested for possible interferences in this assay.<br />
In preliminary experiments, direct application <strong>of</strong> the proposed<br />
kinetic fixed-time method for the determination <strong>of</strong><br />
MB in samples containing some common oxidizable excipients<br />
such as glucose, starch or lactose showed considerable<br />
errors. This problem was easily solved by the quantitative<br />
separation <strong>of</strong> MB in the alkaline medium.<br />
ANALYTICAL APPLICATIONS<br />
Table 5. Application <strong>of</strong> the proposed kinetic method to the determination <strong>of</strong> MB in its<br />
pharmaceutical preparations<br />
%Recovery � SD*<br />
Preparation<br />
Proposed method Reference method 26<br />
<strong>Metronidazole</strong> Syrup 124 � 4.29 125 � 3.33<br />
(<strong>Metronidazole</strong> benzoate, 125 mg) t = 0.29, F = 1.66<br />
* Average <strong>of</strong> three replicate measurements. Tabulated values <strong>of</strong> t and F are 2.78 and 19.00 at<br />
95% confidence level.<br />
The proposed method has been successfully applied<br />
to determine MB in pharmaceutical preparations. The concentration<br />
<strong>of</strong> the drug was calculated using the corresponding<br />
regression equation at a fixed time <strong>of</strong> 10 min. In order to<br />
establish the validity <strong>of</strong> the proposed analytical method, the<br />
assay <strong>of</strong> MB in its formulation using the proposed and BP<br />
method 28 was carried out. It should be noted that, in performing<br />
the <strong>of</strong>ficial method on MB syrup in the first step,<br />
the drug was completely extracted into chlor<strong>of</strong>orm and after<br />
evaporating the solvent, the residue was dissolved in anhydrous<br />
glacial acetic acid, titrated with perchloric acid<br />
and determining the end point, potentiometrically. The results<br />
obtained are presented in Table 5. Statistical analysis<br />
<strong>of</strong> the results obtained by both the proposed method and the<br />
reference non-aqueous titrimetric method revealed no sig-<br />
nificant difference in the performance <strong>of</strong> the two methods<br />
regarding accuracy and precision as revealed by a t-test and<br />
an F-test, respectively (Table 5). It should be noted that the<br />
reaction medium in non-aqueous titrimetry must be scrupulously<br />
anhydrous and in practice, even a trace amount <strong>of</strong><br />
water will affect the results. Therefore, due to the absence<br />
<strong>of</strong> such errors in the proposed procedure, a convenient and<br />
fast performing method in aqueous media using inexpensive<br />
reagents and direct application <strong>of</strong> spectrophotometry<br />
in a wide concentration range suggests its application to the<br />
analyses and quality control <strong>of</strong> the studied compound in<br />
comparison to tedious time consuming <strong>of</strong>ficial methods.<br />
CONCLUSIONS<br />
The above results obtained from the proposed kinetic<br />
fixed-time method on suspended syrup after the separation<br />
<strong>of</strong> MB showed that the method is comparable to the <strong>of</strong>ficial<br />
BP method (see Table 5). The proposed kinetic-spectrophotometric<br />
method is simple, fast and inexpensive, does<br />
not require any toxic organic solvents, and is precise and<br />
accurate. This method was satisfactory for the determination<br />
<strong>of</strong> MB in drug formulations such as syrup without considerable<br />
interference.<br />
The student t-test and F-test values for the 95% confidence<br />
level did not exceed the theoretical values <strong>of</strong> 2.78<br />
and 19.0 for t and F-tests, respectively, indicating no significant<br />
difference between the accuracy and precision <strong>of</strong> the<br />
two methods. Therefore, this makes the method applicable<br />
for the determination <strong>of</strong> MB in pharmaceutical formulations.<br />
Received March 16, 2007.
<strong>Kinetic</strong> <strong>Determination</strong> <strong>of</strong> <strong>Metronidazole</strong> <strong>Benzoate</strong> J. Chin. Chem. Soc., Vol. 54, No. 6, 2007 1527<br />
REFERENCES<br />
1. British Pharmacopocia, IIMSO, London, 1993.<br />
2. Sastry,C.S.P.;Aruna,M.;Vijaya,D. Indian J. Pharm. Sci.<br />
1987, 49, 190.<br />
3. Sastry,C.S.P.;Aruna,M.;Rao,A.R.M. Talanta 1988, 35,<br />
23.<br />
4. Avramova, Y.; Zaikov, K.; Chokhadzhieva, D. Khig.<br />
Zdraveopaz. 1990, 33, 77.<br />
5. Sastry, C. S. P.; Aruna, M.; Rao, A. R. M.; Tipirneni, A. S. R.<br />
P. Chem.Anal.(Warsaw)1991, 36, 153.<br />
6. Sanyal,A.K. Analyst 1992, 117, 93.<br />
7. Maheshwari, R.; Chaturvedi, S.; Jain, N. Indian J. Pharm.<br />
Sci. 2006, 68(2), 195.<br />
8. Gorog, S.; Futo, M.; Lauko, A. Acta Pharm. Hung. 1976, 46,<br />
113.<br />
9. Gutierrez, C. R.; Garzon, A. Rev. Soc. Quim. Mex. 1979, 23,<br />
129.<br />
10. Mishal, A.; Sober, D. J. Pharm. Biomed. Anal. 2005, 39,<br />
819.<br />
11. Sasa, S. I.; Khalil, H. S.; Jalal, I. M. J. Liq. Chromatogr.<br />
1986, 9, 3617.<br />
12. Bempong, D. K.; Manning, R. G.; Mirza, T.; Bhattacharyya,<br />
L. J. Pharm. Biomed. Anal. 2005, 38, 776.<br />
13. Pashankov, P.; Kostova, L. J. Chromatogr. A 1987, 394, 382.<br />
14. Avramova, Y. Pharmazie 1988, 43, 436.<br />
15. Ali, M. S.; Chaudhary, R. S.; Takieddin, M. A. Drug. Dev.<br />
Ind. Pharm. 1999, 25, 1143.<br />
16. Dalkara, S.; Ong, H.; Braun, J.; Plourde, R. Anal. Lett. 1984,<br />
17, 793.<br />
17. Gajewska, M. Acta Pol. Pharm. 1972, 29, 393.<br />
18. Gajewska, M. Acta Pol. Pharm. 1973, 30, 167.<br />
19. Inamdar, M. C.; Mody, S. B. Indian J. Pharm. Sci. 1977, 39,<br />
106.<br />
20. Parimoo, P. Indian J. Pharm. Sci. 1986, 48, 186.<br />
21.Zhang,J.;Tan,Y.L.;Chen,D.H.;Yuan,Y.H.;Tang,W.J.;<br />
Hu,X.A. Zhongguo Yaoke Daxue Xuebao 2000, 31, 309.<br />
22. Crouch, S. R.; Cullen, T. F.; Scheeline, A.; Kirkor, E. S.<br />
Anal. Chem. 1998, 70, 53.<br />
23. Sykes, P. A Guide Book to Mechanism in Organic Chemistry;4<br />
th ed.; Longman: London, 1987; p 186.<br />
24. Shinoda, K.; Nakagawa, T.; Tamamushi, B.; Isemura, T.<br />
Collodial Surfactants; Academic Press: New York, 1963; pp<br />
97-178.<br />
25. Yatsimirskii, K. B. <strong>Kinetic</strong> Methods <strong>of</strong> Analysis; Pergamon<br />
Press: Oxford, 1996.<br />
26. Perez-Bendito, A.; Silva, M. <strong>Kinetic</strong> Methods in Analytical<br />
Chemistry; Eilis Harwood: London, 1988; p 40.<br />
27. Miller, J. C.; Miller, J. N. Statistics for Analytical Chemistry;2<br />
nd ed., Ellis Hrwood: Chichester, 1988.<br />
28. United States Pharmacopia, 16 th ed.; Easton. Pa. 180420,<br />
1985; p 580.