Download Evaluation of TomTom historical traffic data in
Download Evaluation of TomTom historical traffic data in
Download Evaluation of TomTom historical traffic data in
Create successful ePaper yourself
Turn your PDF publications into a flip-book with our unique Google optimized e-Paper software.
Introduction<br />
<strong>Evaluation</strong> <strong>of</strong> <strong>TomTom</strong> Historical Average Speed Data<br />
Texas Transportation Institute (TTI)<br />
June 15, 2012<br />
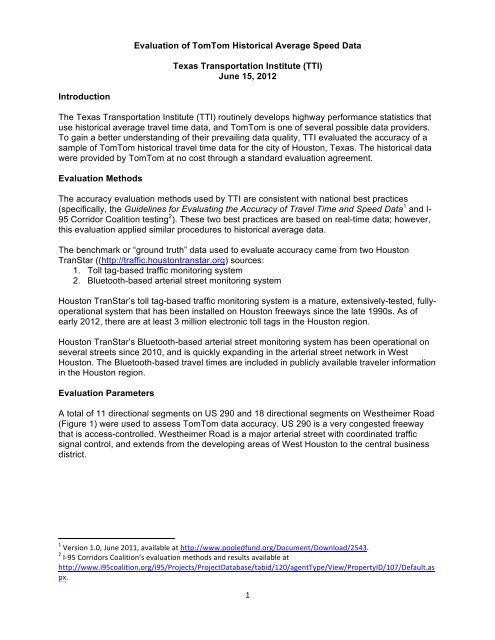
The Texas Transportation Institute (TTI) rout<strong>in</strong>ely develops highway performance statistics that<br />
use <strong>historical</strong> average travel time <strong>data</strong>, and <strong>TomTom</strong> is one <strong>of</strong> several possible <strong>data</strong> providers.<br />
To ga<strong>in</strong> a better understand<strong>in</strong>g <strong>of</strong> their prevail<strong>in</strong>g <strong>data</strong> quality, TTI evaluated the accuracy <strong>of</strong> a<br />
sample <strong>of</strong> <strong>TomTom</strong> <strong>historical</strong> travel time <strong>data</strong> for the city <strong>of</strong> Houston, Texas. The <strong>historical</strong> <strong>data</strong><br />
were provided by <strong>TomTom</strong> at no cost through a standard evaluation agreement.<br />
<strong>Evaluation</strong> Methods<br />
The accuracy evaluation methods used by TTI are consistent with national best practices<br />
(specifically, the Guidel<strong>in</strong>es for Evaluat<strong>in</strong>g the Accuracy <strong>of</strong> Travel Time and Speed Data 1 and I-<br />
95 Corridor Coalition test<strong>in</strong>g 2 ). These two best practices are based on real-time <strong>data</strong>; however,<br />
this evaluation applied similar procedures to <strong>historical</strong> average <strong>data</strong>.<br />
The benchmark or “ground truth” <strong>data</strong> used to evaluate accuracy came from two Houston<br />
TranStar ((http://<strong>traffic</strong>.houstontranstar.org) sources:<br />
1. Toll tag-based <strong>traffic</strong> monitor<strong>in</strong>g system<br />
2. Bluetooth-based arterial street monitor<strong>in</strong>g system<br />
Houston TranStar’s toll tag-based <strong>traffic</strong> monitor<strong>in</strong>g system is a mature, extensively-tested, fullyoperational<br />
system that has been <strong>in</strong>stalled on Houston freeways s<strong>in</strong>ce the late 1990s. As <strong>of</strong><br />
early 2012, there are at least 3 million electronic toll tags <strong>in</strong> the Houston region.<br />
Houston TranStar’s Bluetooth-based arterial street monitor<strong>in</strong>g system has been operational on<br />
several streets s<strong>in</strong>ce 2010, and is quickly expand<strong>in</strong>g <strong>in</strong> the arterial street network <strong>in</strong> West<br />
Houston. The Bluetooth-based travel times are <strong>in</strong>cluded <strong>in</strong> publicly available traveler <strong>in</strong>formation<br />
<strong>in</strong> the Houston region.<br />
<strong>Evaluation</strong> Parameters<br />
A total <strong>of</strong> 11 directional segments on US 290 and 18 directional segments on Westheimer Road<br />
(Figure 1) were used to assess <strong>TomTom</strong> <strong>data</strong> accuracy. US 290 is a very congested freeway<br />
that is access-controlled. Westheimer Road is a major arterial street with coord<strong>in</strong>ated <strong>traffic</strong><br />
signal control, and extends from the develop<strong>in</strong>g areas <strong>of</strong> West Houston to the central bus<strong>in</strong>ess<br />
district.<br />
1 Version 1.0, June 2011, available at http://www.pooledfund.org/Document/<strong>Download</strong>/2543.<br />
2 I-‐95 Corridors Coalition’s evaluation methods and results available at<br />
http://www.i95coalition.org/i95/Projects/ProjectDatabase/tabid/120/agentType/View/PropertyID/107/Default.as<br />
px.<br />
1
The segmentation and respective lengths are as follows.<br />
US 290 Eastbound:<br />
1. Barker-Cypress to FM 1960, 4.05 miles<br />
2. FM 1960 to Sam Houston Tollway, 5.10 miles<br />
3. Sam Houston Tollway to Fairbanks-N. Houston, 1.55 miles<br />
4. Fairbanks-N. Houston to P<strong>in</strong>emont, 2.90 miles<br />
5. P<strong>in</strong>emont to West 34 th Street, 2.45 miles<br />
6. West 34 th Street to Dacoma, 1.10 miles<br />
US 290 Westbound:<br />
7. Dacoma to West 34 th Street, 1.10 miles<br />
8. West 34 th Street to P<strong>in</strong>emont, 2.45 miles<br />
9. P<strong>in</strong>emont to Fairbanks-N. Houston, 2.90 miles<br />
10. Fairbanks-N. Houston to Sam Houston Tollway, 1.55 miles<br />
11. Sam Houston Tollway to FM 1960, 4.25 miles<br />
Westheimer Rd Eastbound:<br />
1. SH 6 to Eldridge, 1.2 miles<br />
2. Eldridge to Dairy Ashford, 1.1 miles<br />
3. Dairy Ashford to Kirkwood, 1.0 mile<br />
4. Kirkwood to Wilcrest, 1.0 mile<br />
5. Wilcrest to Gessner, 2.0 miles<br />
6. Gessner to Fondren, 1.1 miles<br />
7. Fondren to Hillcr<strong>of</strong>t, 1.2 miles<br />
8. Hillcr<strong>of</strong>t to Chimney Rock, 1.5 miles<br />
9. Chimney Rock to Post Oak, 1.0 mile<br />
Westheimer Rd Westbound:<br />
10. Post Oak to Chimney Rock, 1.0 mile<br />
11. Chimney Rock to Hillcr<strong>of</strong>t, 1.5 miles<br />
12. Hillcr<strong>of</strong>t to Fondren, 1.2 miles<br />
13. Fondren to Gessner, 1.1 miles<br />
14. Gessner to Wilcrest, 2.0 miles<br />
15. Wilcrest to Kirkwood, 1.0 mile<br />
16. Kirkwood to Dairy Ashford, 1.0 mile<br />
17. Dairy Ashford to Eldridge, 1.1 miles<br />
18. Eldridge to SH 6, 1.2 miles<br />
2
Figure 1. Roadway Segments Included <strong>in</strong> <strong>TomTom</strong> Historical Data <strong>Evaluation</strong><br />
Average annual hourly day-<strong>of</strong>-week speeds and travel times were evaluated for calendar year<br />
2010. That is, all Mondays <strong>in</strong> 2010 from 5 am to 6 am were grouped together for an average<br />
statistic, and so forth for all days <strong>of</strong> the week for all 11 directional freeway segments and 18<br />
direction street segments. Comparisons <strong>of</strong> <strong>TomTom</strong> <strong>data</strong> were made to the accuracy<br />
benchmark only between 5 am and 8 pm, when the toll tag and Bluetooth monitor<strong>in</strong>g systems<br />
have large samples sizes (i.e., an average <strong>of</strong> 4 tag-equipped vehicles every m<strong>in</strong>ute) with high<br />
degrees <strong>of</strong> confidence. Therefore, for each directional segment, 105 comparisons were made<br />
(i.e., 15 hours × 7 days <strong>of</strong> the week).<br />
The primary measure <strong>of</strong> accuracy used <strong>in</strong> the evaluation was the average absolute error <strong>of</strong><br />
travel speed (Equation 1). The average absolute error is a simple accuracy measure that is<br />
easy to calculate and easy to understand. Average absolute error conveys the average<br />
magnitude <strong>of</strong> the error (<strong>in</strong> mph), regardless <strong>of</strong> whether the error is positive or negative.<br />
However, the average absolute error does not <strong>in</strong>dicate if there is a consistent negative or<br />
positive bias.<br />
Equation 1
The benchmark <strong>data</strong> was based on the most detailed segmentation possible given the exist<strong>in</strong>g<br />
<strong>in</strong>stalled roadside tag and Bluetooth readers. TTI provided <strong>TomTom</strong> with exact location <strong>of</strong><br />
segment endpo<strong>in</strong>ts, and <strong>TomTom</strong> comb<strong>in</strong>ed their network segmentation to match the toll tag<br />
and Bluetooth-based segmentation. The <strong>historical</strong> average travel time and speeds provided by<br />
<strong>TomTom</strong> were ready for comparison to toll tag and Bluetooth-based average speeds.<br />
Additionally, the harmonic mean speed was calculated for benchmark <strong>data</strong>, as the <strong>TomTom</strong><br />
travel times are also based upon harmonic mean speed calculations.<br />
To assess the quality <strong>of</strong> travel speed <strong>data</strong> <strong>in</strong> different <strong>traffic</strong> conditions, the average absolute<br />
error on US 290 (i.e., freeway) was calculated for these 4 speed ranges:<br />
1. 0-30 mph<br />
2. 31-45 mph<br />
3. 46-60 mph<br />
4. Greater than 60 mph<br />
S<strong>in</strong>ce Westheimer Road is an arterial street and operates <strong>in</strong> a slower speed range, the average<br />
absolute error was calculated for these 3 speed ranges:<br />
1. 0-15 mph<br />
2. 16-30 mph<br />
3. 31-45 mph<br />
<strong>Evaluation</strong> Results<br />
Tabular results <strong>of</strong> the comparison are shown <strong>in</strong> Table 1 (US 290) and Table 2(Westheimer<br />
Road). The results are shown visually <strong>in</strong> Figures 2 through 29, and demonstrate how closely the<br />
<strong>TomTom</strong> <strong>historical</strong> <strong>data</strong> tracks the toll tag and Bluetooth-based benchmark.<br />
For US 290 (i.e., heavily congested freeway), the results <strong>in</strong>dicate that average absolute error<br />
was less than 5 mph on 10 <strong>of</strong> the 11 directional freeway segments. This was the case for all<br />
speed ranges; <strong>in</strong> fact, the error at the slowest speed category (less than 30 mph) was<br />
comparable to the error at free-flow speeds (i.e., 2.7 mph versus 2.2 mph).<br />
For Westheimer Road (i.e., major arterial street), the results <strong>in</strong>dicate that average absolute error<br />
was greater than on US 290, but was less than 8 mph on 17 <strong>of</strong> the 18 directional segments. The<br />
highest error (5.4 mph) was <strong>in</strong> the highest speed category, 31 to 45 mph.<br />
4
Table 1. Summary <strong>of</strong> Average Absolute Error for <strong>TomTom</strong> Historical Speed Data:<br />
US 290 (Freeway with Access Control)<br />
Error (<strong>in</strong> mph) for Benchmark Speed<br />
Category<br />
0-30 31-45 46-60<br />
Direction Orig<strong>in</strong> Dest<strong>in</strong>ation mph mph mph >60 mph<br />
EB Barker Cypress FM 1960 1.7 1.4 4.0 1.2<br />
EB FM 1960 S. Houston Tollway 2.2 2.4 4.3 2.9<br />
EB S. Houston Tollway Fairbanks-N<br />
Houston<br />
1.8 1.5 1.2 0.8<br />
EB Fairbanks-N<br />
Houston<br />
P<strong>in</strong>emont 0.8 1.4 1.7<br />
EB P<strong>in</strong>emont W 34th 1.7 2.1 1.5 1.6<br />
EB W 34th Dacoma Rd 5.0 6.9 1.9 1.2<br />
WB Dacoma Rd W 34th 4.6 2.1 1.4<br />
WB W 34th P<strong>in</strong>emont 3.4 4.1 1.7 1.9<br />
WB P<strong>in</strong>emont Fairbanks-N<br />
Houston<br />
2.2 3.8 1.4 2.8<br />
WB Fairbanks-N<br />
Houston<br />
S. Houston Tollway 3.4 4.0 1.5 2.9<br />
WB S. Houston Tollway FM 1960 1.5 3.8 1.3 4.1<br />
Average for all l<strong>in</strong>ks 2.7 3.4 1.6 2.2<br />
Note: A blank cell <strong>in</strong>dicates that no comparisons were possible <strong>in</strong> that speed category.<br />
Table 2. Summary <strong>of</strong> Average Absolute Error for <strong>TomTom</strong> Historical Speed Data:<br />
Westheimer Road (Major Arterial Street with Coord<strong>in</strong>ated Traffic Signal Control)<br />
Error (<strong>in</strong> mph) for Benchmark Speed<br />
Category<br />
Direction Orig<strong>in</strong> Dest<strong>in</strong>ation 0-15 mph 16-30 mph 31-45 mph<br />
EB SH 6 Eldridge 4.2 5.2<br />
EB Eldridge Dairy Ashford 5.1<br />
EB Dairy Ashford Kirkwood 3.2 2.6<br />
EB Kirkwood Wilcrest 4.2 5.2<br />
EB Wilcrest Gessner 5.7 7.4<br />
EB Gessner Fondren 2.0 4.2<br />
EB Fondren Hillcr<strong>of</strong>t 1.4 3.7<br />
EB Hillcr<strong>of</strong>t Chimney Rock 2.6 3.5<br />
EB Chimney Rock Post Oak 1.3 4.2 6.5<br />
WB Post Oak Chimney Rock 2.4 4.0 12.5<br />
WB Chimney Rock Hillcr<strong>of</strong>t 0.8 3.7 7.4<br />
WB Hillcr<strong>of</strong>t Fondren 4.2 4.9<br />
WB Fondren Gessner 2.3 3.9<br />
WB Gessner Wilcrest 3.6 3.8<br />
WB Wilcrest Kirkwood 4.1 5.7<br />
WB Kirkwood Dairy Ashford 1.0 4.0 5.2<br />
WB Dairy Ashford Eldridge 3.2 4.8<br />
WB Eldridge SH 6 5.0 7.8<br />
Average for all l<strong>in</strong>ks 1.3 3.5 5.4<br />
Note: A blank cell <strong>in</strong>dicates that no comparisons were possible <strong>in</strong> that speed category.<br />
5
Figure 2<br />
Figure 3<br />
7
Figure 4<br />
Figure 5<br />
8
Figure 6<br />
Figure 7<br />
9
Figure 8<br />
Figure 9<br />
10
Figure 10<br />
Figure 11<br />
11
Figure 12<br />
Figure 13<br />
12
Figure 14<br />
Figure 15<br />
13
Figure 16<br />
Figure 17<br />
14
Figure 18<br />
Figure 19<br />
15
Figure 20<br />
Figure 21<br />
16
Figure 22<br />
Figure 23<br />
17
Figure 24<br />
Figure 25<br />
18
Figure 26<br />
Figure 27<br />
19
Figure 28<br />
Figure 29<br />
20


