Analysis Of Efficiency On The Regulated Transportation Coach
Analysis Of Efficiency On The Regulated Transportation Coach
Analysis Of Efficiency On The Regulated Transportation Coach

Create successful ePaper yourself
Turn your PDF publications into a flip-book with our unique Google optimized e-Paper software.
ANALYSIS OF EFFICIENCY ON THE REGULATED TRANSPORTATION COACH<br />
OPERATOR BY STOCHASTIC FRONTIER OF COBB-DOUGLAS AND TRANSLOG<br />
FUNCTIONS: THE CASE OF THE INTERSTATE PASSENGER COACH<br />
TRANSPORTATION IN BRAZIL.<br />
(MARTINS, Francisco Giusepe Donato; SILVA, Francisco Gildemir Ferreira; ROCHA, Carlos<br />
Henrique; QUEIROZ, Marcelo Pereira; ARAÚJO, Carlos Eduardo Freire)<br />
ANALYSIS OF EFFICIENCY ON THE<br />
REGULATED TRANSPORTATION COACH<br />
OPERATOR BY STOCHASTIC FRONTIER<br />
OF COBB-DOUGLAS AND TRANSLOG<br />
FUNCTIONS: THE CASE OF THE<br />
INTERSTATE PASSENGER COACH<br />
TRANSPORTATION IN BRAZIL.<br />
Francisco Giusepe Donato Martins, MSc.<br />
Tribunal de Contas da União – TCU, Brasil, franciscogd@tcu.gov.br<br />
Francisco Gildemir Ferreira da Silva, MSc.<br />
Universidade Federal do Ceará – CAEN, Brasil, gildemir@gmail.com<br />
Carlos Henrique Rocha, PhD<br />
Universidade de Brasília-UnB, Brasil, chrocha@unb.br<br />
Marcelo Pereira Queiroz, MSc.<br />
Universidade de Brasília-UnB, Brasil, marcpq@gmail.com<br />
Carlos Eduardo Freire Araújo, MSc.<br />
MKMBr Engenharia Ambiental Ltda., Brasil, eduardo1404@yahoo.com<br />
ABSTRACT<br />
<strong>The</strong> theme about efficiency and productivity of companies that act in regulated industries<br />
have been extensively discussed in literature. In Brazil, there are just a few studies about the<br />
analysis of efficiency and productivity of interstate passenger coach transportation (TRIP). In<br />
this sense, this paper has three main objectives: to choose between the Cobb-Douglas and<br />
Translog functions which is the best function to measure the technical efficiency on TRIP for<br />
the period of 2004-2006; to compare the efficiency scores among the companies of TRIP;<br />
and to make an analysis of the efficiency dynamic on TRIP and the factors that contributed<br />
for the gains and losses of the efficiency. <strong>The</strong> results indicate a loss of efficiency during the<br />
years analyzed and this loss is probably due to the expansion of the capacity installed by<br />
12 th WCTR, July 11-15, 2010 – Lisbon, Portugal
ANALYSIS OF EFFICIENCY ON THE REGULATED TRANSPORTATION COACH<br />
OPERATOR BY STOCHASTIC FRONTIER OF COBB-DOUGLAS AND TRANSLOG<br />
FUNCTIONS: THE CASE OF THE INTERSTATE PASSENGER COACH<br />
TRANSPORTATION IN BRAZIL.<br />
(MARTINS, Francisco Giusepe Donato; SILVA, Francisco Gildemir Ferreira; ROCHA, Carlos<br />
Henrique; QUEIROZ, Marcelo Pereira; ARAÚJO, Carlos Eduardo Freire)<br />
acquisition of new buses. <strong>On</strong> the other hand, the concern of the operators with the fuel<br />
consumption is latent and a possible source of efficiency gains. <strong>The</strong>re had been changes in<br />
positions of companies during the years, what suggests a strategic behavior in terms of a<br />
possible competitiveness of companies. <strong>The</strong> suggestions are made with the objective to<br />
improve the model, to treat the possible problem of multicollinearity and to analyze the<br />
strategic behavior among companies in specific transportation lines.<br />
Keywords: regulated industries; estimation of efficiency; stochastic frontier; cobb-douglas<br />
function; translog function; transportation coach operator.<br />
1. INTRODUCTION<br />
<strong>Transportation</strong> is essential to the production, to the spatial distribution and to the<br />
consumption of goods and services, apart from being an important instrument of distribution<br />
of incomes and interstate and national integration (Kawamoto, 1994). A transportation<br />
system can be defined, in economic terms, as an set of productive factors (inputs) that<br />
interact with each other to generate a determined result (outputs), like noise, trips, tones<br />
transported, distance covered, or simply the dislocation of people and goods. In this sense,<br />
the transportation system can be studied as a production function that relates the inputs and<br />
products, being considerated the technological and operational specifications, with the<br />
purpose of permitting the evaluation of the reached productivity level. As a rule, an explicit<br />
mathematical expression is adopted, among many functions, to represent the production<br />
bound, being this function adjusted through statistic techniques, in a way to estimate the<br />
efficiency bound.<br />
<strong>The</strong> parametric approach of stochastic bound consists basically in overcoming the<br />
deterministic bounds restrictions, through variables that capture the technical inefficiency of<br />
the firms control (Aigner e Chu, 1968; Meeusen e Van Den Broecker, 1977). <strong>The</strong>re are two<br />
important preliminary stages in applying a parametric method in productivity studies. <strong>The</strong><br />
first concerns to the choice of the mathematical expression of production. <strong>The</strong> second refers<br />
to the vectors of incomes and outcomes.<br />
Concerning the production function, the Cobb-Doulgas type is largely used, because the<br />
simplicity of being linearized with the application of logarithms and its success in the<br />
estimation of American productions relations. Other function mainly applied in system<br />
transportation studies is the Translog function. <strong>The</strong> main difference between the Cobb-<br />
Douglas and Translog production functions is the functional form, specially Translog, which<br />
permits a larger flexibility that can conduct to more realistic efficiency scores in relation to the<br />
Cobb-Douglas model. In case the second form is statistically equivalent to the first one, then<br />
the resulting gains of the estimation justify the utilization of the Translog function to analyze<br />
the efficiency.<br />
<strong>The</strong> theme about efficiency and productivity of companies that act in regulated industries<br />
have been extensively discussed in literature. <strong>The</strong> approach is also vast and diversified in<br />
terms of methodology adopted for analysis of efficiency and productivity (Coelli et al., 2003),<br />
with applications in realization of transportation public services of passengers by bus. <strong>The</strong><br />
studies are extremely rich, highlighting in the case of the transportation of passengers by<br />
12 th WCTR, July 11-15, 2010 – Lisbon, Portugal
ANALYSIS OF EFFICIENCY ON THE REGULATED TRANSPORTATION COACH<br />
OPERATOR BY STOCHASTIC FRONTIER OF COBB-DOUGLAS AND TRANSLOG<br />
FUNCTIONS: THE CASE OF THE INTERSTATE PASSENGER COACH<br />
TRANSPORTATION IN BRAZIL.<br />
(MARTINS, Francisco Giusepe Donato; SILVA, Francisco Gildemir Ferreira; ROCHA, Carlos<br />
Henrique; QUEIROZ, Marcelo Pereira; ARAÚJO, Carlos Eduardo Freire)<br />
bus: Merewitz (1977); Else (1985); Obeng (1985); Hensher (1987); White et al. (1992);<br />
Holvad et al. (2004).<br />
<strong>The</strong>re are few studies in Brazil about the analysis of efficiency and productivity of the<br />
interstate passenger coach transportation, like the studies of Novaes e Medeiros (2008) and<br />
of Araújo, Martins and Silva (2008).<br />
This paper has three main objectives. <strong>The</strong> first is to choose between the Cobb-Douglas and<br />
Translog functions, for the period of 2004-2006, which is the best function to measure the<br />
technical efficiency of companies that act in TRIP, using the parametric method of stochastic<br />
bound estimation. <strong>The</strong> second objective is to compare the efficiency scores among the TRIP<br />
companies, observing the dynamic of these scores during the years. <strong>The</strong> last objective is to<br />
make an analysis of the efficiency dynamic in TRIP and the factors that contributed for the<br />
gains and losses of efficiency.<br />
<strong>The</strong> choice of the parametric models Cobb-Douglas and Translog will be based on the<br />
Hausman (1978) test. <strong>The</strong> selected period involves 159 buses companies that operate only<br />
in Brazilian interstate routes with journeys over 75 km. <strong>The</strong> information related to the<br />
production of the TRIP service were obtained in the electronic address of National Agency pf<br />
Overland <strong>Transportation</strong>(ANTT) and they are allocated by lines and companies, in a way to<br />
permit the aggregation of information in business level.<br />
For this, the present research was divided into six sections considering this introduction. <strong>The</strong><br />
second section is a brief summary of concepts, properties and application to transportation<br />
systems of production functions. <strong>The</strong> third section shows a resume of the quantitative<br />
parametric techniques to measure the efficiency with the economic theory, specifically the<br />
Cobb-Doulgas and Translog functions. <strong>The</strong> fourth section presents the adopted models and<br />
describes the main characteristics of the variables used according the obtained information.<br />
<strong>The</strong> fifth section presents the methodology, application and results and the differences of the<br />
followed approaches. Finally, on the sixth and last section the final considerations are<br />
presented.<br />
2. PRODUCTION FUNCTIONS: CONCEPTS, PROPERTIES<br />
AND APPLICATION TO TRANSPORT SYSTEMS.<br />
<strong>On</strong> this section, concepts and properties of production functions and their application to<br />
transportation systems are discussed.<br />
2.1 Production function: concepts, characteristics and properties.<br />
Production function is a term used to express the relation existent between the productive<br />
factors (natural resources, labor, capital, technology, business talent, etc) of a firm and the<br />
quantity of possessions and services produced in a determined period of time (Thompson &<br />
Formby, 2003). <strong>The</strong> production function, according to Samuelson e Nordhaus (1993), is the<br />
12 th WCTR, July 11-15, 2010 – Lisbon, Portugal
ANALYSIS OF EFFICIENCY ON THE REGULATED TRANSPORTATION COACH<br />
OPERATOR BY STOCHASTIC FRONTIER OF COBB-DOUGLAS AND TRANSLOG<br />
FUNCTIONS: THE CASE OF THE INTERSTATE PASSENGER COACH<br />
TRANSPORTATION IN BRAZIL.<br />
(MARTINS, Francisco Giusepe Donato; SILVA, Francisco Gildemir Ferreira; ROCHA, Carlos<br />
Henrique; QUEIROZ, Marcelo Pereira; ARAÚJO, Carlos Eduardo Freire)<br />
relation between the maximum quantity of production that can be produced and the<br />
production factors needed to make such production taking into consideration a certain<br />
technological level. <strong>The</strong> production function can be represented by equation 1.<br />
y<br />
f (x)<br />
Where x represents the quantity of inputs and y indicates the reached production in a<br />
determined period of time, from the used technology. <strong>The</strong> evaluation of the production<br />
function of one company permits a definition of the technical possibilities of production and<br />
the analysis of three important concepts: full product; medium; and marginal. <strong>The</strong> full product<br />
determines the total quantity of the product in physic units, therefore, y . <strong>The</strong> medium<br />
product corresponds to the reason between the full product and the total quantity of<br />
y f ( x)<br />
production factors, therefore,<br />
. <strong>The</strong> marginal product is equivalent to the<br />
x x<br />
additional product of a production factor, maintained the other constant factors,<br />
dy df ( x)<br />
mathematically expressed by<br />
(Samuelson e Nordhaus, 1993).<br />
dx dx<br />
A relevant characteristic concerns the returns of scale that reflect the answer of the full<br />
product when all the productive factors proportionally increase. According to Samuelson and<br />
Nordhaus (1993), the production can be increasing returns, decreasing or constant in scale<br />
when a proportional increase in all productive factors takes to an increase more than<br />
proportional, less than proportional or equally proportional of production, respectively. When<br />
the function is known, we can optimize the usage of productive factors and the acquisition of<br />
scale economies, in a way to guarantee the maximum economic efficiency in production.<br />
2.2 Inherent Economic <strong>Efficiency</strong> Concepts<br />
<strong>The</strong> evaluation of the economic efficiency, with allocative, distributive and productive origins,<br />
has been concentrated in static aspects. This has conducted to a wider analysis from the<br />
concept of dynamic efficiency that embraces investments and capacity of technological<br />
innovation and not only the temporal course conditions or the criteria of allocative efficiency<br />
of Pareto that has great choice between allocations of limited resources to technologies and<br />
institutions roles. Under this scope, the term productivity appears and presents, according to<br />
Coelli et al. (1997), several tunes in its measuring form, which requires, therefore, a<br />
description of commonly used definitions, as: productivity; technical efficiency; allocative<br />
efficiency; technical changes; scale economies; Total Factor Productivity (TFP); production<br />
bound; feasible set of production.<br />
Productivity is defined as a relation between the produced and the necessary inputs for the<br />
production. In the case of multiple inputs and products, the productivity concept is equivalent<br />
to TFP. <strong>The</strong> production bound represents the maximum production to each input level and<br />
reflects the state of the industry technology. Notice that the production bound guards a<br />
narrow relation with the definition of the production function. <strong>The</strong> company is technically<br />
efficient if it is on the production bound, and it is inefficient if it is bellow the curve. Every<br />
point below the curve are feasible because, it can be produced if given an input combination,<br />
12 th WCTR, July 11-15, 2010 – Lisbon, Portugal<br />
(1)
ANALYSIS OF EFFICIENCY ON THE REGULATED TRANSPORTATION COACH<br />
OPERATOR BY STOCHASTIC FRONTIER OF COBB-DOUGLAS AND TRANSLOG<br />
FUNCTIONS: THE CASE OF THE INTERSTATE PASSENGER COACH<br />
TRANSPORTATION IN BRAZIL.<br />
(MARTINS, Francisco Giusepe Donato; SILVA, Francisco Gildemir Ferreira; ROCHA, Carlos<br />
Henrique; QUEIROZ, Marcelo Pereira; ARAÚJO, Carlos Eduardo Freire)<br />
nevertheless, above the curve it cannot produce with the relative input because it would<br />
overtake the industry production bound.<br />
<strong>The</strong> time passage implies a change or a dislocation of the production bound with an<br />
enlargement or reduction of the production ensemble. According to Coelli et al. (1997), the<br />
productivity growth is a consequence of the improvements in efficiency via technical<br />
changes or scale economies, which can also be the result of a combination among these<br />
factors.<br />
2.3 <strong>The</strong> Tooling of the <strong>Analysis</strong> of Productive <strong>Efficiency</strong><br />
<strong>The</strong> techniques used to measure productive efficiency must simulate the behavior described<br />
on the previous section. From the computational methods, econometric models of production<br />
functions and stochastic frontiers can be highlighted.<br />
2.3.1 Econometric models<br />
In the econometric approach, we estimate parameters that are be able to approximate a<br />
sample to a mathematical function and an arbitrary component and whose parameters are<br />
not influenced and efficient from the statistic point of view (Gujarati, 2000; e Pindyck e<br />
Rubinfield, 2004). This approach is called parametric. <strong>The</strong> estimated function is defined<br />
based on the economic theory of production. Generally, a Cobb-Douglas function is used,<br />
but there are more general functions like: CES and Translog. <strong>The</strong> advantage of the<br />
econometric estimations is the possibility of testing the parameters’ behavior, so that we can<br />
obtain answers related to the scale gains (identification and level), the production input<br />
relevance, the technological changes, among others. <strong>The</strong> disadvantage is the necessity of<br />
having big samples and with the minimum measure mistakes, because, as the method being<br />
parametric, it should test the statistic validation of the parameters.<br />
2.3.2 Stochastic Frontier<br />
<strong>The</strong> stochastic frontier can be used as an alternative method to estimate bound functions.<br />
<strong>The</strong> first one is a parametric method proposed by Aigner et al. (1977) and Meeusen and Van<br />
den Broeck (1977), concomitantly, and it consists in a regression where the production value<br />
is limited by the arbitrary variable (exp(xi+vi)). <strong>The</strong> expression exp(xi) is the production<br />
function itself and vi is a idiosyncratic term with 0 average and variance σ.<br />
Indeed, the stochastic frontier is an econometric estimation of production function, but the<br />
interest lies on the mistake. It translates the inefficiency of the company in case the<br />
functional form adopted is the most correct. In the end, we have he inefficiency score and it<br />
can be obtained indicatives of scale returns and full, medium and marginal products, and<br />
also marginal rates of substitution.<br />
12 th WCTR, July 11-15, 2010 – Lisbon, Portugal
ANALYSIS OF EFFICIENCY ON THE REGULATED TRANSPORTATION COACH<br />
OPERATOR BY STOCHASTIC FRONTIER OF COBB-DOUGLAS AND TRANSLOG<br />
FUNCTIONS: THE CASE OF THE INTERSTATE PASSENGER COACH<br />
TRANSPORTATION IN BRAZIL.<br />
(MARTINS, Francisco Giusepe Donato; SILVA, Francisco Gildemir Ferreira; ROCHA, Carlos<br />
Henrique; QUEIROZ, Marcelo Pereira; ARAÚJO, Carlos Eduardo Freire)<br />
2.4 Application of Production Functions to <strong>Transportation</strong> Systems<br />
<strong>The</strong> production of any transportation activity requires a combination of different productive<br />
factors (inputs: vehicles; equipments; labor; fuel; turnpikes; containers; terminals; roads,<br />
installations; among others), in function of a determined technology, with the intention of<br />
generate a result (outputs) that can be measured by distinct ways: trips; traveled distance in<br />
kilometers; transported passengers; passengers-kilometers transported; transported tones;<br />
offered seats; number of bustled containers; number of equivalent vehicles; among others.<br />
<strong>The</strong> transportation service production from the technological relation can be represented by<br />
equation 2.<br />
y f ( K,<br />
E,<br />
L,<br />
F,<br />
N,<br />
t)<br />
(2)<br />
Where y corresponds to the maximum quantity of transportation that can be produced,<br />
taking into consideration the required quality and the adopted technology by each reference<br />
time unit; K is equivalent to infrastructure units; E refers to equipments or main and<br />
complementary vehicles; L is labor; F is the fuel used for the activity of the vehicles; N other<br />
relevant things like installation, ground, air or sea space usage; and t is the users time of<br />
transportation services (Rus, Campos, Nombela, 2003).<br />
In the transportation service production, the production unit is essential due to the possible<br />
different units, specially when the production function is adopted as a base to determinate<br />
costs, in a way that convenient units should be used to express input quantity, like: t (tonne);<br />
km (kilometer); number of vehicles (Kawamoto, 1994). Anyway, according to this author,<br />
none of these units used in isolation is sufficient to represent the variety of inputs involved in<br />
transportation production. In order to overcome these problems, units that represent a set of<br />
inputs are adopted, for the purpose of obtaining a production function that relates the<br />
quantity of offered service and necessary inputs with reasonable accuracy.<br />
To know if the period of reference analysis is short or long term is also important. This is why<br />
in short-term some productive factors are going to be submitted to restrictions that stop their<br />
substitution easily being treated as steady factors, for example, the size of the vehicles in<br />
providing transportation services of passengers. Notice that in order to attend a development<br />
of request, the passengers’ transportation companies by bus or by plane may have to<br />
incorporate to the fleet a complete vehicle that will not be necessarily fully occupied. <strong>On</strong> the<br />
other hand, there are no steady factors in long term. According to the period of analysis, the<br />
properties of the production function are distinct.<br />
Other relevant aspect is the possibility of multiple productions in transportation, in a way that<br />
the combination of productive factors generates not only one product, but several different<br />
products. In the case of passengers’ transportation service, it can be relevant to the analysis<br />
the consideration of each service and the different routes, in function of the pairs of the origin<br />
and destine cities. This procedure favors the evaluation of possible relations of<br />
complementarity and substitutability between inputs and products, which do not appear<br />
when the unique production factories are taken into consideration.<br />
<strong>The</strong> concepts of economic efficiency and productivity in transportation are directly related to<br />
the production function. <strong>The</strong> terms technical efficiency and productive efficiency refer to the<br />
fact of a company choosing the minimum quantities of productive factors to obtain the<br />
12 th WCTR, July 11-15, 2010 – Lisbon, Portugal
ANALYSIS OF EFFICIENCY ON THE REGULATED TRANSPORTATION COACH<br />
OPERATOR BY STOCHASTIC FRONTIER OF COBB-DOUGLAS AND TRANSLOG<br />
FUNCTIONS: THE CASE OF THE INTERSTATE PASSENGER COACH<br />
TRANSPORTATION IN BRAZIL.<br />
(MARTINS, Francisco Giusepe Donato; SILVA, Francisco Gildemir Ferreira; ROCHA, Carlos<br />
Henrique; QUEIROZ, Marcelo Pereira; ARAÚJO, Carlos Eduardo Freire)<br />
produced quantity, in a way that in this case all the points in an isoquant curve are efficient<br />
solutions, while the definition of economic efficiency considers only one of the points in an<br />
isoquant curve like being the great combination of productive factors (Rus, Campos,<br />
Nombela, 2003). Having in mind these efficiency concepts, the production function can be<br />
represented to a passengers’ transportation service company, according to equation 3.<br />
y f ( K,<br />
L)<br />
(3)<br />
Where y corresponds to the maximum efficient quantity of transportation that can be<br />
produced; K is equivalent to the capital productive factor, represented by vehicles (buses);<br />
and L refers to the labor factor, represented, for example by the motorists.<br />
<strong>The</strong> term productivity in transportation activities refers generally to indicators that measure<br />
the average productivity of the variable productive factors, in a way that the difference<br />
between efficiency and partial measures of average productivity presents a bigger evidence<br />
when a total production function in short term is used (Rus, Campos, Nombela, 2003),<br />
similar to the equation 3. According to these authors, the Cobb-Douglas function can be<br />
adopted as very dynamic production function in the general case of unique product<br />
companies with several inputs, while the Translog function is relevant in empiric analysis due<br />
to the multiple product character of the activity of many companies, expressed by the<br />
different interactions among inputs.<br />
3. PARAMETRIC QUANTITATIVE TECHNIQUES: COBB-<br />
DOUGLAS AND TRANSLOG<br />
<strong>The</strong> production function Cobb-Douglas is largely used, because of its simplicity in being<br />
linearized with the logarithm application, being expressed by the equation 4:<br />
k<br />
k y A x exp( )<br />
(4)<br />
i<br />
k<br />
1<br />
ik<br />
Where i y is the vector of firm products, x<br />
k corresponds to the input vector, A e k represent<br />
ik<br />
the parameters to be estimated and i is the mistake-term. In other words, parameter A<br />
measures the production scale, while the parameters measure how the quantity of<br />
k<br />
production interacts to the input variations (Varian, 2003). According to this author, the<br />
relation between the parameters, two by two, allows a definition of a technical rate of<br />
substitution (TTS) between two production factors, that is to say to predict the rate that the<br />
companies must substitute one input for another to maintain a constant production.<br />
<strong>The</strong>refore, we have an assumption associated to technology that is in the same way we<br />
increase the quantity of factor 1 and adjust factor 2 to stay in the same isoquant, the TTS<br />
reduces (Varian, 2003). <strong>The</strong> TTS of factor 1 by factor 2 is given by the equation 5 (Coelli et<br />
al, 2003).<br />
12 th WCTR, July 11-15, 2010 – Lisbon, Portugal<br />
i
ANALYSIS OF EFFICIENCY ON THE REGULATED TRANSPORTATION COACH<br />
OPERATOR BY STOCHASTIC FRONTIER OF COBB-DOUGLAS AND TRANSLOG<br />
FUNCTIONS: THE CASE OF THE INTERSTATE PASSENGER COACH<br />
TRANSPORTATION IN BRAZIL.<br />
(MARTINS, Francisco Giusepe Donato; SILVA, Francisco Gildemir Ferreira; ROCHA, Carlos<br />
Henrique; QUEIROZ, Marcelo Pereira; ARAÚJO, Carlos Eduardo Freire)<br />
du<br />
u<br />
d(<br />
f1/<br />
f2)<br />
( f1/<br />
f2)<br />
Functionally, the Cobb-Douglas function is very restrictive due to its mathematical properties:<br />
homogeneity of level 1; homogeneous marginal productivity of level 0, in other words, each<br />
input receives the value of its marginal product; way of expansion of linear production; the<br />
production is exhausted. Because it is a restrictive function, the mathematical treatment is<br />
easy, including for linearization.<br />
Another very applied function in transportation system studies is the transcendental<br />
logarithmic function (Translog), presented by Christensen, Jorgenson and Lau (1973) and<br />
represented by the equation 6 by a succession of expansion of Taylor of second order of<br />
ln y in powers of i x ln :<br />
n<br />
n n<br />
ln y<br />
x<br />
1<br />
0 i ln i<br />
ij ln xi<br />
ln x j i<br />
(6)<br />
2<br />
i 1 i 1 j 1<br />
Where y is the products of firm vector, x corresponds to the input vector, i represents the<br />
parameter to be estimated, with ij = ji , and i<br />
is the mistake-term.<br />
<strong>The</strong> Translog function, according to Albuguergue (1985), is linear, has minimum quantities of<br />
parameters and does not impose separability and homogeneity as hypotheses, which allows<br />
establishing arbitrary values to the elasticity of substitution between any pair of inputs.<br />
<strong>The</strong>refore, differently of the Cobb-Douglas function, the Translog function is more flexible,<br />
not being homogeneous and reducing to a Cobb-Douglas function if ij =0 e i >0. Besides<br />
that, econometrically, the term i varies to different values of input. <strong>The</strong> disadvantage of the<br />
Translog function is its mathematic difficult to manipulate and the possibility, on<br />
econometrical estimations, of generating multicollinearity.<br />
Concerning to the grade of homogeneity (r) of production functions and gains of scale, it can<br />
be obtained three situations: if r > 1, the function generates returns of crescent scales; if r =<br />
1, there is constant return of scale; and if r < 1, there are decreasing returns of scale. In the<br />
case of the Cobb-Douglas function, it is a homogeneous function with r equivalent to the<br />
sum of parameters , while the elasticity of substitution is equal to the unit. <strong>The</strong> Translog<br />
function, though, is homogeneous of level r if n<br />
n<br />
i r and if ij 0 to i = 1, 2,..., n. (Coelli<br />
et al, 2003).<br />
i<br />
For the case of ij =0 and i >0, the Translog function represented by the equation 6<br />
reduces to the Cobb-Douglas function expressed by the equation 4. <strong>The</strong> main difference<br />
between the production functions Cobb-Douglas and Translog is that the first one adopts<br />
12 th WCTR, July 11-15, 2010 – Lisbon, Portugal<br />
1<br />
i<br />
1<br />
(5)
ANALYSIS OF EFFICIENCY ON THE REGULATED TRANSPORTATION COACH<br />
OPERATOR BY STOCHASTIC FRONTIER OF COBB-DOUGLAS AND TRANSLOG<br />
FUNCTIONS: THE CASE OF THE INTERSTATE PASSENGER COACH<br />
TRANSPORTATION IN BRAZIL.<br />
(MARTINS, Francisco Giusepe Donato; SILVA, Francisco Gildemir Ferreira; ROCHA, Carlos<br />
Henrique; QUEIROZ, Marcelo Pereira; ARAÚJO, Carlos Eduardo Freire)<br />
constant scale returns while the second allows a larger flexibility, what can conduct to more<br />
realistic efficiency scores to the ones obtained by the model Cobb-Douglas.<br />
4. APPLIED MODELS TO THE INTERSTATE PASSENGER<br />
COACH TRANSPORTATION BY BUS IN BRAZIL: FROM 2004<br />
TO 2006.<br />
<strong>The</strong> period of 2004-2006 involves 159 bus companies that operate only on interstate<br />
Brazilian routes with distance superior to 75 km. This information were obtained on the<br />
National Agency of Overland Transport (ANTT) homepage and they are related to the<br />
production of transported passengers (effective demand), passengers-kilometers, traveled<br />
distance in kilometers, fleet and quantity of drivers.<br />
<strong>The</strong> data of production are allocated by lines and companies, and they have been added on<br />
business level as an analysis object of productivity. According to the economy concepts<br />
applied to transportation (Hensher e Brewer, 2001; Rus, Campos e Nombela, 2003), the<br />
information referred to passengers-kilometers can be adopted as billing proxy; the data<br />
about traveled distance in kilometers, though, are a good approximation of fuel consumption,<br />
while fleet and drivers refer respectively to the capital invested and to the labor used.<br />
<strong>The</strong>re had been established two production functions, one of the Cobb-Douglas type, and<br />
the other of the Translog type. <strong>The</strong> Cobb-Douglas model is expressed on equation 7:<br />
ln PASS _ KM ln 0 1ln<br />
KM 2ln<br />
ONIBUS 3ln<br />
MO i<br />
(7)<br />
Where PASS_KM is equivalent to the yearly production of passengers-kilometers, KM<br />
represents the total mileage traveled yearly by the company’s fleet, ONIBUS corresponds to<br />
the quantity of the company’s buses or the firm’s fleet, MO is equivalent to the number of<br />
drivers and i is the mistake-term.<br />
<strong>The</strong> Translog model is the one represented by the equation 8:<br />
ln PASS _ KM ln 0 1ln<br />
KM 2ln<br />
ONIBUS 3ln<br />
MO<br />
2<br />
4(<br />
1<br />
2<br />
ln KM )<br />
2<br />
5(<br />
1<br />
2<br />
ln ONIBUS )<br />
2<br />
6(<br />
1<br />
2<br />
ln MO)<br />
7 ln KM ln ONIBUS 8 ln KM ln MO 9 ln ONIBUS ln MO i (8)<br />
12 th WCTR, July 11-15, 2010 – Lisbon, Portugal
ANALYSIS OF EFFICIENCY ON THE REGULATED TRANSPORTATION COACH<br />
OPERATOR BY STOCHASTIC FRONTIER OF COBB-DOUGLAS AND TRANSLOG<br />
FUNCTIONS: THE CASE OF THE INTERSTATE PASSENGER COACH<br />
TRANSPORTATION IN BRAZIL.<br />
(MARTINS, Francisco Giusepe Donato; SILVA, Francisco Gildemir Ferreira; ROCHA, Carlos<br />
Henrique; QUEIROZ, Marcelo Pereira; ARAÚJO, Carlos Eduardo Freire)<br />
Where PASS_KM is equivalent to the yearly production of passengers-kilometers, used in<br />
the model as annual billing proxy of each TRIP company; KM represents the total traveled<br />
mileage annually by the company’s fleet, serving as a consumption of fuel proxy; ONIBUS<br />
corresponds to the quantity of company’s buses, being adopted as the invested capital<br />
proxy; MO is equivalent to the number of drivers of each company, being used as labor<br />
proxy; and i is the mistake-term.<br />
Descriptive statistics of the variables referred to the 159 TRIP companies analyzed on this<br />
paper are represented on Table 1.<br />
Table 1 – Descriptive statistics of the variables adopted on the models Cobb-Douglas and Translog.<br />
Year Descriptive<br />
Variables<br />
Statistics<br />
Billing<br />
(passengers- Diesel consumption Invested<br />
kilometers): (traveled distance): capital (fleet): Labor: n.º<br />
pass-km<br />
km<br />
n.º buses drivers<br />
Total 24.041.551.986 1.250.063.329 10.811 18.715<br />
2004 Maximum 3.999.092.419 168.915.464 1.266 3.299<br />
Minimum 15.021 776 1 1<br />
Average 151.204.729 7.862.034 68 118<br />
SD 412.094.190 19.160.605 148 333<br />
Total 24.272.833.692 1.214.905.876 10.266 19.637<br />
2005 Maximum 3.701.558.037 145.630.148 1.063 3.018<br />
Minimum 11.933 776 1 1<br />
Average 152.659.331 7.640.917 65 124<br />
SD 401.057.467 17.431.370 140 338<br />
Total 22.844.340.782 1.211.393.572 11.260 18.543<br />
2006 Maximum 3.485.091.922 135.510.753 1.146 2.384<br />
Minimum 11.300 776 1 1<br />
Average 143.675.099 7.618.827 71 117<br />
SD 373.831.408 17.042.773 148 292<br />
SD= standard deviation. Each year has 159 observations concerning to the 159 companies.<br />
Despite of having huge disparity between the maximum values and the minimum of each<br />
variable used in the proposed models, we can consider that the production factors adopted<br />
by the firms are found in reasonable standards to be evaluated on the efficient production<br />
level. It can be noticed from Table 1 that the production level expressed by passengerskilometers<br />
in 2005 overcame the levels of 2004 and 2006.<br />
<strong>The</strong> movements of the explanatory variables were going in the way of a reduction of fuel<br />
consumption year by year, reduction of fleet from 2004 to 2005 and an increase from 2005<br />
to 2006, increasing and reduction of labor to the exercises 2004-2005 and 2005-2006,<br />
respectively. <strong>The</strong> behaviors suggest some mismatched information related to the distance<br />
traveled, however, it will neglect the possible mistake. <strong>The</strong>re may be occurred a scale gain<br />
with fleet expansion from 2005 to 2006, supplemented by the reduction of labor to the same<br />
period that we will check on the following results.<br />
12 th WCTR, July 11-15, 2010 – Lisbon, Portugal
ANALYSIS OF EFFICIENCY ON THE REGULATED TRANSPORTATION COACH<br />
OPERATOR BY STOCHASTIC FRONTIER OF COBB-DOUGLAS AND TRANSLOG<br />
FUNCTIONS: THE CASE OF THE INTERSTATE PASSENGER COACH<br />
TRANSPORTATION IN BRAZIL.<br />
(MARTINS, Francisco Giusepe Donato; SILVA, Francisco Gildemir Ferreira; ROCHA, Carlos<br />
Henrique; QUEIROZ, Marcelo Pereira; ARAÚJO, Carlos Eduardo Freire)<br />
5. METHODOLOGY AND RESULTS<br />
5.1 Estimation of Stochastic Frontier<br />
We used the STATA 10 software to adjust the production functions by the method of<br />
minimum squares, being analyzed, sequentially, the equivalence of the functions via<br />
Hausman’s test. <strong>The</strong> result referred to the year of 2004 is on Table 2.<br />
Table 2 – Result of the models for 2004<br />
With interception* Without interception**<br />
Parameters Translog Cobb-Douglas Translog Cobb-Douglas<br />
Coef P>t Coef P>t Coef P>t Coef P>t<br />
0 2,929 0,070 1,199 0,000<br />
1 0,163 0,838 0,969 0,000 1,599 0,000 1,219 0,000<br />
2 -1,224 0,221 0,029 0,630 -2,257 0,007 -0,067 0,266<br />
3 2,449 0,015 0,106 0,109 1,379 0,090 -0,064 0,278<br />
4 0,171 0,385 -0,173 0,003<br />
5 -0,087 0,709 -0,211 0,349<br />
6 0,047 0,886 -0,054 0,868<br />
7 0,207 0,351 0,453 0,012<br />
8 -0,395 0,069 -0,153 0,375<br />
9 0,074 0,728 -0,141 0,431<br />
ij<br />
0,017<br />
-0,279<br />
R² Ajustado 0,9473 0,9448 0,9993 0,9992<br />
* Hausman’s test: chi2(3) = 6.75 Prob>chi2 = 0.0804 for Ho: difference in coefficients not systematic;<br />
** Hausman’s test: chi2(3) = 28.77 Prob>chi2 = 0.0000 for Ho: difference in coefficients not systematic.<br />
<strong>The</strong> result of the test for 2004, considering the interception, indicates that the models<br />
present similar answers, therefore, it would not be necessary to adopt a Translog model,<br />
having in mind that additional information was not added. Still, on this model,<br />
heteroscedasticity was not identified on the models using the Breusch-Pagan test.<br />
Concerning the result for 2004 without interception, the conclusion is similar. <strong>The</strong> Breusch-<br />
Pagan test cannot be executed because it is not possible after the suppression of the<br />
interception. However, when the Zsroeter’s is executed, homoscedasticity can be identified<br />
among the variables on the Translog model.<br />
<strong>The</strong> referred result of the year of 2005 is represented on Table 3.<br />
<strong>The</strong> result of the test for the exercise of 2005 with interception indicates that the models<br />
present different answers, being possible to adopt both models for comparison. <strong>The</strong><br />
heteroscedasticity was still not identified on the models using the Breusch-Pagan test. <strong>The</strong><br />
results for 2005 without interception, though, indicate that there is no distinction between the<br />
models, but, as it was observed for 2004, estimation gains were obtained on the Translog<br />
model. <strong>The</strong> Zsroeter’s test identified homoscedasticity among the variables of this model.<br />
12 th WCTR, July 11-15, 2010 – Lisbon, Portugal
ANALYSIS OF EFFICIENCY ON THE REGULATED TRANSPORTATION COACH<br />
OPERATOR BY STOCHASTIC FRONTIER OF COBB-DOUGLAS AND TRANSLOG<br />
FUNCTIONS: THE CASE OF THE INTERSTATE PASSENGER COACH<br />
TRANSPORTATION IN BRAZIL.<br />
(MARTINS, Francisco Giusepe Donato; SILVA, Francisco Gildemir Ferreira; ROCHA, Carlos<br />
Henrique; QUEIROZ, Marcelo Pereira; ARAÚJO, Carlos Eduardo Freire)<br />
Table 3 – Result of the models for 2005<br />
With interception* Without interception**<br />
Parameters<br />
Translog<br />
Coef P>t<br />
Cobb-Douglas<br />
Coef P>t<br />
Translog<br />
Coef P>t<br />
Cobb-Douglas<br />
Coef P>t<br />
0 0,462 0,781 1,331 0,000<br />
1 1,373 0,092 0,933 0,000 1,596 0,000 1,211 0,000<br />
2 -1,381 0,230 0,053 0,359 -1,461 0,188 -0,020 0,732<br />
3 0,826 0,533 0,140 0,045 0,593 0,561 -0,077 0,170<br />
4 -0,116 0,553 -0,169 0,003<br />
5 -0,013 0,952 -0,022 0,916<br />
6 -0,287 0,491 -0,339 0,359<br />
7 0,247 0,305 0,264 0,253<br />
8 -0,038 0,897 0,015 0,945<br />
9 -0,029 0,886 -0,042 0,826<br />
ij<br />
0,236<br />
-0,293<br />
R² Adjusted 0,9367 0,9354 0,9991 0,9990<br />
* Hausman’s test: chi2(3) = 1.77 Prob>chi2 = 0.6209 for Ho: difference in coefficients not systematic;<br />
** Hausman’s test: chi2(3) = 28.21 Prob>chi2 = 0.0000 for Ho: difference in coefficients not systematic.<br />
<strong>The</strong> referred result of the year of 2006 is represented on Table 4.<br />
Table 4 – Results of the models for 2006<br />
With interception* Without interception**<br />
Parameters<br />
Translog<br />
Coef P>t<br />
Cobb-Douglas<br />
Coef P>t<br />
Translog<br />
Coef P>t<br />
Cobb-Douglas<br />
Coef P>t<br />
0 0,186 0,913 1,545 0,000<br />
1 1,574 0,056 0,879 0,000 1,663 0,000 1,196 0,000<br />
2 -0,589 0,640 -0,018 0,479 -0,617 0,616 -0,029 0,300<br />
3 -0,002 0,999 0,291 0,005 -0,095 0,934 0,007 0,941<br />
4 -0,185 0,349 -0,205 0,000<br />
5 0,181 0,459 0,177 0,462<br />
6 -0,357 0,450 -0,378 0,384<br />
7 0,116 0,666 0,122 0,640<br />
8 0,150 0,634 0,171 0,491<br />
9 -0,147 0,493 -0,153 0,465<br />
ij<br />
0,653<br />
-0,322<br />
R² Adjusted 0,9436 0,9375 0,9992 0,9990<br />
* Hausman’s test: chi2(3) = 0.92 Prob>chi2 = 0.8198 for Ho: difference in coefficients not systematic;<br />
** Hausman’s test: chi2(3) = 42.93 Prob>chi2 = 0.0000 for Ho: difference in coefficients not systematic.<br />
<strong>The</strong> result of the test for the exercise of 2006 with interception reveals that the models<br />
present distinct answers, being feasible to adopt both models for comparison. <strong>The</strong><br />
heteroscedasticity was not identified on the models using the Breusch-Pagan test. <strong>The</strong><br />
results of 2006 without interception show that there was no distinction between the models<br />
12 th WCTR, July 11-15, 2010 – Lisbon, Portugal
ANALYSIS OF EFFICIENCY ON THE REGULATED TRANSPORTATION COACH<br />
OPERATOR BY STOCHASTIC FRONTIER OF COBB-DOUGLAS AND TRANSLOG<br />
FUNCTIONS: THE CASE OF THE INTERSTATE PASSENGER COACH<br />
TRANSPORTATION IN BRAZIL.<br />
(MARTINS, Francisco Giusepe Donato; SILVA, Francisco Gildemir Ferreira; ROCHA, Carlos<br />
Henrique; QUEIROZ, Marcelo Pereira; ARAÚJO, Carlos Eduardo Freire)<br />
but, as it as observed to 2004 and 2005, there had been estimation gains on the Translog<br />
model. Zsroeter’s test identified homoscedasticity among the variables on this model.<br />
Comparing the obtained results, it can be concluded that the Translog model presented<br />
estimation gains related to the Cobb-Douglas model in all exercises, having in mind that the<br />
adjusted R² of this model was bigger than the one from the Cobb-Douglas model, with and<br />
without interception. Even though not all the present factors on the Translog models without<br />
interception are significant, possibly by multicollinearity, it is important to register that the<br />
objective is to measure the mistake component, in a way that we will neglect this problem<br />
and we will estimate the scores with the intention to analyze the inefficiency of the<br />
companies. In another paper, we suggest estimations with analysis and correction of the<br />
possible multicollinearity.<br />
<strong>The</strong>refore, we can say that the usage of the Translog model is better than the Cobb-Douglas<br />
model, because one provides advantages for empiric analysis due to the multiple product<br />
character of the activity of many companies, expressed by the different interactions among<br />
the inputs.<br />
5.2 Estimation of the <strong>Efficiency</strong> Scores basing on the Translog Model<br />
<strong>The</strong> efficiency patterns (scores) were obtained from the Translog model represented by the<br />
equation 7, having in mind the established conclusions based on the estimated results of the<br />
stochastic frontier presented on item 5.1. <strong>The</strong> scores were calculated in function of the<br />
standard mistake in a way of reflecting the economic inefficiency. In this sense, the nearest<br />
scores to zero indicate the most efficient firms, while the scores most distant from zero<br />
reveal the least efficient companies when they combine the productive factors to reach the<br />
maximum efficient production.<br />
<strong>The</strong> scores were tabled by symmetric lanes in relation to zero position according to Table 6.<br />
Table 6 – Distribuction of companies by lane of efficiency scores<br />
Lane of scores Number of<br />
companies<br />
12 th WCTR, July 11-15, 2010 – Lisbon, Portugal<br />
% accumulated<br />
2004 2005 2006 2004 2005 2006<br />
1ª 0,050,00 : 0,00 -0,05 35 34 47 22,01 21,38 29,56<br />
2ª 0,10 0,06 : -0,06-0,10 43 32 30 49,06 41,51 48,43<br />
3ª 0,150,11 : -0,11-0,15 22 30 18 62,89 60,38 59,75<br />
4ª 0,200,16 : -0,16-0,20 24 23 26 77,99 74,84 76,10<br />
5ª 0,250,21 : -0,21-0,25 11 11 13 84,91 81,76 84,28<br />
6ª 0,300,26 : -0,26-0,30 11 15 5 91,82 91,19 87,42<br />
7ª 0,350,31 : -0,31-0,35 5 6 9 94,97 94,97 93,08<br />
8ª Last lane 8 8 11 100,00 100,00 100,00<br />
Total 159 159 159<br />
For analysis effects, it was taken into consideration as efficient to companies situated in the<br />
first lane of scores, from 0,05 to 0,00 and from 0,00 to -0,05. Table 4 indicates that the year<br />
of 2006 presented a larger number of efficient firms, in a total of 46, practically 30% of the<br />
total of the analyzed firms. <strong>The</strong> exercise with Translog and Cobb-Douglas models registered<br />
returns of increasing scales, with and without interception. Enlarging the analysis to the third<br />
lane of bigger technical efficiency, almost 60% from the 159 companies is reached.
ANALYSIS OF EFFICIENCY ON THE REGULATED TRANSPORTATION COACH<br />
OPERATOR BY STOCHASTIC FRONTIER OF COBB-DOUGLAS AND TRANSLOG<br />
FUNCTIONS: THE CASE OF THE INTERSTATE PASSENGER COACH<br />
TRANSPORTATION IN BRAZIL.<br />
(MARTINS, Francisco Giusepe Donato; SILVA, Francisco Gildemir Ferreira; ROCHA, Carlos<br />
Henrique; QUEIROZ, Marcelo Pereira; ARAÚJO, Carlos Eduardo Freire)<br />
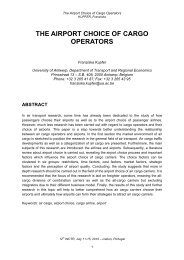
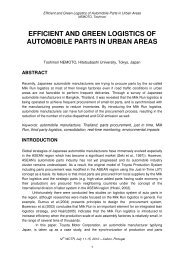
Company with larger efficiency<br />
Companies’ code<br />
a) Graphic of the scores for 2004 b) Graphic of the scores for 2005<br />
Company with larger efficiency<br />
Companies’ code<br />
c) Graphic of the scores for 2006<br />
Figure 1 – Graphic result of the efficiency scores 2004-2006<br />
<strong>The</strong> result, in graphic form, is found on Figure 1, reveals the existence of a movement on the<br />
range of each analyzed year in the sense of improving of the industry efficiency. This<br />
indicates that there are components, technological, managerial and/or regulatory that<br />
favored an improvement in transporting people efficiently. This does not imply in<br />
improvement in terms of quality. However, this may indicate a larger profitability to the<br />
operators once that is an indicative of a better utilization of production inputs and that will be<br />
described during the analysis.<br />
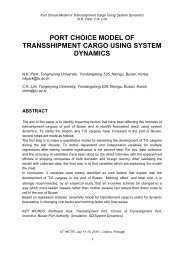
It is interesting to notice that, year after year, the most efficient company is different and can<br />
be identified as being the one located on the cut point of the blue line above zero. <strong>The</strong><br />
companies can migrate from one lane to another each year. <strong>The</strong> technical efficiency scores<br />
can be distinct annually for each of the 159 analyzed firms. Figure 2 indicates, in terms of an<br />
12 th WCTR, July 11-15, 2010 – Lisbon, Portugal<br />
Company with larger efficiency<br />
Companies’ code
ANALYSIS OF EFFICIENCY ON THE REGULATED TRANSPORTATION COACH<br />
OPERATOR BY STOCHASTIC FRONTIER OF COBB-DOUGLAS AND TRANSLOG<br />
FUNCTIONS: THE CASE OF THE INTERSTATE PASSENGER COACH<br />
TRANSPORTATION IN BRAZIL.<br />
(MARTINS, Francisco Giusepe Donato; SILVA, Francisco Gildemir Ferreira; ROCHA, Carlos<br />
Henrique; QUEIROZ, Marcelo Pereira; ARAÚJO, Carlos Eduardo Freire)<br />
associated dynamic to these modifications of position among the firms, year after year, that<br />
the companies with the lowest scores improved and the ones that showed the best scores<br />
declined. <strong>The</strong> classifications of the companies changed as well, the worst classified<br />
improved in their positions and the best classified lost their position.<br />
1<br />
0,75<br />
0,5<br />
0,25<br />
0<br />
-0,25<br />
-0,5<br />
-0,75<br />
-1<br />
a) Dynamic of 5 companies with lower scores in<br />
2004<br />
150<br />
135<br />
120<br />
105<br />
90<br />
75<br />
60<br />
45<br />
30<br />
15<br />
0<br />
2004 2005 2006<br />
1 2 3<br />
12 th WCTR, July 11-15, 2010 – Lisbon, Portugal<br />
b) Dynamic of 5 companies with higher scores in<br />
2004<br />
c) Dynamic of 5 companies that showed worst d) Dynamic of 5 companies that showed best<br />
classification in 2004<br />
classification in 2004<br />
Figura 2 – Dynamic of the scores and classification of the five best and worst companies 2004-2006.<br />
With this dynamic in view, we analyzed the wideness of this aspect for the companies that<br />
presented higher score in technical efficiency, for each included year, which are the ones<br />
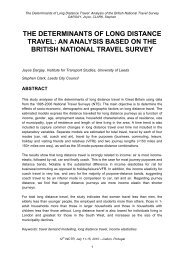
situated on the first lane of scores on Table 5. It is important to highlight also that the total<br />
amount of different companies situated on the first line of scores on Table 5, considering the<br />
three exercises, is of 96 firms that are distributed year by year as represented on Figure 3.<br />
It can be seen from Figure 3 that only one company shows on the first line of scores over the<br />
three years. It can also be noticed that 19 of the 96 companies situated on the first line of<br />
scores show simultaneously on both exercises, while 76 firms show only in one year of the<br />
period 2004-2006.<br />
1<br />
0,75<br />
0,5<br />
0,25<br />
0<br />
-0,25<br />
-0,5<br />
-0,75<br />
-1<br />
150<br />
135<br />
120<br />
105<br />
90<br />
75<br />
60<br />
45<br />
30<br />
15<br />
0<br />
2004 2005 2006<br />
1 2 3
ANALYSIS OF EFFICIENCY ON THE REGULATED TRANSPORTATION COACH<br />
OPERATOR BY STOCHASTIC FRONTIER OF COBB-DOUGLAS AND TRANSLOG<br />
FUNCTIONS: THE CASE OF THE INTERSTATE PASSENGER COACH<br />
TRANSPORTATION IN BRAZIL.<br />
(MARTINS, Francisco Giusepe Donato; SILVA, Francisco Gildemir Ferreira; ROCHA, Carlos<br />
Henrique; QUEIROZ, Marcelo Pereira; ARAÚJO, Carlos Eduardo Freire)<br />
2004<br />
12<br />
20<br />
30<br />
1<br />
5<br />
2<br />
2006<br />
Figure 3 – Distribution of the companies of higher technical efficiency in each year.<br />
26<br />
2005<br />
<strong>On</strong>e interesting aspect is the performance of all 96 companies situated on the first line of<br />
technical efficiency scores for the period of 2004-2006, in function of the adopted variables.<br />
<strong>The</strong> result is on Table 6.<br />
Table 6 – Performance of the 96 companies situated on the first line of technical efficiency scores: 2004-2006<br />
Variables<br />
Year pass-km % km % fleet % drivers %<br />
2004 5.303.848.443 -6 265.554.955 5 2.439 11 3.080 34<br />
2005 2.645.642.388 89 133.501.574 110 1.474 83 2.000 107<br />
2006 4.991.006.156 -x- 279.907.778 -x- 2.703 -x- 4.134 -x-<br />
Total 12.940.496.987 -x- 678.964.307 -x- 6.616 -x- 9.214 -x-<br />
(%) Increasing or decreasing in percentage considering 2006 as reference in relation to the other years. For<br />
example, 34=((4.134-3.080)/3.080)*100.<br />
According to Table 6, we can notice that the year of 2004 was of greater production in terms<br />
of passengers-kilometers (pass-km), followed by 2006. Analyzing in a comparative way, we<br />
can ascertain that the production of 2005 was practically 50% smaller than the production of<br />
2004, but it was followed by a significant reduction of the production factors consumption, of<br />
50%, 40% and 35%, being annual distance traveled in km, used fleet and employed drivers,<br />
respectively.<br />
Comparing the years 2004 and 2005 and 2005 to 2006, it can be noticed from Table 6 that<br />
47 companies of better score in 2006 registered a substantial increase of production factors,<br />
specially comparing to 2005, although they present a significant increase in production. In<br />
relation to 2004, these 47 companies had a reduction of 6% in production with the increase<br />
of consumption of all production factors analyzed.<br />
This reasoning was restricted only to the ten companies of higher technical efficiency score<br />
of each year. <strong>The</strong> result is expressed on Table 7.<br />
12 th WCTR, July 11-15, 2010 – Lisbon, Portugal
ANALYSIS OF EFFICIENCY ON THE REGULATED TRANSPORTATION COACH<br />
OPERATOR BY STOCHASTIC FRONTIER OF COBB-DOUGLAS AND TRANSLOG<br />
FUNCTIONS: THE CASE OF THE INTERSTATE PASSENGER COACH<br />
TRANSPORTATION IN BRAZIL.<br />
(MARTINS, Francisco Giusepe Donato; SILVA, Francisco Gildemir Ferreira; ROCHA, Carlos<br />
Henrique; QUEIROZ, Marcelo Pereira; ARAÚJO, Carlos Eduardo Freire)<br />
Table 7 – Performance of the ten companies situated on the first line of technical efficiency scores: 2004-2006<br />
Variables<br />
Year pass-km % km % fleet % drivers %<br />
2004 1.285.041.943 -40 65.732.089 -15 742 -54 800 -34<br />
2005 1.340.767.496 -42 69.780.478 -19 513 -34 1.008 -47<br />
2006 775.866.245 -x- 56.188.127 -x- 338 -x- 530 -x-<br />
Total 3.401.675.684 -x- 191.700.694 -x- 1.593 -x- 2.338 -x-<br />
(%)Increasing or decreasing in percentage considering 2006 as reference in relation to the other years. For<br />
example, 34=((4.134-3.080)/3.080)*100.<br />
We can notice from Table 7 that in the year of 2005, in spite of the ten companies of best<br />
score registered a greater production in terms of billing expressed by passengers-kilometers<br />
(pass-km), they consumed a big absolute quantity of production factors, specifically the fuel<br />
represented by the annual traveled distance in km by the fleet and the labor corresponds to<br />
the number of employed drivers. In relative terms, the increase of the production of 2005 in<br />
relation to 2004 corresponds of 4%, however, it was followed by the increase of 6% and of<br />
26%, of annual traveled distance in km and employment of labor (drivers), respectively, and<br />
by the reduction of 31% of the used fleet. It can also be noticed that the significant reduction<br />
of the production of 2006 comparing to 2004 and 2005, of 40% and 42% respectively, was<br />
followed by the reduction of the production factors, especially fleet and drivers, because they<br />
presented the biggest percentages of reduction.<br />
5.3 Economic Measures based on the Translog Model without interception<br />
In this section the homogeneity of the Translog function chosen is going to be evaluated, the<br />
marginal productivity of the production factors and the marginal rate of substitution. For the<br />
last one we will make only considerations referring to the 5 companies that most transported<br />
passengers and the 5 that least transported passengers, as we will present average<br />
statistics of the industry. We should make a consideration of this analysis because, probably<br />
the estimation has multicolinearity, than, the economic measures could be biased and the<br />
results are only to show the power of the analysis. To better results we recommended a new<br />
modeling correcting the multicolinearity problem.<br />
Concerning the degree of homogeneity, because of the fact that the chosen functions are<br />
Translog we did only the confirmation of the non homogeneity for the analyzed years using<br />
the Coelli’s criteria (2003), where the degree r of homogeneity only occurs if<br />
n<br />
n<br />
ij 0 to i = 1, 2,..., n. Like 0<br />
i 1<br />
i 1<br />
evaluating the scale return.<br />
12 th WCTR, July 11-15, 2010 – Lisbon, Portugal<br />
i<br />
n<br />
1<br />
i<br />
r<br />
and if<br />
ij , so there is no homogeneity, complicating the task of
ANALYSIS OF EFFICIENCY ON THE REGULATED TRANSPORTATION COACH<br />
OPERATOR BY STOCHASTIC FRONTIER OF COBB-DOUGLAS AND TRANSLOG<br />
FUNCTIONS: THE CASE OF THE INTERSTATE PASSENGER COACH<br />
TRANSPORTATION IN BRAZIL.<br />
(MARTINS, Francisco Giusepe Donato; SILVA, Francisco Gildemir Ferreira; ROCHA, Carlos<br />
Henrique; QUEIROZ, Marcelo Pereira; ARAÚJO, Carlos Eduardo Freire)<br />
<strong>The</strong> marginal productivity was calculated year by year obtaining the constant result of Table<br />
8.<br />
Table 8 – Marginal Productivity (PMg) of the Production Factors<br />
Ano PMg km PMg Drivers PMg Fleet<br />
2004 1,598630 1,379867 -2,256932<br />
2005 1,595728 0,593322 -1,460707<br />
2006 1,654257 -0,607406 -0,069196<br />
<strong>The</strong> marginal productivity of the production factors shows what was expected because the<br />
annual traveled distance in km is a fuel consumption Proxy, we expected that there would be<br />
a positive contribution to the production and, in case of negativity, if it had been waste;<br />
however, this would occur if it had not been renovation of fleet. <strong>On</strong> the other hand, the other<br />
two factors have different marginal productivity. In the case of marginal productivity of drivers<br />
(labor), we notice that it was decreasing, in other words, it probably happened a decrease of<br />
drivers, what is possible from the operational point of view. Besides that, it is possible that<br />
the reduction of number of drivers was followed by the increase of work hours of the<br />
employed drivers.<br />
Concerning the marginal productivity of fleet (invested capital), we can see negativity, but<br />
this has been tending to zero, even though the fleet of 2006 is bigger than the fleet of 2004.<br />
<strong>The</strong>re had been possibly an expansion of the demand and the vehicles started to register a<br />
bigger occupation seat rate.<br />
<strong>The</strong> marginal rate of substitution will demand a more careful treatment. We chose to make<br />
Tables 9 and 10 considering the 5 companies that most and least transported people year<br />
by year, to verify what the marginal rate of substitution of production factors indicate. <strong>The</strong><br />
result, as can be seen table by table, is that when the number of passengers is small, the<br />
TMS of the companies is higher, occurring the contrary with the companies that transported<br />
more people. This in certain way contributes to the expected fact that the bigger companies<br />
have bigger control over their production inputs.<br />
Tables 9 and 10 indicate that the drivers and fleet are considered in smaller proportion in the<br />
operator’s decision. If not, the operator has a bigger concern with fuel consumption. But this<br />
is intimately connected to the fleet and to the driver’s conduct while driving the steering<br />
wheel, therefore, it is possible that the results do not reflect the chain effect that the marginal<br />
substitution rate of the yearly traveled distance in km in other inputs.<br />
12 th WCTR, July 11-15, 2010 – Lisbon, Portugal
ANALYSIS OF EFFICIENCY ON THE REGULATED TRANSPORTATION COACH<br />
OPERATOR BY STOCHASTIC FRONTIER OF COBB-DOUGLAS AND TRANSLOG<br />
FUNCTIONS: THE CASE OF THE INTERSTATE PASSENGER COACH<br />
TRANSPORTATION IN BRAZIL.<br />
(MARTINS, Francisco Giusepe Donato; SILVA, Francisco Gildemir Ferreira; ROCHA, Carlos<br />
Henrique; QUEIROZ, Marcelo Pereira; ARAÚJO, Carlos Eduardo Freire)<br />
Table 9 – Marginal substitution rate of the 5 companies which transpoted less passengers: 2004-2006<br />
2004<br />
Company Passengers TMS KM TMS FLEET TMS DRIVERS<br />
A 233 0,08 -1,50E-04 9,19E-05<br />
B 1.071 0,16 -5,66E-06 6,92E-06<br />
C 1.797 0,33 -7,05E-05 8,08E-06<br />
D 1.841 0,12 -2,90E-05 6,70E-06<br />
E 2.200 0,15 -2,19E-06 4,01E-06<br />
2005<br />
Company Passengers TMS KM TMS FLEET TMS DRIVERS<br />
A 156 0,10 -1,22E-04 4,97E-05<br />
F 565 1,79 -1,61E-04 6,55E-05<br />
G 1.801 0,05 -3,08E-06 3,75E-06<br />
H 1.926 1,15 -2,19E-05 5,93E-06<br />
E 2.231 0,11 -1,39E-06 1,70E-06<br />
2006<br />
Company Passengers TMS KM TMS FLEET TMS DRIVERS<br />
K 121 0,11 -6,12E-06 -5,38E-05<br />
I 1.528 1,09 -9,86E-07 -8,65E-06<br />
F 1.601 0,53 -1,99E-06 -1,40E-05<br />
E 1.645 0,18 -8,96E-08 -2,36E-06<br />
J 2.022 0,09 -4,69E-07 -4,11E-06<br />
Table 10 – Marginal substitution rate of the 5 Companies that most transported passengers: 2004-2006<br />
2004<br />
Company Passengers TMS KM TMS FLEET TMS DRIVERS<br />
K 3.391.495 0,07 -7,14E-07 1,14E-06<br />
L 2.696.150 0,06 -1,58E-06 1,29E-06<br />
M 2.266.524 0,07 -1,14E-06 1,46E-06<br />
N 2.199.765 0,07 -6,34E-07 5,23E-07<br />
O 2.089.595 0,08 -1,05E-06 8,79E-07<br />
2005<br />
Company Passengers TMS KM TMS FLEET TMS DRIVERS<br />
K 3.222.397 0,06 -4,19E-07 4,84E-07<br />
L 2.783.959 0,06 -6,76E-07 5,66E-07<br />
N 2.306.935 0,06 -4,19E-07 2,10E-07<br />
P 2.230.568 0,07 -6,95E-07 5,61E-07<br />
Q 2.112.388 0,08 -7,76E-07 5,85E-07<br />
2006<br />
Company Passengers TMS KM TMS FLEET TMS DRIVERS<br />
K 3.216.436 0,06 -2,28E-08 -4,15E-07<br />
L 2.529.796 0,07 -4,34E-08 -5,72E-07<br />
M 2.169.012 0,07 -3,96E-08 -5,97E-07<br />
Q 2.031.526 0,09 -3,71E-08 -5,75E-07<br />
R 1.954.370 0,06 -1,34E-08 -3,58E-07<br />
12 th WCTR, July 11-15, 2010 – Lisbon, Portugal
ANALYSIS OF EFFICIENCY ON THE REGULATED TRANSPORTATION COACH<br />
OPERATOR BY STOCHASTIC FRONTIER OF COBB-DOUGLAS AND TRANSLOG<br />
FUNCTIONS: THE CASE OF THE INTERSTATE PASSENGER COACH<br />
TRANSPORTATION IN BRAZIL.<br />
(MARTINS, Francisco Giusepe Donato; SILVA, Francisco Gildemir Ferreira; ROCHA, Carlos<br />
Henrique; QUEIROZ, Marcelo Pereira; ARAÚJO, Carlos Eduardo Freire)<br />
We can see, beyond that, the ideal marginal substitution rate via comparison, providing to<br />
the regulative factors an instrument to foment a competition of the type yardstick.<br />
Finally, the statistics of the marginal substitution rates presented on Table 11 give a notion of<br />
the variability of data and of what occurs on the average of the sector of TRIP in Brazil.<br />
Generally speaking, there is an installed capacity superior to the needed; this is reflected by<br />
the TMS of the fleet. <strong>The</strong> km TMS shows that there are few companies that use their fuel<br />
inefficiently. <strong>The</strong> TMS of the drivers indicate that the labor suffered great variation in the<br />
studied period and it is coherent to the smaller quantity of drivers employed in 2006 than in<br />
2004.<br />
Table 11 – Statistics of the Marginal substitution rates for the TRIP sector in Brazil<br />
Year Statistics TMS KM TMS FLEET TMS DRIVERS<br />
Average 0,12 -4,21E-06 2,62E-06<br />
2004 Maximum 1,27 -1,36E-07 9,19E-05<br />
Minimum 0,05 -1,50E-04 5,91E-08<br />
Average 0,13 -3,63E-06 1,54E-06<br />
2005 Maximum 1,79 -6,59E-08 6,55E-05<br />
Minimum 0,04 -1,61E-04 1,61E-07<br />
Average 0,14 -1,55E-07 -1,30E-06<br />
2006 Maximum 1,32 -4,35E-09 -1,32E-07<br />
Minimum 0,05 -6,12E-06 -5,38E-05<br />
6. FINAL CONSIDERATIONS<br />
<strong>The</strong> methodology presents deep link on the production theory and statistic base<br />
consolidated in econometric studies. <strong>The</strong> study is pioneer in the moment that escapes from<br />
the traditional approach of Cobb-Douglas parametric bound and applies a more general<br />
Function using the stochastic frontier concept to measure technical inefficiency. With the<br />
estimation the inefficiency sources can be verified and actions can be showed in a way to<br />
improve the TRIP activity in Brazil.<br />
As results, we have the efficiency profile of the TRIP for three years and the dynamic<br />
efficiency of the sector. A reduction of efficiency during the analyzed years was observed<br />
and it was identified that this probably is due to the expansion of the installed capacity of the<br />
companies by the acquisition of new buses. <strong>On</strong> the other hand, the concern of the operators<br />
with fuel consumption was assured, in a way that there were improvements in efficiency.<br />
Besides that, changes in companies position were verified year by year, the companies most<br />
and least efficient changed over the years. This suggests a strategic behavior in a meaning<br />
of a possible competitiveness among the companies, because, in one side, eventual<br />
substitutions of buses can come surrounded by the attraction of the demand. This is an<br />
assumption to be evaluated in another work with stratified data.<br />
We can see also that the development of the 10 companies with bigger score strengthens<br />
this competitive behavior. It would be good to have an analysis route by route of the<br />
substitutability of the production factors facing the market’s concentration or relative position<br />
of the leader year by year. This would corroborate to a regulatory analysis of the competitive<br />
behavior or cooperative behavior among the companies in specific lines, being a study issue<br />
and intervention of state in case it happens excess in market power.<br />
12 th WCTR, July 11-15, 2010 – Lisbon, Portugal
ANALYSIS OF EFFICIENCY ON THE REGULATED TRANSPORTATION COACH<br />
OPERATOR BY STOCHASTIC FRONTIER OF COBB-DOUGLAS AND TRANSLOG<br />
FUNCTIONS: THE CASE OF THE INTERSTATE PASSENGER COACH<br />
TRANSPORTATION IN BRAZIL.<br />
(MARTINS, Francisco Giusepe Donato; SILVA, Francisco Gildemir Ferreira; ROCHA, Carlos<br />
Henrique; QUEIROZ, Marcelo Pereira; ARAÚJO, Carlos Eduardo Freire)<br />
Finally, this paper did not analyze the relations between the inputs, however, by the adopted<br />
functional form, this could be measured. We do not measure the possible existent<br />
multicolinearity, in a way that the correction and the analysis of the indirect effects between<br />
inputs are made in posterior works.<br />
REFERENCES<br />
Aigner, D. J.; Chu, S. F. (1968). <strong>On</strong> estimating the industry production function. American<br />
Economic Review, v. 58, p. 826-839.<br />
Aigner, D. J., Lovell A. K., and Schmidt, P. (1977). Formulation and estimation of stochastic<br />
frontier production function models. Journal of Econometrics, v. 6, p. 21-37.<br />
Albuquerque, M. C. C. (1987). Uma Análise Translog sobre Mudança Tecnológica e Efeitos<br />
de Escala: um caso de modernização ineficiente. Pesquisa e Planejamento<br />
Econômico, 17 (1), 191:220, abr., Rio de Janeiro: Ipea.<br />
ANTT. Agência Nacional de Transportes Terrestres. (2006). Anuário Estatístico do<br />
Transporte Rodoviário Interestadual e Internacional de Passageiros – Ano 2007<br />
(Base 2006). Disponível em www.antt.gov.br. Acesso em 5/4/2008.<br />
Araújo, C. E. F.; Martins, F. G. D.; Silva, F. G. F. (2008). Análise Exploratória da Eficiência<br />
Operacional de Empresas do Transporte Rodoviário Interestadual de Passageiros<br />
por Ônibus no Brasil. XXII Congresso de Pesquisa e Ensino em Transportes – XII<br />
ANPET. Panorama Nacional de Pesquisa em Transportes – CD-ROM, 03 a 07 de<br />
novembro de 2008, Fortaleza-CE.<br />
Christensen, L. R.; Jorgenson, D. W.; Lau, L. J. (1973). Transcendental logarithmic<br />
production frontiers. Review of Economics and Statistics, Cambridge, 55 (1):28-45,<br />
fev.<br />
Coelli, T.; Estache, A.; Perelman, S.; Trujillo, L. (2003). A Primer on <strong>Efficiency</strong> Measurement<br />
for Utilities and Transport Regulators. Washington: <strong>The</strong> World Bank.<br />
Beattie, B. R.; Taylor, C. R.; (1993) <strong>The</strong> economics of production. Krieger Publishing,<br />
Malabar, Florida.<br />
Else, P. K. (1985). Optimal Princing and Subsidies for Scheduled Transport Services.<br />
Journal of Transport Economics and Policy, pp. 263-279.<br />
Gujarati, D. N. (1995). Basic econometrics. London: McGraw-Hill.<br />
Hausman, J. (1978). Specification Tests in Econometrics. Econometrica, 46, pp.1251-1271.<br />
Hensher, D. A. (1987). Productive <strong>Efficiency</strong> and Ownership of Urban Bus Services.<br />
<strong>Transportation</strong>, 14, pp. 209-225.<br />
Hensher, D. A.; Brewer, A. N. (2001). Transport: an economics and management<br />
perspective. United States, New York, Oxford University Press Inc.<br />
Holvad, T.; Hougaard, J. L.; Kronborg, D.; Kvist, H. K. (2004). Measuring Inefficiency in the<br />
Norwegian Bus Industry Using Multi-Directional <strong>Efficiency</strong> <strong>Analysis</strong>. <strong>Transportation</strong>,<br />
31, pp. 349-369.<br />
12 th WCTR, July 11-15, 2010 – Lisbon, Portugal
ANALYSIS OF EFFICIENCY ON THE REGULATED TRANSPORTATION COACH<br />
OPERATOR BY STOCHASTIC FRONTIER OF COBB-DOUGLAS AND TRANSLOG<br />
FUNCTIONS: THE CASE OF THE INTERSTATE PASSENGER COACH<br />
TRANSPORTATION IN BRAZIL.<br />
(MARTINS, Francisco Giusepe Donato; SILVA, Francisco Gildemir Ferreira; ROCHA, Carlos<br />
Henrique; QUEIROZ, Marcelo Pereira; ARAÚJO, Carlos Eduardo Freire)<br />
Kawamoto, E. (1994). Análise de Sistemas de Transporte. 2ª edição, revista e aumenta.<br />
São Carlos: USP.<br />
Meeusen, W..; Van Den Broeck, J. (1977). <strong>Efficiency</strong> estimation from Cobb-Douglas<br />
production functions with composed error. International Economic Review, v. 18, n.<br />
2, p. 435-444, june.<br />
Merewitz, L. (1977). <strong>On</strong> Measuring the <strong>Efficiency</strong> of PublicEnterprises: bus operating<br />
companies in the san Francisco Bay Área. <strong>Transportation</strong>, 6, pp. 45-55.<br />
Novaes, A. G.; Medeiros, H. C. (2008). Análise da Produtividade de Sistemas de<br />
Transportes com Métodos Paramétricos e Não Paramétricos. XXII Congresso de<br />
Pesquisa e Ensino em Transportes – XII ANPET. Panorama Nacional de Pesquisa<br />
em Transportes – CD-ROM, 03 a 07 de novembro de 2008, Fortaleza-CE.<br />
Obeng, K. (1985) Bus Transit Cost, Productivity and Factor Substitution. Journal of<br />
Transport Economics and Policy, pp. 183-203.<br />
Rus, G.; Campos, J.; Nombela, G. (2003). Economia Del Transporte. Barcelona: Antoni<br />
Bosh.<br />
Samuelson, P. A., Nordhaus, W. D. (1993). Economia. 14ª edição, Portugal: McGraw-Hill.<br />
Thompson Júnior, A. A., Formby, J. P. (2003). Microeconomia da Firma: teoria e prática. 6ª<br />
edição, Rio de Janeiro: LTC.<br />
White, P. R.; Turner, R. P.; Mbara, T. C. (1992). Cost Benefit <strong>Analysis</strong> of Urban Minibus<br />
Operations. <strong>Transportation</strong>, 19, pp. 59-74.<br />
Varian, H. R. (2003). Microeconomia: princípios básicos: uma abordagem moderna.<br />
Tradução da 6ª edição americana, Rio de Janeiro: Campus.<br />
Viton, P. A. (1998). Changes in Multi-mode Bus Transit <strong>Efficiency</strong>, 1988-1992.<br />
<strong>Transportation</strong>, 25, pp. 1-21.<br />
12 th WCTR, July 11-15, 2010 – Lisbon, Portugal