The OSIRIS instrument on the Odin spacecraft - Earth, Atmospheric ...
The OSIRIS instrument on the Odin spacecraft - Earth, Atmospheric ...
The OSIRIS instrument on the Odin spacecraft - Earth, Atmospheric ...

Create successful ePaper yourself
Turn your PDF publications into a flip-book with our unique Google optimized e-Paper software.
<str<strong>on</strong>g>The</str<strong>on</strong>g> <str<strong>on</strong>g>OSIRIS</str<strong>on</strong>g> <str<strong>on</strong>g>instrument</str<strong>on</strong>g> <strong>on</strong> <strong>the</strong> <strong>Odin</strong><br />
<strong>spacecraft</strong><br />
E.J. Llewellyn, N.D. Lloyd, D.A. Degenstein, R.L. Gattinger,<br />
S.V. Petelina, A.E. Bourassa, J.T. Wiensz, E.V. Ivanov,<br />
I.C. McDade, B.H. Solheim, J.C. McC<strong>on</strong>nell, C.S. Haley,<br />
C. v<strong>on</strong> Savigny, C.E. Sioris, C.A. McLinden, E. Griffioen,<br />
J. Kaminski, W.F.J. Evans, E. Puckrin, K. Str<strong>on</strong>g, V. Wehrle,<br />
R.H. Hum, D.J.W. Kendall, J. Matsushita, D.P. Murtagh,<br />
S. Brohede, J. Stegman, G. Witt, G. Barnes, W.F. Payne,<br />
L. Piché, K. Smith, G. Warshaw, D.-L. Deslauniers,<br />
P. Marchand, E.H. Richards<strong>on</strong>, R.A. King, I. Wevers,<br />
W. McCreath, E. Kyrölä, L. Oikarinen, G.W. Leppelmeier,<br />
H. Auvinen, G. Mégie, A. Hauchecorne, F. Lefèvre,<br />
J. de La Nöe, P. Ricaud, U. Frisk, F. Sjoberg, F. v<strong>on</strong> Schéele,<br />
and L. Nordh<br />
Abstract: <str<strong>on</strong>g>The</str<strong>on</strong>g> optical spectrograph and infrared imager system (<str<strong>on</strong>g>OSIRIS</str<strong>on</strong>g>) <strong>on</strong> board <strong>the</strong> <strong>Odin</strong><br />
<strong>spacecraft</strong> is designed to retrieve altitude profiles of terrestrial atmospheric minor species by<br />
observing limb-radiance profiles. <str<strong>on</strong>g>The</str<strong>on</strong>g> grating optical spectrograph (OS) obtains spectra of<br />
scattered sunlight over <strong>the</strong> range 280–800 nm with a spectral resoluti<strong>on</strong> of approximately<br />
1 nm. <str<strong>on</strong>g>The</str<strong>on</strong>g> <strong>Odin</strong> <strong>spacecraft</strong> performs a repetitive vertical limb scan to sweep <strong>the</strong> OS 1 km<br />
vertical field of view over selected altitude ranges from approximately 10 to 100 km. <str<strong>on</strong>g>The</str<strong>on</strong>g><br />
terrestrial absorpti<strong>on</strong> features that are superimposed <strong>on</strong> <strong>the</strong> scattered solar spectrum are<br />
m<strong>on</strong>itored to derive <strong>the</strong> minor species altitude profiles. <str<strong>on</strong>g>The</str<strong>on</strong>g> spectrograph also detects <strong>the</strong><br />
airglow, which can be used to study <strong>the</strong> mesosphere and lower <strong>the</strong>rmosphere. <str<strong>on</strong>g>The</str<strong>on</strong>g> o<strong>the</strong>r part<br />
of <str<strong>on</strong>g>OSIRIS</str<strong>on</strong>g> is a three-channel infrared imager (IRI) that uses linear array detectors to image<br />
<strong>the</strong> vertical limb radiance over an altitude range of approximately 100 km. <str<strong>on</strong>g>The</str<strong>on</strong>g> IRI observes<br />
both scattered sunlight and <strong>the</strong> airglow emissi<strong>on</strong>s from <strong>the</strong> oxygen infrared atmospheric band<br />
at 1.27 µm and <strong>the</strong> OH (3-1) Meinel band at 1.53 µm. A tomographic inversi<strong>on</strong> technique is<br />
used with a series of <strong>the</strong>se vertical images to derive <strong>the</strong> two-dimensi<strong>on</strong>al distributi<strong>on</strong> of <strong>the</strong><br />
emissi<strong>on</strong>s within <strong>the</strong> orbit plane.<br />
PACS Nos.: 07.05.Pj, 07.60.Dq, 07.60.Rd, 07.87, 94.10.Dy, 94.10.Fa, 94.10.Gb, 94.10.Rk<br />
411<br />
Résumé : Le système de spectrographie optique et d’imagerie infrarouge (<str<strong>on</strong>g>OSIRIS</str<strong>on</strong>g>) à bord<br />
du satellite <strong>Odin</strong> est c<strong>on</strong>çu pour enregistrer les profils en altitude des éléments mineurs de<br />
l’atmosphère en observant les profils de radiance du limbe. Le spectrographe optique à réseau<br />
(OS) obtient les spectres de la lumière solaire diffusée sur le domaine entre 280–800 nm,<br />
avec une résoluti<strong>on</strong> spatiale approximative de 1 nm. Le satellite <strong>Odin</strong> balaye verticalement<br />
le limbe de faç<strong>on</strong> répétée, de telle sorte que l’ouverture verticale de 1 km du OS parcoure<br />
les domaines voulus entre 10 et 100 km. Nous analys<strong>on</strong>s les spectres solaires diffusés<br />
en superpositi<strong>on</strong> avec les caractéristiques terrestres d’absorpti<strong>on</strong>, afin de déterminer les<br />
profils en altitude des éléments mineurs de l’atmosphère. Le spectrographe détecte aussi la<br />
luminescence nocturne atmosphérique qui peut être utilisé pour étudier la mésosphère et la<br />
<strong>the</strong>rmosphère. L’autre partie d’<str<strong>on</strong>g>OSIRIS</str<strong>on</strong>g> est un imageur infrarouge (IRI) à trois canaux qui<br />
utilise une banque linéaire de détecteurs pour imager la radiance du limbe sur un domaine<br />
d’altitude d’approximativement 100 km. L’IRI observe à la fois la lumière solaire diffusée et<br />
les émissi<strong>on</strong>s de luminescence nocturne atmospérique provenant de la bande infrarouge de<br />
l’oxygène atmosphérique à 1.27 µm et la bande de Meinel de l’OH (3-1) à 1.53 µm. Nous<br />
utilis<strong>on</strong>s une technique d’inversi<strong>on</strong> tomographique avec une série de ces images verticales<br />
pour obtenir la distributi<strong>on</strong> bidimensi<strong>on</strong>nelle des émissi<strong>on</strong>s à l’intérieur de l’orbite.<br />
[Traduit par la Rédacti<strong>on</strong>]<br />
Can. J. Phys. 82: 411–422 (2004) doi: 10.1139/P04-005 © 2004 NRC Canada
412 Can. J. Phys. Vol. 82, 2004<br />
1. Introducti<strong>on</strong><br />
<str<strong>on</strong>g>The</str<strong>on</strong>g> <strong>Odin</strong> satellite was launched <strong>on</strong> 20 February 2001, from <strong>the</strong> Svobodny Cosmodrome in Eastern<br />
Siberia into a near circular Sun-synchr<strong>on</strong>ous orbit. <str<strong>on</strong>g>The</str<strong>on</strong>g> satellite serves a combined aer<strong>on</strong>omy/astr<strong>on</strong>omy<br />
missi<strong>on</strong> and includes <strong>on</strong>ly two <str<strong>on</strong>g>instrument</str<strong>on</strong>g>s: <strong>the</strong> sub-mm/mm radiometer (SMR) and <strong>the</strong> optical spectrograph<br />
and infrared imager system (<str<strong>on</strong>g>OSIRIS</str<strong>on</strong>g>). <str<strong>on</strong>g>The</str<strong>on</strong>g> objective of <strong>the</strong> aer<strong>on</strong>omy missi<strong>on</strong> is to provide<br />
new informati<strong>on</strong> <strong>on</strong> <strong>the</strong> extent to which humans are changing <strong>the</strong> atmospheric envir<strong>on</strong>ment. This broad<br />
objective has been more clearly defined by Murtagh et al. [1] as:<br />
1. Stratospheric oz<strong>on</strong>e science: To elucidate <strong>the</strong> geographical extent of, and mechanisms resp<strong>on</strong>sible<br />
for, oz<strong>on</strong>e depleti<strong>on</strong> in <strong>the</strong> “oz<strong>on</strong>e hole” regi<strong>on</strong> and to study diluti<strong>on</strong> effects and possible<br />
heterogeneous chemistry even outside of <strong>the</strong> polar regi<strong>on</strong>s due to sulphate aerosols.<br />
Received 8 November 2003. Accepted 31 January 2004. Published <strong>on</strong> <strong>the</strong> NRC Research Press Web site at<br />
http://cjp.nrc.ca/ <strong>on</strong> 3 June 2004.<br />
E.J. Llewellyn, 1 N.D. Lloyd, D.A. Degenstein, R.L. Gattinger, S.V. Petelina, A.E. Bourassa, J.T. Wiensz,<br />
and E.V. Ivanov. ISAS, Department of Physics and Engineering Physics, University of Saskatchewan, Saskato<strong>on</strong>,<br />
SK S7N 5E2, Canada.<br />
I.C. McDade2 and J.C. McC<strong>on</strong>nell2 . EATS, York University, 4700 Keele Street, North York, ON M3J 1P3,<br />
Canada.<br />
B.H. Solheim, C.S. Haley, C. v<strong>on</strong> Savigny, 3 C.E. Sioris, 4 C.A. McLinden, 5 E. Griffioen, and J. Kaminski.<br />
CRESS, York University, 4700 Keele Street, North York, ON M3J 1P3, Canada.<br />
W.F.J. Evans and E. Puckrin. 6 Physics Department, Trent University, Peterborough, ON K9J 7B8, Canada.<br />
K. Str<strong>on</strong>g. Physics Department, University of Tor<strong>on</strong>to, 60 St. George Street, Tor<strong>on</strong>to, ON M5S 1A7 Canada.<br />
V. Wehrle, R.H. Hum, D.J.W. Kendall, and J. Matsushita. 7 Canadian Space Agency, Ottawa, ON K1A 0R6,<br />
Canada.<br />
D.P. Murtagh and S. Brohede. Department of Radio and Space Science, Chalmers University of Technology,<br />
SE-412 96 Göteborg, Sweden.<br />
J. Stegman and G. Witt. MISU, Department of Meteorology, Stockholm University, SE-106 91 Stockholm,<br />
Sweden.<br />
G. Barnes, W.F. Payne, L. Piché, K. Smith, G. Warshaw7 , D.-L. Deslauniers, and P. Marchand. Routes<br />
AstroEngineering Ltd., 303 Legget Road, Kanata, ON K2K 3B1, Canada.<br />
E.H. Richards<strong>on</strong>. 8 EHR Optical Systems, 1871 Elmhurst Pl., Victoria, BC V8N 1R1, Canada.<br />
R.A. King9 and I. Wevers. Physics and Astr<strong>on</strong>omy Department, University of Calgary, Calgary, AB T2N 1N4,<br />
Canada.<br />
W. McCreath. WavePrecisi<strong>on</strong> Inc., Nepean, ON K2E 7Y8, Canada.<br />
E. Kyrölä, L. Oikarinen7 , G.W. Leppelmeier, 10 and H. Auvinen. Finnish Meteorological Institute, Geophysical<br />
Research, P.O. Box 503, FIN-00101 Helsinki, Finland.<br />
G. Mégie, A. Hauchecorne, and F. Lefèvre. Service d’Aer<strong>on</strong>omie, Institut Pierre-Sim<strong>on</strong> Laplace, Jussieu,<br />
Paris, France.<br />
J. de La Nöe and P. Ricaud. Observatoire Aquitain des Sciences de l’Univers, Laboratoire d’Astrodynamique,<br />
d’Astrophysique et d’Aér<strong>on</strong>omie de Bordeaux, Floirac, France.<br />
U. Frisk, F. Sjoberg, and F. v<strong>on</strong> Schéele. Swedish Space Corporati<strong>on</strong>, Albygatan 107, Solna, SE-171 04,<br />
Sweden.<br />
L. Nordh. Swedish Nati<strong>on</strong>al Space Board, Albygatan 107, Solna, SE-171 04, Sweden.<br />
1Corresp<strong>on</strong>ding author (e-mail: edward.llewellyn@usask.ca).<br />
2Also at: CRESS, York University, 4700 Keele Street, North York, ON M3J 1P3, Canada.<br />
3Also at: IUP/IFE, University of Bremen, D-28359 Bremen, Germany.<br />
4Also at: SAO, Harvard University, 60 Garden Street, Cambridge, MA 02138, U.S.A.<br />
5Also at: MSC, Envir<strong>on</strong>ment Canada, 4905 Dufferin Street, Downsview, ON M3H 5T4, Canada.<br />
6Also at: Defence R&D Canada - Valcartier, Val-Bélair, QC G3J 1X5, Canada.<br />
7Deceased. 8Also at: University of Victoria, Victoria, B.C. V8W 3P6, Canada.<br />
9 Now at: Lunar and Planetary Laboratory, University of Ariz<strong>on</strong>a, Tucs<strong>on</strong>, AZ 85721, U.S.A.<br />
10Also at: G&SAssociates, Yläkaupinkuja 2, 02360 Espoo, Finland.<br />
© 2004 NRC Canada
Llewellyn et al. 413<br />
2. Mesospheric oz<strong>on</strong>e science: To establish <strong>the</strong> relative role of odd hydrogen chemistry and <strong>the</strong><br />
effects of ordered and turbulent transport and corpuscular radiati<strong>on</strong>.<br />
3. Summer mesosphere science: To establish <strong>the</strong> variability of mesospheric water vapour including<br />
an assessment of <strong>the</strong> required fluxes for aerosol formati<strong>on</strong> in <strong>the</strong> polar mesosphere, i.e., polar<br />
mesospheric clouds.<br />
4. Coupling of atmospheric regi<strong>on</strong>s: To study some of <strong>the</strong> mechanisms that provide coupling between<br />
<strong>the</strong> upper and lower atmosphere, e.g., downward transport of aurorally enhanced NO with its<br />
effects <strong>on</strong> oz<strong>on</strong>e photochemistry and <strong>the</strong> vertical exchange of minor species such as odd oxygen,<br />
CO, and H2O.<br />
To meet <strong>the</strong>se scientific goals <strong>the</strong> satellite, which is in a circular Sun-synchr<strong>on</strong>ous orbit at 600 km<br />
with <strong>the</strong> ascending node at 1800 Local Time (LT), is pointed at <strong>the</strong> limb, usually in <strong>the</strong> directi<strong>on</strong> of <strong>the</strong><br />
satellite track, and <strong>the</strong> entire satellite nodded so that <strong>the</strong> co-aligned optical axes of <strong>the</strong> radiometer and<br />
<str<strong>on</strong>g>OSIRIS</str<strong>on</strong>g> sweep over selected altitude ranges, between approximately 10 and 100 km. <str<strong>on</strong>g>The</str<strong>on</strong>g> entrance slit<br />
for <strong>the</strong> OS is aligned parallel to <strong>the</strong> horiz<strong>on</strong>, while <strong>the</strong> three <strong>on</strong>e-dimensi<strong>on</strong>al array detectors in <strong>the</strong> IRI<br />
are aligned perpendicular to <strong>the</strong> horiz<strong>on</strong>.<br />
<str<strong>on</strong>g>The</str<strong>on</strong>g> OS data include two types of informati<strong>on</strong>, Rayleigh-scattered sunlight spectra c<strong>on</strong>taining atmospheric<br />
absorpti<strong>on</strong> features within <strong>the</strong> wavelength range 280–800 nm and atmospheric emissi<strong>on</strong><br />
features, including <strong>the</strong> airglow from sodium and molecular oxygen plus numerous auroral emissi<strong>on</strong>s.<br />
For <strong>the</strong> scattered solar spectra <strong>the</strong> Sun acts as a light source against which absorpti<strong>on</strong> by lines and diffuse<br />
bands of species such as oz<strong>on</strong>e and NO2 can be measured, and hence column abundances inferred. <str<strong>on</strong>g>The</str<strong>on</strong>g><br />
IRI data are also of two types, Rayleigh-scattered sunlight and <strong>the</strong> airglow, although in <strong>the</strong>se cases <strong>the</strong><br />
spectral selecti<strong>on</strong> is achieved with interference filters so that individual absorpti<strong>on</strong> features cannot be<br />
studied.<br />
In this paper, <strong>the</strong> approach to <strong>the</strong> basic <str<strong>on</strong>g>OSIRIS</str<strong>on</strong>g> design and <strong>the</strong> <strong>on</strong>-orbit performance evaluati<strong>on</strong> are<br />
presented. Preliminary reports <strong>on</strong> <strong>the</strong> <str<strong>on</strong>g>OSIRIS</str<strong>on</strong>g> c<strong>on</strong>cept have been presented elsewhere [2, 3]. While <strong>the</strong><br />
c<strong>on</strong>cept of limb scanning is not new, <strong>the</strong> tomographic approach used with <strong>the</strong> IRI represents a major<br />
advance and <strong>the</strong> new opportunities afforded by this novel approach to limb imaging are also briefly<br />
discussed.<br />
2. <str<strong>on</strong>g>The</str<strong>on</strong>g> optical spectrograph and infrared imaging system (<str<strong>on</strong>g>OSIRIS</str<strong>on</strong>g>)<br />
An example of <strong>the</strong> expected (pre-flight) <strong>on</strong>-orbit scattered limb spectra, calculated using <strong>the</strong> MOD-<br />
TRAN code, is shown in Fig. 1a while examples of <strong>the</strong> first observed limb spectra are shown in Fig. 1b.<br />
<str<strong>on</strong>g>The</str<strong>on</strong>g> obvious data gap in Fig. 1b is intenti<strong>on</strong>al; it is in <strong>the</strong> regi<strong>on</strong> of <strong>the</strong> order sorter where <strong>the</strong> spectrum<br />
is not recorded. <str<strong>on</strong>g>The</str<strong>on</strong>g> general decrease in <strong>the</strong> scattered intensity below 330 nm, which is apparent in<br />
both Figs. 1a and 1b, is due to Rayleigh extincti<strong>on</strong> as well as oz<strong>on</strong>e absorpti<strong>on</strong>. <str<strong>on</strong>g>The</str<strong>on</strong>g> broad absorpti<strong>on</strong><br />
feature near 600 nm is also due to oz<strong>on</strong>e and <strong>the</strong> narrow absorpti<strong>on</strong> feature at 762 nm is due to <strong>the</strong><br />
(0–0) band of <strong>the</strong> oxygen atmospheric absorpti<strong>on</strong> system (b 1 + g<br />
⇐ X3 − g<br />
). It should be noted that<br />
<strong>the</strong> water vapour and O2 B-band, <strong>the</strong> (1–0) transiti<strong>on</strong> of <strong>the</strong> oxygen atmospheric absorpti<strong>on</strong> system,<br />
absorpti<strong>on</strong>s that are evident in Fig. 1b at “high” altitudes are really an albedo signature and do not imply<br />
that <strong>the</strong>re is absorpti<strong>on</strong> by <strong>the</strong>se features at <strong>the</strong>se high tangent altitudes. It is readily apparent that <strong>the</strong>re<br />
is excellent agreement between <strong>the</strong> preflight expected spectra and those actually observed, this implies<br />
that <strong>the</strong> <strong>on</strong>-orbit performance of <str<strong>on</strong>g>OSIRIS</str<strong>on</strong>g> is very close to that predicted.<br />
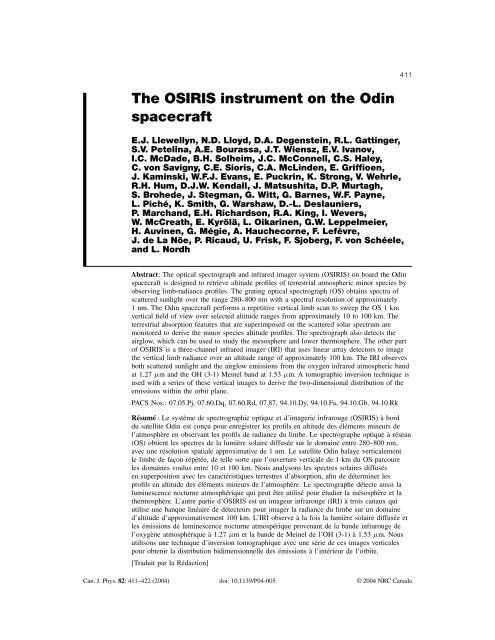
3. <str<strong>on</strong>g>The</str<strong>on</strong>g> optical spectrograph (OS)<br />
<str<strong>on</strong>g>The</str<strong>on</strong>g> <str<strong>on</strong>g>OSIRIS</str<strong>on</strong>g> <str<strong>on</strong>g>instrument</str<strong>on</strong>g> is shown schematically in Fig. 2. As already noted for normal operati<strong>on</strong>,<br />
<strong>the</strong> <str<strong>on</strong>g>instrument</str<strong>on</strong>g> is pointed at <strong>the</strong> limb so that scattered light from <strong>the</strong> terrestrial limb enters <strong>the</strong> OS<br />
(Fig. 2) through <strong>the</strong> baffle secti<strong>on</strong> of <strong>the</strong> telescope. As <str<strong>on</strong>g>OSIRIS</str<strong>on</strong>g> and <strong>the</strong> SMR, which are co-aligned, are<br />
pointed at <strong>the</strong> limb for normal aer<strong>on</strong>omy operati<strong>on</strong> <strong>the</strong> bright <strong>Earth</strong> is always very close to <strong>the</strong> optical<br />
axis so that rejecti<strong>on</strong> of off-axis scattered light is paramount for satisfactory <str<strong>on</strong>g>instrument</str<strong>on</strong>g> performance.<br />
© 2004 NRC Canada
414 Can. J. Phys. Vol. 82, 2004<br />
Fig. 1. (a) Typical preflight <strong>on</strong>-orbit limb spectra calculated using <strong>the</strong> MODTRAN code for high-latitude<br />
winter c<strong>on</strong>diti<strong>on</strong>s, c<strong>on</strong>volved with a1nmslit functi<strong>on</strong>. Radiance units are 10 6 phot<strong>on</strong>s/Å/4π. <str<strong>on</strong>g>The</str<strong>on</strong>g> sharp<br />
absorpti<strong>on</strong> features at 690 and 760 nm are due to molecular oxygen while <strong>the</strong> broad feature centred around<br />
600 nm is due <strong>the</strong> Chappuis bands of oz<strong>on</strong>e. (b) An early missi<strong>on</strong> limb image sequence obtained with <strong>the</strong><br />
optical spectrograph when <strong>Odin</strong> was near 80 ◦ N. <str<strong>on</strong>g>The</str<strong>on</strong>g> altitude range of <strong>the</strong> tangent line of sight of <strong>the</strong> scan<br />
is between approximately 10 and 60 km. <str<strong>on</strong>g>The</str<strong>on</strong>g> radiance units corresp<strong>on</strong>d to 10 6 phot<strong>on</strong>s/Å/4π<br />
.<br />
© 2004 NRC Canada
Llewellyn et al. 415<br />
Fig. 2. (a) A schematic of <strong>the</strong> optical spectograph (OS) and infrared imager (IRI) illustrating <strong>the</strong> mechanical<br />
layout. (b) A schematic of <strong>the</strong> optical layout in <str<strong>on</strong>g>OSIRIS</str<strong>on</strong>g>.<br />
<str<strong>on</strong>g>The</str<strong>on</strong>g> OS baffle characterizati<strong>on</strong> and its <strong>on</strong>-orbit performance is discussed in more detail in Appendix A.<br />
<str<strong>on</strong>g>The</str<strong>on</strong>g> telescope mirror is an off-axis parabolic mirror, focal length approximately 250 mm, effective size<br />
36 mm by 36 mm, that forms an image of <strong>the</strong> limb <strong>on</strong> <strong>the</strong> slit; <strong>the</strong> 90 µm wide entrance slit is oriented<br />
horiz<strong>on</strong>tally. <str<strong>on</strong>g>The</str<strong>on</strong>g> resultant vertical field of view at <strong>the</strong> limb tangent point is approximately 1 km; <strong>the</strong> slit<br />
length corresp<strong>on</strong>ds to approximately 20 km (horiz<strong>on</strong>tal) at <strong>the</strong> limb. <str<strong>on</strong>g>The</str<strong>on</strong>g> fold mirror just before <strong>the</strong> slit<br />
serves to reduce <strong>the</strong> overall dimensi<strong>on</strong>s of <strong>the</strong> <str<strong>on</strong>g>instrument</str<strong>on</strong>g>. A fail-open shutter is located immediately<br />
behind <strong>the</strong> slit.<br />
Inside <strong>the</strong> spectrograph <strong>the</strong> first optical element is <strong>the</strong> collimating mirror, an off-axis parabolic that<br />
matches <strong>the</strong> telescope mirror. <str<strong>on</strong>g>The</str<strong>on</strong>g> collimated beam is <strong>the</strong>n incident <strong>on</strong> <strong>the</strong> 600 grooves/mm grating<br />
© 2004 NRC Canada
416 Can. J. Phys. Vol. 82, 2004<br />
Fig. 3. Optical spectrograph sensitivity plot measured prelaunch.<br />
DN/Column-kR/A<br />
250<br />
200<br />
150<br />
100<br />
50<br />
0<br />
280 300 320 340 360 380 400 450 500 550 600 650 700 750 800<br />
Wavelength - nm<br />
(blazed at 400 nm), provided by Instruments SA/Jobin-Yv<strong>on</strong>. This specialized grating is designed to<br />
be slightly aspheric to compensate for aberrati<strong>on</strong>s in <strong>the</strong> spherical camera mirror. All mirror surfaces<br />
are protected with a SiO2 overcoating. <str<strong>on</strong>g>The</str<strong>on</strong>g> effects of grating polarizati<strong>on</strong>, which were measured during<br />
<strong>the</strong> prelaunch characterizati<strong>on</strong>, have been discussed by McLinden et al. [4]. <str<strong>on</strong>g>The</str<strong>on</strong>g> 45 ◦ internal reflecti<strong>on</strong><br />
prism redirects <strong>the</strong> beam from <strong>the</strong> camera mirror <strong>on</strong> to <strong>the</strong> out-of-plane detector. <str<strong>on</strong>g>The</str<strong>on</strong>g> detector is an EEV<br />
CCD, Model CCD26, operated in frame transfer MPP mode and selected for good quantum efficiency,<br />
low noise, and a minimum number of bad pixels. <str<strong>on</strong>g>The</str<strong>on</strong>g> spectral resp<strong>on</strong>se covers <strong>the</strong> desired wavelength<br />
range from 280 to 800 nm. A spectral resoluti<strong>on</strong> of approximately 1 nm is achieved throughout <strong>the</strong><br />
wavelength range using <strong>the</strong> 1353 pixels in a CCD row. <str<strong>on</strong>g>The</str<strong>on</strong>g> spectral point spread functi<strong>on</strong> and <strong>the</strong><br />
wavelength calibrati<strong>on</strong> of <strong>the</strong> spectrograph were measured during <strong>the</strong> <str<strong>on</strong>g>OSIRIS</str<strong>on</strong>g> preflight characterizati<strong>on</strong><br />
using a number of spectral line emissi<strong>on</strong> sources. In flight <strong>the</strong> wavelength calibrati<strong>on</strong> is automatically<br />
recorded with <strong>the</strong> Fraunhofer features in <strong>the</strong> sky spectrum. As <strong>Odin</strong> is flying in a terminator orbit, 1800<br />
LT ascending node, <strong>the</strong> <strong>the</strong>rmal envir<strong>on</strong>ment of <strong>the</strong> <strong>spacecraft</strong> is relatively c<strong>on</strong>stant. However, during<br />
<strong>the</strong> nor<strong>the</strong>rn hemisphere summer solstice <strong>the</strong> satellite does experience eclipse, this results in a decrease<br />
of <strong>the</strong> temperature of <strong>the</strong> optical bench in <strong>the</strong> OS. One c<strong>on</strong>sequence of this temperature change is a<br />
defocusing of <strong>the</strong> spectral image and a significant loss of resoluti<strong>on</strong> until <strong>the</strong> OS recovers its normal<br />
operating temperature. This temperature effect has been minimized through <strong>the</strong> use of a small heater<br />
mounted directly under <strong>the</strong> optical bench. An imaging capability al<strong>on</strong>g <strong>the</strong> slit, 32 rows <strong>on</strong> <strong>the</strong> CCD, is<br />
also included to enable observati<strong>on</strong>s of horiz<strong>on</strong>tal structure at <strong>the</strong> terrestrial limb. <str<strong>on</strong>g>The</str<strong>on</strong>g> exposure times<br />
range from 10 ms to 10 s. <str<strong>on</strong>g>The</str<strong>on</strong>g> CCD is maintained at a temperature that varies during <strong>the</strong> course of <strong>the</strong><br />
year between approximately −25 and −10 ◦ C by passive cooling, <strong>the</strong> temperature variati<strong>on</strong> is caused by<br />
<strong>the</strong> change in <strong>the</strong> β angle, <strong>the</strong> angle between <strong>the</strong> Sun and <strong>the</strong> normal to orbital plane, and <strong>the</strong> c<strong>on</strong>sequent<br />
variati<strong>on</strong> in power produced by <strong>the</strong> solar panels. At <strong>the</strong>se detector temperatures, <strong>the</strong> dark current is<br />
always a very minor fracti<strong>on</strong> of <strong>the</strong> total signal. <str<strong>on</strong>g>The</str<strong>on</strong>g>re is an advantage to <strong>the</strong> use of passive cooling,<br />
bey<strong>on</strong>d <strong>the</strong> obvious <strong>on</strong>e of power saving, as each time <strong>Odin</strong> is switched to <strong>the</strong> astr<strong>on</strong>omy mode so <strong>the</strong><br />
detector is warmed and any c<strong>on</strong>densati<strong>on</strong> removed. However, it should be noted that <strong>the</strong>re is no obvious<br />
icing of <strong>the</strong> cooled detectors.<br />
It is readily apparent from <strong>the</strong> preflight calculated data, Fig. 1a, that <strong>the</strong> low-tangent altitude observati<strong>on</strong>s<br />
at wavelengths near 300 nm are particularly susceptible to c<strong>on</strong>taminati<strong>on</strong> from <strong>the</strong> very bright<br />
visible regi<strong>on</strong> signals. Thus, it is important that <strong>the</strong> spectrograph was designed to minimize <strong>the</strong> effects<br />
of spectral cross-talk. In this respect, <strong>the</strong> most important optical comp<strong>on</strong>ent in <strong>the</strong> OS is <strong>the</strong> 45 ◦ prism,<br />
this also includes field-flattening lenses that are b<strong>on</strong>ded <strong>on</strong> to <strong>the</strong> surface and an order-sorting colored<br />
glass filter. <str<strong>on</strong>g>The</str<strong>on</strong>g> basic Ebert–Fastie spectrograph design [5], and <strong>the</strong> Czerny–Turner variati<strong>on</strong>, suffers<br />
from a high degree of spectral cross-talk and it is comm<strong>on</strong> to use two spectrometers in series to reduce<br />
this effect [6]. <str<strong>on</strong>g>The</str<strong>on</strong>g> limited space available <strong>on</strong> <strong>the</strong> <strong>Odin</strong> satellite precluded this approach and <strong>the</strong> same<br />
© 2004 NRC Canada
Llewellyn et al. 417<br />
performance was achieved with <strong>the</strong> 45 ◦ prism. Light from <strong>the</strong> spectrograph walls that reaches <strong>the</strong> prism<br />
has a large angle of incidence and so is reflected with a high efficiency and not transmitted to <strong>the</strong> detector.<br />
<str<strong>on</strong>g>OSIRIS</str<strong>on</strong>g> also differs from <strong>the</strong>se o<strong>the</strong>r designs in that it uses a spherical, tilted camera mirror and an<br />
aspherized grating spectrograph, as for <strong>the</strong> CFHT [7], but again differs in that for <str<strong>on</strong>g>OSIRIS</str<strong>on</strong>g> <strong>the</strong> grating is<br />
off-axis [8]. In additi<strong>on</strong>, despite being off-axis perpendicular to dispersi<strong>on</strong>, <strong>the</strong> spectrograph is designed<br />
so that <strong>the</strong> spectral lines are not tilted and thus can be binned. With this optical layout and <strong>the</strong> selecti<strong>on</strong><br />
of coating materials that provide low bi-directi<strong>on</strong>al reflectance distributi<strong>on</strong> functi<strong>on</strong> (BRDF) values <strong>the</strong><br />
internal scattered light level in <strong>the</strong> OS is very low, it is better than 5 × 10 −6 in <strong>the</strong> ultraviolet regi<strong>on</strong>.<br />
This value was determined from measurements of <strong>the</strong> ultra-violet spectral resp<strong>on</strong>se, with a series of<br />
short-wave cut-off filters, to a quartz halogen source.<br />
<str<strong>on</strong>g>The</str<strong>on</strong>g> OS system sensitivity as a functi<strong>on</strong> of wavelength, summed over 32 rows, is shown in Fig. 3.<br />
This sensitivity was measured during <strong>the</strong> OS calibrati<strong>on</strong> and characterizati<strong>on</strong> phase with a number of<br />
different calibrated sources. However, as part of <strong>the</strong> general m<strong>on</strong>itoring of <strong>the</strong> OS performance during<br />
<strong>the</strong> period between <str<strong>on</strong>g>OSIRIS</str<strong>on</strong>g> delivery to Sweden for integrati<strong>on</strong> into <strong>the</strong> <strong>spacecraft</strong> (May 1998) and<br />
shipping to <strong>the</strong> launch site (January 2001) full frame images of various sources were collected <strong>on</strong> an<br />
irregular basis. It became apparent in late 2000 that <strong>the</strong> full frame image, see Fig. 4, exhibited significant<br />
structure that could potentially impact <strong>the</strong> missi<strong>on</strong> data.As <strong>the</strong> OS slit is in <strong>the</strong> focal plane of <strong>the</strong> telescope<br />
mirror it was possible to inspect <strong>the</strong> slit with an astr<strong>on</strong>omical telescope that was directed toward <strong>the</strong> OS<br />
telescope mirror and focused at infinity, without dismantling <strong>the</strong> OS. This slit inspecti<strong>on</strong> just prior to<br />
launch indicated a slight deposit of unidentified material; this is most probably from <strong>the</strong> adhesive used<br />
with <strong>the</strong> field flattener <strong>on</strong> <strong>the</strong> 45 ◦ prism, but it has not significantly degraded <str<strong>on</strong>g>instrument</str<strong>on</strong>g> performance.<br />
Measurements of <strong>the</strong> post-launch sensitivity, based <strong>on</strong> <strong>the</strong> atmospheric limb Rayleigh-scattered-light<br />
signal, agree with prelaunch sensitivity to better than 20% over <strong>the</strong> entire wavelength range of <strong>the</strong><br />
signal. In flight, <strong>the</strong> full slit image is c<strong>on</strong>tinuously m<strong>on</strong>itored for any change in <strong>the</strong> deposited material<br />
by including data from seven full CCD columns in place of <strong>the</strong> data omitted in <strong>the</strong> order-sorter regi<strong>on</strong>.<br />
<str<strong>on</strong>g>The</str<strong>on</strong>g> noise in <strong>the</strong> <strong>on</strong>-orbit detected signals is limited by phot<strong>on</strong>-counting statistics, <strong>the</strong> c<strong>on</strong>tributi<strong>on</strong><br />
from <strong>the</strong> electr<strong>on</strong>ics chain is approximately 1 DN (digitizati<strong>on</strong> number), which is essentially insignificant.<br />
1 DN corresp<strong>on</strong>ds to approximately 13 CCD electr<strong>on</strong>s.<br />
Typical OS spectra for various limb altitudes are shown in Fig. 1b. As already noted, <strong>the</strong>se observed<br />
spectra are generally in good agreement with <strong>the</strong> MODTRAN model values shown in Fig. 1a. A number<br />
of spectral fitting techniques including <strong>the</strong> method described by Flittner et al. [9] and implemented by<br />
v<strong>on</strong> Savigny et al. [10, 11] as well as <strong>the</strong> differential optical absorpti<strong>on</strong> spectroscopy (DOAS) method<br />
[12–15] that is currently used to analyze GOME satellite data [16] are being used to derive vertical<br />
limb profiles of <strong>the</strong> relevant atmospheric species. <str<strong>on</strong>g>The</str<strong>on</strong>g>se profiles [17], now available over <strong>the</strong> sunlit<br />
hemisphere, provide valuable inputs to global three-dimensi<strong>on</strong>al models. As <strong>the</strong>re is a limited <strong>on</strong>-board<br />
storage for <strong>the</strong> <str<strong>on</strong>g>OSIRIS</str<strong>on</strong>g> data <strong>the</strong> OS c<strong>on</strong>troller collapses <strong>the</strong> 32 rows of <strong>the</strong> CCD into a single output<br />
row; this may be d<strong>on</strong>e through ei<strong>the</strong>r <strong>on</strong>- or off-chip binning. However, even this procedure does not<br />
provide sufficient data compressi<strong>on</strong> nor ensure optimal signal to noise for <strong>the</strong> collected spectra. This is<br />
in fact achieved by using an automatic exposure algorithm that yields spectra with a typical count of<br />
8000 DN, <strong>the</strong> maximum count is 16383 DN, and a data throttle that ensures <strong>the</strong> available memory is<br />
not filled before <strong>the</strong> next data downlink at Esrange in nor<strong>the</strong>rn Sweden.<br />
<str<strong>on</strong>g>The</str<strong>on</strong>g> OS is sufficiently sensitive that it is possible to make auroral observati<strong>on</strong>s when <strong>the</strong> atmosphere<br />
is not illuminated and <strong>the</strong> optical axis of <strong>the</strong> spectrograph is tangent to <strong>the</strong> limb in <strong>the</strong> upper mesosphere.<br />
An example of such a spectrum acquired early in <strong>the</strong> missi<strong>on</strong> is shown in Fig. 5. <str<strong>on</strong>g>The</str<strong>on</strong>g> emissi<strong>on</strong>s at 391.4<br />
and 427.8 nm, <strong>the</strong> (0,0) and (0,1) bands of <strong>the</strong> N + 2 First Negative System (B2 + u ⇒ X2 + g ), as well as<br />
<strong>the</strong> atomic oxygen lines at 297.2, 557.7, and 630 nm are all clearly apparent and provide a valuable check<br />
<strong>on</strong> <strong>the</strong> relative resp<strong>on</strong>se of <strong>the</strong> spectrograph. <str<strong>on</strong>g>The</str<strong>on</strong>g> feature around 762 nm is a blend of <strong>the</strong> (3,1) band<br />
of <strong>the</strong> N2 First Positive (B3g ⇒ A3 + u ) System and <strong>the</strong> (0,0) band of <strong>the</strong> Oxygen <strong>Atmospheric</strong><br />
(b1 + g ⇒X3− g ) System. This blending clearly illustrates <strong>the</strong> difficulty in trying to determine <strong>the</strong><br />
auroral height profile of <strong>the</strong> oxygen emissi<strong>on</strong> with a simple rocket-borne filter photometer [18].<br />
© 2004 NRC Canada
418 Can. J. Phys. Vol. 82, 2004<br />
Fig. 4. False colour full-frame image showing <strong>the</strong> obvious structure associated with <strong>the</strong> OS slit.<br />
Fig. 5. Spectrograph image obtained over Antarctica with <strong>the</strong> <str<strong>on</strong>g>OSIRIS</str<strong>on</strong>g> line of sight fixed at a tangent<br />
altitude of 80 km. <str<strong>on</strong>g>The</str<strong>on</strong>g> obvious auroral features and <strong>the</strong> blending of <strong>the</strong> oxygen A-band with <strong>the</strong> N2 1PG<br />
feature is readily apparent. <str<strong>on</strong>g>The</str<strong>on</strong>g> absence of data in <strong>the</strong> regi<strong>on</strong> centered around 500 nm is due to <strong>the</strong> order<br />
sorter.<br />
4. <str<strong>on</strong>g>The</str<strong>on</strong>g> infrared imager (IRI)<br />
<str<strong>on</strong>g>The</str<strong>on</strong>g> IRI part of <str<strong>on</strong>g>OSIRIS</str<strong>on</strong>g>, also shown in Fig. 2, is actually three separate co-aligned single lens<br />
interference filter imagers operating at 1.263, 1.273, and 1.530 µm. <str<strong>on</strong>g>The</str<strong>on</strong>g> first two channels are intended<br />
primarily to map <strong>the</strong> molecular oxygen infrared atmospheric band emissi<strong>on</strong> (a 1g –X3− g ) in <strong>the</strong><br />
orbit plane. This airglow feature is excited in <strong>the</strong> daytime through <strong>the</strong> photolysis of oz<strong>on</strong>e, so that <strong>the</strong><br />
measured limb profiles lead directly to oz<strong>on</strong>e density profiles. <str<strong>on</strong>g>The</str<strong>on</strong>g> purpose of using two channels to<br />
detect <strong>the</strong> infrared atmospheric band, each channel has a different band capture fracti<strong>on</strong>, is to provide both<br />
redundancy and an improved correcti<strong>on</strong> for <strong>the</strong> absorpti<strong>on</strong> al<strong>on</strong>g <strong>the</strong> line-of-sight [19]. <str<strong>on</strong>g>The</str<strong>on</strong>g> 1.530 µm<br />
imager observes both Rayleigh- and aerosol-scattered sunlight and <strong>the</strong> (3–1) OH Meinel vibrati<strong>on</strong>–<br />
rotati<strong>on</strong> band airglow. <str<strong>on</strong>g>The</str<strong>on</strong>g> required vertical airglow profiles are obtained from a tomographic inversi<strong>on</strong><br />
of <strong>the</strong> measured limb profiles [19, 20].<br />
Each channel has a light baffle, a combined shutter and calibrati<strong>on</strong> source, a simple zinc selenide<br />
lens (<strong>the</strong> IR lenses are telecentric with a specially applied AR coating to reduce rms surface roughness),<br />
as well as an optical interference filter and a Sensors Unlimited InGaAs (Model SU128L) 128 element<br />
© 2004 NRC Canada
Llewellyn et al. 419<br />
Fig. 6. (a) A false colour plot of <strong>the</strong> twilight and nighttime image sequence for <strong>the</strong> 1.27 µm imager<br />
channel. (b) A false colour image showing <strong>the</strong> variati<strong>on</strong> of <strong>the</strong> oxygen infrared atmospheric band emissi<strong>on</strong><br />
profile al<strong>on</strong>g <strong>the</strong> orbit track.<br />
Table 1. IRI prelaunch calibrati<strong>on</strong> — units are<br />
phot<strong>on</strong>s/cm 2 4π sterad nm s for 1 DN.<br />
1.263µ 1.273µ 1.530µ<br />
4500 R/nm DN 4100 R/nm DN 1400 R/nm DN<br />
linear array. <str<strong>on</strong>g>The</str<strong>on</strong>g> lens diameter is 23 mm and has a focal length of approximately 50 mm. <str<strong>on</strong>g>The</str<strong>on</strong>g> vertical field<br />
of view for each channel is approximately 100 km with <strong>the</strong> IRI lower altitude limit located approximately<br />
10 km below <strong>the</strong> OS boresight. <str<strong>on</strong>g>The</str<strong>on</strong>g> detector dark current is c<strong>on</strong>tinuously m<strong>on</strong>itored through <strong>the</strong> use of<br />
masked pixels at <strong>on</strong>e end of each <strong>the</strong>rmoelectrically cooled array. <str<strong>on</strong>g>The</str<strong>on</strong>g> interference filters are mounted<br />
directly <strong>on</strong> to <strong>the</strong> <strong>the</strong>rmoelectric housing and so are also cooled with <strong>the</strong> result that <strong>the</strong> passbands are<br />
shifted from <strong>the</strong>ir room temperature values. Thus <strong>the</strong> calibrati<strong>on</strong> and characterizati<strong>on</strong> were made at a<br />
number of temperatures so that any changes in <strong>the</strong> filter passbands due to temperature change could<br />
be corrected. <str<strong>on</strong>g>The</str<strong>on</strong>g> short wavelength filters have nearly Gaussian passbands while <strong>the</strong> l<strong>on</strong>g wavelength<br />
channel has a square passband. As part of <strong>the</strong> calibrati<strong>on</strong> procedures <strong>the</strong> passbands were carefully<br />
checked for out-of-band rejecti<strong>on</strong>. <str<strong>on</strong>g>The</str<strong>on</strong>g> prelaunch calibrati<strong>on</strong> results of <strong>the</strong> three IRI channels, expressed<br />
as a typical single-pixel resp<strong>on</strong>se, are given in Table 1 for each of <strong>the</strong> channels. <str<strong>on</strong>g>The</str<strong>on</strong>g> estimated noise<br />
floor in each channel is approximately 5 DN. <str<strong>on</strong>g>The</str<strong>on</strong>g> postlaunch calibrati<strong>on</strong> and noise levels are in good<br />
agreement with <strong>the</strong> prelaunch values. One point that should be noted about an imaging <str<strong>on</strong>g>instrument</str<strong>on</strong>g> is that<br />
it is really many <str<strong>on</strong>g>instrument</str<strong>on</strong>g>s, equal to <strong>the</strong> number of pixels, and that <strong>the</strong> characterizati<strong>on</strong> and calibrati<strong>on</strong><br />
must recognize this fact.<br />
© 2004 NRC Canada
420 Can. J. Phys. Vol. 82, 2004<br />
As with <strong>the</strong> OS, stray light from bright off-axis signals are present in <strong>the</strong> observed signal; at <strong>the</strong><br />
highest altitudes <strong>the</strong> scattered-light signal can exceed <strong>the</strong> true signal. <str<strong>on</strong>g>The</str<strong>on</strong>g>re has been extensive analysis<br />
of <strong>the</strong> stray light effects [21] in <strong>the</strong> imager and preflight estimates of stray light rejecti<strong>on</strong> are in good<br />
agreement with <strong>the</strong> observed <strong>on</strong>-orbit performance [22]. <str<strong>on</strong>g>The</str<strong>on</strong>g> in-flight data are corrected for <strong>the</strong> scattered<br />
light levels <strong>on</strong> each array before <strong>the</strong> measurements are used with <strong>the</strong> developed data analysis algorithms.<br />
In actual flight operati<strong>on</strong>, <strong>the</strong> IRI is independent of <strong>the</strong> OS and makes1sexposures every 2 s. To optimize<br />
<strong>the</strong> tomographic procedures <strong>the</strong> satellite is operated in a stare mode, i.e., <strong>the</strong> IRI optic axis is held at<br />
a fixed tangent altitude for <strong>on</strong>e entire orbit each aer<strong>on</strong>omy observati<strong>on</strong> day. In normal operati<strong>on</strong>, <strong>the</strong><br />
satellite nods to provide <strong>the</strong> required limb scans for OS and <strong>the</strong> radiometer, although this complicates<br />
<strong>the</strong> tomographic analysis.<br />
<str<strong>on</strong>g>The</str<strong>on</strong>g> tomographic analysis procedures have been discussed by a number of authors [19, 20, 23–26]<br />
and <strong>the</strong> reader is directed to those works for <strong>the</strong> details. An example of an early missi<strong>on</strong> observati<strong>on</strong><br />
of <strong>the</strong> limb profiles and <strong>the</strong> tomographic retrievals for <strong>the</strong> oxygen infrared atmospheric band in <strong>the</strong><br />
twilight and nighttime porti<strong>on</strong>s of an orbit is shown in Fig. 6. <str<strong>on</strong>g>The</str<strong>on</strong>g> l<strong>on</strong>g evening decay of <strong>the</strong> emissi<strong>on</strong><br />
is clearly apparent while spatial structures in <strong>the</strong> nighttime emissi<strong>on</strong> are also seen. However, perhaps<br />
<strong>the</strong> most striking feature of <strong>the</strong>se observati<strong>on</strong>s is <strong>the</strong> structure associated with <strong>the</strong> twilight airglow; it<br />
is obviously far more complicated and detailed than that observed with a rocket photometer [27, 28].<br />
Indeed this difference between <strong>the</strong> limb profiles and <strong>the</strong> retrievals clearly illustrates <strong>the</strong> gross smoothing<br />
that is introduced with an “<strong>on</strong>i<strong>on</strong>-peel” type inversi<strong>on</strong>. <str<strong>on</strong>g>The</str<strong>on</strong>g> analysis of <strong>the</strong>se airglow structures with <strong>the</strong><br />
tomographic technique is <strong>the</strong> key to <strong>the</strong> major scientific c<strong>on</strong>tributi<strong>on</strong>s that are being provided by <strong>the</strong><br />
IRI observati<strong>on</strong>s.<br />
5. C<strong>on</strong>clusi<strong>on</strong>s<br />
It has been shown from a comparis<strong>on</strong> of <strong>the</strong> preflight and in-orbit performance that <strong>the</strong> design goals<br />
of <str<strong>on</strong>g>OSIRIS</str<strong>on</strong>g>, both <strong>the</strong> optical spectrograph and <strong>the</strong> infrared imager comp<strong>on</strong>ents, have been achieved.<br />
While <strong>the</strong> detailed scientific analysis is <strong>on</strong>ly just beginning it is clear that <strong>the</strong> data being collected in <strong>the</strong><br />
<strong>Odin</strong> missi<strong>on</strong> are of excellent quality. <str<strong>on</strong>g>The</str<strong>on</strong>g>se data will provide new opportunities to investigate, am<strong>on</strong>g<br />
o<strong>the</strong>r things, atmospheric species profiles, spatial structures, and dynamics.<br />
Acknowledgements<br />
<str<strong>on</strong>g>The</str<strong>on</strong>g> authors wish to thank <strong>the</strong> Natural Science and Engineering Research Council of Canada, <strong>the</strong><br />
Canadian SpaceAgency, <strong>the</strong> Canadian Network for Space Research, <strong>the</strong> Swedish Nati<strong>on</strong>al Space Board,<br />
and <strong>the</strong> Swedish Space Corporati<strong>on</strong> for <strong>the</strong>ir tireless support that has enabled <strong>Odin</strong> and <str<strong>on</strong>g>OSIRIS</str<strong>on</strong>g> to<br />
succeed. <strong>Odin</strong> is a Swedish-led satellite project funded jointly by Sweden (SNSB), Canada (CSA),<br />
France (CNES), and Finland (Tekes).<br />
References<br />
1. D. Murtagh, U. Frisk, F. Merino, M. Ridal, A. J<strong>on</strong>ss<strong>on</strong>, J. Stegman, G. Witt, P. Erikss<strong>on</strong>, C. Jiménez, G.<br />
Mégie, J. de la Nöe, P. Ricaud, P. Bar<strong>on</strong>, J.R. Pardo, A. Hauchcorne, E.J. Llewellyn, D.A. Degenstein,<br />
R.L. Gattinger, N.D. Lloyd, W.F.J. Evans, I.C. McDade, C.S. Haley, C. Sioris, C. v<strong>on</strong> Savigny, B.H.<br />
Solheim, J.C. McC<strong>on</strong>nell, K. Str<strong>on</strong>g, E.H. Richards<strong>on</strong>, G.W. Leppelmeier, E. Kyrölä, H. Auvinen, and L.<br />
Oikarinen. Can. J. Phys. 80, 309 (2002).<br />
2. G.D. Warshaw, D.-L. Deslauniers, and D. Degenstein. Optical design and performance of <strong>the</strong> <strong>Odin</strong><br />
UV/visible spectrograph and infrared imager <str<strong>on</strong>g>instrument</str<strong>on</strong>g>, 10th Annual AIAA/USU Small Satellite<br />
C<strong>on</strong>ference, Logan, Utah. 1996.<br />
3. E.J. Llewellyn, D.A. Degenstein, I.C. McDade, R.L. Gattinger, R. King, R. Buckingham, E.H.<br />
Richards<strong>on</strong>, D.P. Murtagh, W.F.J. Evans, B.H. Solheim, K. Str<strong>on</strong>g, and J.C. McC<strong>on</strong>nell. <str<strong>on</strong>g>OSIRIS</str<strong>on</strong>g> —<br />
an applicati<strong>on</strong> of tomography for absorbed emissi<strong>on</strong>s in remote sensing. Applicati<strong>on</strong>s of Phot<strong>on</strong>ic<br />
Technology 2, Edited by G.A. Lampropoulos and R.A. Lessard. Plenum Press, New York. 1997. pp.<br />
627–632.<br />
© 2004 NRC Canada
Llewellyn et al. 421<br />
4. C.A. McLinden, J.C. McC<strong>on</strong>nell, K. Str<strong>on</strong>g, I.C. McDade, R.L. Gattinger, R. King, B. Solheim, E.J.<br />
Llewellyn, and W.J.F. Evans. Can. J. Phys. 80, 469 (2002).<br />
5. W.G. Fastie. J. Opt. Soc. Am. 42, 641 (1952).<br />
6. D.J. McEwen and P. Chakrabaty. Adv. Space Res. 2(5), 209 (1982).<br />
7. G.R. Lemaitre. Astr<strong>on</strong>. Astrophys. 59, 249 (1977).<br />
8. G.R. Lemaitre and E. Harvey Richards<strong>on</strong>. SPIE, 3355, 682 (1998).<br />
9. D.E. Flittner, P.K. Bhartia and B.M. Herman. Geophys. Res. Lett. 27, 2601 (2000).<br />
10. C. v<strong>on</strong> Savigny. Ph.D. <strong>the</strong>sis, York University. Tor<strong>on</strong>to, Ont. 2002.<br />
11. C. v<strong>on</strong> Savigny, C.S. Haley, C.E. Sioris , I.C. McDade, E.J. Llewellyn, D. Degenstein, W.F.J. Evans,<br />
R.L. Gattinger, E. Griffoen, N. Lloyd, J.C. McC<strong>on</strong>nell, C.A. McLinden, D.P. Murtagh, B. Solheim, and<br />
K. Str<strong>on</strong>g. Geophys. Res. Lett. 30(14), 1755, doi:10.1029/2002GL016401, (2003).<br />
12. I.C. McDade, K. Str<strong>on</strong>g, C.S. Haley, J. Stegman, D.P. Murtagh, and E.J. Llewellyn. Can J. Phys. 80,<br />
395, (2002).<br />
13. C.E. Sioris, C.S. Haley, C.A. McLinden, C. v<strong>on</strong> Savigny, I.C. McDade, J.C. McC<strong>on</strong>nell, W.F.J. Evans,<br />
N.D. Lloyd, E.J. Llewellyn, K.V. Chance, T.P. Kurosu, D. Murtagh, U. Frisk, K. Pfeilsticker, H.<br />
Bösch, F. Weidner, K. Str<strong>on</strong>g, J. Stegman, and G. Mégie. J. Geophys. Res. 108(D7), 4215 (2003);<br />
doi:10.1029/2002JD002672.<br />
14. C.S. Haley, C. v<strong>on</strong> Savigny, S. Brohede, C.E. Sioris, I.C. McDade, E.J. Llewellyn, and D.P. Murtagh.<br />
Adv. Space Res. In press and available <strong>on</strong>line at http://www.sciencedirect.com<br />
15. K. Str<strong>on</strong>g, B. Joseph, R. Dosanjh, I.C. McDade, C.A. McLinden, J.C. McC<strong>on</strong>nell, J. Stegman, D.P.<br />
Murtagh, and E.J. Llewellyn. Can.J. Phys. 80, 409 (2002).<br />
16. J.P. Burrows, K.V. Chance, A.P.H. Goede, R. Guzzi, B.J. Kerridge, C. Muller, D. Perner, U. Platt, J.-P.<br />
Pommereau, W. Schneider, R.J. Spurr and H. van der Woerd. Global oz<strong>on</strong>e-m<strong>on</strong>itoring experiment:<br />
Interim science report. Report No. ESA SP-1151. Edited by T.D. Guyenne and C.J. Readings. ISBN<br />
92-9092-041-6 European Space Agency, 1993.<br />
17. <str<strong>on</strong>g>OSIRIS</str<strong>on</strong>g> <strong>on</strong> <strong>Odin</strong> web site. http://osirus.usask.ca. 2003.<br />
18. I.C. McDade, E.J. Llewellyn and F.R. Harris. Can. J. Phys. 63, 1322 (1985).<br />
19. D.A. Degenstein. Ph.D. <strong>the</strong>sis, University of Saskatchewan, Saskato<strong>on</strong>, Sask. 1999.<br />
20. D.A. Degenstein, E.J. Llewellyn, and N.D. Lloyd. Appl. Opt. 41, 1441 (2003).<br />
21. E.V. Ivanov. M.Sc. <strong>the</strong>sis, University of Saskatchewan, Saskato<strong>on</strong>, Sask. 2000.<br />
22. A.E. Bourassa. M.Sc. <strong>the</strong>sis, University of Saskatchewan, Saskato<strong>on</strong>, Sask. 2003.<br />
23. N.D. Lloyd and E.J. Llewellyn. Can. J. Phys. 67, 89 (1989).<br />
24. I.C. McDade, N.D. Lloyd and E.J. Llewellyn. Planet. Space Sci. 39, 895 (1991).<br />
25. I.C. McDade and E.J. Llewellyn. Can. J. Phys. 69, 1059 (1991).<br />
26. I.C. McDade and E.J. Llewellyn. Can. J. Phys. 71, 552 (1993).<br />
27. W.F.J. Evans, D.M. Hunten, E.J. Llewellyn, and A.V. J<strong>on</strong>es. J. Geophys. Res. 73, 2885 (1968).<br />
28. W.F.J. Evans, I.C. McDade, J. Yuen, and E.J. Llewellyn. Can. J. Phys. 66, 941 (1988).<br />
29. C. Leinert and D. Kluppelberg. Appl. Opt. 13, 556 (1974).<br />
Appendix A. OS baffle performance<br />
<str<strong>on</strong>g>The</str<strong>on</strong>g> intensity of <strong>the</strong> scattered sunlight at <strong>the</strong> limb of <strong>the</strong> <strong>Earth</strong> is str<strong>on</strong>gly altitude dependent, thus<br />
<strong>the</strong> input telescope and baffle must be capable of rejecting large off-axis signals that can c<strong>on</strong>taminate<br />
<strong>the</strong> true <strong>on</strong>-axis signals. Hence, a series simplified prelaunch baffle characterizati<strong>on</strong> tests were devised<br />
to measure <strong>the</strong> off-axis rejecti<strong>on</strong> ratios for <strong>the</strong> purpose of predicting <strong>on</strong>-orbit performance.<br />
<str<strong>on</strong>g>The</str<strong>on</strong>g> bidirecti<strong>on</strong>al reflectance distributi<strong>on</strong> functi<strong>on</strong>, BRDF(), which is <strong>the</strong> ratio of scattered light<br />
radiance at off-axis angle to <strong>the</strong> input irradiance, is defined as<br />
BRDF() = Radiance()<br />
Irradiance<br />
sr −1 = PS()<br />
PFM<br />
sr −1<br />
where PS() is <strong>the</strong> resp<strong>on</strong>se per pixel from off-axis scattered light, PF is <strong>the</strong> resp<strong>on</strong>se per pixel with<br />
<strong>the</strong> source in <strong>the</strong> field of view, and M is <strong>the</strong> mirror solid angle subtended at <strong>the</strong> test source. All of <strong>the</strong>se<br />
are directly measurable quantities.<br />
© 2004 NRC Canada
422 Can. J. Phys. Vol. 82, 2004<br />
Table A.1. UVIS baffle-scattered light<br />
c<strong>on</strong>tributi<strong>on</strong> to in-field signal, expressed as a<br />
fracti<strong>on</strong> of in-field signal.<br />
Tangent height 400 550 700<br />
(km) (nm) (nm) (nm)<br />
25 0.0034 0.0055 0.024<br />
40 0.018 0.034 0.14<br />
70 0.65 1.1 4.4<br />
<str<strong>on</strong>g>The</str<strong>on</strong>g> measured BRDF() of <strong>the</strong> spectrograph baffle, namely, <strong>the</strong> telescope mirror and <strong>the</strong> fold<br />
mirror that are <strong>the</strong> dominant scattering comp<strong>on</strong>ents in <strong>the</strong> baffle, was intermediate between <strong>the</strong> typical<br />
BRDF() for a freshly cleaned mirror and that for a slightly dusty mirror [29].<br />
<str<strong>on</strong>g>The</str<strong>on</strong>g> integrated scattered light level, expressed as a fracti<strong>on</strong> of <strong>the</strong> in-field signal, is given in Table<br />
A.1 for a number of wavelengths and for a number of limb tangent altitudes at a solar zenith distance<br />
of 80 ◦ . For <strong>the</strong> lower tangent heights and <strong>the</strong> shorter wavelengths <strong>the</strong> baffle c<strong>on</strong>tributi<strong>on</strong> is minor, but<br />
for <strong>the</strong> l<strong>on</strong>ger wavelengths and <strong>the</strong> higher tangent heights <strong>the</strong> c<strong>on</strong>tributi<strong>on</strong> from baffle-scattered light is<br />
much more serious.<br />
<str<strong>on</strong>g>The</str<strong>on</strong>g> measured <strong>on</strong>-orbit baffle performance is in satisfactory agreement with <strong>the</strong> estimates shown<br />
in Table A.1. However, methods for <strong>the</strong> measurement and removal of baffle-scattered light using <strong>the</strong><br />
in-flight data have been developed and are being applied to <strong>the</strong> collected observati<strong>on</strong>s. As a result, <strong>the</strong><br />
scientific objectives are not seriously impacted by <strong>the</strong> effects of baffle scattered light.<br />
© 2004 NRC Canada