CUPN Ozone and Foliar Injury Monitoring Protocol - NPS Inventory ...
CUPN Ozone and Foliar Injury Monitoring Protocol - NPS Inventory ...
CUPN Ozone and Foliar Injury Monitoring Protocol - NPS Inventory ...

Create successful ePaper yourself
Turn your PDF publications into a flip-book with our unique Google optimized e-Paper software.
National Park Service<br />
U.S. Department of the Interior<br />
Natural Resource Program Center<br />
A <strong>Protocol</strong> for <strong>Monitoring</strong> <strong>Ozone</strong> <strong>and</strong> <strong>Foliar</strong> <strong>Injury</strong><br />
throughout the Cumberl<strong>and</strong> Piedmont Network<br />
Natural Resource Report <strong>NPS</strong>/<strong>CUPN</strong>/NRR—2011/XXX
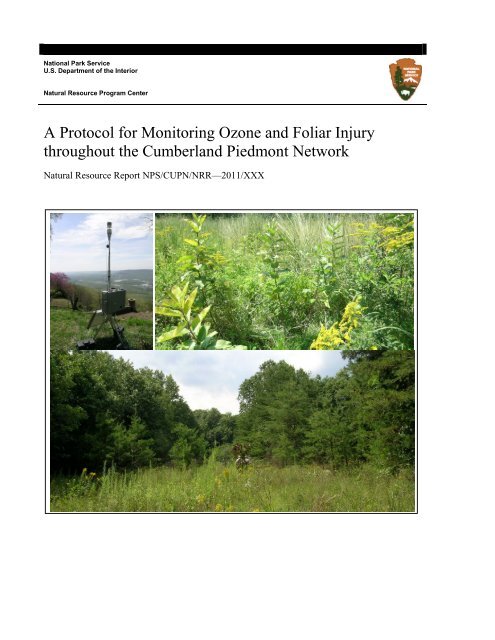
ON THE COVER<br />
(Clockwise starting at top-left) Portable <strong>Ozone</strong> <strong>Monitoring</strong> Station at CHCH in 2010, patch of common milkweed plants at<br />
MACA in 2010 <strong>and</strong> a foliar injury sampling site at ABLI in 2008.<br />
Photographs by: Johnathan Jernigan
A <strong>Protocol</strong> for <strong>Monitoring</strong> <strong>Ozone</strong> <strong>and</strong> <strong>Foliar</strong> <strong>Injury</strong><br />
throughout the Cumberl<strong>and</strong> Piedmont Network<br />
Natural Resource Report <strong>NPS</strong>/<strong>CUPN</strong>/NRR—2011/XXX<br />
Johnathan W. Jernigan<br />
National Park Service - Cumberl<strong>and</strong> Piedmont Network<br />
National Park Service - Air Resources Division<br />
Mammoth Cave National Park<br />
P.O. Box 7<br />
Mammoth Cave, KY 42259<br />
Bobby C. Carson<br />
National Park Service<br />
Mammoth Cave National Park<br />
P.O. Box 7<br />
Mammoth Cave, KY 42259<br />
Teresa Leibfreid<br />
National Park Service – Cumberl<strong>and</strong> Piedmont Network<br />
Mammoth Cave National Park<br />
P.O. Box 8<br />
Mammoth Cave, KY 42259<br />
mmmm 2011<br />
U.S. Department of the Interior<br />
National Park Service<br />
Natural Resource Program Center<br />
Fort Collins, Colorado<br />
i
The Natural Resource Publication series addresses natural resource topics that are of interest <strong>and</strong><br />
applicability to a broad readership in the National Park Service <strong>and</strong> to others in the management<br />
of natural resources, including the scientific community, the public, <strong>and</strong> the <strong>NPS</strong> conservation<br />
<strong>and</strong> environmental constituencies. Manuscripts are peer-reviewed to ensure that the information<br />
is scientifically credible, technically accurate, appropriately written for the intended audience,<br />
<strong>and</strong> is designed <strong>and</strong> published in a professional manner.<br />
Natural Resource Reports are the designated medium for disseminating high priority, current<br />
natural resource management information with managerial application. The series targets a<br />
general, diverse audience, <strong>and</strong> may contain <strong>NPS</strong> policy considerations or address sensitive issues<br />
of management applicability. Examples of the diverse array of reports published in this series<br />
include vital signs monitoring plans; monitoring protocols; "how to" resource management<br />
papers; proceedings of resource management workshops or conferences; annual reports of<br />
resource programs or divisions of the Natural Resource Program Center; resource action plans;<br />
fact sheets; <strong>and</strong> regularly-published newsletters.<br />
Views, statements, findings, conclusions, recommendations <strong>and</strong> data in this report are solely<br />
those of the author(s) <strong>and</strong> do not necessarily reflect views <strong>and</strong> policies of the U.S. Department of<br />
the Interior, <strong>NPS</strong>. Mention of trade names or commercial products does not constitute<br />
endorsement or recommendation for use by the National Park Service.<br />
Printed copies of reports in these series may be produced in a limited quantity <strong>and</strong> they are only<br />
available as long as the supply lasts. This report is also available from the Natural Resource<br />
Publications Management website (http://www.nature.nps.gov/publications/NRPM) on the<br />
Internet or by sending a request to the address on the back cover.<br />
Please cite this publication as:<br />
Jernigan, J.W., B.C. Carson <strong>and</strong> T. Leibfreid. 2011. A <strong>Protocol</strong> for <strong>Monitoring</strong> <strong>Ozone</strong> <strong>and</strong> <strong>Foliar</strong><br />
<strong>Injury</strong> throughout the Cumberl<strong>and</strong> Piedmont Network. Natural Resource Report<br />
<strong>NPS</strong>/<strong>CUPN</strong>/NRR—2011/XXX. National Park Service, Fort Collins, Colorado.<br />
<strong>NPS</strong> D-XXX, mmm 2011<br />
ii
Contents<br />
Background <strong>and</strong> Objectives .......................................................................................................... 11<br />
Issues Being Addressed <strong>and</strong> Rationale for <strong>Monitoring</strong> ......................................................... 12<br />
<strong>Ozone</strong> Effects ................................................................................................................................. 12<br />
Factors Affecting Plant Response to <strong>Ozone</strong> .................................................................................. 14<br />
Computing Exposure Indices ......................................................................................................... 14<br />
Thresholds for Exposure Indices ................................................................................................... 15<br />
Established Methods Used by this <strong>Protocol</strong> .................................................................................. 15<br />
Brief Description of the <strong>CUPN</strong>.............................................................................................. 15<br />
Historical Development of <strong>Ozone</strong> Concentration <strong>Monitoring</strong> within the <strong>CUPN</strong> .................. 16<br />
Historical Development of <strong>Foliar</strong> <strong>Injury</strong> <strong>Monitoring</strong> within the <strong>CUPN</strong> ............................... 19<br />
Measurable Objectives ........................................................................................................... 20<br />
Sampling Designs ......................................................................................................................... 21<br />
Sampling Design Overview - <strong>Ozone</strong> Concentration ............................................................. 21<br />
Sampling Design Overview - <strong>Foliar</strong> <strong>Injury</strong> Assessments ...................................................... 21<br />
Site <strong>and</strong> Species Selection ..................................................................................................... 22<br />
<strong>Ozone</strong> Sample Frequency <strong>and</strong> Replication ............................................................................ 23<br />
<strong>Foliar</strong> <strong>Injury</strong> Sample Frequency <strong>and</strong> Replication .................................................................. 23<br />
General Sampling Schedule ................................................................................................... 23<br />
Field Methods ............................................................................................................................... 11<br />
Preparations for <strong>Ozone</strong> Sampling .......................................................................................... 11<br />
Preparations for <strong>Foliar</strong> <strong>Injury</strong> Sampling ................................................................................ 12<br />
Sampling Methods – <strong>Ozone</strong> Concentration ........................................................................... 12<br />
Reasons for Choosing this Method Rather than Others ................................................................ 12<br />
Sampling Methods – <strong>Foliar</strong> <strong>Injury</strong> Assessments ................................................................... 13<br />
Voucher Specimens ....................................................................................................................... 13<br />
Photography of Voucher Specimens ............................................................................................. 14<br />
Reasons for Choosing this Method Rather than Others ................................................................ 16<br />
Data Management ......................................................................................................................... 16<br />
Overview of Database Design ............................................................................................... 16<br />
Data Processing ..................................................................................................................... 16<br />
Data Archiving ....................................................................................................................... 17<br />
Metadata Procedures .............................................................................................................. 17<br />
Analysis <strong>and</strong> Reporting ................................................................................................................. 17<br />
Data Analysis ......................................................................................................................... 17<br />
Reporting ............................................................................................................................... 18<br />
Personnel Requirements <strong>and</strong> Training .......................................................................................... 19<br />
Roles <strong>and</strong> Responsibilities ..................................................................................................... 19<br />
Qualifications <strong>and</strong> Training ................................................................................................... 19<br />
Operational Requirements ............................................................................................................ 19<br />
<strong>Ozone</strong> Field Schedule ............................................................................................................ 19<br />
<strong>Foliar</strong> <strong>Injury</strong> Field Schedule .................................................................................................. 20<br />
Combined <strong>Ozone</strong> <strong>and</strong> <strong>Foliar</strong> <strong>Injury</strong> Annual Workload ......................................................... 20<br />
Facility <strong>and</strong> Equipment Needs ............................................................................................... 21<br />
Startup <strong>and</strong> <strong>Monitoring</strong> Costs ................................................................................................ 21<br />
Page
Procedure for Revising the <strong>Protocol</strong> <strong>and</strong> Archiving Previous <strong>Protocol</strong> Versions ........................ 22<br />
References ..................................................................................................................................... 23<br />
Acknowledgments......................................................................................................................... 24<br />
St<strong>and</strong>ard Operating Procedure (SOP) #OC1: <strong>Ozone</strong> Concentration - Training of Field Personnel<br />
26<br />
St<strong>and</strong>ard Operating Procedure (SOP) #OC2: <strong>Ozone</strong> Concentration - Pre-Sampling ................... 27<br />
General Site Visit Preparation ............................................................................................... 28<br />
Scheduling Site Visits with Host Parks ................................................................................. 29<br />
Preparing a POMS for Use in the Upcoming Season ............................................................ 29<br />
Preparing to Install or Remove a POMS ............................................................................... 29<br />
POMS II Components .................................................................................................................... 29<br />
POMS III Components ................................................................................................................... 30<br />
Pre-trip Checklist ............................................................................................................................ 30<br />
St<strong>and</strong>ard Operating Procedure (SOP) #OC3: <strong>Ozone</strong> Concentration – Establishment <strong>and</strong> Location<br />
of Sampling Sites .................................................................................................................... 32<br />
Establishment of Sampling Sites ........................................................................................... 32<br />
Site Selection Criteria ............................................................................................................ 33<br />
St<strong>and</strong>ard Operating Procedure (SOP) #OC4: <strong>Ozone</strong> Concentration - Removing, Installing <strong>and</strong><br />
Servicing a Portable <strong>Ozone</strong> <strong>Monitoring</strong> Station ..................................................................... 35<br />
Assembly <strong>and</strong> Disassembly of a Second Generation POMS (POMS II) .............................. 35<br />
POMS II Assembly ......................................................................................................................... 35<br />
POMS II Disassembly .................................................................................................................... 38<br />
Assembly/Disassembly of a Third Generation POMS (POMS III) ....................................... 40<br />
Biweekly Maintenance Visits: Servicing an Installed Second or Third Generation POMS<br />
(POMS II or POMS III) .................................................................................................. 42<br />
POMS II Checklist .......................................................................................................................... 42<br />
POMS III Checklist ......................................................................................................................... 44<br />
Notes on Modes <strong>and</strong> Comm<strong>and</strong>s Used by the Campbell Scientific Datalogger in a POMS II<br />
........................................................................................................................................ 46<br />
Modes 47<br />
Flags 48<br />
St<strong>and</strong>ard Operating Procedure (SOP) #OC5: <strong>Ozone</strong> Concentration - Post-Sampling ................. 49<br />
Closing out a trip to move a Portable <strong>Ozone</strong> <strong>Monitoring</strong> Station (POMS) ........................... 49<br />
Storage of a POMS ................................................................................................................ 49<br />
St<strong>and</strong>ard Operating Procedure (SOP) #OC6: <strong>Ozone</strong> Concentration - Data Management ............ 50<br />
Introduction ............................................................................................................................ 50<br />
Data Validation ...................................................................................................................... 50<br />
Database Administration ....................................................................................................... 52<br />
Data Maintenance .......................................................................................................................... 52<br />
Data Organization .......................................................................................................................... 52<br />
Data Security <strong>and</strong> Integrity ............................................................................................................. 53<br />
Version Control .............................................................................................................................. 53<br />
Data Logs <strong>and</strong> Backups ................................................................................................................. 53<br />
Data Availability .................................................................................................................... 53<br />
Literature Cited ...................................................................................................................... 53<br />
St<strong>and</strong>ard Operating Procedure (SOP) #OC7: <strong>Ozone</strong> Concentration - Data Analysis .................. 54<br />
Data Flow ............................................................................................................................... 54<br />
Data Analysis ......................................................................................................................... 54<br />
NAAQS <strong>and</strong> Cumulative Exposure Indices .................................................................................... 56<br />
iv
Time Series <strong>and</strong> Diurnal Plots ....................................................................................................... 58<br />
St<strong>and</strong>ard Operating Procedure (SOP) #OC8: <strong>Ozone</strong> Concentration - Reporting ......................... 59<br />
Report Format ........................................................................................................................ 59<br />
General 59<br />
Tables 60<br />
Figures 60<br />
Pictures .......................................................................................................................................... 60<br />
Report Outline ................................................................................................................................ 60<br />
Review Procedure .................................................................................................................. 61<br />
Internal Review .............................................................................................................................. 61<br />
Park Review ................................................................................................................................... 62<br />
External Review ............................................................................................................................. 62<br />
Distribution Procedure ........................................................................................................... 62<br />
Identifying Stakeholders ................................................................................................................. 62<br />
Distributing Reports ........................................................................................................................ 62<br />
Literature Cited ...................................................................................................................... 63<br />
St<strong>and</strong>ard Operating Procedure (SOP) #OC9: <strong>Ozone</strong> Concentration - Revising the <strong>Protocol</strong> ...... 64<br />
Procedures .............................................................................................................................. 64<br />
St<strong>and</strong>ard Operating Procedure (SOP) #FoIn1: <strong>Foliar</strong> <strong>Injury</strong> - Training of Field Personnel ......... 66<br />
St<strong>and</strong>ard Operating Procedure (SOP) #FoIn2: <strong>Foliar</strong> <strong>Injury</strong> - Pre-Sampling ............................... 67<br />
USFS Workshop/Certification <strong>and</strong> <strong>NPS</strong>-ARD Online Training ........................................... 67<br />
General Site Visit Preparation ............................................................................................... 68<br />
St<strong>and</strong>ard Operating Procedure (SOP) #FoIn3: <strong>Foliar</strong> <strong>Injury</strong> - Establishment <strong>and</strong> Location of<br />
Sampling Sites ........................................................................................................................ 69<br />
Establishment of Sampling Sites ........................................................................................... 69<br />
St<strong>and</strong>ard Operating Procedure (SOP) #FoIn4: <strong>Foliar</strong> <strong>Injury</strong> - Sampling ..................................... 70<br />
<strong>Foliar</strong> <strong>Injury</strong> Sampling Procedure ......................................................................................... 70<br />
St<strong>and</strong>ard Operating Procedure (SOP) #FoIn5: <strong>Foliar</strong> <strong>Injury</strong> - Post-Sampling ............................. 76<br />
St<strong>and</strong>ard Operating Procedure (SOP) #FoIn6: <strong>Foliar</strong> <strong>Injury</strong> – Data Management ....................... 77<br />
Introduction ............................................................................................................................ 77<br />
Data Entry, Verification, Validation. ..................................................................................... 78<br />
Database Administration ....................................................................................................... 78<br />
Data Maintenance .......................................................................................................................... 78<br />
Data Organization .......................................................................................................................... 78<br />
Data Security <strong>and</strong> Integrity ............................................................................................................. 79<br />
Version Control .............................................................................................................................. 79<br />
Data Logs <strong>and</strong> Backups ................................................................................................................. 79<br />
Data Availability .................................................................................................................... 80<br />
Literature Cited ...................................................................................................................... 80<br />
St<strong>and</strong>ard Operating Procedure (SOP) #FoIn7: <strong>Foliar</strong> <strong>Injury</strong> - Data Analysis .............................. 81<br />
Data Flow <strong>and</strong> Data Analysis ................................................................................................ 81<br />
St<strong>and</strong>ard Operating Procedure (SOP) #FoIn8: <strong>Foliar</strong> <strong>Injury</strong> - Reporting ..................................... 83<br />
Report Format ......................................................................... Error! Bookmark not defined.<br />
General Error! Bookmark not defined.<br />
Tables Error! Bookmark not defined.<br />
Figures Error! Bookmark not defined.<br />
Pictures ............................................................................................ Error! Bookmark not defined.<br />
Report Outline .................................................................................. Error! Bookmark not defined.<br />
Review Procedure ................................................................... Error! Bookmark not defined.<br />
Internal Review ................................................................................ Error! Bookmark not defined.<br />
v
Park Review ..................................................................................... Error! Bookmark not defined.<br />
External Review ............................................................................... Error! Bookmark not defined.<br />
Distribution Procedure ............................................................ Error! Bookmark not defined.<br />
Identifying Stakeholders ................................................................... Error! Bookmark not defined.<br />
Distributing Reports .......................................................................... Error! Bookmark not defined.<br />
Literature Cited ....................................................................... Error! Bookmark not defined.<br />
St<strong>and</strong>ard Operating Procedure (SOP) #FoIn9: <strong>Foliar</strong> <strong>Injury</strong> - Revising the <strong>Protocol</strong> .................. 84<br />
vi
Background <strong>and</strong> Objectives<br />
Ground level (tropospheric) ozone is a secondary pollutant, meaning that ozone is not directly<br />
emitted by sources, but is created through chemical reactions between primary pollutants that are<br />
emitted directly from sources such as power plants, automobiles <strong>and</strong> factories (Great Smoky<br />
Mountains National Park 2006). The U.S. Environmental Protection Agency (EPA) maintains<br />
that ozone is “Good up high, bad nearby” (EPA 2003). This is because, up high (in the<br />
stratosphere), the ozone layer protects Earth from ultraviolet radiation. Down low (in the<br />
troposphere), however, higher concentrations of ozone are undesirable since breathing ozone is<br />
harmful to humans.<br />
Figure 1. <strong>Foliar</strong> injury on spreading dogbane. Photo was copied from Kohut (2007).<br />
Figure 2 – Close-up of ozone injury on common milkweed. Image downloaded from the USFS website<br />
http://nrs.fs.fed.us/fia/topics/ozone/default.asp.<br />
<strong>Ozone</strong> also damages plants <strong>and</strong> crops (EPA 2003). An example of an ozone-injured plant leaf is<br />
shown in Figure 1. The image was copied from Kohut (2007). Figure 2 shows a close-up of<br />
foliar injury on common milkweed (downloaded from the United States Forest Service (USFS)<br />
website). Each of the small spots on the leaves is ozone injury. In comparison, the leaf shown in<br />
Figure 3 (downloaded from http://www.geo.sunysb.edu/bad-ozone/index.html) also exhibits<br />
ozone injury, but, on the sweet gum leaf, injury manifests itself as something that looks more<br />
like fall color. So, the appearance of ozone injury varies amongst species.<br />
11
Figure 3 – <strong>Ozone</strong> injury on a sweet gum leaf. Note the uninjured portion of the second leaf in<br />
the upper-right section of the image. That portion of the second leaf was shaded by the first leaf.<br />
Image downloaded from http://www.geo.sunysb.edu/bad-ozone/index.html.<br />
Sensitivity to ozone also varies amongst species (Rose <strong>and</strong> Coulston 2009) <strong>and</strong> runs the gamut<br />
from not being sensitive at all to being very sensitive. For example, black cherry (Prunus<br />
serotina) <strong>and</strong> several blackberry species (Rubus spp.) are sensitive to ozone while white oak<br />
(Quercus alba) is not (Smith et al 2007).<br />
The objective of this protocol is to provide the Cumberl<strong>and</strong> Piedmont Network (<strong>CUPN</strong>) <strong>and</strong> its<br />
parks with ozone concentration <strong>and</strong> injury data. The data collected will primarily address two<br />
questions: are ozone concentrations high enough to cause injury to plants <strong>and</strong> is that injury<br />
occurring? Ancillary issues, such as whether ozone concentrations are high enough to violate<br />
human health st<strong>and</strong>ards, will also be explored.<br />
This protocol is divided into two sets of sampling designs <strong>and</strong> methodologies. The first set of<br />
designs/methodologies provides ozone concentration data in <strong>CUPN</strong> parks using established<br />
methods. The SOPs for this set of designs/methodologies use the prefix “OC”. The second set<br />
provides foliar injury data (with the validity of its data being supported using voucher<br />
specimens) in <strong>CUPN</strong> parks using established methods. The SOPs for this set of<br />
designs/methodologies use the prefix “FoIn”. When these two data sets are collected over<br />
multiple years, correlation between ozone concentration <strong>and</strong> severity of foliar injury may be<br />
explored. The <strong>NPS</strong> <strong>and</strong> policymakers may use this information to prescribe actions that may, at<br />
the least, reduce ozone injury to plants.<br />
Issues Being Addressed <strong>and</strong> Rationale for <strong>Monitoring</strong><br />
<strong>Ozone</strong> is formed through chemical reactions between nitrogen oxides <strong>and</strong> volatile organic<br />
compounds (both of which are emitted by anthropogenic sources such as automobiles, power<br />
plants <strong>and</strong> factories). Volatile organic compounds are also emitted by plants (Ray 2004). The<br />
chemical reactions are catalyzed by sunlight, resulting in generally higher concentrations of<br />
ozone during summer.<br />
<strong>Ozone</strong> Effects<br />
Ray (2004) lists several ways that ozone negatively affects human health. What follows is a<br />
verbatim list of the effects listed by Ray (2004).<br />
• Acute respiratory problems, such as<br />
o Aggravation of asthma<br />
12
o Temporary decreases in lung capacity in some adults<br />
o Inflammation of lung tissue<br />
• Impairment of the body’s immune system<br />
Vegetation is also negatively affected by ozone. Extensive research (such as exposing plants to<br />
various concentrations of ozone in gas chambers <strong>and</strong> observing the plants’ responses) has shown<br />
that ozone causes the stipple shown in Figure 1 as well as the other effects listed in the overview<br />
(Negra et al 2009). Several species have been examined <strong>and</strong> it has been determined that<br />
different species (<strong>and</strong> even different individuals within the same species) have different<br />
tolerances to ozone. That is, some species are generally more able than others to withst<strong>and</strong><br />
higher ozone exposure.<br />
While many studies of plant response to ozone have been undertaken in controlled laboratory<br />
settings, plant response has also been studied in natural settings. Ray (2004) notes that these<br />
studies have shown that foliar injury occurs at levels well below EPA’s air quality st<strong>and</strong>ard. In<br />
addition, Ray (2004) notes that studies have documented foliar injury in national parks. Even<br />
some of <strong>CUPN</strong>’s assessments (conducted using the draft version of this protocol) in 2008 <strong>and</strong><br />
2009, have shown that foliar injury is occurring in <strong>CUPN</strong> parks (Jernigan et al 2009 <strong>and</strong> Jernigan<br />
et al 2010).<br />
Figure 4 – Map showing loss of black cherry in forests as a result of ozone injury. Image downloaded<br />
from http://www.nature.nps.gov/air/aqbasics/TreeGrowth/index.cfm.<br />
13
Ray (2004) states that ozone enters leaf stomata <strong>and</strong> oxidizes plant tissue. This exposure results<br />
in changes to biochemical <strong>and</strong> physiological processes. Ray (2004) also states that severe cases<br />
of foliar injury can lead to growth effects to particular plants <strong>and</strong> that long-term exposure to such<br />
plants can lead to shifts in species composition wherein more sensitive species are replaced by<br />
less sensitive species. For example, note the black cherry decline shown in Figure 4<br />
(downloaded from http://www.nature.nps.gov/air/aqbasics/TreeGrowth/index.cfm). Grantz<br />
(2009) further indicates that the exact nature of changes in species composition is reliant not only<br />
on ozone concentration but also on other complicating factors.<br />
Factors Affecting Plant Response to <strong>Ozone</strong><br />
Simply having sensitive plants in the presence of high levels of ozone does not guarantee that<br />
those plants will be damaged by ozone. There are conditions under which sensitive plants may<br />
not be significantly affected even with high ozone exposure. This is a consequence of the need<br />
for ozone gas to enter the interior of the leaf through the stomata. If environmental conditions<br />
are not favorable for gas exchange, foliar injury is less likely to occur. Two conditions that lead<br />
to a decrease in gas exchange are high air temperature <strong>and</strong> drought. Plants in hot <strong>and</strong> dry (low<br />
soil moisture) conditions may close their stomata, resulting in less ozone within the leaf interior<br />
<strong>and</strong>, therefore, less exposure of the plant to ozone (Kohut 2005).<br />
Conversely, ozone injury can be exacerbated under certain conditions. For example, if moisture<br />
availability is above average when ozone concentration is only average, injury to a plant can be<br />
similar to injury under average moisture availability <strong>and</strong> above average ozone concentration.<br />
Ray (2004) lists the following as factors that can enhance the risk of ozone injury:<br />
• Existence of sensitive species<br />
• <strong>Ozone</strong> concentrations high enough to cause injury<br />
• Environmental conditions that support plant respiration<br />
Computing Exposure Indices<br />
Ray (2004) notes that to quantify the likelihood that a plant will be damaged by ozone, indices<br />
have been developed (the SUM06, W126 <strong>and</strong> N100). In the past, the <strong>CUPN</strong> has used the<br />
SUM06. However, the EPA is considering the strengthening of its secondary st<strong>and</strong>ard (whose<br />
purpose is to be protective of plants <strong>and</strong> natural ecosystems). That strengthened st<strong>and</strong>ard will be<br />
based upon the W126. As such, the <strong>CUPN</strong> will begin using the W126 statistic when analyzing<br />
ozone <strong>and</strong> foliar injury data. Ray (2004) defines the W126 as “a cumulative index that is<br />
calculated as the maximum running 90-day sum of the 0800-2000 weighted hourly ozone<br />
concentrations, where a sigmoidal weighting function is used to give increasing significance<br />
(weights between 0 <strong>and</strong> 1) to concentrations of ozone greater than 0.04 ppm, <strong>and</strong> no weight to<br />
concentrations below 0.04 ppm.”<br />
The W126 may be computed using only values from 8 AM to 8 PM (the hourly values reported<br />
for 8 AM to 7 PM, inclusively). It may also be computed using all data available, including<br />
nighttime data. The W126 over a given period of time is defined by the equation<br />
14
where ci is the hourly ozone concentration expressed in ppb <strong>and</strong> n is the number of hours with<br />
valid ozone measurements. The equation is based on the information in the presentation found at<br />
http://www.epa.gov/ttn/analysis/docs/W126_Steps%20to%20Calculate_revised_Mar9.pdf.<br />
Frequently, the W126 is computed for each possible 3 consecutive month period in the growing<br />
season <strong>and</strong> the largest of those values is taken as the W126 for the season. We will also compute<br />
the W126 simply by computing the summation above for the entire growing season. The <strong>CUPN</strong><br />
will compute these W126 values for its annual reports by following the guidelines posted at<br />
http://www.epa.gov/ttn/analysis/w126.htm. However, we will not, in general, be able to<br />
compute a 3-year average of the W126 since we will only be collecting ozone concentration data<br />
for one year at a time.<br />
Thresholds for Exposure Indices<br />
Ray (2004) also provides estimates for W126 threshold values above which effects to plant<br />
health can be expected. Ray’s W126 estimates include accompanying N100 thresholds. Those<br />
N100 statistics will not be considered by the <strong>CUPN</strong> since the EPA’s proposed secondary<br />
st<strong>and</strong>ard is based only upon the W126 (see<br />
http://www.epa.gov/groundlevelozone/fr/20100119.pdf for more information). Ray’s W126<br />
thresholds are:<br />
W126 N100<br />
Highly Sensitive Species 5.9 ppm-hr 6<br />
Moderately Sensitive Species 23.8 ppm-hr 51<br />
Low Sensitivity 66.6 ppm-hr 135<br />
In 2010, the EPA proposed that the secondary st<strong>and</strong>ard no longer be the same as the primary<br />
st<strong>and</strong>ard. According to <strong>NPS</strong>-AIR (2010), that st<strong>and</strong>ard would prescribe a W126 value between 7<br />
<strong>and</strong> 15 ppm-hours. The EPA is also proposing a method for computing the W126 that would be<br />
based on a 3-year average rather than an annual value. Since at each park the <strong>CUPN</strong> will only<br />
measure ozone for one year at a time, the <strong>CUPN</strong> will only be able to compute annual W126<br />
values. Further discussion of ozone, ozone exposure indices <strong>and</strong> foliar injury may be found in<br />
U.S. Forest Service et al (2010).<br />
Established Methods Used by this <strong>Protocol</strong><br />
The literature available on ozone <strong>and</strong> foliar injury is myriad. A comprehensive review of this<br />
literature is beyond the scope of this proposal. As such, the authors will primarily discuss only<br />
those documents which are directly influential to our sampling designs <strong>and</strong> methods. Those are<br />
Kohut (2007), Ray (2004) <strong>and</strong> the USFS’ st<strong>and</strong>ard operating procedure for conducting foliar<br />
injury surveys (USFS 2005). Our ozone monitoring SOPs are based upon the work by Ray. Our<br />
foliar injury sampling SOPs are based upon the USFS protocol <strong>and</strong> are influenced by the Kohut<br />
protocol.<br />
Brief Description of the <strong>CUPN</strong><br />
The Cumberl<strong>and</strong> Piedmont Network (<strong>CUPN</strong>) is part of the <strong>NPS</strong> <strong>Inventory</strong> <strong>and</strong> <strong>Monitoring</strong><br />
Program. The <strong>CUPN</strong> contains parks with a varying mix of natural <strong>and</strong> cultural resources. It is<br />
comprised of the fourteen parks listed in Table 1. Park abbreviations as used throughout this<br />
15
protocol are also listed in Table 1. Figure 5 is a map showing the locations of the fourteen parks<br />
(Leibfreid et al 2005).<br />
Table 1 – List of <strong>CUPN</strong> parks <strong>and</strong> their abbreviations.<br />
Park Name Abreviation<br />
Abraham Lincoln Birthplace National Historic Site ABLI<br />
Carl S<strong>and</strong>burg Home National Historic Park CARL<br />
Chickamauga & Chattanooga National Military Park CHCH<br />
Cowpens National Battlefield COWP<br />
Cumberl<strong>and</strong> Gap National Historical Park CUGA<br />
Fort Donelson National Battlefield FODO<br />
Guilford Courthouse National Military Park GUCO<br />
King’s Mountain National Military Park KIMO<br />
Little River Canyon National Preserve LIRI<br />
Mammoth Cave National Park MACA<br />
Ninety-Six National Historic Site NISI<br />
Russell Cave National Monument RUCA<br />
Shiloh National Military Park SHIL<br />
Stones River National Battlefield STRI<br />
Figure 5. <strong>NPS</strong> units that make up the <strong>CUPN</strong>.<br />
Sampling in Cultural <strong>and</strong> Historical Parks<br />
All of <strong>CUPN</strong>’s parks have significant cultural resources, <strong>and</strong>, for many of those parks, cultural<br />
<strong>and</strong> historical preservation is the primary objective. <strong>Ozone</strong> is nevertheless a concern at those<br />
parks. The <strong>NPS</strong> maintains cultural l<strong>and</strong>scapes just as it preserves <strong>and</strong> protects natural<br />
ecosystems, <strong>and</strong> ozone can cause damage to plants that are part of a cultural l<strong>and</strong>scape. For<br />
more information on cultural l<strong>and</strong>scapes <strong>and</strong> <strong>NPS</strong> efforts to maintain them, see<br />
http://www.cr.nps.gov/hps/tps/briefs/brief36.htm.<br />
Management at most cultural <strong>and</strong> historical parks is concerned with acid rain since it can<br />
dissolve historic structures such as limestone grave markers, buildings <strong>and</strong> monuments. Most of<br />
these parks do not have the resources to monitor acid rain or its causes (pollutants consisting<br />
primarily of sulfur <strong>and</strong> nitrogen compounds). <strong>Ozone</strong> is a good surrogate for nitrogen<br />
compounds. Since “clean” air masses generally don’t contain excessive amounts of ozone, it can<br />
be assumed that if ozone is low then it is likely that nitrogen compounds will be as well<br />
(assuming that ozone is not reacting with other precursor emissions <strong>and</strong> being consumed). So, in<br />
16
order to lower ozone concentrations, nitrogen compounds must be lowered. That is, efforts to<br />
lower ozone should result in less acidic rainfall thereby reducing impacts to structures in historic<br />
<strong>and</strong> cultural parks.<br />
Historical Development of <strong>Ozone</strong> Concentration <strong>Monitoring</strong> within the <strong>CUPN</strong><br />
There were two parks in the Cumberl<strong>and</strong> Piedmont Network with ozone monitors in operation<br />
prior to the implementation of its Vital Signs <strong>Monitoring</strong> program: COWP <strong>and</strong> MACA. Prior to<br />
2004, no extensive sampling of ozone had taken place on the remaining twelve parks. In 2004,<br />
pilot studies were initiated by the <strong>CUPN</strong>. During that year, only ozone concentration sampling<br />
(no foliar injury sampling) was completed. Two methodologies were used: passive ozone<br />
samplers (Figure 6) were used for most of the summer at each of the fourteen parks <strong>and</strong> a<br />
modified version of a Portable <strong>Ozone</strong> <strong>Monitoring</strong> Station (POMS) was used for a few weeks<br />
each at LIRI <strong>and</strong> RUCA. A POMS is shown in Figure 7. At most of the parks, multiple passive<br />
sites were used primarily to assess spatial variance in ozone concentrations <strong>and</strong> to explore the<br />
correlation between ozone concentration <strong>and</strong> elevation. In 2005, 2004’s passive monitoring was<br />
continued (with a few deletions/additions of sampling sites), but the intensity of POMS sampling<br />
was greatly increased. Two dedicated POMS units (each of which included air temperature <strong>and</strong><br />
relative humidity sensors) were rotated amongst a total of eleven <strong>CUPN</strong> sites (one of these<br />
eleven was a non-<strong>NPS</strong> site that was very near to a <strong>CUPN</strong> park). For most sites, the POMS was<br />
collocated with a passive sampler.<br />
Table 2. <strong>Ozone</strong> monitoring history for the <strong>CUPN</strong>. Values in parentheses indicate the number of<br />
monitoring units in the park.<br />
Park Year 2004 Year 2005 Year 2006 Year 2007<br />
ABLI Passive (2) Passive (3)<br />
POMS (1)<br />
POMS (1) POMS (1)<br />
CARL Passive (2) Passive (1)<br />
POMS (1)<br />
-- --<br />
CHCH Passive (2) Passive (2)<br />
POMS (1)<br />
-- --<br />
COWP Passive (2)<br />
Continuous (1)<br />
Continuous (1) Continuous (1) Continuous (1)<br />
CUGA Passive (2) Passive (3)<br />
POMS (1)<br />
POMS (1) POMS (1)<br />
FODO Passive (1) Passive (2)<br />
POMS (1)<br />
-- --<br />
GUCO Passive (1) -- -- --<br />
KIMO Passive (1) POMS (1) -- --<br />
LIRI Passive (2)<br />
POMS (1)<br />
Passive (1) -- --<br />
MACA Passive (9) Passive (8) Continuous (1) Continuous (1)<br />
POMS (2) POMS (1)<br />
Continuous (1) Continuous (1)<br />
NISI Passive (1) Passive (1)<br />
POMS (1)<br />
-- --<br />
RUCA Passive (1)<br />
POMS (1)<br />
Passive (1) -- --<br />
SHIL Passive (1) Passive (2)<br />
POMS (1)<br />
-- --<br />
STRI Passive (2) Passive (2)<br />
POMS (1)<br />
-- --<br />
Remaining in place for three weeks at each site, the POMS measured diurnal variability that<br />
could not be detected using the passive devices. The POMS data were also used to “double-<br />
17
check” the data from the passive devices. The passive units were dropped beginning in 2006, but<br />
POMS sampling in ABLI <strong>and</strong> CUGA was continued by <strong>NPS</strong>-ARD in both 2006 <strong>and</strong> 2007. A<br />
summary of the sampling completed from 2004 to 2007 within the <strong>CUPN</strong> is presented in Table<br />
2.<br />
In 2008, the <strong>CUPN</strong> began implementation of the draft version of this protocol. That draft<br />
version stated that ozone sampling would occur at two parks per year using one POMS. So, a<br />
POMS would be at a site only for part of the ozone season <strong>and</strong> data for the remainder of the<br />
ozone season would need to be estimated. This estimation would be based upon a mathematical<br />
model derived from the observed relationship between the POMS data <strong>and</strong> data from the “best”<br />
nearby state-operated monitor. Identification of the “best” monitor was to be based upon<br />
regression analysis of the POMS data <strong>and</strong> state-operated monitor data (the site with the best Rsquared<br />
would be considered the “best” site). This approach has been ab<strong>and</strong>oned in favor of<br />
collecting data for the entire ozone season at each park, thereby necessitating the use of two<br />
POMS units per year rather than only one.<br />
Figure 6. Passive sampler at MACA.<br />
The <strong>CUPN</strong> did not take delivery of its own POMS until 2009. So, in 2008, the <strong>CUPN</strong> could not<br />
sample for ozone at its target parks for that year (namely ABLI, CUGA <strong>and</strong> MACA).<br />
Fortunately, CUGA was running a POMS that was <strong>and</strong> continues to be on loan from <strong>NPS</strong>-ARD,<br />
<strong>and</strong> MACA, in partnership with <strong>NPS</strong>-ARD, maintains its own monitoring station. In 2009, the<br />
<strong>CUPN</strong> used its POMS to sample at FODO <strong>and</strong> SHIL. In May 2010, the <strong>CUPN</strong> was able to<br />
borrow a second POMS that was in the possession of the <strong>Inventory</strong> <strong>and</strong> <strong>Monitoring</strong> Program’s<br />
Gulf Coast Network <strong>and</strong> sample for nearly the entire ozone season at each of two parks (CHCH<br />
<strong>and</strong> STRI).<br />
18
Figure 7. POMS located at MACA. This POMS was maintained by MACA <strong>and</strong> funded by <strong>NPS</strong>-ARD.<br />
Historical Development of <strong>Foliar</strong> <strong>Injury</strong> <strong>Monitoring</strong> within the <strong>CUPN</strong><br />
Prior to 2006, the <strong>CUPN</strong> had made no attempt to do any sort of foliar injury assessment. <strong>Foliar</strong><br />
injury assessments had been completed on MACA in 1985 <strong>and</strong> 1986, but these assessments were<br />
part of a short-term study <strong>and</strong> were not part of long-term monitoring activities (McCune et al<br />
1987).<br />
Figure 8 – Tree climber (circled) during the 2006 Kohut pilot assessment at MACA.<br />
In early 2006, <strong>NPS</strong>-ARD worked with Dr. Robert Kohut from Cornell University to initiate some<br />
pilot foliar assessments as designed by Dr. Kohut [see Kohut (2005) for specifics on sampling<br />
19
designs <strong>and</strong> methodologies]. <strong>CUPN</strong> <strong>and</strong> MACA staff (along with staff from other parks <strong>and</strong><br />
networks) participated in conference calls with <strong>NPS</strong>-ARD personnel <strong>and</strong> Dr. Kohut to discuss<br />
these pilot assessments. It was decided that, with the help of Dr. Kohut, three <strong>CUPN</strong> parks<br />
(COWP, CUGA, <strong>and</strong> MACA) would participate in the pilot assessments. Through the<br />
collaborative efforts of <strong>CUPN</strong> staff, park staff, <strong>and</strong> Dr. Kohut, foliar injury sampling was<br />
completed in the summer of 2006. One of Kohut’s sampling designs (the one attempted by the<br />
<strong>CUPN</strong> during the pilot) required that branches be removed for examination from the crowns of<br />
very large trees. In Figure 8, note the tree climber near the top of a very tall tree.<br />
No foliar assessments were completed in 2007. MACA staff intended to conduct injury surveys,<br />
but drought conditions suggested the absence of ozone injury symptoms, <strong>and</strong> it was informally<br />
decided that no surveys would be conducted. It should be noted that, when monitoring as<br />
prescribed by this protocol, parks should be sampled without regard to the drought index at the<br />
time when sampling is to be completed. In 2007, this protocol had not been officially<br />
implemented.<br />
Figure 9 – Sammi Jo Eubank (<strong>CUPN</strong> staff) examining a sweet gum tree for foliar injury using USFS<br />
methods.<br />
In 2008, the <strong>CUPN</strong> began implementation of the draft version of this protocol. Specifics of the<br />
foliar injury sampling designs <strong>and</strong> methods are discussed in more detail later in this narrative. In<br />
2008, parks sampled were ABLI, CUGA <strong>and</strong> MACA. COWP, FODO, MACA <strong>and</strong> SHIL were<br />
sampled in 2009 while 2010 sampling consisted of CHCH, MACA <strong>and</strong> STRI. Figure 9 shows<br />
<strong>CUPN</strong> staff during 2009 foliar injury sampling at FODO.<br />
Measurable Objectives<br />
The objective of the <strong>CUPN</strong> ozone <strong>and</strong> foliar injury protocol is to measure ozone exposure in<br />
each of the fourteen <strong>CUPN</strong> parks (about two per year), <strong>and</strong> ascertain the presence/absence of<br />
foliar injury at select sites within those parks where ozone concentration data are being collected.<br />
The specific monitoring questions that will be addressed by this protocol include:<br />
20
1. What is the cumulative ozone exposure in <strong>CUPN</strong> parks during a typical April-October<br />
growing period?<br />
2. What is the trend in cumulative ozone exposure in <strong>CUPN</strong> parks across time (years)?<br />
3. At select <strong>CUPN</strong> parks in any given year, is foliar injury occurring?<br />
4. What are the trends in foliar injury occurrence <strong>and</strong> severity?<br />
The specific monitoring objectives that will be addressed in this protocol include:<br />
1. Determine the cumulative ozone exposure levels for at least two <strong>CUPN</strong> parks per year.<br />
2. In at least two <strong>CUPN</strong> parks per year, use established biomonitoring methodologies to detect<br />
the presence/absence (<strong>and</strong>, if present, to quantify the amount <strong>and</strong> severity) of foliar injury.<br />
Sampling Designs<br />
Sampling Design Overview - <strong>Ozone</strong> Concentration<br />
<strong>Ozone</strong> sampling with a POMS will take place at two parks per year as shown in Table 4. Data<br />
are collected hourly. One POMS will be stationed at each of the two parks to run through the<br />
entire growing season, thereby allowing the computation of a W126 (<strong>and</strong> a SUM06) for each<br />
park. 8-hour averages will also be computed for comparison to the current National Ambient Air<br />
Quality St<strong>and</strong>ard (NAAQS) for ozone. The current NAAQS may be found at<br />
http://www.epa.gov/air/criteria.html. Other analyses will also be conducted using the data <strong>and</strong><br />
the results presented in annual <strong>and</strong> 5-year reports.<br />
MACA <strong>and</strong> COWP currently have continuous monitors near park boundaries. Operation at<br />
MACA is expected to continue (there are no plans to discontinue the site) while operation at<br />
COWP is expected to continue through at least 2014 (South Carolina Bureau of Air Quality<br />
2010). Both sites use EPA-certified equivalent methods. Equivalent methods are defined in<br />
Title 40 Part 53 of the Code of Federal Regulations which may be found at<br />
http://ecfr.gpoaccess.gov. For a list of equivalent methods, see United States EPA (2010). The<br />
COWP site is run by the state of South Carolina while MACA’s site is run by the <strong>NPS</strong>. Lastly,<br />
recall that CUGA has a dedicated POMS on loan from <strong>NPS</strong>-ARD that is being maintained by<br />
CUGA staff. How long that POMS will remain at CUGA is unknown.<br />
So, by either the <strong>CUPN</strong> <strong>and</strong>/or some other organization, ozone concentration data will be<br />
collected in COWP, MACA <strong>and</strong> two other parks. For the remaining parks, the <strong>CUPN</strong> will use<br />
data from off-park sites. Generally, these sites are state-operated <strong>and</strong> use primary st<strong>and</strong>ards or<br />
equivalent methods. Data from these sites will be used to suggest what ozone concentrations are<br />
like within a park. For example, state-operated sites around a park experiencing high levels of<br />
exposure would suggest that the park is also experiencing high levels of exposure. Exposure<br />
indices from state-operated sites that surround a park will be presented in annual reports to<br />
suggest the level of exposure in that park.<br />
Sampling Design Overview - <strong>Foliar</strong> <strong>Injury</strong> Assessments<br />
<strong>Foliar</strong> injury assessments will be completed for two or three <strong>CUPN</strong> parks per year as detailed in<br />
Table 4. <strong>CUPN</strong> staff will generally complete foliar injury assessments in parks where ozone<br />
sampling is taking place. <strong>Foliar</strong> injury sampling should be conducted between late-July <strong>and</strong> mid-<br />
21
August as directed by the USFS. The USFS provides specific date ranges for each year. For<br />
more detail on the timing of foliar injury assessments, please see SOP #FoIn4.<br />
All sites throughout the <strong>CUPN</strong> cannot be sampled each year since the <strong>CUPN</strong> does not have the<br />
resources to conduct foliar assessments at each of its fourteen parks each year. However, staff at<br />
parks for which <strong>CUPN</strong> staff is not scheduled to collect foliar injury data may discretionarily<br />
perform injury assessments provided that crew leaders have participated in USFS foliar injury<br />
training <strong>and</strong> the guidelines presented in this protocol are followed.<br />
Site <strong>and</strong> Species Selection – <strong>Ozone</strong> Concentration <strong>and</strong> <strong>Foliar</strong> <strong>Injury</strong> Assessments<br />
POMS site selection criteria are adopted from Ray (2004) <strong>and</strong> foliar injury site selection criteria<br />
are adopted from USFS (2008) <strong>and</strong> Kohut (2007). For both ozone <strong>and</strong> foliar injury, nonr<strong>and</strong>omly<br />
selected sampling locations are chosen by the project lead in consultation with park<br />
management <strong>and</strong> park natural resources staff based upon accessibility, known sensitive species<br />
distributions <strong>and</strong> minimal interference with maintenance <strong>and</strong>/or visitor activities. Open sites are<br />
required (at least one acre). Other general rules for choosing sampling locations address<br />
topographic elevation <strong>and</strong> distance from acute sources of ozone precursor emissions (such as<br />
parking lots). Whenever possible, one foliar injury site at each park should be collocated with<br />
that park’s POMS. Whenever possible, the pool of sites should also provide spatial coverage of<br />
the park as well as cover multiple elevations, soil types, aspects, steepness, soil disturbance, etc.<br />
Table 3 <strong>Ozone</strong> sensitive species in <strong>CUPN</strong> parks as of 2006 (<strong>NPS</strong>pecies <strong>and</strong> Porter 2003).<br />
Scientific Name ABLI CARL CHCH COWP CUGA FODO GUCO KIMO LIRI MACA NISI RUCA SHIL STRI<br />
Ailanthus altissima X X X X X X X X X X X<br />
Apios americana X X X X X X X X X X X X<br />
Apocynum <strong>and</strong>rosaemifolium X X<br />
Apocynum cannabinum X X X X X X X X X X X X<br />
Artemisia ludoviciana X X<br />
Asclepias exaltata X X X<br />
Asclepias incarnata X X X X X X<br />
Asclepias syriaca X X X X X X X X<br />
Aster acuminatus X X<br />
Aster macrophyllus X X X<br />
Cercis canadensis X X X X X X X X X X X X X<br />
Clematis virginiana X X X X X X X X X X X<br />
Corylus americana X X X X X X X X X X<br />
Eupatorium rugosum<br />
(Ageratina altissima) X X X X X X X X X X X<br />
Fraxinus americana X X X X X X X X X X X X X X<br />
Fraxinus pennsylvanica X X X X X X X X X X<br />
Gaylussacia baccata X X X X X X X<br />
Liquidambar styraciflua X X X X X X X X X X X X X X<br />
Liriodendron tulipifera X X X X X X X X X X X X X<br />
Lyonia ligustrina X X X X X X<br />
Parthenocissus quinquefolia X X X X X X X X X X X X X X<br />
Philadelphus coronarius X<br />
Pinus rigida X X X<br />
Pinus taeda X X X X X X X X X X<br />
Pinus virginiana X X X X X X X X X X X X<br />
Platanus occidentalis X X X X X X X X X X X X X X<br />
Prunus serotina X X X X X X X X X X X X X X<br />
Prunus virginiana X X X<br />
Rhus copallinum X X X X X X X X X X X X X X<br />
Robinia pseudoacacia X X X X X X X X X X X X<br />
Rubus allegheniensis X X X<br />
Rubus canadensis X<br />
Rubus cuneifolius X X X<br />
Rudbeckia laciniata X X X X X X X<br />
Sambucus canadensis X X X X X X X X X X X X X X<br />
Sambucus racemosa X<br />
Sassafras albidum X X X X X X X X X X X X X X<br />
Solidago altissima X X X X X X X X<br />
Verbesina occidentalis X X X X X X X X<br />
Vitis labrusca X X X X X X X<br />
22
Table 3 lists sensitive plant species within each of the <strong>CUPN</strong> parks. Generally, samplers may<br />
choose from amongst the entire list of sensitive plant species, but the use of species common<br />
amongst <strong>CUPN</strong> parks is encouraged. The USFS gives preference to the following plant species<br />
in the southeast (species in bold are preferred by the <strong>CUPN</strong> <strong>and</strong> should be searched for at each<br />
park):<br />
• Blackberry<br />
• Common milkweed<br />
• Black cherry<br />
• Yellow poplar<br />
• White ash<br />
23<br />
• Sassafras<br />
• Spreading dogbane<br />
• Big leaf aster<br />
• Sweetgum<br />
• Pin cherry<br />
For more specific guidelines on site selection, see SOP #OC3 <strong>and</strong> SOP #FoIn3.<br />
<strong>Ozone</strong> Sample Frequency <strong>and</strong> Replication<br />
Every year, two parks will be sampled using a portable ozone monitoring station for the entire<br />
growing season. COWP <strong>and</strong> MACA will not be sampled since each of these two parks has its<br />
own ozone monitor. Should either park lose its ozone monitor, the <strong>CUPN</strong> will begin monitoring<br />
at that park with a POMS. This addition of a park for POMS sampling would necessitate<br />
changing from the 6-year cycle shown in Table 4 to a 7-year cycle that would be determined at<br />
the time of the change.<br />
<strong>Foliar</strong> <strong>Injury</strong> Sample Frequency <strong>and</strong> Replication<br />
<strong>Foliar</strong> injury assessments will generally be conducted only at the two parks where POMS<br />
sampling is taking place. The exceptions to this rule are MACA <strong>and</strong> COWP. Since MACA <strong>and</strong><br />
COWP have long-term ozone monitors already in place that are operated by non-<strong>CUPN</strong><br />
organizations, a POMS will not be installed at those two parks. Therefore, during years when<br />
foliar injury sampling is conducted at these two parks, it will take place in parallel with<br />
ozone/foliar injury sampling at two (or three) other parks (as shown in Table 4). In addition to<br />
the scheduled <strong>CUPN</strong> assessments, park-level natural resource managers <strong>and</strong> park management<br />
may opt to conduct additional foliar injury assessments at their parks. These additional sampling<br />
events are not shown in Table 4. Lastly, the foliar injury schedule may be enhanced in the future<br />
to include monitoring at some parks <strong>and</strong> sites by the <strong>CUPN</strong> vegetation monitoring crews.<br />
<strong>Foliar</strong> injury assessments will likely take place at multiple, non-r<strong>and</strong>omly distributed sites on any<br />
given <strong>CUPN</strong> park. When these sites are pooled, the data may provide good information on how<br />
sensitive species are responding to the current year’s ozone concentrations.<br />
General Sampling Schedule<br />
Since three parks are sampled for the first two years of a cycle <strong>and</strong> two parks are sampled each<br />
year for the subsequent four years, it will take six years to sample each of the fourteen parks. At<br />
the end of the six year period, the sampling cycle will repeat itself. The proposed sampling<br />
schedule is shown in Table 4. Parks will be said to be “active” in any given year if they are<br />
being sampled for ozone concentration or foliar injury.<br />
Table 4. Proposed <strong>CUPN</strong> sampling schedule of on-park POMS ozone concentration (OC) monitoring <strong>and</strong><br />
foliar injury (FoIn) assessments. (*) next to a park abbreviation indicates that ozone concentration data
are currently collected each year by an organization other than the <strong>CUPN</strong>. (**) indicates that the <strong>CUPN</strong> is<br />
currently providing some of the funding for the CUGA site, but that funding may be pulled in the future.<br />
Year 1 Year 2 Year 3 Year 4 Year 5 Year 6<br />
ABLI OC, FoIn -- -- -- -- --<br />
CUGA** FoIn -- -- -- -- --<br />
MACA* FoIn FoIn FoIn FoIn FoIn FoIn<br />
FODO -- OC, FoIn -- -- -- --<br />
SHIL -- OC, FoIn -- -- -- --<br />
COWP* -- FoIn -- -- -- --<br />
CHCH -- -- OC, FoIn -- -- --<br />
STRI -- -- OC, FoIn -- -- --<br />
LIRI -- -- -- OC, FoIn -- --<br />
RUCA -- -- -- OC, FoIn -- --<br />
CARL -- -- -- -- OC, FoIn --<br />
GUCO -- -- -- -- OC, FoIn --<br />
KIMO -- -- -- -- -- OC, FoIn<br />
NISI -- -- -- -- -- OC, FoIn<br />
Field Methods<br />
Preparations for <strong>Ozone</strong> Sampling<br />
Prior to taking a POMS to a park, that POMS should be set up at the <strong>CUPN</strong> office within<br />
MACA. The POMS should be allowed to run as if it were at its scheduled park to verify that all<br />
components are in working order. This setup <strong>and</strong> verification will usually be h<strong>and</strong>led by the<br />
project lead with the assistance of the <strong>NPS</strong> monitoring support contractor. The project lead will<br />
work with the monitoring support contractor to address any deficiencies discovered. The project<br />
lead will then work with the destination park’s staff to choose a site for the POMS <strong>and</strong> schedule<br />
installation. Lastly, the project lead should work with the destination park’s staff to determine<br />
who will be responsible for biweekly maintenance of the POMS.<br />
Once the POMS is installed <strong>and</strong> operational, biweekly maintenance visits are necessary. This<br />
can easily be accomplished by one crew member (frequently staff from the host park) although,<br />
for safety reasons, two members may be necessary. Since the individual is trained by the project<br />
lead at the time of the installation, the crew member should be well-equipped to perform the<br />
maintenance visit. The following items need be taken to the site for maintenance visits:<br />
• Field forms (which can be obtained from the <strong>NPS</strong> <strong>Monitoring</strong> Support Contractor)<br />
• Any keys necessary for accessing the POMS enclosures<br />
• Writing tool<br />
• As necessary, keys to any gates that are passed through en route<br />
It is also recommended that the crew member takes a cell phone so that the project lead or the<br />
<strong>NPS</strong> monitoring support contractor can be called in the event that problems are discovered.<br />
More details on preparation are available in SOP #OC2 “Pre-Sampling”.<br />
During the off-season, both POMS in <strong>CUPN</strong>’s possession will be stored in <strong>CUPN</strong> facilities at<br />
MACA. At the end of each season, the ozone analyzers that are used with those POMS will be<br />
shipped to the <strong>NPS</strong> monitoring support contractor for servicing <strong>and</strong> calibration.<br />
11
Preparations for <strong>Foliar</strong> <strong>Injury</strong> Sampling<br />
In general, foliar injury sampling events will be scheduled by the project leader in collaboration<br />
with <strong>CUPN</strong> <strong>and</strong> park staff sometime in the month of July. Specific sampling schedules may be<br />
slightly adjusted to account for inclement weather, personnel workloads, etc. Sampling order<br />
<strong>and</strong> routes to parks/sites will be finalized at least one or two days beforeh<strong>and</strong> in order to<br />
maximize efficiency <strong>and</strong> minimize travel times. If at all possible, site accessibility should be<br />
verified by appropriate park personnel.<br />
Lists of pre-trip activities are provided (SOP #FoIn2 “Pre-Sampling”). The crew leader must<br />
check each item on the lists, particularly the supplies list (which includes items such as field<br />
forms), at least one week before sampling, in case supplies are needed, <strong>and</strong> again the day before<br />
the trip for final details.<br />
Frequently, the crew leader will be assisted by individuals who have not participated in the USFS<br />
training. Minimal training is provided to these inexperienced crew members prior to the<br />
sampling event. This is acceptable since the crew leader will make the final call on all plants<br />
that show any form of injury. Inexperienced crew members are trusted to know when a plant has<br />
no injury of any sort on it <strong>and</strong> the crew leader will accept that designation without closer<br />
inspection. However, any plant that has any sort of injury on it will be inspected by the crew<br />
leader. The number of inexperienced crew members participating will be kept to a minimum.<br />
Sampling Methods – <strong>Ozone</strong> Concentration<br />
<strong>Ozone</strong> data are collected using a POMS that is located in the park. A POMS consists of the<br />
following components:<br />
• Power supply (solar array, batteries, battery enclosure, <strong>and</strong> power distribution system)<br />
• Instrumentation (ozone analyzer, GPS <strong>and</strong> meteorological instruments)<br />
• Control system (datalogger, relay panel, <strong>and</strong> satellite uplink module)<br />
• Mechanicals (mounting system, security system, tripod, enclosures <strong>and</strong> lightning protection<br />
system)<br />
Particular components of a POMS will likely change over time as dictated by <strong>NPS</strong>-ARD <strong>and</strong> the<br />
<strong>NPS</strong> monitoring support contractor. For example, as technologies improve, the ozone analyzer<br />
that is currently in use will likely be replaced with an updated model. The <strong>CUPN</strong> will adopt<br />
these methodological changes as prescribed by <strong>NPS</strong>-ARD <strong>and</strong> the <strong>NPS</strong> monitoring support<br />
contractor. For this reason, particular methodologies are not discussed in this document.<br />
Information on current <strong>and</strong> historic methodologies is available from either the <strong>NPS</strong> monitoring<br />
support contractor, <strong>NPS</strong>-ARD or the <strong>CUPN</strong> ozone <strong>and</strong> foliar injury project lead.<br />
Reasons for Choosing this Method Rather than Others<br />
There are several advantages to using a POMS. With a POMS, data collection is automated <strong>and</strong><br />
data are uploaded via satellite. This approach streamlines data collection, largely eliminates the<br />
need for data entry from data forms to a database, <strong>and</strong> significantly improves data quality since<br />
the possibility of human error is largely removed. Additionally, since the data are continuous,<br />
hourly measurements, the user obtains detailed information on ozone cycles <strong>and</strong> dynamics that<br />
would not be available if some other method (such as passive sampling) was used. Lastly, since<br />
12
the unit is solar powered, it is not necessary to have any power source nearby, greatly increasing<br />
the number of sites where a POMS could be located. This solar power feature also makes the<br />
initial installation much easier, since the power needed/provided is low-voltage so that the<br />
individual performing the setup <strong>and</strong> disassembly need only minimal training (when compared to<br />
the training needed for tapping into st<strong>and</strong>ard, “on-the-grid” power sources).<br />
For more information on EPA-certified methods, POMS <strong>and</strong> passive samplers, see <strong>NPS</strong>-ARD’s<br />
ozone monitoring protocol (Ray 2004).<br />
Sampling Methods – <strong>Foliar</strong> <strong>Injury</strong> Assessments<br />
Methodologies for foliar injury assessments have been adopted from those used by the USFS in<br />
their protocol (see USFS 2005). Essentially, the USFS visually inspects plant leaves from the<br />
target species while walking around the site. Any injury observed is noted on a field form. With<br />
the exception of a voucher specimen for each species when injury is found, no leaves are<br />
removed from the sampled plants. Typically, the assessment takes a crew of two or three people<br />
between one <strong>and</strong> two hours to complete. Usually after plants have been surveyed, the center of<br />
that site is mapped using a GPS <strong>and</strong> a site sketch is drawn that shows the position of target<br />
plants/patches within that site as well as significant proximal l<strong>and</strong>marks (cities, roads, power<br />
lines, etc.). Other site-level abiotic data are also collected.<br />
As samplers sweep a site, two types of data are collected on each plant sampled. The first datum<br />
is referred to as “injury amount.” This parameter defines how widespread ozone injury is on a<br />
particular plant. The parameter can range from no damage on the plant anywhere up to the entire<br />
plant showing some level of foliar injury. The next parameter collected is referred to as “injury<br />
severity.” This parameter is a measure of how badly a plant is injured on any given leaf.<br />
Samplers are instructed to select <strong>and</strong> collect data on a leaf with an injury level that is “typical” of<br />
the entire plant. Parameter values can range from no injury on a typical leaf to as much as the<br />
entirety of a typical leaf shows damage. These estimates are based only upon parts of the plant<br />
that are exposed to sunlight since ozone injury will generally not occur on shaded parts of leaves<br />
(as shown in Figure 3).<br />
While there is no minimum number of plants per species at any given site, samplers should select<br />
sites that contain at least ten plants per species. The USFS protocol calls for at least two species<br />
with thirty plants each. Also, the maximum number of individual plants examined for each<br />
species is thirty.<br />
Voucher Specimens<br />
One voucher specimen (a specimen is considered to be three leaves) is collected for each species<br />
that is evaluated at a site. The USFS protocol explicitly stipulates that voucher specimens should<br />
show obvious signs of ozone injury whenever possible. That is, voucher specimens should be<br />
collected only when injury is suspected. Leaves should not be collected that do not show signs<br />
of ozone injury. Three leaves per species are placed in a plant press <strong>and</strong>, after the leaves have<br />
properly dried (according to the USFS protocol, at least 36 hours after being placed in the press),<br />
the vouchers are sent to USFS personnel in a centralized laboratory/office. The vouchers are<br />
then examined by a regional expert to determine if the injury observed is ozone injury. The<br />
purpose of the vouchers is to determine whether or not samplers in the field are correctly<br />
13
identifying ozone injury on plants. This verification is necessary since ozone injury is similar in<br />
appearance to other types of leaf injury.<br />
Some of the data that are collected in the field for each voucher aid in characterizing the nature<br />
of ozone injury at the site. The injury location datum, for example, is an estimate of the age of<br />
injured leaves on plants at the site (mostly younger leaves, mostly mid-aged <strong>and</strong> older leaves, or<br />
no distinct age class). The second datum, injury type, estimates how much of the injury on<br />
injured leaves is ozone injury (most of the injury is stipple, most of the injury is not stipple, or it<br />
is difficult to tell how much of the injury is stipple).<br />
Voucher specimens should be brought/sent to the <strong>CUPN</strong> office at MACA. Upon receipt at the<br />
<strong>CUPN</strong> office, the specimens are sorted by park, packaged using blotter paper <strong>and</strong> cardboard, <strong>and</strong><br />
then sent to the USFS for inspection. Upon completion of the inspection, the USFS will return<br />
the specimens to the <strong>CUPN</strong> office at MACA. Vouchers are then photographed <strong>and</strong><br />
catalog/accession numbers are obtained from the originating park. All voucher information<br />
(including catalog/accession numbers) is entered into ICMS (includes digitally attaching the<br />
photo to the ICMS record). See subsequent section, “Data Management”, for more information<br />
about ICMS. Next, <strong>NPS</strong> labels are printed using ICMS info just entered. Specimens are then<br />
curated by laminating the voucher together with its <strong>NPS</strong> label. Lastly, the ICMS records are<br />
mailed to the originating park <strong>and</strong> vouchers are sent to the park's chosen repository.<br />
The park’s chosen repository could be located at that park or some other park (frequently the<br />
curatorial facilities at MACA). Also, the <strong>CUPN</strong> allows parks to have their voucher specimens<br />
discarded after analysis. However, that option (discarding of the specimens) is strongly<br />
discouraged. Retaining specimens is the most desirable action since future studies (both related<br />
<strong>and</strong> unrelated to the study of ozone <strong>and</strong> its effects) may be able to use the specimens. However,<br />
the <strong>CUPN</strong> recognizes that the originating park has the authority to determine the fate of its<br />
specimens <strong>and</strong> will abide their decision. The <strong>CUPN</strong> will not discard specimens unless instructed<br />
to do so by the originating park. In any of case, procedures from the <strong>NPS</strong> museum h<strong>and</strong>book<br />
will be followed for discarding, processing, pressing, preserving <strong>and</strong> shipping of voucher<br />
specimens.<br />
Photography of Voucher Specimens<br />
All voucher specimens (upper <strong>and</strong> lower sides) are photographed. Photographs of voucher<br />
specimens, henceforth referred to as photographic vouchers, are not required by the USFS<br />
protocol.<br />
There are a number of reasons why these photographic vouchers will be useful to the <strong>CUPN</strong>.<br />
First, “h<strong>and</strong>ling” of these photographs will not damage them. Second, as a result of the ability to<br />
copy digital photographs, it will be possible for multiple parties (for example, the <strong>CUPN</strong> office<br />
<strong>and</strong> the originating park) to retain vouchers. Third, photographic leaf vouchers are a valuable<br />
training <strong>and</strong> presentation tool. Photographic leaf vouchers will show varying levels of ozone<br />
injury mixed with other forms of injury. Photographic vouchers can easily be compiled <strong>and</strong> a<br />
wide variety of injury levels/mixes be illustrated. Fourth, archival procedures for digital<br />
photographs are simpler than those for specimens, making it relatively easy for the <strong>CUPN</strong> to<br />
build <strong>and</strong> maintain an archive of digital photographs. And fifth, photographic vouchers can be<br />
quickly <strong>and</strong> easily distributed to interested non-<strong>NPS</strong> parties.<br />
14
Figure 10 – Photographs showing the upper (abaxial) <strong>and</strong> lower (adaxial) side of a common milkweed<br />
specimen. <strong>NPS</strong> photographs by Brenda Wells (<strong>CUPN</strong> staff).<br />
Figure 11 – Photographic voucher showing all three leaves of which the voucher consists. The leftmost<br />
photograph shows the abaxial side of the leaves while the rightmost photograph shows the adaxial side of<br />
the leaves. These common milkweed leaves were collected from MACA in 2010. <strong>NPS</strong> photographs by<br />
Brenda Wells (<strong>CUPN</strong> staff).<br />
St<strong>and</strong>ardized procedures will be followed when photographing voucher specimens. Some of the<br />
particular rules for photography include:<br />
• Photographs are taken from a fixed distance<br />
• Photographs are taken using a st<strong>and</strong>ardized set of camera settings<br />
• Photographs are taken using a st<strong>and</strong>ardized background<br />
• Petiole labels are shown in the photographs, so that information shown on the label is in the<br />
photograph with the leaf<br />
• Petiole labels are numbered on both their front <strong>and</strong> back sides, allowing the adaxial side of a<br />
leaf to be matched to its abaxial side<br />
15
• Photographs are taken inside under artificial lighting <strong>and</strong> not outside where light intensity<br />
<strong>and</strong> quality can fluctuate greatly over time<br />
More specific rules for voucher photography may be provided in later versions of this protocol.<br />
Also, all specimen <strong>and</strong> photographic vouchers will be cataloged in the Interior Collections<br />
Management System (ICMS).<br />
Reasons for Choosing this Method Rather than Others<br />
The USFS approach is easy to execute provided that the sampler is properly trained. Tree<br />
climbing is not necessary <strong>and</strong> a crew with only a few members can sample a park. Sampling a<br />
site also takes very little time, usually as little as a couple of hours. The USFS program<br />
examines sites across the U.S. <strong>and</strong> uses established/accepted methods. The <strong>CUPN</strong> is also able to<br />
rely on the USFS to provide training <strong>and</strong> data archival.<br />
The only significant difficulty associated with the approach is that, in some of the <strong>CUPN</strong> parks,<br />
it can be difficult to find an ideal site. Early successional st<strong>and</strong>s of plants can be rare as can<br />
suitable meadows.<br />
Data Management<br />
Overview of Database Design<br />
This protocol will produce two main types of data: 1) ozone concentration data; 2) foliar injury<br />
data.<br />
<strong>Ozone</strong> concentration data will be generated by three sources: 1) on-park continuous monitors<br />
(COWP, MACA); 2) on-park portable ozone monitors (two active parks per year); <strong>and</strong> 3) offpark<br />
continuous monitors (usually EPA-certified state-operated monitors). For on-park ozone<br />
data, the <strong>CUPN</strong> plans to participate in the database management system maintained by the <strong>NPS</strong><br />
ARD. For selected off-park monitors, the <strong>CUPN</strong> anticipates that the project lead will poll <strong>and</strong><br />
retrieve those data from the central databases maintained by EPA.<br />
<strong>Foliar</strong> injury data will be entered into a relational MSAcess database utilizing the Natural<br />
Resource Database Template (NRDT), which includes an established set of core tables <strong>and</strong> fields<br />
developed by the <strong>Inventory</strong> <strong>and</strong> <strong>Monitoring</strong> Program (<strong>NPS</strong> 2006). <strong>Foliar</strong> injury data will also be<br />
provided to the US Forest Service FIA program for entry/import into their database. See SOP<br />
#FoIn 6 “Data Management” for a list of fields <strong>and</strong> descriptions.<br />
Data Processing<br />
Data from ozone monitors are automatically uploaded by the <strong>NPS</strong> monitoring support contractor<br />
via satellite. There are no field forms, other than documents used for equipment maintenance<br />
<strong>and</strong> calibration. Once data are uploaded, the <strong>NPS</strong> monitoring support contractor performs<br />
various validation procedures that meet EPA requirements <strong>and</strong> are fully described in SOP #OC6<br />
“Data Management”.<br />
<strong>Foliar</strong> injury data will be entered from hardcopy field forms into the electronic database by<br />
<strong>CUPN</strong> data managers. Immediately following data entry, a verification step will be conducted<br />
16
y data managers to check for hardcopy-to-electronic transcribing errors. During data entry,<br />
some validation checks (those incorporated in database design) will occur, such as limiting<br />
values to allowable ranges. In addition, a final validation overview will be performed by the<br />
project lead to capture any further inconsistencies that were not resolved during data entry.<br />
Data Archiving<br />
According to ARD procedures, there will be a monthly/quarterly submittal of final validated<br />
regulatory data to the EPA’s AQS database. These data include hourly average ambient air<br />
quality <strong>and</strong> meteorological data, precision data from ozone analyzer precision checks, <strong>and</strong><br />
accuracy data from audit reports on ozone analyzers.<br />
Final data sets for foliar injury will be archived by <strong>CUPN</strong> locally with all supporting<br />
documentation, including documentation of data files, data management procedures, hardcopy<br />
field forms, <strong>and</strong> quality assurance data. Multiple copies of datasets will be stored, <strong>and</strong> care will<br />
be taken that all copies are updated simultaneously when additional material is added. Datasets<br />
destined for archiving will be stored locally within an object-oriented file structure established<br />
on the <strong>CUPN</strong> file server. Incremental or differential tape backups of all project databases on the<br />
server are regularly conducted. Backup copies of the data are maintained in a secure alternate<br />
location. Currently, GIS files are maintained <strong>and</strong> archived separately by the GIS specialist.<br />
Metadata Procedures<br />
All ozone geospatial data will be documented with appropriate Federal Geographic Data<br />
Committee (FGDC) <strong>and</strong> <strong>NPS</strong> metadata st<strong>and</strong>ards. ArcCatalog (i.e., geospatial data) records<br />
destined for upload to the Integrated Resource Management Applications site (IRMA) will be<br />
edited with the <strong>NPS</strong> Metadata Tools <strong>and</strong> Editor prior to upload.<br />
Analysis <strong>and</strong> Reporting<br />
Data Analysis<br />
The monitoring questions <strong>and</strong> subsequent analysis of the supporting data address issues related<br />
to status <strong>and</strong> trends in ozone concentration/exposure, foliar injury, <strong>and</strong> the interrelationship<br />
between the two. <strong>Monitoring</strong> questions will be addressed using a combination of summary <strong>and</strong><br />
descriptive statistics, graphic analysis, <strong>and</strong> multivariate comparative <strong>and</strong> correlative analysis.<br />
For hourly ozone data from a POMS or state-operated site, cumulative ozone exposures (such as<br />
the seasonal SUM06, the seasonal W126 <strong>and</strong> the highest consecutive 3-month W126) will be<br />
computed for each growing season. POMS data will be presented as a time series <strong>and</strong> analyzed<br />
for diurnal patterns.<br />
<strong>Foliar</strong> injury data consist of injury amount (how much of the total plant shows any level of ozone<br />
injury) <strong>and</strong> injury severity (on average, how much of the plant’s leaf surfaces show ozone<br />
injury). These data are recorded as indices from zero to five, with zero meaning there is no<br />
injury up to five meaning that nearly all of the plant or leaf surface shows injury. In annual<br />
reports, these data will be presented in various tables without statistical analysis. In 6-year<br />
reports, summary statistics will be computed for these indices to determine the severity of<br />
damage at the site level for each species sampled as well as for all plants sampled (by pooling all<br />
species data from the site). Similar statistics will also be computed at the park level by pooling<br />
17
all of the site data. It should be noted, however, that since sites were not r<strong>and</strong>omly selected,<br />
these pooled site-data (which can be loosely considered park-level data) do not necessarily<br />
spatially characterize ozone injury as it is occurring across the park. Nevertheless, these parklevel<br />
data are informative in discussing conditions as they occurred amongst the pooled sites.<br />
Relationships between ozone exposure indices <strong>and</strong> foliar injury data will be explored in annual<br />
reports simply through a discussion in the text. Drought severity indices will also be considered.<br />
For example, for a site <strong>and</strong> year when ozone concentrations are low <strong>and</strong> very little foliar injury is<br />
discovered, it will be explained that this is the expected finding especially since (let’s suppose)<br />
the drought severity index was near zero (neither an excessively wet year nor an excessively dry<br />
year). In the 6-year reports, correlation analysis will be performed on the pooled set of these<br />
same data.<br />
The development of basic queries <strong>and</strong> summary reports in MS Access will be utilized to<br />
automate <strong>and</strong> thus streamline the data analysis <strong>and</strong> reporting workload, as appropriate. In<br />
consultation with the project leader, the data manager will develop queries (<strong>and</strong> accompanying<br />
summary reports) that will address basic statistical questions. It is anticipated the results of these<br />
queries will be relied upon heavily for annual reporting.<br />
In instances where the statistical questions become increasingly complex, data will need to be<br />
exported out of the relational MS Access database to commercial off-the-shelf statistical<br />
packages for higher level statistical analyses (i.e., t-tests <strong>and</strong> ANOVA). In general, these data<br />
will be formatted based on parameters provided by the data analyst.<br />
Reporting<br />
There will be two main categories of reports. The first is an annual status report. The second is<br />
a multiple year (~6) that will be used to explore long-term trends <strong>and</strong> correlation between ozone<br />
exposure <strong>and</strong> foliar injury data. Reports will follow the <strong>NPS</strong> Natural Resource Data Series<br />
format.<br />
In an effort to disseminate findings in a timely manner, annual reports should be completed by<br />
November of the year following data collection. A brief (2-3 paragraphs) summary of sampling<br />
activities, preliminary results, <strong>and</strong> any public interest highlights that occurred during each federal<br />
fiscal year will be written by October 15 of the following fiscal year for inclusion in the <strong>CUPN</strong><br />
<strong>Monitoring</strong> Program’s Annual Administrative Report. Fiscal years begin in October <strong>and</strong> end in<br />
September.<br />
Annual summary reports may be used to supplement annual reports. These “Resource Briefs”<br />
are intended for park-level managers that are interested only in key findings of the monitoring<br />
<strong>and</strong> do not have the time to read through the details contained in the annual reports. As of this<br />
writing, the <strong>CUPN</strong> has not yet decided whether to implement the use of annual summary reports<br />
with its protocols.<br />
18
Personnel Requirements <strong>and</strong> Training<br />
Roles <strong>and</strong> Responsibilities<br />
Implementation of this protocol requires a team of staff members working cooperatively.<br />
Leading the team is an overall project leader who oversees <strong>and</strong> directs project operations. The<br />
project leader is the principal scientist for implementing this monitoring protocol <strong>and</strong> is<br />
supervised by the MACA Air Quality Specialist with program oversight by the <strong>CUPN</strong><br />
coordinators. The project leader will be responsible for obtaining park permits,<br />
installation/removal of POMS, training park personnel to maintain POMS, participating in foliar<br />
injury training, conducting foliar injury surveys, filing trip reports, data entry, data verification,<br />
data validation, data summary, analysis, <strong>and</strong> reporting.<br />
The <strong>CUPN</strong> coordinators are responsible for ensuring that staff members receive appropriate<br />
training for foliar injury identification <strong>and</strong> data management. A combination of trained <strong>CUPN</strong><br />
<strong>and</strong> park staff will be responsible for data collection, data recording, post-sampling equipment<br />
inspection <strong>and</strong> storage, <strong>and</strong> shipping/receiving of sampling materials. Data entry is the<br />
responsibility of the project lead with assiatance from data managers as needed. Data<br />
management will be shared responsibilities among the project leader, data managers, park staff,<br />
the <strong>NPS</strong> monitoring support contractor, <strong>and</strong> Air Resource Division contacts. For the foliar injury<br />
component, the data managers are ultimately responsible for ensuring that adequate QA/QC<br />
procedures are built into the database management system. The data managers, project leader,<br />
<strong>and</strong> park staff are jointly responsible for ensuring data h<strong>and</strong>ling procedures are followed.<br />
Voucher specimens resulting from foliar injury surveys will be h<strong>and</strong>led by the <strong>CUPN</strong><br />
biologist/curatorial specialist. He/she will be responsible for photographing <strong>and</strong> shipment of<br />
specimens to USFS. When specimens are returned, he/she will be responsible for cataloging of<br />
specimens <strong>and</strong> photographic vouchers in ICMS according to park instructions.<br />
Qualifications <strong>and</strong> Training<br />
To ensure data quality, all staff should be knowledgeable on the tasks for which they are<br />
responsible. In particular, new crew leaders should be thoroughly familiar with SOP #OC4 <strong>and</strong><br />
SOP #FoIn4 <strong>and</strong> should be given h<strong>and</strong>s-on training by the project leader, or a designee, for each<br />
of the items detailed therein. Further, foliar injury crew leaders must participate in USFS<br />
training or pass pre-season USFS exams to be certified to collect foliar injury data. Pre-sampling<br />
“training <strong>and</strong> h<strong>and</strong>ling preparation” meetings should be held as necessary to review sampling<br />
procedures, components <strong>and</strong> assembly/disassembly steps for a POMS, <strong>and</strong> assessment of foliar<br />
injury symptoms. See SOP #OC1 <strong>and</strong> SOP #FoIn1 for further training guidelines.<br />
Operational Requirements<br />
<strong>Ozone</strong> Field Schedule<br />
POMS installations <strong>and</strong> removals require one person (usually the project lead) <strong>and</strong> limited<br />
assistance from the host park for equipment setup <strong>and</strong> equipment disassembly. The amount of<br />
time that setup <strong>and</strong> disassembly of equipment requires depends upon which of the two POMS is<br />
being setup or disassembled. The smallest POMS takes only about an hour for either installation<br />
or removal. The larger unit takes about 3 hours to install <strong>and</strong> about 2 hours to remove. These<br />
19
time estimates do not include transit times. Since two parks are sampled each year (<strong>and</strong> to<br />
increase efficiency), installations or removals at both parks are completed in one trip. Both<br />
POMS will fit into a pickup truck for the trip. This does, however, necessitate at least one<br />
overnight stay.<br />
<strong>Ozone</strong> sampling requires one person (although two people may be necessary for safety reasons)<br />
to make biweekly, fifteen minute POMS maintenance visits throughout the ozone season.<br />
Maintenance visits usually take only about fifteen minutes at the site, but travel time can be<br />
significant if the site is located far from the park’s offices. Transit time to a POMS will vary<br />
amongst parks, but should generally take between .25 <strong>and</strong> 1 hour. Additional time should be<br />
allowed for repairs of malfunctioning equipment. Past experience with these monitors has<br />
shown that the units rarely malfunction <strong>and</strong>, when a problem does occur, it is generally easy to<br />
fix. In most cases, maintenance visits are h<strong>and</strong>led by park staff since they are on-park <strong>and</strong> travel<br />
times for centralized <strong>CUPN</strong> staff would be too long.<br />
Approximate time requirements for each of the activities just discussed are summarized below.<br />
<strong>CUPN</strong> costs for ozone monitoring equipment (POMS) beginning-of-the-season setup <strong>and</strong> end-ofthe-season<br />
takedown:<br />
(1 person) X (1 setup+1 takedown) X (1-3 hour for setup or takedown + to-<strong>and</strong>-from transit time<br />
from park office + travel from centralized <strong>CUPN</strong> office + travel times between the two parks)<br />
Park costs for ozone monitoring equipment (POMS) maintenance visits annually:<br />
(1 or 2 people) X (2 parks) X (16 maintenance visits) X (0.25 hours + to-<strong>and</strong>-from transit time)<br />
<strong>Foliar</strong> <strong>Injury</strong> Field Schedule<br />
<strong>Foliar</strong> injury assessments are generally h<strong>and</strong>led by centralized <strong>CUPN</strong> staff with help from park<br />
personnel.<br />
<strong>CUPN</strong> costs for foliar injury assessments annually:<br />
(2 members of <strong>CUPN</strong> staff+1 member of park staff) X (2 parks) X (1 set of assessments per<br />
park) X (8 hours for assessments <strong>and</strong> travel time to/from/between sites)+(travel time to first park<br />
<strong>and</strong> from last park)+(two overnight stays for 2 members of <strong>CUPN</strong> staff)<br />
Combined <strong>Ozone</strong> <strong>and</strong> <strong>Foliar</strong> <strong>Injury</strong> Annual Workload<br />
Time must also be used for obtaining park permits, completing Investigator’s Annual Reports,<br />
<strong>and</strong> participating in scheduling calls <strong>and</strong> training sessions (about 5 days for the project leader<br />
GS-11). Data entry, verification, editing, validation, archival, <strong>and</strong> metadata procedures are<br />
estimated to require approximately 3 office-days per year (2 days for data manager GS-9 <strong>and</strong> 1<br />
day for project leader GS-11). Data analysis is estimated to take approximately 6 office-days per<br />
year (5 days for project leader GS-11 <strong>and</strong> 1 day for a data manager GS-9). Producing the fiveyear<br />
status report is estimated to consume 5 office-days per year (4 days for project leader, <strong>and</strong> ½<br />
day each for a data manager <strong>and</strong> GIS specialist GS-11). Annual status reports are anticipated to<br />
require about 4 days from the project lead. Processing of voucher specimens takes about 2 days<br />
per year (all for the data manager GS-9). Therefore, all data management, analysis, <strong>and</strong><br />
reporting activities are estimated to involve a total of 25 office-days per year. Table 5<br />
summarizes task/personnel assignments.<br />
20
Table 5 – Proposed workload distribution for ozone <strong>and</strong> foliar injury monitoring. Abbreviations are:<br />
PL=Project Lead, <strong>NPS</strong>-MSC=<strong>NPS</strong> <strong>Monitoring</strong> Support Contractor, PP=Park Personnel, TPP=Trained<br />
Park Personnel, T-<strong>CUPN</strong>-S=Trained <strong>CUPN</strong> Staff, <strong>CUPN</strong> BIO-CUR=<strong>CUPN</strong> Biological/Curatorial<br />
Specialist, GIS=Geographic Information System specialist, <strong>and</strong> DM=Data Manager.<br />
Task <strong>Ozone</strong> Concentration<br />
Personnel<br />
<strong>Foliar</strong> <strong>Injury</strong> Personnel<br />
Park Permits PL PL<br />
Annual POMS Maintenance PL+<strong>NPS</strong>-MSC --<br />
POMS Installation <strong>and</strong> Removal PL+PP --<br />
Weekly POMS Maintenance TPP --<br />
Training PL+TPP PL+TPP<br />
Data Collection (Field Work) -- PL+TPP+T-<strong>CUPN</strong>-S<br />
Processing Voucher Specimens -- <strong>CUPN</strong> BIO-CUR<br />
Filing Field Forms PL+TPP+<strong>NPS</strong>-MSC DM+TPP<br />
Data Entry <strong>NPS</strong>-MSC PL+DM<br />
Data Verification <strong>and</strong> Validation <strong>NPS</strong>-MSC PL+DM<br />
Data Summary PL PL<br />
Data Analysis PL+DM PL+DM<br />
Data Management <strong>NPS</strong>-MSC PL+DM<br />
Reporting PL+DM+<strong>NPS</strong>-MSC+GIS PL+GIS<br />
Facility <strong>and</strong> Equipment Needs<br />
<strong>Ozone</strong> sampling does not require special facilities beyond normal office space <strong>and</strong> equipment<br />
storage needs. However, foliar injury sampling, in addition to office space <strong>and</strong> equipment<br />
storage needs, requires storage for voucher specimens. There are two types of vouchers:<br />
specimen vouchers <strong>and</strong> photographic vouchers. Specimen vouchers must be stored in<br />
specialized storage cabinets <strong>and</strong> in accordance with guidelines as set forth in the <strong>NPS</strong> museum<br />
h<strong>and</strong>book. Photographs will be digital <strong>and</strong> will be archived on the <strong>CUPN</strong> server, also in<br />
accordance with guidelines as set forth in the <strong>NPS</strong> museum h<strong>and</strong>book. The <strong>NPS</strong> museum<br />
h<strong>and</strong>book is available at http://www.nps.gov/history/museum/publications/h<strong>and</strong>book.html.<br />
SOP #OC2 <strong>and</strong> SOP #FoIn2 contain lists of field equipment needs.<br />
Startup <strong>and</strong> <strong>Monitoring</strong> Costs<br />
Startup costs for implementing this protocol consisted primarily of the cost of purchasing one<br />
POMS unit. The cost to the <strong>CUPN</strong> of that POMS was $18,000.<br />
Personnel expenses for field work are based on personnel/time requirements as estimated in the<br />
previous section “Field Schedule <strong>and</strong> Annual Workload.” As detailed in that section, ozone <strong>and</strong><br />
foliar injury monitoring is estimated to require a minimum total of 25 field-days to implement<br />
across the <strong>CUPN</strong>. Based on FY 2011 personnel costs, annual <strong>CUPN</strong> personnel expenses for 25<br />
workdays are estimated to be $8,000. Additionally, annual travel expenses are about $800.<br />
Perennial supplies <strong>and</strong> equipment costs should be minimal, since the equipment that is needed is<br />
non-perishable <strong>and</strong> does not need to be replenished (with the exception of archival materials,<br />
field notebooks <strong>and</strong> pens/pencils). The only significant perennial supplies <strong>and</strong> equipment costs<br />
21
are POMS operational costs paid to the <strong>NPS</strong> monitoring support contractor. The cost to the<br />
<strong>CUPN</strong> for the ozone season is about $6,500 per POMS. This perennial fee covers data<br />
collection, data validation, data archival, technical support, <strong>and</strong> replacement of malfunctioning<br />
equipment. The remaining costs are paid for by <strong>NPS</strong>-ARD. The <strong>CUPN</strong> is providing this partial<br />
funding for two POMS, totaling $13,000 per year. When totaled with the perennial costs in the<br />
paragraph above, the total annual cost for monitoring is about $21,800.<br />
Procedure for Revising the <strong>Protocol</strong> <strong>and</strong> Archiving Previous<br />
<strong>Protocol</strong> Versions<br />
No protocol can be expected to remain unchanged over the long term. We anticipate the<br />
foundation, the logic <strong>and</strong> rationale of program design, to remain as written over the term of the<br />
program. However, there will come a time when program logistics, such as sample locations,<br />
cost estimates, methods, <strong>and</strong> reporting criteria may require updating. Careful documentation of<br />
changes to the protocol are essential when people, in the future, examine data trends, for<br />
example, to know exactly under what conditions the data were gathered. All ozone monitoring<br />
data will be entered into a database, which contains a field that denotes the protocol version<br />
under which the data were collected. Each protocol version will be properly archived to ensure<br />
future retrieval.<br />
The rationale for dividing a sampling protocol into a <strong>Protocol</strong> Narrative with supporting SOPs is<br />
based on the following:<br />
• The <strong>Protocol</strong> Narrative is a general overview of the protocol that gives the history <strong>and</strong><br />
justification for performing the work as well as sampling methods. It does not contain all<br />
methodological details which are found in the accompanying SOPs. The <strong>Protocol</strong> Narrative<br />
is changed only if major revisions are necessary.<br />
• The SOPs, in contrast, are specific detailed instructions for performing given tasks <strong>and</strong> are<br />
expected to be revised more frequently than the <strong>Protocol</strong> Narrative.<br />
• When an SOP is revised, in most cases, it will not require modification to the <strong>Protocol</strong><br />
Narrative, unless it affects the Narrative direction or rationale.<br />
• All electronic versions of the <strong>Protocol</strong> Narrative <strong>and</strong> SOPs will be archived on the network<br />
server in the <strong>CUPN</strong> protocol folder under the Vital Signs project folder for <strong>Ozone</strong>. Revised<br />
versions of the protocol will be posted to the <strong>NPS</strong> I&M protocol database <strong>and</strong> <strong>CUPN</strong><br />
websites.<br />
Steps for changing the <strong>Protocol</strong> Narrative or SOPs are detailed in SOP #9 (both OC <strong>and</strong> FoIn)<br />
“Revising the <strong>Protocol</strong>”. The <strong>Protocol</strong> Narrative <strong>and</strong> each SOP contains a Revision History Log<br />
that will be filled out each time the <strong>Protocol</strong> Narrative or an SOP is changed.<br />
<strong>Protocol</strong> Narrative Revision History Log:<br />
Previous<br />
Version #<br />
Revision<br />
Date<br />
Author Changes Made Reason for Change New<br />
Version #<br />
22
References<br />
Grantz, D.A. Review of <strong>NPS</strong> Document: “A <strong>Protocol</strong> for <strong>Monitoring</strong> <strong>Ozone</strong> <strong>and</strong> <strong>Foliar</strong> <strong>Injury</strong><br />
Throughout the Cumberl<strong>and</strong> Piedmont Network”. University of California at Riverside,<br />
Riverside, California. 2009.<br />
Great Smoky Mountains National Park. Great Smoky Mountains National Park Folio #2: Air<br />
Quality. Brochure. Great Smoky Mountains National Park <strong>and</strong> the National Park Service,<br />
Gatlinburg, Tennessee. 2006.<br />
Jernigan, J. W., B. Carson, <strong>and</strong> T. Leibfreid. <strong>Ozone</strong> <strong>and</strong> foliar injury report for Cumberl<strong>and</strong><br />
Piedmont Network parks: Annual report 2008. Natural Resource Data Series<br />
<strong>NPS</strong>/<strong>CUPN</strong>/NRDS—2009/012. National Park Service, Fort Collins, Colorado. 2009.<br />
Jernigan, J. W., B. Carson, <strong>and</strong> T. Leibfreid. <strong>Ozone</strong> <strong>and</strong> foliar injury report for the Cumberl<strong>and</strong><br />
Piedmont Network Parks consisting of Cowpens NB, Fort Donelson NB, Mammoth Cave NP<br />
<strong>and</strong> Shiloh NMP: Annual report 2009. Natural Resource Data Series <strong>NPS</strong>/<strong>CUPN</strong>/NRDS—<br />
2010/110. National Park Service, Fort Collins, Colorado. 2010.<br />
Kohut, Robert. H<strong>and</strong>book for Assessment of <strong>Foliar</strong> <strong>Ozone</strong> <strong>Injury</strong> on Vegetation in the National<br />
Parks. Boyce Thompson Institute, Cornell University, Ithaca, New York. 2005.<br />
Kohut, Robert. H<strong>and</strong>book for Assessment of <strong>Foliar</strong> <strong>Ozone</strong> <strong>Injury</strong> on Vegetation in the National<br />
Parks. 2 nd Edition. Boyce Thompson Institute, Cornell University, Ithaca, New York. 2007.<br />
Leibfreid, T. R., R.L. Woodman <strong>and</strong> S.C. Thomas. Vital Signs <strong>Monitoring</strong> Plan for the<br />
Cumberl<strong>and</strong> Piedmont Network <strong>and</strong> Mammoth Cave National Park Prototype <strong>Monitoring</strong><br />
Program: July 2005. National Park Service, Mammoth Cave, Kentucky. 2005.<br />
McCune, Bruce, C.L. Cloonan, <strong>and</strong> T.V. Armentano. <strong>Foliar</strong> <strong>Injury</strong>, Tree Growth <strong>and</strong> Mortality,<br />
<strong>and</strong> Lichen Studies in Mammoth Cave National Park. Holcomb Research Institute, Butler<br />
University, Indianapolis, Indiana, USA. 1987.<br />
National Park Service, Air Resources Division (<strong>NPS</strong>-AIR). Air quality in national parks: 2009<br />
annual performance <strong>and</strong> progress report. Natural Resource Report<br />
<strong>NPS</strong>/NRPC/ARD/NRR—2010/266. National Park Service, Denver, Colorado. 2010.<br />
<strong>NPS</strong>, Washington Support Office, <strong>Inventory</strong> <strong>and</strong> <strong>Monitoring</strong> Program. 2006. Natural Resource<br />
Database Template Revised Documentation. National Park Service. Fort Collins, CO.<br />
Negra, Christine, E. Geczi, S. Gopal <strong>and</strong> C. Sweedo. Indicators of Ecological Effects of Air<br />
Quality. The H. John Heinz III Center For Science, Economics <strong>and</strong> the Environment,<br />
Washington, D.C. 2009.<br />
23
Porter, Ellen. <strong>Ozone</strong> Sensitive Plant Species on National Park Service <strong>and</strong> U.S. Fish <strong>and</strong> Wildlife<br />
Service L<strong>and</strong>s: Results of a June 24-25, 2003 Workshop. Baltimore, Maryl<strong>and</strong>. Air<br />
Resources Division, Research <strong>and</strong> <strong>Monitoring</strong> Branch, National Park Service, Lakewood,<br />
Colorado, USA. 2003.<br />
Ray, John D. <strong>Ozone</strong> <strong>Monitoring</strong> <strong>Protocol</strong>: Guidance on Selecting <strong>and</strong> Conducting <strong>Ozone</strong><br />
<strong>Monitoring</strong>. Air Resources Division, Research <strong>and</strong> <strong>Monitoring</strong> Branch, National Park<br />
Service, Lakewood, Colorado, USA. 2004.<br />
Rose, Anita K. <strong>and</strong> J. W. Coulston. <strong>Ozone</strong> <strong>Injury</strong> Across the Southern United States, 2002-06.<br />
Gen. Tech. Rep. SRS-118. U.S. Department of Agriculture Forest Service, Southern<br />
Research Station, Asheville, North Carolina. 2009.<br />
Smith, Gretchen C., W.D. Smith <strong>and</strong> J.W. Coulston. <strong>Ozone</strong> Bioindicator Sampling <strong>and</strong><br />
Estimation. Gen Tech. Rep. NRS-20. U.S. Department of Agriculture, Forest Service,<br />
Northern Research Station, Newton Square, Pennsylvania. 2007.<br />
South Carolina Bureau of Air Quality. State of South Carolina: Network Description <strong>and</strong><br />
Ambient Air Network <strong>Monitoring</strong> Plan Calendar Year 2011. South Carolina Department of<br />
Health <strong>and</strong> Environmental Control (DHEC), South Carolina. 2010.<br />
United States Environmental Protection Agency (EPA). List Of Designated Reference <strong>and</strong><br />
Equivalent Methods. Human Exposure <strong>and</strong> Atmospheric Sciences Division, Research<br />
Triangle Park, North Carolina. 2010.<br />
United States Environmental Protection Agency (EPA). <strong>Ozone</strong>: Good Up High, Bad Nearby.<br />
Brochure. Office of Air <strong>and</strong> Radiation, Washington D.C. 2003.<br />
United States Forest Service (USFS). Phase 3 Field Guide – Section 9. <strong>Ozone</strong> Bioindicator<br />
Plants (east). 2008.<br />
United States Forest Service (USFS), National Park Service, <strong>and</strong> U.S. Fish <strong>and</strong> Wildlife Service.<br />
Federal l<strong>and</strong> managers’ air quality related values work group (FLAG): phase I report—<br />
revised (2010). Natural Resource Report <strong>NPS</strong>/NRPC/NRR—2010/232. National Park<br />
Service, Denver, Colorado. 2010.<br />
Acknowledgments<br />
The investigators wish to thank Dr. Robert Woodman for his guidance <strong>and</strong> input during the early<br />
stages of this protocol’s development. Dr. Woodman was a USGS-BRD ecologist stationed at<br />
MACA during the early development of the <strong>CUPN</strong>. It was Dr. Woodman’s task to assist<br />
network personnel with the design <strong>and</strong> testing of monitoring protocols. The designs <strong>and</strong><br />
methodologies presented in this protocol are based upon early designs <strong>and</strong> methodologies<br />
proposed by Dr. Woodman. Thanks to “Woody” <strong>and</strong> the USGS-BRD. Without their assistance,<br />
this protocol could not have been written.<br />
24
Thanks also to Dr. John Ray <strong>and</strong> Ellen Porter from the Air Resources Division of the National<br />
Park Service. Stationed in Lakewood, Colorado, Dr. Ray <strong>and</strong> Ms. Porter have provided data<br />
access <strong>and</strong> input on the designs presented in this protocol. Ms. Porter also coordinated the<br />
external review process.<br />
The <strong>CUPN</strong> thanks Dr. Robert Kohut of the Boyce Thompson Institute for his assistance in the<br />
development of the foliar injury assessment portion of this protocol. Dr. Kohut met with <strong>CUPN</strong><br />
<strong>and</strong> MACA staff at <strong>CUPN</strong>’s MACA office to help prepare for the 2006 pilot study. He also<br />
traveled to each of the participating <strong>CUPN</strong> parks to assist with implementation in July/August<br />
2006.<br />
The investigators would like to thank the many <strong>CUPN</strong> parks <strong>and</strong> their staff who participated in<br />
the pilot studies initiated by Dr. Woodman <strong>and</strong> the <strong>CUPN</strong> as well as the initial monitoring<br />
undertaken from 2008 to 2010. There were many participants (including the primary author’s<br />
nephew) who helped with servicing <strong>and</strong> the installation or removal of POMS units <strong>and</strong> passive<br />
ozone samplers. Unfortunately, for brevity’s sake, their names cannot all be listed here. Without<br />
their help, the data necessary to arrive at the designs <strong>and</strong> methodologies presented here could not<br />
have been collected.<br />
25
A <strong>Protocol</strong> for <strong>Monitoring</strong> <strong>Ozone</strong> <strong>and</strong> <strong>Foliar</strong> <strong>Injury</strong> throughout the<br />
Cumberl<strong>and</strong> Piedmont Network<br />
St<strong>and</strong>ard Operating Procedure (SOP) #OC1: <strong>Ozone</strong><br />
Concentration - Training of Field Personnel<br />
Revision History Log:<br />
Previous<br />
Version #<br />
Revision<br />
Date<br />
Version 1.0 (November 2011)<br />
Author Changes Made Reason for Change New<br />
Version #<br />
Implementation of this protocol requires an overall project leader <strong>and</strong> additional staff as outlined<br />
in the Table 6. The project leader oversees <strong>and</strong> directs project operations, including training of<br />
personnel. Crews may consist of one crew leader <strong>and</strong> at least one crew member. The crew<br />
leader has ozone sampling techniques expertise <strong>and</strong> is responsible for team tasks. The crew<br />
member has varied <strong>and</strong> less expertise (frequently no expertise), <strong>and</strong> is responsible for assisting<br />
the crew leader (as during installations/removals by helping unload/load system components<br />
from the pickup truck). No pre-training of crew members is necessary provided they are<br />
assigned only menial tasks such as filling out field forms.<br />
Table 6 – Personnel requirements for POMS activities.<br />
Task Personnel required<br />
POMS setup/removal 1 crew leader (typically the project lead) <strong>and</strong> one person from the<br />
host park<br />
POMS weekly maintenance For each POMS, 1 crew leader<br />
POMS repairs 1 crew leader or 1 crew member. Or, if the individual performing<br />
weekly maintenance visits has the skill set necessary, that individual<br />
can perform the repairs.<br />
To effectively work with a POMS, new crew leaders should be thoroughly familiar with the<br />
relevant section of SOP #OC4 which deals with installing/servicing/removing a POMS. New<br />
crew leaders should be given h<strong>and</strong>s-on training by the project leader (or an experienced crew<br />
member designated by the project lead) for the relevant activities detailed in that SOP. The<br />
overall project leader should be a permanent staff member <strong>and</strong> should review any relevant Job<br />
Hazard Analyses with new crew leaders.<br />
26
A <strong>Protocol</strong> for <strong>Monitoring</strong> <strong>Ozone</strong> <strong>and</strong> <strong>Foliar</strong> <strong>Injury</strong> throughout the<br />
Cumberl<strong>and</strong> Piedmont Network<br />
St<strong>and</strong>ard Operating Procedure (SOP) #OC2: <strong>Ozone</strong><br />
Concentration - Pre-Sampling<br />
Revision History Log:<br />
Previous<br />
Version #<br />
Revision<br />
Date<br />
Version 1.0 (November 2011)<br />
Author Changes Made Reason for Change New<br />
Version #<br />
It must be noted that the <strong>NPS</strong> requires research/collecting permits be obtained before any field<br />
work can commence. So, each year <strong>and</strong> for each park, the project lead must submit an<br />
application through the <strong>NPS</strong> Research Permit <strong>and</strong> Reporting System<br />
https://science.nature.nps.gov/research/ac/ResearchIndex. A travel authorization should also be<br />
completed prior to departure when overnight stays are needed.<br />
This SOP describes tasks to be performed prior to site visits. This SOP gives procedures for:<br />
• General site visit preparation<br />
• Scheduling site visits with host parks<br />
• Preparing a POMS for use in the upcoming season<br />
• Preparing to install or remove a POMS<br />
The <strong>CUPN</strong> is currently using two versions of a POMS: second (POMS II) <strong>and</strong> third (POMS III)<br />
generation systems. The POMS II (Figure 12) is an early design by the <strong>Monitoring</strong> Support<br />
Contractor <strong>and</strong> is very similar to the unit that was used by the <strong>CUPN</strong> during its 2005 pilot study.<br />
The POMS II, while relatively compact, is still fairly large. The <strong>CUPN</strong> restarted its usage of the<br />
POMS II during the 2010 sampling season. The unit that we have is on loan from the Gulf Coast<br />
Network <strong>and</strong> <strong>NPS</strong>-ARD. The POMS III (Figure 13) was designed by the <strong>Monitoring</strong> Support<br />
Contractor specifically for the <strong>CUPN</strong>’s use. The <strong>CUPN</strong> began using the POMS III in 2009. The<br />
POMS III is considerably smaller than the POMS II, thereby making transport, assembly <strong>and</strong><br />
disassembly much easier. Preparation differs slightly depending upon whether a POMS II or<br />
POMS III is being utilized. Throughout the rest of the protocol, the term “POMS” is used to<br />
refer to both the POMS II <strong>and</strong> the POMS III.<br />
27
Figure 12 – POMS II near <strong>CUPN</strong>’s MACA office being prepared for its 2010 deployment at STRI.<br />
Figure 13 – POMS III at SHIL during the 2009 sampling season.<br />
General Site Visit Preparation<br />
1. Acquire an <strong>NPS</strong> research/collecting permit. The crew should carry a photocopy of the<br />
permit while in the field.<br />
2. Obtain travel authorization.<br />
3. Review copies of field data forms from recent sampling events to identify any unique<br />
conditions or hazards that may be encountered.<br />
4. Prior knowledge of POMS setup <strong>and</strong> disassembly procedures is necessary for efficient<br />
site setup. Project crew leaders <strong>and</strong> crew members should be trained <strong>and</strong> refreshed (SOP<br />
#OC1 “Training of Field Personnel”) as necessary.<br />
5. A POMS installation crew will need to access the site at which the POMS will be<br />
installed. To locate a particular site, it may be sufficient to arrange for personnel at the host<br />
28
park to escort the installation crew to the site. Otherwise, the crew leader will need to obtain<br />
directions to the site.<br />
Scheduling Site Visits with Host Parks<br />
Site visits should be scheduled with host parks regardless of whether park assistance is needed.<br />
Usually (for installation visits) it is necessary to have personnel from the host park escort<br />
installation person(s). Preferably, the escort would consist of any personnel (such as primary <strong>and</strong><br />
backup operators) that are likely to service the POMS during its residence at the host park. If<br />
these personnel are on-site during the setup, they will gain familiarity with the system by having<br />
seen it installed by the crew – one or two people with more detailed knowledge of the system.<br />
Regardless of whether park personnel are present during the installation, once setup is complete,<br />
the setup crew must train the host park’s personnel (those who will be servicing the POMS<br />
throughout the season) on how to maintain the POMS. The site visit should be scheduled at least<br />
a couple of weeks prior to the time of the visit.<br />
Preparing a POMS for Use in the Upcoming Season<br />
At times outside the ozone season, the POMS will be stored at a designated location at<br />
Mammoth Cave National Park. Storage in this location will make the POMS readily accessible<br />
for preseason preparations. The project lead will be responsible for most of the preseason<br />
preparation. The project lead is generally responsible for:<br />
1. Assembling <strong>and</strong> testing the POMS (see SOP #OC4 for installation instructions) near the<br />
<strong>CUPN</strong>’s MACA office prior to installation at a park.<br />
2. Sending/receiving instrumentation <strong>and</strong> analyzers to/from the <strong>NPS</strong> <strong>Monitoring</strong> Support<br />
Contractor for/after calibration/refurbishing/replacement. This also includes storage modules<br />
(small memory devices used to store POMS data in the event of datalogger <strong>and</strong>/or satellite<br />
failure).<br />
3. Any other activities that need to be completed at the <strong>CUPN</strong>’s storage location.<br />
There are also some tasks that need to be undertaken by the <strong>NPS</strong> <strong>Monitoring</strong> Support Contractor.<br />
These include:<br />
1. Annual calibration of any meteorological equipment associated with the POMS (POMS II<br />
only).<br />
2. Annual calibration of the ozone analyzer.<br />
3. Helping to ensure that the satellite <strong>and</strong> GPS transmitters are functioning properly.<br />
4. Supplying replacement parts as needed.<br />
Preparing to Install or Remove a POMS<br />
Prior to installation at the destination park, the POMS must be disassembled.<br />
POMS II Components<br />
A POMS II should be disassembled into the list of parts shown below.<br />
1. Battery case (contains two batteries <strong>and</strong> power distribution panel)<br />
2. Solar panels with power cabling that attaches to the power distribution panel in (1)<br />
3. Tower’s tripod base<br />
29
4. Tower mast with two enclosures attached (one enclosure houses the datalogger <strong>and</strong> the other<br />
houses the ozone analyzer). There is also power cabling running from the datalogger<br />
enclosure to the power distribution panel in (1). This cabling remains attached <strong>and</strong> coiled<br />
with the tripod center pole.<br />
5. Meteorological equipment <strong>and</strong> mounts including air temperature <strong>and</strong> relative humidity<br />
sensor, wind direction <strong>and</strong> wind speed sensor, solar radiation sensor <strong>and</strong> rainfall tipping<br />
gauge<br />
6. Stakes for securing tower <strong>and</strong> padlocks/keys for battery case <strong>and</strong> two enclosures<br />
7. Grounding rod <strong>and</strong> grounding wire (the grounding wire is attached to the tripod mast)<br />
8. Lightning rod<br />
POMS III Components<br />
A POMS III consists of the parts listed below.<br />
1. Tower<br />
2. Instrumentation case<br />
3. Whip antenna<br />
4. Three (3) battery cases with one 12 volt battery in each case<br />
5. Solar panel<br />
6. Meteorological assembly (one unit with a combination of sensors included) that measures<br />
wind speed, wind direction, air temperature, relative humidity <strong>and</strong> atmospheric pressure<br />
7. Stakes for securing tower to ground<br />
Pre-trip Checklist<br />
The steps for disassembling a POMS II <strong>and</strong> POMS III are provided in (SOP) #OC4: <strong>Ozone</strong><br />
Concentration - Removing, Installing <strong>and</strong> Servicing a Portable <strong>Ozone</strong> <strong>Monitoring</strong> Station. The<br />
following steps should also be completed prior to departing for a destination park, regardless of<br />
whether the trip is for installation or removal of a POMS.<br />
1. Know how to navigate to the park(s) to be visited. Obtain any necessary maps.<br />
2. If necessary, make any necessary travel arrangements. This includes hotel reservations <strong>and</strong><br />
completion of travel authorization.<br />
3. Arrange to have a vehicle for the trip. An open-bed pickup truck (preferably 4-wheel drive,<br />
depending upon the site) is the best option.<br />
4. Assemble the tools/supplies necessary. The minimum tool set should include:<br />
a. Portable h<strong>and</strong>held GPS unit with spare fully charged batteries<br />
b. Two pound hammer<br />
c. Crow bar<br />
d. Short planks <strong>and</strong>/or blocks of wood<br />
e. Flat blade screwdriver<br />
f. Wire stripper <strong>and</strong> crimping tool<br />
g. Wire cutters<br />
h. Campbell Scientific flat blade screwdriver (or a smaller, flat blade screwdriver as from<br />
a precision screwdriver set)<br />
i. Phillips screwdriver<br />
j. Adjustable wrench<br />
30
k. Rope or motorcycle ratchet strap to secure solar panels in bed of truck (POMS II<br />
only)<br />
l. Socket wrench<br />
m. Sockets<br />
n. Socket extension<br />
o. Arc joint pliers<br />
p. Electrical tape<br />
q. Extra locks/keys<br />
5. Verify that the portable GPS unit (preferably h<strong>and</strong>held) is working properly.<br />
6. Purchase supplies as necessary.<br />
7. If this is an installation trip, the POMS will currently be assembled at the <strong>CUPN</strong> office.<br />
Disassemble <strong>and</strong> load POMS into the pickup truck.<br />
8. Depart.<br />
31
A <strong>Protocol</strong> for <strong>Monitoring</strong> <strong>Ozone</strong> <strong>and</strong> <strong>Foliar</strong> <strong>Injury</strong> throughout the<br />
Cumberl<strong>and</strong> Piedmont Network<br />
St<strong>and</strong>ard Operating Procedure (SOP) #OC3: <strong>Ozone</strong><br />
Concentration – Establishment <strong>and</strong> Location of Sampling<br />
Sites<br />
Revision History Log:<br />
Previous<br />
Version #<br />
Revision<br />
Date<br />
Version 1.0 (November 2011)<br />
Author Changes Made Reason for Change New<br />
Version #<br />
This SOP explains the procedures used for establishing <strong>and</strong> locating ozone sampling locations.<br />
<strong>Ozone</strong> sampling is accomplished using Portable <strong>Ozone</strong> <strong>Monitoring</strong> Stations (POMS) as designed<br />
<strong>and</strong> manufactured by the <strong>NPS</strong> <strong>Monitoring</strong> Support Contractor.<br />
Establishment of Sampling Sites<br />
Sampling sites are based heavily upon those utilized during the developmental phase of this<br />
protocol which began in 2004. <strong>Ozone</strong> sampling was accomplished using passive samplers in<br />
2004/2005 <strong>and</strong> two POMS in 2005. For each park, multiple passive sites were chosen to provide<br />
good spatial coverage <strong>and</strong> data from multiple elevations. The POMS sites were selected from<br />
amongst the passive monitoring sites. In 2004, only two sites were outfitted with a POMS (at<br />
LIRI <strong>and</strong> RUCA). Both of the 2004 sites were collocated with passive samplers. In 2005,<br />
POMS units were collocated with passive samplers for three weeks at each participating park,<br />
with only a couple of the POMS being located away from passive samplers.<br />
From 2006 to present, passive collectors have not been used. During this time, the <strong>CUPN</strong> has<br />
used only POMS stations for on-park ozone sampling. This cessation of passive monitoring is<br />
due to the fact that the <strong>CUPN</strong> is not currently studying spatial variability in ozone across any<br />
given park. The <strong>CUPN</strong> also wishes to obtain more temporally detailed data from each site. It is<br />
the intent of the <strong>CUPN</strong> to select a location within a park that is representative in elevation <strong>and</strong><br />
weather patterns of the park. Data from that monitor will be used to compute exposure indices<br />
such as the W126 <strong>and</strong> the SUM06.<br />
A summary of POMS monitoring efforts from 2004 through present is shown in Table 7.<br />
In future monitoring efforts, the <strong>CUPN</strong> intends to use a POMS on only twelve of the fourteen<br />
<strong>CUPN</strong> parks (all <strong>CUPN</strong> parks are shown in Figure 5 <strong>and</strong> Listed in Table 1). The two parks that<br />
will not be sampled with a POMS (COWP <strong>and</strong> MACA) are equipped with EPA-certified<br />
32
equivalent methods. Should either of those parks lose their current monitors, it will be sampled<br />
with a POMS as are the other twelve parks. The sampling schedule for <strong>CUPN</strong> parks is presented<br />
in the protocol narrative (Table 4).<br />
Table 7 – <strong>CUPN</strong> parks where POMS sampling has taken or is taking place.<br />
Park Site Name Dates of<br />
Operation<br />
33<br />
Collocated<br />
with<br />
passive?<br />
Used in<br />
future?<br />
ABLI Knob Creek High 2005 Yes No<br />
ABLI Visitor Center 2006 – 2007 No Yes<br />
CARL Granite Dome 14 2005 Yes Yes<br />
CHCH Maintenance Area Field 2005 Yes No<br />
CUGA Hensley Settlement 2006 – Present No Yes<br />
CUGA Lincoln Memorial University (off-park) 2005 No No<br />
CUGA Pinnacles 2005 Yes No<br />
FODO Visitor Center 2005 Yes Yes<br />
KIMO Reservoir Hill 2005 Yes Yes<br />
LIRI Rim – High 2004 Yes Yes<br />
MACA Great Onyx Job Corps 2005 Yes No<br />
MACA Great Onyx Meadow 2005 Yes No<br />
NISI Bumble Bee Hill 2005 Yes Yes<br />
RUCA Not named (but near Visitor Center) 2004 Yes Yes<br />
SHIL Russian Tenant Field 2005 Yes Yes<br />
STRI South Chicago Bottom Field 2005 Yes No<br />
Many of the sites listed in Table 7 will be used in the future. It should be noted, however, that,<br />
in Table 7, some parks have multiple sites <strong>and</strong> some parks (COWP <strong>and</strong> GUCO) were not<br />
sampled. A list all of the <strong>CUPN</strong> parks as well as anticipated sampling sites within each park is<br />
given in Table 8. At most parks, we anticipate utilizing the same locations as those used in 2005<br />
(with the exception of ABLI <strong>and</strong> CUGA, where we will use the sampling sites that were used<br />
beginning in 2006). For GUCO, where no monitoring was completed in 2005, the site will be<br />
selected by <strong>CUPN</strong> staff in cooperation with park staff. Also note that, in 2010, sampling sites at<br />
CHCH <strong>and</strong> STRI were relocated due to park restrictions on site usage.<br />
Table 8 – Anticipated POMS sites.<br />
Park Site Name<br />
ABLI Visitor Center<br />
CARL Granite Dome 14<br />
CHCH Lookout Mountain<br />
COWP --<br />
CUGA Hensley Settlement<br />
FODO Visitor Center<br />
GUCO ----To Be Determined----<br />
KIMO Reservoir Hill<br />
LIRI Rim - High<br />
MACA --<br />
NISI Bumble Bee Hill<br />
RUCA Visitor Center<br />
SHIL Russian Tenant Field<br />
STRI Beasley Field<br />
Site Selection Criteria<br />
Generally, site selection criteria include(d) the following:
• Is the site elevation typical or average for the park?<br />
• Is the site free of localized weather patterns (such as nighttime inversions that settle into<br />
valleys)?<br />
• Is the site free of pollution sources that are not typical of the entire park?<br />
• Is the site in an open field, free of high vegetation that could disrupt wind patterns around the<br />
POMS?<br />
• Is the site easily accessed?<br />
• Is the site secure?<br />
34
A <strong>Protocol</strong> for <strong>Monitoring</strong> <strong>Ozone</strong> <strong>and</strong> <strong>Foliar</strong> <strong>Injury</strong> throughout the<br />
Cumberl<strong>and</strong> Piedmont Network<br />
St<strong>and</strong>ard Operating Procedure (SOP) #OC4: <strong>Ozone</strong><br />
Concentration - Removing, Installing <strong>and</strong> Servicing a<br />
Portable <strong>Ozone</strong> <strong>Monitoring</strong> Station<br />
Revision History Log:<br />
Previous<br />
Version #<br />
Revision<br />
Date<br />
Version 1.0 (November 2011)<br />
Author Changes Made Reason for Change New<br />
Version #<br />
This SOP explains the procedures used for removal, installation, <strong>and</strong> servicing of portable ozone<br />
monitoring stations (POMS) that should be followed by all project crews during POMS<br />
removals/installations <strong>and</strong> service visits. Service visit information includes detailed procedures<br />
for data collection <strong>and</strong> maintenance of in-situ equipment.<br />
Assembly <strong>and</strong> Disassembly of a Second Generation POMS (POMS II)<br />
POMS II Assembly<br />
The steps for assembling a POMS II are below. An assembled POMS II is shown in Figure 14.<br />
1. Open <strong>and</strong> secure the legs on the tower’s tripod base. To open the tripod legs, push<br />
outward on each of the tripod legs (it may be necessary to further loosen the bolts that<br />
prevent the legs from moving). Caution: be careful when pressing out on the tripod leg not to<br />
get fingers pinched by the parts that will move. If this approach is unsuccessful in getting the<br />
leg to open, it may be necessary to use a hammer to jar the leg into motion. Once the legs are<br />
fully open <strong>and</strong> the tripod is resting upright on the ground without wobbling, secure the bolts<br />
that prevent the legs from moving.<br />
2. Connect the tower’s mast <strong>and</strong> secure the meteorological sensors <strong>and</strong> ozone intake on<br />
the tripod’s upper portion. The mast is a piece of conduit with male threads on its lower<br />
end. This piece of conduit threads into a female connector on the tripod base. Lay the tripod<br />
on the ground <strong>and</strong> insert mast. With at least two people <strong>and</strong> holding the mast above the<br />
enclosures, push the tower onto its feet, being careful not to pull the mast from the tripod<br />
base. With both sections of tower now st<strong>and</strong>ing upright, screw the mast into the tripod base.<br />
To screw in the mast, turn it clockwise by pressing against the datalogger <strong>and</strong> ozone analyzer<br />
enclosures. Continue to turn the mast until the two tower sections are snugly attached to one<br />
another. Next, on the top section of the tripod, move the meteorological sensor <strong>and</strong> ozone<br />
intake into position <strong>and</strong> tighten the u-bolts that secure them.<br />
35
3. Secure the tower <strong>and</strong> solar panels. The tower is secured to the ground using short lengths<br />
of capped rebar. The feet of the tripod base have holes through which to drive these pieces<br />
of rebar. Drive one piece of rebar through each of these holes. The solar panel assembly is<br />
held in place simply by placing the battery case across the assembly’s horizontal 2X4X6<br />
(approximately) feet.<br />
4. Unwrap any loose cabling around the mast. There should be a few cables loosely wrapped<br />
around the mast. These cables should be unwrapped for later use.<br />
5. Connect the GPS transmitter <strong>and</strong> the satellite whip antenna. Each of these devices<br />
connects to the Orbcomm transmitter via a length of cable. These cables may be pulled into<br />
the datalogger enclosure through the cable port in the enclosure. Each device should be<br />
attached to the datalogger enclosure’s solar shield by its magnetic base. Each of the devices<br />
has a unique connector so that it will plug into only one place on the Orbcomm transmitter.<br />
Figure 14 – An assembled POMS II at STRI in 2010. Photograph by STRI staff.<br />
6. Mount the meteorological sensors <strong>and</strong> ozone intake onto the tower’s mast or crossarm.<br />
The sensors should be mounted as prescribed by the <strong>NPS</strong> <strong>Monitoring</strong> Support Contractor.<br />
On the POMS II in <strong>CUPN</strong>’s possession, the sensors are mounted as shown in Figure 14. The<br />
sensors are mounted in the following order, moving from the lowest point on the mast to the<br />
highest point:<br />
a. Rain gauge that is mounted onto its own special mounting arm<br />
b. Air temperature/relative humidity probe<br />
c. <strong>Ozone</strong> intake<br />
d. Mounting arm with wind direction/speed <strong>and</strong> solar radiation sensors<br />
Note that the mounting arm for the wind <strong>and</strong> solar radiation sensors should be oriented<br />
along an approximate north/south axis.<br />
7. Attach the sensor wires to the datalogger’s wiring panel. Route the wiring for each of the<br />
sensors through the opening on the bottom of the enclosure. Wire the sensors into the wiring<br />
panel as instructed by the <strong>NPS</strong> <strong>Monitoring</strong> Support Contractor.<br />
36
8. Connect the ozone intake line to the ozone analyzer’s ozone inlet. Route the intake line<br />
through the opening on the bottom of the enclosure. Connect the intake line to the intake<br />
port on the back of the ozone analyzer.<br />
9. Install the grounding rod <strong>and</strong> attach the grounding wire to the grounding rod. The<br />
grounding wire is secured to the grounding rod using a grounding nut. Drive the grounding<br />
rod into the ground, insert the grounding wire into the grounding nut <strong>and</strong> tighten the bolt.<br />
The grounding rod should be driven at least one foot into the ground. Be certain to drive the<br />
grounding rod in a location where it is unlikely that park personnel will inadvertently trip on<br />
it or scrape their leg. The opposite end of the grounding wire should be connected to the<br />
tripod base using its grounding lug.<br />
10. Connect the batteries to each other <strong>and</strong> the power distribution panel. Recall that<br />
batteries will be “tied together” using shunts. Note also that on one of the batteries has no<br />
wires attached. It is to this battery that all wires should be connected. First, connect the<br />
negative lead <strong>and</strong> the negative shunt to the negative post on this battery. Then connect the<br />
positive lead <strong>and</strong> the positive shunt to the positive post on this battery.<br />
11. Connect the power cabling from the solar panels. Because the solar panels are always<br />
active, the leads are always powered, even though they are not plugged into the power<br />
distribution panel. Therefore, use caution while h<strong>and</strong>ling these leads. The cabling must be<br />
run through the inlet on the battery case. Unscrew the cap that secures the cabling in the inlet<br />
<strong>and</strong> keeps the inlet weathertight. Run the cabling through this inlet cap <strong>and</strong> then through the<br />
inlet on the battery case. Screw the inlet cap over the inlet. Now the cabling may be<br />
attached to the power distribution panel. First, attach the negative lead to its connector on the<br />
power distribution panel. Lastly, attach the positive lead to its connector on the power<br />
distribution panel.<br />
12. Connect the power cabling to the datalogger. This should be done at the power<br />
distribution panel that resides in the battery case. The cabling must be run through the inlet<br />
on the battery case. Unscrew the cap that secures the cabling in the inlet <strong>and</strong> keeps the inlet<br />
weathertight. Run the cabling through this inlet cap <strong>and</strong> then through the inlet on the battery<br />
case. Screw the inlet cap over the inlet. Now the cabling may be attached to the power<br />
distribution panel. First, attach the negative lead to its connection point on the power<br />
distribution panel. Then, attach the positive lead to its connector near the fuse panel.<br />
13. Power up the ozone analyzer. This is accomplished by turning on the first bit on the<br />
Campbell Scientific datalogger. Key in “*6AD1” to turn the bit <strong>and</strong> analyzer on. More<br />
information on “bits” may be found in the subsequent section “Notes on Campbell Scientific<br />
Datalogger Modes <strong>and</strong> Comm<strong>and</strong>s”.<br />
14. Fill each of the openings on the bottoms of the datalogger <strong>and</strong> ozone analyzer<br />
enclosures with plumber’s putty to prevent insects <strong>and</strong> water from entering the<br />
enclosure.<br />
15. Perform a calibration check of the rain gauge.<br />
16. Perform a routine biweekly maintenance visit. This will ensure that the POMS is working<br />
properly after it has been assembled on site. Performing this biweekly visit also allows for<br />
the training of new site operators while an actual maintenance visit is being performed.<br />
Inform the <strong>NPS</strong> <strong>Monitoring</strong> Support Contractor of any problems noted.<br />
17. Train site operators. It is a good idea to run through an actual site visit (as in step 16), so<br />
that new site operators can see how to execute each of the steps detailed in the subsequent<br />
section “Biweekly Maintenance Visits: Servicing an Installed Second or Third Generation<br />
37
POMS (POMS II or POMS III)”. Having seen the steps carried out also makes the site<br />
operators more comfortable with operating the POMS.<br />
18. For newly established sites, use h<strong>and</strong>held GPS to get site coordinates. Consult the<br />
owner’s manual for the GPS device being used to find out how to take a waypoint with that<br />
GPS device. Use the UTM NAD83 coordinate system. Forward these coordinates to<br />
<strong>CUPN</strong>’s GIS specialist upon return to the office.<br />
19. Take site photographs from each of the cardinal directions. Take one good photograph<br />
of the POMS from each of the cardinal directions (north, east, south, <strong>and</strong> west). Additional,<br />
artistic photographs that may be useful in reports should also be taken. These should be<br />
JPEG formatted <strong>and</strong> medium resolution (800 X 600 pixels <strong>and</strong> normal image quality is<br />
sufficient). Upon return to the office, these photographs should be transferred to the <strong>CUPN</strong>’s<br />
hard drive which undergoes tape-backup on a regular basis.<br />
20. Call the <strong>NPS</strong> <strong>Monitoring</strong> Support Contractor so installation at the site can be<br />
documented. The contractor’s phone number is printed on the maintenance field form.<br />
POMS II Disassembly<br />
The steps for disassembling a POMS II are as detailed below. They are essentially the reverse of<br />
the assembly with some steps at the end of the assembly process omitted.<br />
1. Perform a routine biweekly maintenance visit prior to disassembly of the POMS. This<br />
will ensure that the POMS is working properly before it is removed from the current site.<br />
Fill out the field form. Inform the <strong>NPS</strong> <strong>Monitoring</strong> Support Contractor of any problems<br />
noted.<br />
2. Power down the ozone analyzer. This is accomplished by turning the first bit off on the<br />
Campbell Scientific datalogger. Key “*6AD1” to turn the bit <strong>and</strong> analyzer off. Details on<br />
“bits” may be found in the subsequent section “Notes on Campbell Scientific Datalogger<br />
Modes <strong>and</strong> Comm<strong>and</strong>s”.<br />
3. Disconnect the power cabling to the datalogger. This should be done at the power<br />
distribution panel that resides in the battery case. First, detach the positive lead from its<br />
connector near the fuse panel. Then, detach the negative lead from its connection point on<br />
the power distribution panel. The cable can now be pulled out of the battery case. Unscrew<br />
the cap that holds the cable in place on the outside of the battery case <strong>and</strong> pull the cable out<br />
of that inlet. Replace the cap on the battery case so that it is not lost.<br />
4. Disconnect the power cabling from the solar panels. First, detach the positive lead from<br />
its connector on the power distribution panel. Because the solar panels are still active, the<br />
leads are always powered, even though they are not plugged into the power distribution<br />
panel. Therefore, once the lead has been disconnected, be careful not to allow the lead to<br />
come in contact with metallic surfaces or there could be an electrical short. After the positive<br />
lead has been disconnected, it should have a couple of wraps of electrical tape placed around<br />
its exposed wires to prevent this shorting. Then, the positive lead may also be bent back on<br />
itself <strong>and</strong> taped to itself. The negative lead should now be disconnected from its connector<br />
on the power distribution panel. As in (2), the cabling should be pulled from the inlet in the<br />
side of the battery case.<br />
5. Disconnect the batteries from each other <strong>and</strong> the power distribution panel. This is<br />
accomplished by disconnecting wires from the posts of one of the batteries. It should be<br />
noted that the batteries are “tied together” by a pair of wires (one wire runs between the<br />
positive posts on the batteries <strong>and</strong> one wire runs between the negative posts on the batteries<br />
38
<strong>and</strong> those wires will be referred to as shunts). Note also that on one of the batteries will be a<br />
set of wires that run from the posts to the power distribution panel. It is from this battery<br />
with wires leading to the power distribution panel that the wires should be disconnected.<br />
First, disconnect the positive leads <strong>and</strong> then disconnect the negative leads. Note that the<br />
loose end of the shunt that runs from the other battery’s positive post should taped with<br />
electrical tape to prevent electrical discharge. Replace the connecting bolts back onto the<br />
battery terminals so that those bolts are not misplaced.<br />
6. Unwire from the datalogger the signal/power lines running from the meteorological<br />
sensors. Simply unscrew the lug on the datalogger’s wiring panel <strong>and</strong> pull the wiring out.<br />
Be certain that only wiring to the sensor is being removed <strong>and</strong> not wiring from other system<br />
components. Pull the cabling out of the enclosure.<br />
7. Dismount the meteorological sensors from the mast. Carefully dismount the sensors <strong>and</strong><br />
place them in the cab of the pickup truck in such a way that they will not be damaged in<br />
transit.<br />
8. Detach the grounding wire from the grounding rod. The grounding wire is secured to the<br />
grounding rod using a grounding nut. Simply loosen the bolt to allow the grounding wire to<br />
come out. Pull the grounding rod out of the ground <strong>and</strong> stow it in the bed of the pickup<br />
truck.<br />
9. Disconnect the GPS transmitter <strong>and</strong> the satellite whip antenna. Each of these devices is<br />
connected to the Orbcomm transmitter via a length of cable. These cables may be<br />
disconnected at the Orbcomm <strong>and</strong> pulled through the cable port in the enclosure. The whip<br />
antenna may be stored in the bed of the truck, but the GPS transmitter is best stored in the<br />
datalogger enclosure.<br />
10. Wrap any loose cabling around the mast. There will be a few cables hanging loosely from<br />
the mast of the tripod. These should be loosely wrapped around the mast to prevent them<br />
from wrapping around the tripod base in step 10.<br />
11. Remove any stakes that are holding the tower <strong>and</strong> solar panels down. Typically, the<br />
tripod <strong>and</strong> solar panel assembly are secured to the ground using short lengths of capped<br />
rebar. Depending upon how deeply the stakes are driven into the ground, the stakes can<br />
either be pulled out by h<strong>and</strong> or it may be necessary to use a pry bar to pull them out.<br />
12. Disconnect the mast of the tripod from its base. The mast of the tripod is a piece of<br />
conduit with male threads on its lower end. This piece of conduit threads into a female<br />
connector on the base of the tripod. To unscrew the mast of the tripod, turn it counterclockwise<br />
by pressing against the datalogger <strong>and</strong> ozone analyzer enclosures. Continue to<br />
turn the mast of the tripod until a popping sound is heard. The mast <strong>and</strong> base of the tripod<br />
are now loose from one another. Using at least two people, lean the entire tripod onto its<br />
side. With the tripod resting on its side, pull the mast away from the tripod base.<br />
13. Collapse the legs on the tripod base <strong>and</strong> loosen the meteorological sensors <strong>and</strong> ozone<br />
intake on the mast. To collapse one of the tripod legs, loosen the bolts that prevent it from<br />
moving. Then, push the leg toward the center of the tripod. Caution: be careful when<br />
pressing down on the tripod leg not to get fingers pinched by the parts that will move. If this<br />
approach is unsuccessful in getting the leg to collapse, it may be necessary to use a hammer<br />
to jar the leg into motion. Repeat for the remaining legs.<br />
14. Load all parts into a pickup truck. Each of these parts should be carefully loaded into the<br />
bed of a pickup truck. Place the solar panel assembly next to the cab of the pickup truck<br />
(with the front of the panels against the cab) <strong>and</strong> secure it with either rope or a ratcheting<br />
39
motorcycle strap that was passed through the cab of the truck. The solar panels should st<strong>and</strong><br />
sideways <strong>and</strong> upright. Place the battery case against the back side of the solar panel array to<br />
help provide additional support. Behind the battery case, place the mast of the tripod with<br />
the top of the mast facing the tailgate of the truck. The mast should be secured to the bed of<br />
the pickup using rope or a motorcycle strap that was passed through the eyelets in the front of<br />
the pickup bed. All other parts should be placed in open places in the bed of the truck.<br />
15. Call the <strong>NPS</strong> <strong>Monitoring</strong> Support Contractor so the POMS’ removal from the site can<br />
be documented. The contractor’s phone number is printed on the maintenance field form.<br />
Assembly/Disassembly of a Third Generation POMS (POMS III)<br />
The steps to assemble a POMS III are given below. To disassemble a POMS III, reverse these<br />
steps, excluding steps 15 through 17. An assembled POMS III is shown in Figure 15.<br />
1. Open the tower’s tripod legs <strong>and</strong> lock them in place. Align the holes on each of the legs<br />
with the holes on each pair of vertical plates at base of the mast. Insert the supplied pin<br />
through the holes to hold the legs in place.<br />
2. Hammer one piece of rebar into each of the tripod’s feet. Each piece of rebar has a hose<br />
clamp at the top to hold the tripod feet down. Adjust the location of the hose clamp to within<br />
about a decimeter of the top of the rebar <strong>and</strong> tighten down the hose clamp. Drive a piece of<br />
rebar through each hole in the feet of the tripod until the hose clamp is pressed firmly against<br />
the tripod foot.<br />
3. Attach the meteorological sensor pack/ozone intake to the top of the mast. Simply slide<br />
the base of the pack over the top of the mast <strong>and</strong> tighten the wing bolts against the mast.<br />
4. Raise the telescoping section of the mast. Lift up on the top section of the mast until the<br />
hole in the top section aligns with the hole in the lower section. Insert the pin that is<br />
provided to lock the top section in place.<br />
5. Attach the solar panel to the tower’s mast. The solar panel is attached to the mast using<br />
two hose clamps. Orient the panel so that if faces south <strong>and</strong> is tilted downward<br />
approximately 15 degrees below level. Note that tilt shown in Figure 15 is too steep.<br />
6. Attach the Pelican case containing the datalogger <strong>and</strong> ozone analyzer. The Pelican case<br />
has attached to its backside a flat metal plate. This plate fits into a slot on the tripod mast<br />
that is formed between the mast <strong>and</strong> another metal plate running parallel to the mast. Slide<br />
the plate on the Pelican case into the slot on the mast. A bolt is supplied with the Pelican<br />
case. Run the bolt through the hole in the mast <strong>and</strong> into the female threaded hole on the<br />
backside of the Pelican case <strong>and</strong> secure using a socket wrench.<br />
40
Figure 15 – An assembled POMS III at CHCH in 2010.<br />
7. Connect the meteorological sensor pack to the datalogger via the quick connect on the<br />
bottom of the Pelican case. There are two quick connects of differing sizes on the bottom<br />
of the Pelican case. Connect the sensor pack connector to the Pelican case connector that<br />
matches its size.<br />
8. Connect the ozone intake line from the meteorological sensor pack/ozone intake to the<br />
port on the bottom of the Pelican case. At the bottom end of the intake line is a female<br />
coupler. Screw the coupler onto the male coupler that is attached to the bottom side of the<br />
Pelican case. There is only one such male coupler.<br />
9. Use electrical tape or cable ties to secure the meteorological sensor pack’s signal cable<br />
<strong>and</strong> the ozone intake line to the tower’s mast. Use tape or a cable tie about every ½ meter.<br />
10. Install <strong>and</strong> connect the satellite transmitter’s whip antenna. Route the base of the whip<br />
antenna <strong>and</strong> its cable through the hole on the top-left of the Pelican case. Secure the antenna<br />
using the supplied nut. If necessary, place a str<strong>and</strong> of plumber’s putty around the base of the<br />
antenna <strong>and</strong> on the outside of the case to prevent water from entering the case. Connect the<br />
antenna cable to the port on the satellite transmitter.<br />
11. Connect the batteries to each other. There are two short sections of cable with which to<br />
connect the battery cases. The quick connects on the cables are color-coded to match their<br />
receptor connectors on the battery cases. One of the battery cases contains the power<br />
controller <strong>and</strong> has three connectors on it: one for connecting to the other batteries, one for<br />
connecting to the solar panel <strong>and</strong> one for connecting to the datalogger/ozone<br />
analyzer/satellite modem. Again, match the colors on the connectors for connecting to this<br />
battery case. Place each of the battery cases on one of the tripod’s feet to help hold the tower<br />
in place.<br />
41
12. Connect the solar panel to the series of batteries. Connect the cable from the solar panel<br />
to the aforementioned connector on the battery case by matching the colors of the connectors.<br />
13. Connect the series of batteries to the datalogger/ozone analyzer via the quick connect at<br />
the bottom of the Pelican case. A third short section of cable should be connected between<br />
the aforementioned battery case connector to the connector on the bottom of the Pelican case.<br />
Use the color coding for attaching to the battery case <strong>and</strong> use the size of the connector to<br />
determine which connector to plug into on the bottom of the Pelican case.<br />
14. Perform a routine biweekly maintenance visit. This will ensure that the POMS is working<br />
properly after it has been assembled on site. Performing this biweekly visit also allows for<br />
the training of new site operators while an actual maintenance visit is being performed.<br />
Inform the <strong>NPS</strong> <strong>Monitoring</strong> Support Contractor of any problems noted.<br />
15. Train site operators. It is a good idea to run through an actual site visit (as in step 14), so<br />
that new site operators can see how to execute each of the steps detailed in the subsequent<br />
section “Biweekly Maintenance Visits: Servicing an Installed Second or Third Generation<br />
POMS (POMS II or POMS III)”. Having seen the steps carried out also makes the site<br />
operators more comfortable with maintaining the POMS.<br />
16. For newly established sites, use h<strong>and</strong>held GPS to get site coordinates. Consult the<br />
owner’s manual for the GPS device being used to find out how to take a waypoint with that<br />
GPS device. Use the UTM NAD83 coordinate system. Forward these coordinates to<br />
<strong>CUPN</strong>’s GIS specialist upon return to the office.<br />
17. Take site photographs from each of the cardinal directions. Take one good photograph<br />
of the POMS from each of the cardinal directions (north, east, south, <strong>and</strong> west). Additional,<br />
artistic photographs that may be useful in reports should also be taken. These should be<br />
JPEG formatted <strong>and</strong> medium resolution (800 X 600 pixels <strong>and</strong> normal image quality is<br />
sufficient). Upon return to the office, these photographs should be transferred to the <strong>CUPN</strong>’s<br />
hard drive which undergoes tape-backup on a regular basis.<br />
18. Call the <strong>NPS</strong> <strong>Monitoring</strong> Support Contractor so installation at the site can be<br />
documented. The contractor’s phone number is printed on the maintenance field form.<br />
Biweekly Maintenance Visits: Servicing an Installed Second or Third Generation<br />
POMS (POMS II or POMS III)<br />
Regular maintenance of POMS units is an important activity that will ensure that the POMS is<br />
operating properly <strong>and</strong> that the air supply to the ozone analyzer is adequate. The primary<br />
reasons for biweekly maintenance visits are to:<br />
1. Ensure that the POMS has not been damaged.<br />
2. Ensure that the POMS has sufficient power.<br />
3. Ensure that the Campbell Scientific datalogger is functioning properly.<br />
4. Ensure that the meteorological sensors are functioning properly.<br />
5. Ensure that the ozone analyzer is working properly.<br />
6. Exchange the particle filter that is on the intake side of the ozone analyzer.<br />
POMS II Checklist<br />
1. Retrieve a new site checklist form from the notebook. These forms are stored in a three<br />
ring binder that is typically stored on-site in the battery case (although some site operators<br />
opt to keep these binders in their office). An example of a completed maintenance form is<br />
shown in Figure 16.<br />
42
2. Fill in the site name <strong>and</strong> observer information on the checklist. These data include the<br />
site name, operator name, <strong>and</strong> information on the condition of the tripod assembly (is it<br />
secure?).<br />
3. Fill in the date <strong>and</strong> time (local st<strong>and</strong>ard time) from the datalogger by keying *5. Keying<br />
*5 will display the time, <strong>and</strong> to view the date (as year <strong>and</strong> Julian day), the user must press the<br />
“A” key to advance to the next datum. Keying “A” once displays the year, <strong>and</strong> keying the<br />
“A” key once more will display the Julian day.<br />
4. Fill in the current meteorological, battery level, <strong>and</strong> ozone data from the datalogger.<br />
This is accomplished by keying “*6” to enter *6 mode <strong>and</strong> keying “A” to advance forward or<br />
keying “B” to back up through various parameters. If any of the data are unreasonable (such<br />
as negative values for ozone concentration data), the site operator should contact the <strong>NPS</strong><br />
monitoring support contractor to let them now about the problem.<br />
5. Flag the ozone data. Flagging the ozone data is accomplished by keying “D” from *6 mode<br />
<strong>and</strong> then keying “7” to turn Bit 7 on. By flagging the data, the operator indicates to users of<br />
the data that the instrumentation is being serviced <strong>and</strong> the data are being affected by this<br />
servicing. Flagging the data indicates to users that those data are invalid <strong>and</strong> should be<br />
discarded. For more general information on flags, see the text on flags in the subsequent<br />
section “Notes on Campbell Scientific Datalogger Modes <strong>and</strong> Comm<strong>and</strong>s.”<br />
6. Change out the particle filter in the orange filter holder that is attached to the 2B<br />
analyzer’s intake line. This circular, paper-thin filter is in the path of the air as it makes its<br />
way to the ozone analyzer. It is the job of the filter to catch dust <strong>and</strong> debris so that it does not<br />
enter into the ozone analyzer. Clogged filters will prevent sufficient airflow from entering<br />
the ozone analyzer, so these filters need to be changed biweekly. Change the filter by<br />
unscrewing the top half of the filter holder from the bottom half of the filter holder. It may<br />
be necessary to use the filter wrenches provided to loosen the two halves from one another.<br />
The old filter should be removed <strong>and</strong> discarded. Installation of the new filter should be done<br />
carefully, as improper h<strong>and</strong>ling of the filter can result in oils from the operator’s fingers<br />
getting onto the filter (this will attract <strong>and</strong> hold excessive amounts of dirt <strong>and</strong> prevent<br />
airflow). To avoid this problem, hold the new filter at the very edge of the filter, drop it into<br />
place on the filter holder, <strong>and</strong> reattach the two filter halves to one another. Use the filter<br />
wrenches to snug the filter halves together. If a fresh supply of filters is necessary, contact<br />
either the <strong>NPS</strong> <strong>Monitoring</strong> Support Contractor (or the project lead who will then contact the<br />
<strong>NPS</strong> <strong>Monitoring</strong> Support Contractor).<br />
7. Verify that no supply lines came loose while the particle filter was being replaced. Pay<br />
particular attention to the air supply line as it enters the ozone analyzer, as this connection<br />
has a tendency to come loose.<br />
8. Unflag the ozone data. This is accomplished by keying “D” from *6 mode <strong>and</strong> then keying<br />
“7” to turn Bit 7 off. This activity has exactly the same sequence of steps as step 5, but here<br />
the ozone data are being unflagged rather than flagged. It should be noted that it takes<br />
several minutes for the ozone analyzer to recover after being serviced. So, ozone data will<br />
continue to be affected even after the flag has been turned off. The <strong>NPS</strong> <strong>Monitoring</strong> Support<br />
Contractor will invalidate these data as appropriate during the data validation process.<br />
9. Complete the checklist. Complete the “other comments” section of the checklist, wherein<br />
the user should document any problems, unusual conditions, or supplies needed. It is also a<br />
good idea to review the checklist to make certain that each item on the checklist has been<br />
43
addressed. Call the project lead or <strong>NPS</strong> <strong>Monitoring</strong> Support Contractor to report any<br />
problems that were discovered.<br />
10. Close <strong>and</strong> lock the datalogger <strong>and</strong> ozone analyzer enclosures. Both of these enclosures<br />
(as well as the battery case) are equipped with padlocks. These should be in place upon<br />
departure to prevent theft or damage to the equipment between site visits.<br />
11. Upon return to the office, mail only the yellow carbon copy of the checklist to the<br />
address indicated on the bottom of the checklist. The yellow carbon copy should be<br />
mailed to the <strong>NPS</strong> <strong>Monitoring</strong> Support Contractor. Alternatively, the form may be faxed to<br />
the <strong>NPS</strong> <strong>Monitoring</strong> Support Contractor using the number provided on the form. The white<br />
original should remain in the notebook provided.<br />
Figure 16 – An example POMS II maintenance visit form.<br />
POMS III Checklist<br />
1. Retrieve a new site checklist form from the notebook. These forms are stored in a three<br />
ring binder that is typically stored on-site in the battery case (although some site operators<br />
opt to keep these binders in their office). An example of a completed maintenance form is<br />
shown in Figure 17.<br />
44
2. Fill in the site name <strong>and</strong> observer information on the checklist. These data include the<br />
site name, operator name, <strong>and</strong> information on the condition of the tripod assembly (is it<br />
secure?).<br />
3. Fill in the date <strong>and</strong> time (local st<strong>and</strong>ard time) from the datalogger by pressing the<br />
“Enter” key. Upon arrival, the datalogger display should be blank. Keying “Enter” will<br />
activate the display <strong>and</strong> show the date <strong>and</strong> time.<br />
4. Fill in the current meteorological <strong>and</strong> battery level data from the datalogger. This is<br />
accomplished by keying “Enter” from the screen in step 3, arrowing down to “Met Data” <strong>and</strong><br />
keying “Enter”. If any of the data are unreasonable (such as negative values for wind speed<br />
data or battery voltage below 12), the site operator should contact the project lead or the <strong>NPS</strong><br />
monitoring support contractor to let them know about the problem.<br />
5. Fill in the ozone data from the datalogger. Press the escape (“Esc”) key from the screen in<br />
step 4. Arrow down to select “<strong>Ozone</strong>_(Last Min)” <strong>and</strong> press “Enter”. Make certain that the<br />
data are reasonable (for example, no concentrations that are negative or higher than 100 ppb<br />
or so). If values seem unreasonable, contact the project lead or the <strong>NPS</strong> <strong>Monitoring</strong> Support<br />
Contractor.<br />
6. Change out the particle filter in the orange filter holder that is attached to the 2B<br />
analyzer’s intake line. This circular, paper-thin filter is in the path of the air as it makes its<br />
way to the ozone analyzer. It is the job of the filter to catch dust <strong>and</strong> debris so that it does not<br />
enter into the ozone analyzer. Clogged filters will prevent sufficient airflow from entering<br />
the ozone analyzer, so these filters need to be changed biweekly. Change the filter by<br />
unscrewing the top half of the filter holder from the bottom half of the filter holder. It may<br />
be necessary to use the filter wrenches provided to loosen the two halves from one another.<br />
The old filter should be removed <strong>and</strong> discarded. Installation of the new filter should be done<br />
carefully, as improper h<strong>and</strong>ling of the filter can result in oils from the operator’s fingers<br />
getting onto the filter (this will attract <strong>and</strong> hold excessive amounts of dirt <strong>and</strong> prevent<br />
airflow). To avoid this problem, hold the new filter at the very edge of the filter, drop it into<br />
place on the filter holder, <strong>and</strong> reattach the two filter halves to one another. Use the filter<br />
wrenches to snug the filter halves together. If a fresh supply of filters is necessary, contact<br />
either the <strong>NPS</strong> <strong>Monitoring</strong> Support Contractor (or the project lead who will then contact the<br />
<strong>NPS</strong> <strong>Monitoring</strong> Support Contractor).<br />
7. Verify that no supply lines came loose while the particle filter was being replaced. Pay<br />
particular attention to the air supply line as it enters the ozone analyzer, as this connection<br />
has a tendency to come loose.<br />
8. Complete the checklist. Complete the “other comments” section of the checklist, wherein<br />
the user should document any problems, unusual conditions, or supplies needed. It is also a<br />
good idea to review the checklist to make certain that each item on the checklist has been<br />
addressed. Call the project lead or <strong>NPS</strong> <strong>Monitoring</strong> Support Contractor to report any<br />
problems that were discovered.<br />
9. Close the datalogger <strong>and</strong> ozone analyzer enclosures.<br />
10. Upon return to the office, mail only the yellow carbon copy of the checklist to the<br />
address indicated on the bottom of the checklist. The yellow carbon copy should be<br />
mailed to the <strong>NPS</strong> <strong>Monitoring</strong> Support Contractor. Alternatively, the form may be faxed to<br />
the <strong>NPS</strong> <strong>Monitoring</strong> Support Contractor using the number provided on the form. The white<br />
original should remain in the notebook provided.<br />
45
Figure 17 – An example POMS III maintenance visit form.<br />
Notes on Modes <strong>and</strong> Comm<strong>and</strong>s Used by the Campbell Scientific Datalogger in a<br />
POMS II<br />
The POMS II system uses a CR23X datalogger while the POMS III uses a CR3000 datalogger.<br />
The notes in this section apply to a POMS II’s CR23X. No notes are provided for the CR3000<br />
since it is a later generation datalogger with a simpler interface.<br />
In the POMS II, a Campbell Scientific, Inc. CR23X datalogger is used to control the<br />
instrumentation, store data, <strong>and</strong> transmit data via satellite uplink. The basic operation of these<br />
Campbell Scientific dataloggers is the subject of this section. These dataloggers have an<br />
attached wiring panel to which sensors are attached. The user interfaces with the datalogger via<br />
an LCD display <strong>and</strong> a keypad, both of which are built into the datalogger. For this protocol, the<br />
primary interactions with the datalogger will be to:<br />
• View <strong>and</strong> change, as necessary, date/time information.<br />
• View meteorological, battery voltage, <strong>and</strong> ozone data as they are being collected.<br />
• Activate data collection events.<br />
• Transfer data from the datalogger to the storage module.<br />
• Return the datalogger to its normal state.<br />
46
Modes<br />
Each of these tasks is accomplished within a particular “mode.” Modes are referred to as “*<br />
modes” (pronounced “star modes”) since, in order to enter the modes, the *-key must be<br />
depressed prior to the mode number. Modes used in this protocol are:<br />
*0 Mode – Log data <strong>and</strong> display active program tables.<br />
*5 Mode – Display date/time information.<br />
*6 Mode – Display data in intermediate storage. Toggle flags within this mode.<br />
To enter each mode, key in “*” followed by the mode number. For most modes, this sequence<br />
will take the user directly into the requested mode. *6 mode, however, functions slightly<br />
differently. This mode is used to view intermediate storage, in which data are temporarily stored<br />
as they are collected from data sources (sources such as sensors or user-defined variables). Each<br />
measurement is stored in a “memory location” <strong>and</strong> memory locations use numeric labels. That<br />
is, there are memory locations 1, 2, 3, <strong>and</strong> so forth. Keying “*6” does not take the user directly<br />
into *6 mode. The datalogger will wait to let the user key in the memory location to be viewed.<br />
For example, keying “*612A” places the user in *6 mode (from the “*6” portion of the<br />
sequence) <strong>and</strong> allows the user to view the datum in memory location 12 (the 12 part of the<br />
sequence). The “A” portion of the sequence functions like an “enter” keystroke on a PC<br />
keyboard, communicating to the datalogger that the user has completed <strong>and</strong> accepted the<br />
keystroke sequence. Leaving a memory location out of the sequence (i.e., keying “*6A”) takes<br />
the user, by default, to memory location 1.<br />
Side note: Campbell Scientific dataloggers have two types of data storage: intermediate<br />
storage <strong>and</strong> final storage. Intermediate storage contains raw data as collected directly<br />
from sensors or as defined by the user. Data in final storage are derivatives of the data in<br />
intermediate storage. *6 mode displays intermediate data.<br />
Within each mode, it may be possible to execute mode-specific comm<strong>and</strong>s. In *5 <strong>and</strong> *6 modes,<br />
for example, keying “A” advances the user through pieces of information. Keying “B” in these<br />
modes backs the user up through these same pieces of information. Descriptions of each mode<br />
<strong>and</strong> the functionalities of each follow.<br />
• *0 Mode – Campbell Scientific refers to this mode as the “LOG data <strong>and</strong> indicate active<br />
Tables” mode. Keying “*0” from any mode returns the user to a screen that may be called<br />
the home screen or log screen. In this mode, the user may see which program table(s) is (are)<br />
being executed. Program tables are distinct blocks of computer code that may be executed<br />
simultaneously <strong>and</strong> independently of one another. Campbell Scientific datalogger programs<br />
consist of two program tables (labeled tables 1 <strong>and</strong> 2). Entering *0 mode will display one of<br />
the following screens where each screen has the indicated meaning:<br />
• “LOG” – Indicates that no program table is being executed.<br />
• “LOG 1” – Indicates that program table 1 is being executed.<br />
• “LOG 2” – Indicates that program table 2 is being executed.<br />
• “LOG 12” – Indicates that program tables 1 <strong>and</strong> 2 are being executed.<br />
47
• *5 Mode – Displays the current time <strong>and</strong> date information. Key “A” to advance (or ascend)<br />
through the list below <strong>and</strong> key “B” to back up through the list below.<br />
• Time<br />
• Year<br />
• Julian day<br />
• Time set screen<br />
• *6 Mode – Displays intermediate memory used for temporary data storage. The display has<br />
the format LL : DDDDD, where LL is two digit memory location label <strong>and</strong> DDDDD is the<br />
most recent value stored to that location. The colon in the middle is used to indicate the<br />
program’s execution; the colon flashes whenever the program is executed. Data shown are<br />
from the most recent program execution. A typical display may read “06 : 12.369”<br />
indicating that the most recent datum stored to memory location 6 is 12.369. The user may<br />
view these data by either keying *6xxA (where xx is the desired memory location) or by<br />
keying “*6A” to enter *6 mode. Once in *6 mode, the user may press the A key to advance<br />
up through memory locations or press the B key to back up through memory locations.<br />
Some loggers may also display text descriptions of the fields being shown, <strong>and</strong> may show<br />
more than one field at a time.<br />
Flags<br />
This SOP uses flags to mark data as valid or invalid. In this SOP, flags may be regarded as<br />
variables that the user may adjust. The CR10X supports eight such flags <strong>and</strong> each flag is<br />
referenced by a numeric identifier (i.e., Flag 1, Flag 2, …, Flag 8). Each flag will have one of<br />
two possible values: either zero or one. To view (<strong>and</strong> alter) the value of these flags, the user<br />
should be in *6 mode (if the user is not in *6 mode, then “*6A” should be keyed). Once in *6<br />
mode (while viewing any memory location), keying “D” will take the user to the flag screen<br />
where each of the flags is shown. One possible display is “00100000”. The first digit is the<br />
value of Flag 1, the second digit is the value of Flag 2, <strong>and</strong> so on. In this example, all flags have<br />
values of zero, with the exception of Flag 3, which has a value of one.<br />
The value of flags may be user-adjusted or program-adjusted. To user-adjust a flag value, press<br />
the numeric key that corresponds to the flag number. This will toggle that flag between the<br />
values zero <strong>and</strong> one. From the previous example, Flag 3 may be returned to a value of zero by<br />
keying “3” on the keypad (<strong>and</strong> back to one again by keying “3” a second time). For this SOP,<br />
flag 1 is used to control power to the ozone analyzer. When this value is user-adjusted to a value<br />
of one, the ozone analyzer is powered up. To toggle between powering the analyzer up <strong>and</strong><br />
powering the analyzer down, repeatedly key “1”.<br />
48
A <strong>Protocol</strong> for <strong>Monitoring</strong> <strong>Ozone</strong> <strong>and</strong> <strong>Foliar</strong> <strong>Injury</strong> throughout the<br />
Cumberl<strong>and</strong> Piedmont Network<br />
St<strong>and</strong>ard Operating Procedure (SOP) #OC5: <strong>Ozone</strong><br />
Concentration - Post-Sampling<br />
Revision History Log:<br />
Previous<br />
Version #<br />
Revision<br />
Date<br />
Version 1.0 (November 2011)<br />
Author Changes Made Reason for Change New<br />
Version #<br />
This SOP explains procedures that all field observers using the ozone <strong>and</strong> foliar injury protocol<br />
for the Cumberl<strong>and</strong> Piedmont Network (<strong>CUPN</strong>) should be familiar with <strong>and</strong> follow after the field<br />
sampling is completed.<br />
Closing out a trip to move a Portable <strong>Ozone</strong> <strong>Monitoring</strong> Station (POMS)<br />
Upon return to the office, any tools that were taken on the trip should be cleaned <strong>and</strong> put away.<br />
If the POMS were removed on the trip, then the POMS should be placed in storage. Storage<br />
modules <strong>and</strong> ozone analyzers should be forwarded to the <strong>NPS</strong> <strong>Monitoring</strong> Support Contractor.<br />
Any field forms that were filled out while on the trip should be sent to the <strong>NPS</strong> <strong>Monitoring</strong><br />
Support Contractor <strong>and</strong> archived. Travel vouchers should also be completed.<br />
Storage of a POMS<br />
The network POMS should be stored in a <strong>CUPN</strong> weatherproof facility at MACA. Storing the<br />
unit at MACA allows the project lead to have convenient access to the POMS for preseason<br />
preparations. Storing the POMS in a weatherproof facility keeps the unit from being exposed to<br />
the weather. Assembly <strong>and</strong> disassembly instructions may be found in SOP #OC4.<br />
49
A <strong>Protocol</strong> for <strong>Monitoring</strong> <strong>Ozone</strong> <strong>and</strong> <strong>Foliar</strong> <strong>Injury</strong> throughout the<br />
Cumberl<strong>and</strong> Piedmont Network<br />
St<strong>and</strong>ard Operating Procedure (SOP) #OC6: <strong>Ozone</strong><br />
Concentration - Data Management<br />
Revision History Log:<br />
Previous<br />
Version #<br />
Revision<br />
Date<br />
Version 1.0 (November 2011)<br />
Author Changes Made Reason for Change New<br />
Version #<br />
Introduction<br />
This SOP describes management of the ozone concentration data collected from monitors nearby<br />
<strong>and</strong> within parks of the Cumberl<strong>and</strong> Piedmont Network (<strong>CUPN</strong>). Data collected through this<br />
protocol will be uploaded to central databases from multiple monitors each year, <strong>and</strong> many, if<br />
not most of these monitors are managed by other agencies <strong>and</strong> programs, such as EPA, states,<br />
<strong>and</strong> Air Resources Division of <strong>NPS</strong> (<strong>NPS</strong>-ARD). The design <strong>and</strong> management of these data are<br />
h<strong>and</strong>led with rigorous QA/QC controls, due to the regulatory environment for which they are<br />
being used.<br />
<strong>Ozone</strong> concentration data collected using a POMS require no staff-level data entry, since data<br />
collection is datalogger driven with satellite uplinks. Validation <strong>and</strong> archival of ozone<br />
concentration data will be performed by the <strong>NPS</strong> <strong>Monitoring</strong> Support Contractor. In addition to<br />
the ozone concentration data collected by the POMS, data from nearby state-operated sites will<br />
be collected for each of the <strong>CUPN</strong> parks (except for those parks that have on-park equivalent<br />
methods). Data from these nearby monitors will be used to calculate the exposure level for each<br />
of the <strong>CUPN</strong> parks. The <strong>CUPN</strong> will not validate or archive the state-operated ozone<br />
concentration data since those tasks are h<strong>and</strong>led by the state that operates the site.<br />
For the ozone concentration portion of this protocol, acquisition, validation, <strong>and</strong> storage of<br />
POMS data are the responsibility of the <strong>NPS</strong> <strong>Monitoring</strong> Support Contractor. These data are<br />
available from the contractor upon request through <strong>NPS</strong>-ARD <strong>and</strong> after the end of the ozone<br />
season. The data are generally made available as comma delimited text or Excel files. See “data<br />
analysis” SOP #OC7 for details on usage.<br />
Data Validation<br />
Data validation consistent with the <strong>NPS</strong>-ARD network (the US-wide network of stations<br />
maintained by <strong>NPS</strong>-ARD) st<strong>and</strong>ards ensures timely validation of data using procedures that meet<br />
EPA st<strong>and</strong>ards. Three levels of data validation performed for the <strong>NPS</strong>-ARD network are<br />
illustrated in Figure 18. Only final validation level data, meeting all <strong>NPS</strong> <strong>and</strong> EPA validation<br />
50
equirements, are acceptable for submission to the <strong>NPS</strong>-validated data archives <strong>and</strong> the EPA<br />
AQS national database. More detailed information regarding <strong>NPS</strong>-ARD data validation<br />
procedures can be found in St<strong>and</strong>ard Operating Procedure 3450, Ambient Air Quality <strong>and</strong><br />
Meteorological <strong>Monitoring</strong> Data Validation (this document is posted on <strong>NPS</strong>-ARD’s website)<br />
<strong>and</strong> its associated technical instructions.<br />
Figure 18 – <strong>NPS</strong> Gaseous Pollutant <strong>Monitoring</strong> Program Network Data Collection, Validation, <strong>and</strong><br />
Reporting Flow Diagram (Ray 2004).<br />
Reliance upon offsite data management procedures emphasizes the need to document external<br />
quality assurance/quality control (QA/QC) methods, statistical summaries, <strong>and</strong> interpretations<br />
which is h<strong>and</strong>led through reporting <strong>and</strong>/or websites of other agencies. The ARD performs<br />
monthly/quarterly submittal of final validated regulatory data to the EPA’s AQS database. These<br />
data include hourly average ambient air quality <strong>and</strong> meteorological data, precision data from<br />
ozone analyzer precision checks, <strong>and</strong> accuracy data from audit reports on ozone analyzers.<br />
51
Database Administration<br />
This section relates to spreadsheets <strong>and</strong> other data derived from primary sources (ARD/EPA).<br />
Data Maintenance<br />
Datasets are rarely static. They often change through additions, corrections, <strong>and</strong> improvements<br />
made following the archiving of a dataset. There are three main caveats to this process:<br />
1. Only make changes that improve or update the data while maintaining data integrity.<br />
2. Once archived, document any changes made to the dataset.<br />
3. Be prepared to recover from mistakes made during editing.<br />
Any editing of archived data is accomplished jointly by the project leader <strong>and</strong> data manager.<br />
Every change must be documented in the edit log <strong>and</strong> accompanied by an explanation that<br />
includes pre- <strong>and</strong> post-edit data descriptions.<br />
Data Organization<br />
The <strong>CUPN</strong> has established a template directory structure, composed of seven folders <strong>and</strong> four<br />
subfolders for each vital sign monitoring project (Figure 19). Project files which are being<br />
modified, considered draft, <strong>and</strong>/or certain files currently in use (e.g., a copy of the field data<br />
form) should reside within this directory. A similar directory structure will contain archived files<br />
(\<strong>CUPN</strong>_Archive\). Both the working <strong>and</strong> archive directories will be accessible via the MACA<br />
Local Area Network, with access permissions maintained by the data manager(s) <strong>and</strong>/or MACA<br />
Information Technology Staff.<br />
Figure 19 – <strong>CUPN</strong> project directory structure.<br />
The data tables utilized for data entry <strong>and</strong> validation reside within the “Working_Data” folder.<br />
Once data in these tables are validated by the project leader, a data manager will append the<br />
records to the data tables in the “Validated_Data” folder <strong>and</strong> the “working” data tables will be<br />
emptied. As indicated, the data tables containing the master protocol-specific data for the project<br />
are contained in the “Validated_Data” folder. These data have been validated <strong>and</strong> are available<br />
as read-only except to <strong>CUPN</strong> data managers.<br />
52
Data Security <strong>and</strong> Integrity<br />
As many different users will be accessing the database, it is imperative that the data remain<br />
secure. Although MS Access provides a means for allowing User-Level Securities to different<br />
groups of uses, the data managers have determined that it will be more effective to create user<br />
groups within the local area network operating system that will have different security levels.<br />
Generally, three levels of users will be given different sets of permissions. <strong>CUPN</strong> data managers<br />
will have all permissions, including insert, delete, <strong>and</strong> modify for all folders in the folder<br />
structure. Project leaders/program coordinators, will have the same permissions as program data<br />
managers except for read-only permission to the shared data tables <strong>and</strong> archived data. Those<br />
entering the data will have insert <strong>and</strong> modify permission to the observation data <strong>and</strong> read-only<br />
permission to the lookup <strong>and</strong> shared data tables.<br />
Version Control<br />
Prior to any major changes of a dataset, a copy is stored with the appropriate version number.<br />
This allows for the tracking of changes over time. With proper controls <strong>and</strong> communication,<br />
versioning ensures that only the most current version is used in any analysis. Versioning of<br />
archived datasets is h<strong>and</strong>led in the same manner as protocol narrative <strong>and</strong> SOP versioning (see<br />
SOP #OC9). Frequent users of the data are notified of the updates, <strong>and</strong> provided with a copy of<br />
the most recent archived version.<br />
Data Logs <strong>and</strong> Backups<br />
Once the data are archived, any changes made to the data must be documented in an edit log.<br />
From this point forward, original field data forms should not be altered. Field forms can be<br />
reconciled to the database through the use of the edit log. Secure data archiving is essential for<br />
protecting data files from corruption. Once a dataset has passed the specified QA/QC<br />
procedures, a data manager will make a formal entry on the Integrated Resource Management<br />
Applications site (IRMA). Subsequently, an electronic version of the dataset is maintained in a<br />
read-only format on the program server. Incremental or differential tape backups of all project<br />
databases are regularly conducted. Backup copies of the data are maintained in a secure alternate<br />
location.<br />
Data Availability<br />
In addition to the “st<strong>and</strong>ardized” data dissemination strategies noted in Chapter IX of the DMP<br />
(Moore et al. 2005), data will be made available for research <strong>and</strong> management applications on<br />
request (per the framework established in the DMP). Data requests should be directed to the<br />
<strong>CUPN</strong> coordinators.<br />
Literature Cited<br />
Moore, W. J., R. Byrd, <strong>and</strong> T. Leibfreid. 2005. Data management plan for the Cumberl<strong>and</strong><br />
Piedmont Network <strong>and</strong> Mammoth Cave National Park Prototype monitoring program.<br />
USDI National Park Service. Mammoth Cave, KY. 81pp.<br />
Ray, John D. 2004. <strong>Ozone</strong> <strong>Monitoring</strong> <strong>Protocol</strong>: Guidance on Selecting <strong>and</strong> Conducting <strong>Ozone</strong><br />
<strong>Monitoring</strong>. Air Resources Division, Research <strong>and</strong> <strong>Monitoring</strong> Branch, National Park<br />
Service, Lakewood, Colorado, USA.<br />
53
A <strong>Protocol</strong> for <strong>Monitoring</strong> <strong>Ozone</strong> <strong>and</strong> <strong>Foliar</strong> <strong>Injury</strong> throughout the<br />
Cumberl<strong>and</strong> Piedmont Network<br />
St<strong>and</strong>ard Operating Procedure (SOP) #OC7: <strong>Ozone</strong><br />
Concentration - Data Analysis<br />
Revision History Log:<br />
Previous<br />
Version #<br />
Revision<br />
Date<br />
Version 1.0 (November 2011)<br />
Author Changes Made Reason for Change New<br />
Version #<br />
This SOP outlines the data flow <strong>and</strong> expected analyses of the ozone concentration data collected<br />
within the <strong>CUPN</strong>. The monitoring questions <strong>and</strong> subsequent analysis of the supporting data<br />
address issues related to status <strong>and</strong> trends in ozone concentration/exposure throughout the<br />
<strong>CUPN</strong>. The status <strong>and</strong> trends of this parameter are understood to impact many of the plant<br />
species that populate <strong>CUPN</strong> parks. Specific monitoring questions will be addressed using a<br />
combination of summary <strong>and</strong> descriptive statistics, graphic analysis, <strong>and</strong> multivariate<br />
comparative <strong>and</strong> correlative analysis.<br />
The protocol was designed to answer the following monitoring questions related to ozone<br />
concentration/exposure:<br />
• What is the cumulative ozone exposure in <strong>CUPN</strong> parks within a typical April-October<br />
growing period?<br />
• What is the trend in cumulative ozone exposure in <strong>CUPN</strong> parks across time (years)?<br />
Data Flow<br />
<strong>Ozone</strong> concentration data collected using a POMS will require no data entry since data collection<br />
is datalogger driven with satellite uplinks. Validation <strong>and</strong> archival of ozone concentration data<br />
from a POMS will be performed by the <strong>NPS</strong> <strong>Monitoring</strong> Support Contractor. In addition to the<br />
ozone concentration data collected by the POMS, data from nearby state-operated sites will be<br />
collected for each of the <strong>CUPN</strong> parks, as applicable. The <strong>CUPN</strong> will not validate or archive the<br />
state-operated ozone data since those tasks are h<strong>and</strong>led by the state that operates the site. <strong>Ozone</strong><br />
exposure indices will be calculated <strong>and</strong> then incorporated into regular reports that go out to each<br />
of the <strong>CUPN</strong> parks. These reports will be archived as outlined in the “Reporting” SOP (#OC8).<br />
Data Analysis<br />
These POMS data are available from the contractor through its website. The data are available<br />
as comma delimited text files. For advanced analyses, these data will be imported into a<br />
54
commercial off-the-shelf statistical analysis software package such as SigmaPlot. To import data<br />
into SigmaPlot:<br />
1. Launch SigmaPlot.<br />
2. Click on File to view the File menu.<br />
3. Select Import from the File menu.<br />
4. A window will open in which the user can select the appropriate file type <strong>and</strong> the file to be<br />
imported. There will be a drop-down list from which the appropriate file type may be<br />
selected. Select “Plain Text” or “Excel,” as appropriate. Then, navigate to the appropriate<br />
folder <strong>and</strong> select the desired file.<br />
5. Follow the on-screen directions to finish importing the selected file.<br />
Table 9 – Example of cumulative ozone exposure indices presented for sampled parks in annual reports.<br />
This table is from <strong>CUPN</strong>’s 2009 report.<br />
Park Name Data Source<br />
8 to 8 SUM06 in 2009<br />
Growing Season (ppmhrs)<br />
COWP COWP State Operated<br />
Site<br />
FODO POMS (27 May 2009 to 15<br />
July 2009)<br />
55<br />
8 to 8 W126 in 2009 Growing<br />
Season (ppm-hrs)<br />
Highest Consecutive 3-<br />
Month W126 in 2009<br />
Growing Season<br />
2.11 5.81 2.92<br />
1.37 1.83 N/A<br />
MACA Houchins’ Meadow Site 9.66 11.17 6.45<br />
SHIL POMS (16 July 2009 to 30<br />
Oct 2009)<br />
0.00 0.74 N/A<br />
Table 10 – Example of cumulative ozone exposure indices provided for non-sampled parks. This table is<br />
from <strong>CUPN</strong>’s 2009 report.<br />
Park<br />
Name<br />
FIPS of<br />
Nearby Site<br />
County, State of<br />
Nearby Site<br />
8 to 8 SUM06 in 2009<br />
Growing Season (ppmhrs)<br />
[Is level sufficient to<br />
cause foliar injury in<br />
sensitive plants? (Y/N)]<br />
8 to 8 W126 in 2009<br />
Growing Season (ppmhrs)<br />
[Is level sufficient<br />
to cause foliar injury in<br />
sensitive plants? (Y/N)]<br />
Highest Consecutive 3-<br />
Month W126 in 2009<br />
Growing Season [Is level<br />
sufficient to cause foliar<br />
injury in sensitive<br />
plants? (Y/N)]<br />
ABLI 210930006 Hardin County, KY 10.74 [Y] 12.09 [Y] 7.15 [Y]<br />
CARL 370210030 Buncombe County,<br />
NC<br />
4.49 [N] 6.40 [N] 4.55 [N]<br />
CHCH 130550001 Chattooga County,<br />
GA<br />
8.93 [Y] 9.27 [Y] 5.04 [N]<br />
CUGA N/A N/A 1.21 (24 hour SUM06 is<br />
4.34) [N]<br />
4.87 [N] 3.53 [N]<br />
GUCO 371570099 Rockingham County,<br />
NC<br />
13.27 [Y] 13.21 [Y] 7.34 [Y]<br />
KIMO 450910006 York County, SC 4.29 [N] 5.89 [N] 3.34 [N]<br />
LIRI 130550001 Chattooga County,<br />
GA<br />
8.93 [Y] 9.27 [Y] 5.04 [N]<br />
NISI 450010001 Abbeville County,<br />
SC<br />
2.97 [N] 6.97 [N] 3.18 [N]<br />
RUCA 470654003 Hamilton County, TN 16.47 [Y] 15.98 [Y] 8.58 [Y]<br />
STRI 471490101 Rutherford County,<br />
TN<br />
10.11 [Y] 11.34 [Y] 6.17 [Y]
NAAQS <strong>and</strong> Cumulative Exposure Indices<br />
When possible, ozone data at active parks will be evaluated for attainment of the current<br />
NAAQS. Compliance with the NAAQS will be evaluated by computing the relevant index using<br />
the <strong>Monitoring</strong> Support Contractor’s website. The contractor’s website computes the 4 th highest<br />
8-hour average of ozone. As detailed at http://www.epa.gov/air/criteria.html, the st<strong>and</strong>ard is<br />
based upon a 3-year average of each year’s 4 th highest 8-hour averages. Sites with at least 3<br />
consecutive years of data (such as COWP, CUGA <strong>and</strong> MACA) may be evaluated for attainment<br />
of the NAAQS. Since each POMS will be at a park only one year at a time, the <strong>CUPN</strong> will not<br />
be able to obtain the 3-year average for POMS sites. So, only the 4 th highest 8-hour average for<br />
each year will be considered.<br />
Whenever possible, cumulative ozone exposure indices will be computed each year for all parks<br />
in the network. This includes parks that have been sampled in that year (either for both ozone<br />
concentration <strong>and</strong> foliar injury or for just foliar injury). Indices that will be computed include:<br />
• 8 to 8 SUM06<br />
• 8 to 8 W126 (for growing season)<br />
• Highest consecutive 3-month W126 (for growing season)<br />
Tables 9 <strong>and</strong> 10 show these data as presented in <strong>CUPN</strong>’s 2009 report. Only 8 to 8 values are<br />
shown, but 24-hour indices may also be computed.<br />
For future reports, the indices will be computed using either the <strong>Monitoring</strong> Support Contractor’s<br />
website or SigmaPlot. For POMS, COWP <strong>and</strong> MACA data, the <strong>Monitoring</strong> Support<br />
Contractor’s website contains built-in functions that compute exposure indices.<br />
Data that are obtained through EPA’s Data Mart must be analyzed using SigmaPlot. SigmaPlot<br />
was used to compute the indices shown in tables 9 <strong>and</strong> 10. User-defined programs (called<br />
transforms) allow the user to perform such computations within SigmaPlot. In <strong>CUPN</strong> reports,<br />
whenever a transform is used for computation, that transform will be provided as an appendix to<br />
the report.<br />
As an alternative to computing exposure indices for itself, the <strong>CUPN</strong> may request that <strong>NPS</strong>-ARD<br />
perform the computations. The indices provided by <strong>NPS</strong>-ARD would be presented in reports<br />
<strong>and</strong> stored in data files on the <strong>CUPN</strong> server.<br />
Please note that in Table 10, the column “FIPS of Nearby Site” is used to identify the site from<br />
which the data were collected. In the future (<strong>and</strong> as suggested by an external reviewer of this<br />
protocol), the “AQS ID” code will be used instead.<br />
56
Figure 20 – Time series plots of ozone data collected in 2009. Diurnal pattern plots are also shown.<br />
57
Time Series <strong>and</strong> Diurnal Plots<br />
Time series plots will be generated for the entire growing season as well as up to the time of<br />
foliar injury assessments. Plots will also be generated that show the diurnal patterns in the ozone<br />
data. Figure 20 shows examples of these plots. The diurnal plots are constructed with the hour<br />
of the day on the x-axis <strong>and</strong> the ozone value on the y-axis. Such plots can show if a site tends to<br />
have low ozone values at night <strong>and</strong> high ozone values during the day (typical of urban sites) or if<br />
the site has little diurnal variability (typical of rural <strong>and</strong> high-elevation sites). These diurnal<br />
patterns are important to plant response since plant stomata are mostly closed at night resulting<br />
in less ozone uptake into the leaf. Please note that data shown in Figure 20 were collected in<br />
2009 under a draft version of this protocol when only one POMS was used to collect data at two<br />
parks.<br />
58
A <strong>Protocol</strong> for <strong>Monitoring</strong> <strong>Ozone</strong> <strong>and</strong> <strong>Foliar</strong> <strong>Injury</strong> throughout the<br />
Cumberl<strong>and</strong> Piedmont Network<br />
St<strong>and</strong>ard Operating Procedure (SOP) #OC8: <strong>Ozone</strong><br />
Concentration - Reporting<br />
Revision History Log:<br />
Previous<br />
Version #<br />
Revision<br />
Date<br />
Version 1.0 (November 2011)<br />
Author Changes Made Reason for Change New<br />
Version #<br />
This SOP gives step-by-step instructions for reporting on ozone <strong>and</strong> ozone effects parameters<br />
(ozone concentration <strong>and</strong> foliar injury assessment data) at parks throughout the Cumberl<strong>and</strong><br />
Piedmont Network (<strong>CUPN</strong>). This SOP describes the procedure for formatting a report, the<br />
report review process, <strong>and</strong> distribution of completed reports. Efficient reporting on monitoring<br />
results is critical in assisting park resource managers with management decisions. Therefore, a<br />
reporting schedule is given with key reporting dates identified. Timely production of appropriate<br />
reports is the responsibility of the project leader <strong>and</strong> the <strong>CUPN</strong> coordinators. All reports will<br />
follow the Natural Resources Technical Report series format <strong>and</strong> numbering system.<br />
Report Format<br />
General<br />
Reports should be produced on high quality white paper, 215 x 280 mm in size. Font size of all<br />
text should be 12 point unless smaller font aids in fitting information on tables. Times New<br />
Roman font should be the st<strong>and</strong>ard font utilized. However, other text fonts are acceptable if used<br />
consistently throughout the document. Text is left justified with 3-cm margins on all sides.<br />
Words should not be hyphenated on the right side of text.<br />
Page numbers <strong>and</strong> headers should be placed in the upper-right corner of each page starting with<br />
page two of the report. One exception to page numbering <strong>and</strong> headers is with figures (including<br />
pictures <strong>and</strong> illustrations), if a separate figure title page is used, place number <strong>and</strong> heading on<br />
these pages <strong>and</strong> leave them off pages containing the figures. Headers should contain an<br />
abbreviated version of the report title.<br />
Bolding <strong>and</strong> underlining should be used minimally in the body of the text unless used on section<br />
headings <strong>and</strong> subheadings. Use italic font for scientific names of species. While common names<br />
are generally used, scientific names should be included parenthetically with first mention of the<br />
common name. Thereafter, common name only will generally be used.<br />
59
Three levels of section headings may be used. First-level headings are all upper-case letters,<br />
bolded <strong>and</strong> left-justified with a sequenced whole number to its left. Second-level headings are<br />
bolded <strong>and</strong> left justified similar to first-level headings with sequenced numbers to the first<br />
decimal place. However, only the first letter in each word is capitalized. Third-level headings<br />
are indented five spaces <strong>and</strong> the first letter in each word is capitalized. Third-level headings are<br />
not bolded, underlined or numbered. Third-level headings may be italicized followed by a<br />
period <strong>and</strong> two hyphens or bulleted.<br />
Reports should be direct <strong>and</strong> concise, avoiding superfluous wording. Refer to CBE Style Manual<br />
(CBE Style Manual Committee 1994) or Writing with Precision, Clarity <strong>and</strong> Economy (Mack<br />
1986) for aids in writing. Also see Strunk <strong>and</strong> White (1979), Day (1983), <strong>and</strong> “Notes on<br />
Writing Papers <strong>and</strong> Theses” (Lertzman 1995) for help in structuring sentences <strong>and</strong> paragraphs<br />
for clarity.<br />
Tables<br />
Tables should be placed within the text of a report or immediately following the literature cited<br />
section. Tables should be numbered in sequence regardless of where they are located. Table<br />
headers are placed at the top of a table. Horizontal lines are used to separate the table heading<br />
from column headings, column headings from the table <strong>and</strong> to signify the end of the table.<br />
Vertical gridlines lines should not appear on a table.<br />
Figures<br />
Figures should be placed within the text of a report or immediately following tables behind the<br />
literature cited sections. Figures should be numbered in sequence regardless of where they are<br />
located. Figure captions are placed below the figure if it is included in the text or on a separate<br />
sheet of paper preceding the figure if included after the literature cited section. Both tables <strong>and</strong><br />
figures should contain information not presented in the body of the text. Also, tables <strong>and</strong> figures<br />
should not duplicate information already presented in the body of the text.<br />
Pictures<br />
Treat as figures.<br />
Report Outline<br />
TITLE PAGE<br />
• Title<br />
• Author(s)<br />
• Institutions<br />
• Prepared for<br />
• Date<br />
TABLE OF CONTENT PAGE (optional)<br />
EXECUTIVE SUMMARY PAGE (abstract)<br />
1.0 INTRODUCTION<br />
60
1.1 Background<br />
1.2 Justification for Study<br />
1.3 Objectives<br />
2.0 METHODS<br />
2.1 Study area(s)<br />
2.2 Field method(s)<br />
2.3 Analytical method(s)<br />
3.0 RESULTS<br />
4.0 DISCUSSION<br />
5.0 MANAGEMENT IMPLICATIONS<br />
6.0 ACKNOWLEDGEMENTS<br />
7.0 LITERATURE CITED<br />
(See Section IV, Literature Cited for format examples)<br />
APPENDICES (optional)<br />
Review Procedure<br />
Internal Review<br />
Annual reports on ozone <strong>and</strong> ozone effects monitoring will be written by the project leader,<br />
<strong>and</strong>/or crew leader(s) under the direction of the project leader. One or more internal reviews for<br />
grammatical soundness will be sought prior to submitting the report to <strong>CUPN</strong> management staff.<br />
Internal review by <strong>CUPN</strong> personnel skilled in technical writing for clarity <strong>and</strong> directness should<br />
fulfill this review requirement. Internal reviews will be conducted by <strong>CUPN</strong> staff <strong>and</strong>/or other<br />
persons sought out for their language skills.<br />
If reports are written to update findings only <strong>and</strong> they do not deviate significantly from<br />
previously reviewed <strong>and</strong> distributed reports then the review process may stop here. However,<br />
review by park staff <strong>and</strong> subsequent external reviews must be sought for new reports or those<br />
that deviate significantly from previously reviewed <strong>and</strong> distributed reports. Also, if management<br />
activities within a park are not clearly understood, then park review should be sought for a report<br />
to clarify results <strong>and</strong> management implications.<br />
61
Park Review<br />
Park staff (generally Resource Managers) are in a unique position in that they can supply details<br />
about management actives that may influence findings presented in a report. Also, they will be<br />
the ones applying management recommendations to their park. Therefore, review by park staff<br />
is vital to the interpretation of findings <strong>and</strong> the assessment of proposed management<br />
implications. Review by park staff should be conducted before a report is submitted for external<br />
review.<br />
External Review<br />
External review by two or more experts in air quality monitoring should be sought for the first<br />
report in a series of annual reports <strong>and</strong> trend reports. In addition, analytical methods employed<br />
on data presented in the report need to be reviewed by one or more statisticians. If a report<br />
updates a previously reviewed <strong>and</strong> distributed report then external review is not required.<br />
However, external reviews must be sought for new reports or those that deviate significantly<br />
from previously reviewed <strong>and</strong> distributed reports. In order to conserve reviewer time, external<br />
reviews must follow the internal <strong>and</strong> park review process.<br />
All review comments must be addressed, be it there inclusion in the report or reason for<br />
excluding them from the report. The responsibility to edit a report falls to the senior author of<br />
the report or their designee.<br />
Distribution Procedure<br />
Identifying Stakeholders<br />
The primary stakeholders in our ozone <strong>and</strong> ozone effects monitoring efforts are the National Park<br />
Service management staff at <strong>CUPN</strong> parks. Potential stakeholders include state <strong>and</strong> federal<br />
wildlife agencies, universities, <strong>and</strong> the general public. Natural resource specialists conducting<br />
(or considering conducting) ozone or ozone effects monitoring should be interested in project<br />
results.<br />
Distributing Reports<br />
Annual reports will be provided to resource managers at <strong>CUPN</strong> parks as appropriate.<br />
Additionally, a copy will be archived according to current <strong>NPS</strong> guidelines <strong>and</strong> a copy will be<br />
kept on file in the <strong>CUPN</strong> office of the National Park Service, Mammoth Cave, Kentucky.<br />
Reports will be available to all interested parties upon request.<br />
All data collected by the <strong>CUPN</strong> is, of course, public property <strong>and</strong> is subject to requests under the<br />
Freedom of Information Act (FOIA). The data management plan for the <strong>CUPN</strong> <strong>Monitoring</strong><br />
program (Moore et al. 2004) describes appropriate procedures to respond to FOIA requests,<br />
including the protection of sensitive data such as endangered species locations. Reports<br />
containing non-sensitive data will be disseminated through the <strong>CUPN</strong> websites. Through the<br />
websites, those requesting information will be asked to provide information to document by<br />
whom <strong>and</strong> for what purpose the report is being used. By documenting requests, users can be<br />
informed when updated reports are available. Users requesting paper copies will be documented<br />
also.<br />
62
In an effort to disseminate findings in a timely manner, annual reports should be completed by<br />
March 31 of the year following data collection. A brief (2-3 paragraphs) summary of sampling<br />
activities, preliminary results, <strong>and</strong> any public interest highlights that occurred during each federal<br />
fiscal year will be written by October 15 for inclusion in the <strong>CUPN</strong> Annual Administrative<br />
Report. More extensive summary reports (long-term trend reports) should be completed every<br />
five years. These reports will be centered upon ozone <strong>and</strong> ozone effects data, but will also<br />
synthesize findings among several vital signs being monitored across the <strong>CUPN</strong> that display<br />
cross correlation. Summary reports may be used in place of annual reports for the year in which<br />
the last data is collected.<br />
Literature Cited<br />
Moore, W. J., R. Byrd, <strong>and</strong> T. R. Leibfreid. 2005. Data management plan for the Cumberl<strong>and</strong><br />
Piedmont Network <strong>and</strong> Mammoth Cave National Park Prototype <strong>Monitoring</strong> Program.<br />
USDI National Park Service. Mammoth Cave, KY. 81pp.<br />
CBE Style Manual Committee. 1994. Scientific style <strong>and</strong> format: the CBE manual for authors,<br />
editors, <strong>and</strong> publishers. Sixth edition. Council of Biology Editors, Cambridge University<br />
Press, New York, New York, USA.<br />
Day, R. A. 1983. How to write <strong>and</strong> publish a scientific paper. Second edition. ISI Press,<br />
Philadelphia, Pennsylvania, USA.<br />
Lertzman, K. 1995. Notes on writing papers <strong>and</strong> theses. Bulletin of the Ecological Society of<br />
America 76:86-90.<br />
Mack, R. N. 1986. Writing with precision, clarity, <strong>and</strong> economy. Bulletin of the Ecological<br />
Society of America 67:31-35.<br />
Strunk, W. Jr., <strong>and</strong> E. B. White. 1979. The elements of style. Third edition. Macmillan, New<br />
York, New York, USA.<br />
63
A <strong>Protocol</strong> for <strong>Monitoring</strong> <strong>Ozone</strong> <strong>and</strong> <strong>Foliar</strong> <strong>Injury</strong> throughout the<br />
Cumberl<strong>and</strong> Piedmont Network<br />
St<strong>and</strong>ard Operating Procedure (SOP) #OC9: <strong>Ozone</strong><br />
Concentration - Revising the <strong>Protocol</strong><br />
Revision History Log:<br />
Previous<br />
Version #<br />
Revision<br />
Date<br />
Version 1.0 (November 2011)<br />
Author Changes Made Reason for Change New<br />
Version #<br />
This St<strong>and</strong>ard Operating Procedure explains how to make changes to the ozone <strong>and</strong> ozone effects<br />
monitoring <strong>Protocol</strong> Narrative for the Cumberl<strong>and</strong> Piedmont Network (<strong>CUPN</strong>) <strong>and</strong><br />
accompanying SOPs, <strong>and</strong> how to track these changes. Any changes in the ozone <strong>and</strong> foliar<br />
injury monitoring protocol will adhere to the guidelines contained in this SOP. Observers asked<br />
to edit the <strong>Protocol</strong> Narrative or any one of the SOPs need to follow this outlined procedure in<br />
order to eliminate confusion in how data are collected <strong>and</strong> analyzed. All observers should be<br />
familiar with this SOP in order to identify <strong>and</strong> use the most current methodologies, <strong>and</strong> should<br />
see the revision history log attached to each SOP.<br />
Procedures<br />
1. The ozone <strong>and</strong> foliar injury monitoring protocol for the <strong>CUPN</strong> <strong>and</strong> (Narrative <strong>and</strong><br />
accompanying SOPs) has attempted to incorporate the most sound methodologies for<br />
collecting <strong>and</strong> analyzing data. However, all protocols regardless of how sound require<br />
editing as new <strong>and</strong> different information becomes available. Required edits should be made<br />
in a timely manner <strong>and</strong> appropriate reviews undertaken.<br />
2. All edits require review for clarity <strong>and</strong> technical soundness. Oversight of the revision<br />
process for all protocols is the responsibility of the <strong>CUPN</strong> coordinator(s). When a potential<br />
modification to a protocol is identified, the project leader consults with the coordinator(s),<br />
who then decides whether the change should be considered “small” or “significant”. Small<br />
changes or additions to existing methods will be reviewed in-house by <strong>CUPN</strong> staff<br />
designated by the coordinator(s). However, if a substantial change, such as a change in<br />
methods is sought, then an outside review may be required. The need will be determined by<br />
the protocol coordinators <strong>and</strong> project leader. Reviewers will be selected based on the type of<br />
change (i.e., changes in sampling sites versus changes in sampling design or sampling<br />
analysis). Regional <strong>and</strong> National staff of the National Park Service, as well as the U.S.<br />
64
Geological Survey-Biological Resource Discipline, with familiarity in ecological research<br />
<strong>and</strong> data analysis will be utilized as reviewers. Also, experts in air quality monitoring,<br />
research, <strong>and</strong> statistical methodologies outside of the National Park Service will be utilized in<br />
the review process, as needed.<br />
3. Document all edits <strong>and</strong> protocol versioning in the Revision History Log that accompanies the<br />
<strong>Protocol</strong> Narrative <strong>and</strong> each SOP. Log changes in the <strong>Protocol</strong> Narrative or SOP being<br />
edited only. Version numbers increase incrementally by hundredths (e.g. version 1.01,<br />
version 1.02…1.3…1.41…etc) for minor changes , such as changes to grammar, spelling,<br />
formatting, or minor modifications in the process that do not affect interpretation of the data.<br />
Major revisions, such as significant changes in the process or changes that affect<br />
interpretation of the data, should be designated with the next whole number (e.g., version 2.0,<br />
3.0, 4.0 …etc). Record the previous version number, date of revision, author of the revision,<br />
identify paragraphs <strong>and</strong> pages where changes are made, <strong>and</strong> the reason for making the<br />
changes along with the new version number.<br />
4. Depending upon the magnitude <strong>and</strong> nature of a proposed change, it could have significant<br />
implications for data management. The database may have to be edited by the data manager<br />
to accompany changes in the <strong>Protocol</strong> Narrative <strong>and</strong> SOPs. Thus the data manager must be<br />
consulted prior to implementing changes to protocols. Immediately after the changes to the<br />
<strong>Protocol</strong> Narrative or SOP(s) have been made, inform the data manager, so the new version<br />
number can be incorporated in the metadata of the project database.<br />
5. Post new versions on the Internet <strong>and</strong> in the “Narratives” or “SOP” subfolder for the project<br />
on the network server. Forward copies to all individuals with a previous version of the<br />
affected <strong>Protocol</strong> Narrative or SOP. Archive a copy of each previous version in the <strong>CUPN</strong><br />
archives.<br />
65
A <strong>Protocol</strong> for <strong>Monitoring</strong> <strong>Ozone</strong> <strong>and</strong> <strong>Foliar</strong> <strong>Injury</strong> throughout the<br />
Cumberl<strong>and</strong> Piedmont Network<br />
St<strong>and</strong>ard Operating Procedure (SOP) #FoIn1: <strong>Foliar</strong> <strong>Injury</strong> -<br />
Training of Field Personnel<br />
Revision History Log:<br />
Previous<br />
Version #<br />
Revision<br />
Date<br />
Version 1.0 (November 2011)<br />
Author Changes Made Reason for Change New<br />
Version #<br />
<strong>Foliar</strong> injury sampling requires an overall project leader <strong>and</strong> additional staff as outlined in the<br />
Table 11. The project leader (who also serves as a crew leader) oversees <strong>and</strong> directs project<br />
operations, including training of crew members who will only assist the crew leader (but will not<br />
make foliar injury determinations). Each crew consists of one crew leader <strong>and</strong> at least one crew<br />
member. The project crew leader has expertise in ozone injury sampling methods. The project<br />
crew member has varied <strong>and</strong> less expertise, <strong>and</strong> is responsible for assisting the crew leader with<br />
data collection.<br />
Table 11 – Tasks <strong>and</strong> personnel needed for foliar injury assessments.<br />
Task Personnel required<br />
<strong>Foliar</strong> <strong>Injury</strong> Survey Initiation <strong>CUPN</strong> coordinators or project lead<br />
<strong>Foliar</strong> <strong>Injury</strong> Survey Crew leader <strong>and</strong> one (minimum) or two member field crew<br />
To ensure high data quality, crew leaders should be thoroughly familiar with SOP #FoIn2, which<br />
deals with pre-sampling <strong>and</strong> training exercises, <strong>and</strong> SOP #FoIn4 which deals with field<br />
sampling. The overall project leader should be a permanent staff member.<br />
Transient personnel (e.g., student interns, short-term or seasonal employees, volunteers, etc.)<br />
should serve as project crew members (i.e., field assistants). While review of SOP #FoIn4 for<br />
crew members is encouraged, it is not essential because the tasks assigned to crew members can<br />
be easily taught <strong>and</strong> rehearsed during a pre-sampling “training” meeting prior to start of field<br />
work. In this meeting, the project leader or crew leader also reviews member roles, steps in the<br />
sampling process, the particular safety Job Hazard Analyses, <strong>and</strong> two-way radio use.<br />
66
A <strong>Protocol</strong> for <strong>Monitoring</strong> <strong>Ozone</strong> <strong>and</strong> <strong>Foliar</strong> <strong>Injury</strong> throughout the<br />
Cumberl<strong>and</strong> Piedmont Network<br />
St<strong>and</strong>ard Operating Procedure (SOP) #FoIn2: <strong>Foliar</strong> <strong>Injury</strong> -<br />
Pre-Sampling<br />
Revision History Log:<br />
Previous<br />
Version #<br />
Revision<br />
Date<br />
Version 1.0 (November 2011)<br />
Author Changes Made Reason for Change New<br />
Version #<br />
This SOP describes tasks to be performed prior to site visits. This SOP gives procedures for:<br />
• USFS Workshop/Certification <strong>and</strong> Online Assessment Exercises<br />
• General Site Visit Preparation<br />
It must be noted that the <strong>NPS</strong> requires research/collecting permits be obtained before any field<br />
work can commence. So, each year <strong>and</strong> for each park, the project lead must submit an<br />
application through the <strong>NPS</strong> Research Permit <strong>and</strong> Reporting System<br />
https://science.nature.nps.gov/research/ac/ResearchIndex. A travel authorization should also be<br />
completed prior to departure when overnight stays are needed.<br />
USFS Workshop/Certification <strong>and</strong> <strong>NPS</strong>-ARD Online Training<br />
A crew should have one person who is especially knowledgeable in the assessment of foliar<br />
injury. For this reason, one member of <strong>CUPN</strong> staff (usually the project/crew leader) must, as<br />
prescribed by the USFS, participate annually in USFS workshops on foliar injury assessments or<br />
take the annual exams necessary to be re-certified by the USFS to conduct surveys.<br />
Additionally, an online foliar injury assessment exercise has been developed <strong>and</strong> is maintained<br />
by the <strong>NPS</strong> Air Resources Division (<strong>NPS</strong>-ARD). Any staff member who may be participating in<br />
a foliar injury assessment session should complete the online training. This training should be<br />
completed prior to field assessments. The exercise should be completed multiple times to assure<br />
that the crew member can correctly assess foliar injury in the field. This is true for crew<br />
members who will be making injury assessments in the field, but not for those whose anticipated<br />
role is to provide support services. Crew members that will not be assessing injury are not<br />
required to be considered “proficient” at assessing injury, but are still encouraged to complete<br />
the online exercises so that they gain familiarity with the appearance of foliar injury. The URL<br />
for the training exercise is http://www2.nature.nps.gov/air/edu/O3Training/index.cfm.<br />
67
General Site Visit Preparation<br />
1. Acquire an <strong>NPS</strong> research/collecting permit. The crew should carry a photocopy of the<br />
permit while in the field.<br />
2. Obtain travel authorization. This applies to all crew members.<br />
3. Copies of field data forms from recent sampling events should be reviewed to identify<br />
any unique events or hazards that may be encountered.<br />
4. Review the list of sensitive plants <strong>and</strong> be able to identify each species. Also, review list<br />
of species known to occur in the park unit. Proper assessment requires that samplers be able<br />
to identify the species of interest. Review of the field guide book or other plant guide with<br />
plates is helpful.<br />
5. Complete foliar injury refresher training as detailed in the previous section of this SOP.<br />
6. Schedule the site visit. Site visits should be scheduled with host parks regardless of whether<br />
the crew needs an escort to the site. At the very least <strong>and</strong> as a courtesy, a host park should<br />
always be notified of an upcoming site visit. Usually, however, it is necessary to have<br />
personnel from the host park escort the site crew to the site.<br />
7. Print copies of the foliar injury, site mapping <strong>and</strong> voucher specimen field forms. The<br />
USFS provides updated copies of these forms each year.<br />
8. Know how to navigate to the destination park <strong>and</strong> know the location of sampling sites.<br />
To locate a particular site, it may be sufficient to arrange for personnel at the host park to<br />
escort the crew to the site.<br />
9. Obtain or request that personnel at the host park obtain any keys necessary to access<br />
sites.<br />
10. Gather equipment <strong>and</strong> supplies. All equipment should be examined to be sure that it is<br />
functioning properly. Supplies should be inventoried <strong>and</strong>, as necessary, purchased. A list of<br />
equipment <strong>and</strong> supplies is given below.<br />
List of equipment <strong>and</strong> supplies:<br />
Plant press<br />
Petiole labels for voucher leaf samples<br />
Field forms<br />
H<strong>and</strong>held GPS<br />
10X h<strong>and</strong> lens<br />
Digital camera<br />
Field guides or reference samples<br />
Plant guides including trees, shrubs, herbs of interest<br />
Compass<br />
Rangefinder or tape measure<br />
Park radio or cell phone<br />
Park Plant List <strong>and</strong> <strong>Ozone</strong> Sensitive Species List<br />
Replacement batteries<br />
Snake stick (for pulling high branches into view)<br />
11. Depart for the field site <strong>and</strong>/or host park.<br />
68
A <strong>Protocol</strong> for <strong>Monitoring</strong> <strong>Ozone</strong> <strong>and</strong> <strong>Foliar</strong> <strong>Injury</strong> throughout the<br />
Cumberl<strong>and</strong> Piedmont Network<br />
St<strong>and</strong>ard Operating Procedure (SOP) #FoIn3: <strong>Foliar</strong> <strong>Injury</strong> -<br />
Establishment <strong>and</strong> Location of Sampling Sites<br />
Revision History Log:<br />
Previous<br />
Version #<br />
Revision<br />
Date<br />
Version 1.0 (November 2011)<br />
Author Changes Made Reason for Change New<br />
Version #<br />
This SOP explains the procedures used for establishing <strong>and</strong> locating foliar injury assessment<br />
locations to be followed by the Cumberl<strong>and</strong> Piedmont Network (<strong>CUPN</strong>).<br />
Establishment of Sampling Sites<br />
Selection of foliar injury assessment sites is based upon criteria established by the USFS<br />
protocol. The USFS uses non-r<strong>and</strong>omly selected sites. The USFS criteria include:<br />
• Ease of access – the most easily accessible site(s) are preferred, but other factors from this<br />
list should also be considered.<br />
• Size of opening – at least three acres is preferred, but smaller openings may be considered.<br />
• Number of species – more than three species is preferred by the USFS <strong>and</strong> by the <strong>CUPN</strong>, but<br />
the <strong>CUPN</strong> will allow plots with only one species.<br />
• Number of plants – the USFS requires 30 plants from 2 species but three or more species is<br />
preferred. For the <strong>CUPN</strong>, every effort will be made to meet the requirement, but sites with<br />
fewer plants will be accepted.<br />
• Condition of the soil – low drought potential with good fertility is preferred, but moderately<br />
dry <strong>and</strong> moderately fertile soils are acceptable.<br />
• Site disturbance – no recent disturbance or obvious soil compaction is preferred, but a site<br />
with little disturbance <strong>and</strong> no obvious widespread soil compaction is acceptable.<br />
The USFS protocol also allows split plots – two separate sites that are pooled <strong>and</strong> treated as one<br />
site. Detailed discussions of split plots may be found in the USFS protocol. The <strong>CUPN</strong><br />
recommends that the opening size, soil conditions <strong>and</strong> site disturbance criteria be used as<br />
established in the USFS protocol. The species count <strong>and</strong> plant count criteria, however, may be<br />
relaxed a bit. Every attempt will be made to meet these criteria, but in some instances meeting<br />
the criteria will not be possible. Samplers should get as many plants as possible from at least<br />
two species with at least 30 plants from two species being the target.<br />
69
A <strong>Protocol</strong> for <strong>Monitoring</strong> <strong>Ozone</strong> <strong>and</strong> <strong>Foliar</strong> <strong>Injury</strong> throughout the<br />
Cumberl<strong>and</strong> Piedmont Network<br />
St<strong>and</strong>ard Operating Procedure (SOP) #FoIn4: <strong>Foliar</strong> <strong>Injury</strong> -<br />
Sampling<br />
Revision History Log:<br />
Previous<br />
Version #<br />
Revision<br />
Date<br />
Version 1.0 (November 2011)<br />
Author Changes Made Reason for Change New<br />
Version #<br />
This SOP explains the procedures used for foliar injury assessments that should be followed by<br />
all project crews. Included are detailed, step-by-step instructions that cover details such as<br />
sketching a site map, collecting foliar injury data, <strong>and</strong> collecting voucher leaf samples. <strong>Foliar</strong><br />
injury sampling should be completed during the time prescribed by the USFS.<br />
<strong>Foliar</strong> <strong>Injury</strong> Sampling Procedure<br />
1. Complete pre-sampling activities (SOP #FoIn2).<br />
2. Depart for the sampling site.<br />
3. Collect foliar injury data. Data should be recorded onto the current year’s field form<br />
provided by the USFS. The 2010 field form is shown in Figure 21. The sampler should walk<br />
systematically throughout the plot, looking at each individual from the selected plant species.<br />
Each individual should be visually inspected to determine whether any foliar injury is<br />
evident. As prescribed by the USFS, only leaves on the plant that are exposed to direct<br />
sunlight should be considered. Further, as is stipulated in the USFS protocol, clonal<br />
individuals should be avoided. To avoid such sampling, the USFS protocol advises the<br />
sampler to “take several steps between each plant selected for evaluation.” Continue to move<br />
from one individual to the next until all individuals in the site have been examined. Ideally,<br />
thirty individuals from each of at least two species will be examined.<br />
4. Plant species should be selected from Table 3 with preference given to the list below<br />
(especially the bolded species).<br />
• Blackberry<br />
• Common milkweed<br />
• Black cherry<br />
• Yellow poplar<br />
• White ash<br />
70<br />
• Sassafras<br />
• Spreading dogbane<br />
• Big leaf aster<br />
• Sweetgum<br />
• Pin cherry
Figure 21 – 2010 foliar injury field form.<br />
5. Evaluate the amount of foliar injury. In the USFS protocol, injury amount is defined as<br />
“the percentage of leaves on the plant with ozone injury symptoms relative to the total<br />
number of leaves on the plant.” The <strong>CUPN</strong> will use the scale for injury amount that was<br />
developed by the USFS shown in Table 12.<br />
Table 12 – Codes used for the “amount” index.<br />
Code Definition<br />
0 No injury; the plant does not have any leaves with ozone symptoms.<br />
1 1 to 6 percent of the leaves have ozone symptoms<br />
2 7 to 25 percent of the leaves are injured<br />
3 26 to 50 percent of the leaves are injured<br />
4 51 to 75 percent of the leaves are injured<br />
5 >75 percent of the leaves have ozone symptoms<br />
6. Evaluate the severity of foliar injury. In the USFS protocol, injury severity is defined as<br />
“on average, … [the] percent of the leaf area of injured leaves [that] have ozone symptoms.”<br />
As with the amount index, the severity index is estimated for each plant. The USFS scale for<br />
severity is a 0 – 5 scale, similar to that used for the amount index. The severity scale is<br />
shown in Table 13.<br />
71
Table 13 – Codes used for the “severity” index.<br />
Code Definition<br />
0 No injury; the plant does not have any leaves with ozone symptoms.<br />
1 On average, 1 to 6 percent of the leaf area of injured leaves have ozone symptoms<br />
2 On average, 7 to 25 percent of the leaf area of injured leaves have ozone symptoms<br />
3 On average, 26 to 50 percent of the leaf area of injured leaves have ozone symptoms<br />
4 On average, 51 to 75 percent of the leaf area of injured leaves have ozone symptoms<br />
5 On average, >75 percent of the leaves have ozone symptoms<br />
Notes on filling out the foliar injury field form<br />
The foliar injury field form (shown in Figure 21) may be divided into two sections. The first<br />
section contains information on where, when <strong>and</strong> who collected the data. The field titled<br />
“Field ID (O3 Hex Num)” does not apply to the <strong>CUPN</strong>. The <strong>CUPN</strong> uses that field for site<br />
name <strong>and</strong> site code. The site code consists of the four-character park abbreviation from<br />
Table 1 <strong>and</strong> a four digit site identifier such as 0001. The site identifier for each site will<br />
remain unchanged from year-to-year. “Split Plot ID” is null, a “1” or a “2” <strong>and</strong> identifies<br />
whether a split plot is being used. The USFS uses split plots when enough species/plants<br />
cannot be found at one site, but, when combined, result in enough species/plants. More<br />
information on split plots may be found in the USFS protocol. The “Circle QA Status” field<br />
is used by the USFS to identify the type of crew that is filling out the field form. The <strong>CUPN</strong><br />
does not currently use the “Circle QA Status” field.<br />
The second section details the species, amount of ozone injury, <strong>and</strong> severity of ozone injury<br />
for each of the plants observed at the site. This part of the sheet is arranged in columns with<br />
each column devoted to one species. As a plant from a given species is encountered in the<br />
field, the amount <strong>and</strong> severity indices are recorded for that plant using the next available<br />
plant number within the column for that species. More details on the fields on the form may<br />
be found in the USFS protocol.<br />
7. As appropriate, collect leaf vouchers. For each species showing foliar injury, at least one<br />
voucher specimen should be collected at each site. The general procedures for collecting<br />
voucher leaf samples are as follows.<br />
a. Collect a voucher specimen that is representative in appearance <strong>and</strong> severity of<br />
what has been observed at the site. Three leaves are considered one voucher <strong>and</strong> one<br />
voucher should be collected for each species showing foliar injury. Ideally, leaves should<br />
come from multiple plants <strong>and</strong> not be abnormally large or small.<br />
b. Immediately label the specimen using a USFS-supplied petiole label. Site, date, <strong>and</strong><br />
species should be noted on the label as shown in figures 10 <strong>and</strong> 11.<br />
c. Immediately place the specimen in a plant press. Specimens should remain in the<br />
press for at least 36 hours.<br />
72
Figure 22 – 2010 voucher specimen field form.<br />
d. Fill out the voucher leaf sample field form. An example field form is shown in Figure<br />
22. One field form should be completed for each site at which injury is found. The field<br />
form is divided into three sections: a general information section, a voucher specimen <strong>and</strong><br />
site condition section, <strong>and</strong> a QA/QC section. The general information section contains<br />
fields as described above in “Notes on filling out the foliar injury field form”.<br />
The voucher <strong>and</strong> site section contains information on injury parameters as observed<br />
across the site <strong>and</strong> the specimen(s) collected as well as the condition of the site during the<br />
visit. The table in this section contains information on voucher specimens <strong>and</strong> the plant<br />
population from which they were taken. The “injury location” datum describes where, on<br />
each plant, ozone injury tended to be located. The “injury type” datum describes the mix<br />
of ozone injury (such as stipple) <strong>and</strong> non-ozone injury typical of leaves at the site. The<br />
codes in Table 14 are used for each datum (these codes <strong>and</strong> text are taken from the USFS<br />
protocol). The last field in the table addresses percent of injury on the leaves that is<br />
ozone stipple. This field is concerned with the voucher specimen <strong>and</strong> not the population<br />
of plants from which the voucher was collected. The remaining questions in the voucher<br />
information <strong>and</strong> site condition section are self-explanatory.<br />
The QA/QC section is not completed in the field; it is completed in the laboratory by<br />
laboratory personnel. More information on fields contained in this field form may be<br />
found in the USFS protocol.<br />
73
Table 14 – The codes for “injury location” <strong>and</strong> “injury type” data.<br />
<strong>Injury</strong> Location <strong>Injury</strong> Type<br />
1 – Greater than 50% of the injured leaves are 1 – Greater than 50% of the injury is upper-leaf-surface<br />
younger leaves<br />
stipple<br />
2 – Greater than 50% of the injured leaves are 2 – Greater than 50% is not stipple (tan flecks, bifacial or<br />
mid-aged or older<br />
general discoloration)<br />
3 – Injured leaves are all ages 3 – <strong>Injury</strong> is varied or difficult to describe<br />
e. Once all specimens have been collected for the site, secure the plant press.<br />
8. Fill out site characteristics field form. The site characteristics field form includes<br />
information about the estimated acreage of the opening <strong>and</strong> GPS coordinates/elevation at the<br />
approximate center of the opening. The field form is also divided into three sections. The<br />
first is the general information section, as in the foliar injury data sheet. The second section<br />
contains self-explanatory fields that provide general data about site conditions. The final<br />
section contains geographic information as collected by a GPS unit. Details for all field<br />
entries may be found in the USFS protocol.<br />
Figure 23 – 2010 site characteristics form. Note that some fields on the form have not been filled in. This<br />
scan is a copy of the form immediately upon returning from the sampling. Those empty fields were filled<br />
in at a later time.<br />
9. Sketch a map of the site. Sketches should be completed each time a site is sampled. The<br />
sketch should show the approximate shape of the opening, locations of plant groupings, <strong>and</strong><br />
the location of the site relative to some l<strong>and</strong>mark such as a town or geographical l<strong>and</strong>mark.<br />
74
The field form is divided into three sections. The first section contains general information<br />
on where, when, <strong>and</strong> by whom the site map was sketched. This section is similar to the<br />
corresponding section of the foliar injury data sheet. The second section is a rectangle in<br />
which to draw the site sketch. For an example of a properly sketched site, see sections 9.2.3<br />
<strong>and</strong> 9.2.4 of the USFS protocol. The final section of the field form contains geographic<br />
information as collected with a GPS unit. An example site sketch is also shown in Figure 24.<br />
Figure 24 – 2010 site sketch form. Note that some fields on the form have not been filled in. This scan is<br />
a copy of the form immediately upon returning from the sampling. Those empty fields were filled in at a<br />
later time.<br />
10. Prepare equipment, supplies, <strong>and</strong> voucher specimens for transport to next site or office.<br />
11. Take site photographs.<br />
12. Go to the next site or return to the office.<br />
75
A <strong>Protocol</strong> for <strong>Monitoring</strong> <strong>Ozone</strong> <strong>and</strong> <strong>Foliar</strong> <strong>Injury</strong> throughout the<br />
Cumberl<strong>and</strong> Piedmont Network<br />
St<strong>and</strong>ard Operating Procedure (SOP) #FoIn5: <strong>Foliar</strong> <strong>Injury</strong> -<br />
Post-Sampling<br />
Revision History Log:<br />
Previous<br />
Version #<br />
Revision<br />
Date<br />
Version 1.0 (November 2011)<br />
Author Changes Made Reason for Change New<br />
Version #<br />
This SOP describes tasks to be performed after site visits. The crew leader must check, shortly<br />
after the event, that all post-sampling activities have been completed (tools have been properly<br />
stored, data have been pulled from GPS units, voucher specimens have been processed, etc).<br />
1. Close out travel authorizations. Any crew member working under a travel authorization<br />
should close out said authorization per the procedures of that member’s governing agency.<br />
2. Review field forms. Copies of field data forms from the sampling event should be reviewed<br />
to assure that any unique events or hazards that were encountered have been noted. Field<br />
forms should also be reviewed for completeness <strong>and</strong> correctness, with corrections made as<br />
appropriate. Corrections should be made in such a way that the original data are not lost, so<br />
that if the correction is later found to be incorrect, the original data are still preserved.<br />
3. Offload <strong>and</strong> archive site photographs on <strong>CUPN</strong>’s network drive.<br />
4. Pull any data collected on a h<strong>and</strong>held GPS unit. Data should be archived according to<br />
procedures outlined in this protocol’s data management SOP.<br />
5. Properly store equipment <strong>and</strong> supplies. All equipment should be examined to be sure that<br />
it is functioning properly. Any malfunctioning equipment should be repaired or replaced.<br />
Supplies should be inventoried <strong>and</strong>, as necessary, purchased.<br />
6. Enter field data into the ozone database. Once data have been entered, field forms should<br />
be archived in accordance with established <strong>NPS</strong> guidelines.<br />
7. Process voucher leaf samples. Once voucher specimens have been in the plant press long<br />
enough to properly dry (at least 36 hours), the <strong>CUPN</strong> data manager will inspect the<br />
specimens <strong>and</strong> take digital photographs of them. The vouchers will be mounted <strong>and</strong> labeled<br />
for the photograph. Once photographed, specimens will be preserved in the <strong>CUPN</strong> office at<br />
MACA in accordance with established <strong>NPS</strong> procedures or returned to the originating park if<br />
so requested by that park. Photographic vouchers will be archived on the <strong>CUPN</strong> server using<br />
guidelines as established in the <strong>NPS</strong> museum h<strong>and</strong>book.<br />
76
A <strong>Protocol</strong> for <strong>Monitoring</strong> <strong>Ozone</strong> <strong>and</strong> <strong>Foliar</strong> <strong>Injury</strong> throughout the<br />
Cumberl<strong>and</strong> Piedmont Network<br />
St<strong>and</strong>ard Operating Procedure (SOP) #FoIn6: <strong>Foliar</strong> <strong>Injury</strong> –<br />
Data Management<br />
Revision History Log:<br />
Previous<br />
Version #<br />
Revision<br />
Date<br />
Version 1.0 (November 2011)<br />
Author Changes Made Reason for Change New<br />
Version #<br />
This SOP describes tasks to be performed for data management. The crew leader must check,<br />
shortly after field sampling, that all data management activities have been completed (data have<br />
been entered from field forms, GIS data have been processed from GPS units, voucher specimen<br />
data have been processed, etc).<br />
Introduction<br />
There are three database components to manage in foliar injury monitoring:<br />
1. <strong>Foliar</strong> injury data: In MSAccess/NRDT format. This template structure was developed by<br />
the <strong>NPS</strong>-IM Program (<strong>NPS</strong> 2006) <strong>and</strong> helps to st<strong>and</strong>ardize database development across<br />
Networks. The custom tables needed for foliar injury will be under development in FY12.<br />
Table structure will closely adhere to NRDT st<strong>and</strong>ards. Field forms will follow format used<br />
by the US Forest Service in Phase 3 Field Guide – Section 9 (2008). The field guide,<br />
including a description of database fields is included as Appendix A <strong>and</strong> can be found online<br />
at http://www.fia.fs.fed.us/library/field-guides-methods-proc/ . Hardcopy field forms will be<br />
scanned after QA/QC is completed <strong>and</strong> stored on the <strong>CUPN</strong> server.<br />
2. GIS data: In ArcGIS format. The spatial component of foliar injury monitoring will be<br />
managed in ArcGIS with metadata according to procedures outlined in the <strong>CUPN</strong> data<br />
management plan (Moore et al 2005). The GIS layers will be created from hardcopy field<br />
forms <strong>and</strong> data from GPS units. Since monitoring locations/sites are variable, GIS layers will<br />
likely change with each repeated event. Centroid points will represent areas where species<br />
were monitored on each park (sites) <strong>and</strong> locations of targeted species populations will be<br />
represented by x,y coordinates (locations).<br />
3. Voucher <strong>and</strong> Archival Data: In ICMS format. This is the <strong>NPS</strong> museum st<strong>and</strong>ard <strong>and</strong> will<br />
be followed according to guidelines established by that program. Leaf specimens,<br />
photographic vouchers, <strong>and</strong> archival material will be entered into ICMS, according to<br />
procedures established in the <strong>NPS</strong> museum h<strong>and</strong>book.<br />
77
Data Entry, Verification, Validation.<br />
Field monitoring will occur during July <strong>and</strong> August for foliar injury surveys. Immediately upon<br />
returning from the field, the field crew leader will check the field data forms for completeness<br />
<strong>and</strong> accuracy. Following completion of the review, hardcopy sampling forms <strong>and</strong> voucher<br />
specimens/photographs will be submitted to the <strong>CUPN</strong> office at Mammoth Cave, Ky. A data<br />
manager will recheck the data forms for completeness <strong>and</strong> accuracy, before data are entered into<br />
the USFS database. Once all the data are entered, it will then be checked to hardcopy<br />
(verification) by data manager(s) <strong>and</strong> for validity (validation) by project lead. After certifying<br />
the validity of the data content for each sampling trip, the data forms will be scanned <strong>and</strong> copied<br />
to the project’s Validated_Data folder. The <strong>CUPN</strong> biological/curatorial specialist will h<strong>and</strong>le<br />
the voucher specimen data entry into ICMS, <strong>and</strong> the <strong>CUPN</strong> GIS specialist will process the<br />
ArcGIS layer with metadata.<br />
Database Administration<br />
Data Maintenance<br />
Datasets are rarely static. They often change through additions, corrections, <strong>and</strong> improvements<br />
made following the archiving of a dataset. There are three main caveats to this process:<br />
4. Only make changes that improve or update the data while maintaining data integrity.<br />
5. Once archived, document any changes made to the dataset.<br />
6. Be prepared to recover from mistakes made during editing.<br />
Any editing of archived data is accomplished jointly by the project leader <strong>and</strong> a data manager.<br />
Every change must be documented in the edit log <strong>and</strong> accompanied by an explanation that<br />
includes pre- <strong>and</strong> post-edit data descriptions.<br />
Data Organization<br />
<strong>CUPN</strong> has established a template directory structure, composed of seven folders <strong>and</strong> four<br />
subfolders for each vital sign monitoring project (Figure 25). Project files which are being<br />
modified, considered draft, <strong>and</strong>/or certain files currently in use (e.g., a copy of the field data<br />
form) should reside within this directory. A similar directory structure will contain archived files<br />
(\<strong>CUPN</strong>_Archive\). Both the working <strong>and</strong> archive directories will be accessible via the MACA<br />
Local Area Network, with access permissions maintained by the data manager(s) <strong>and</strong>/or MACA<br />
Information Technology Staff.<br />
78
Figure 25 – <strong>CUPN</strong> project directory structure.<br />
The data tables utilized for data entry <strong>and</strong> validation reside within the “Working_Data” folder.<br />
Once data in these tables are validated by the project leader, a data manager will append the<br />
records to the data tables in the “Validated_Data” folder <strong>and</strong> the “working” data tables will be<br />
emptied. As indicated, the data tables containing the master protocol-specific data for the project<br />
are contained in the “Validated_Data” folder. These data have been validated <strong>and</strong> are available<br />
as read-only except to <strong>CUPN</strong> data managers.<br />
Data Security <strong>and</strong> Integrity<br />
As many different users will be accessing the data, it is imperative that the data remain secure.<br />
To address this need, data managers have created user groups within the local area network<br />
operating system that will have different security levels. Generally, three levels of users will be<br />
given different sets of permissions. <strong>CUPN</strong> data managers will have all permissions, including<br />
insert, delete, <strong>and</strong> modify for all folders in the folder structure. Project leaders/program<br />
coordinators, will have the same permissions as program data managers except for read-only<br />
permission to the shared data tables <strong>and</strong> archived data. Those entering the data will have insert<br />
<strong>and</strong> modify permission to the observation data <strong>and</strong> read-only permission to the lookup <strong>and</strong><br />
shared data tables.<br />
Version Control<br />
Prior to any major changes of a dataset, a copy is stored with the appropriate version number.<br />
This allows for the tracking of changes over time. With proper controls <strong>and</strong> communication,<br />
versioning ensures that only the most current version is used in any analysis. Versioning of<br />
archived datasets is anticipated to be h<strong>and</strong>led in the same manner as protocol narrative <strong>and</strong> SOP<br />
versioning (see SOP #FoIn9). Frequent users of the data are notified of the updates, <strong>and</strong><br />
provided with a copy of the most recent archived version.<br />
Data Logs <strong>and</strong> Backups<br />
Once the data are archived, any changes made to the data must be documented in an edit log.<br />
From this point forward, original field data forms should not be altered. Field forms can be<br />
reconciled to the database through the use of the edit log. Secure data archiving is essential for<br />
protecting data files from corruption. Once a dataset has passed the specified QA/QC<br />
procedures, an electronic version of the dataset will be maintained in a read-only format on the<br />
79
program server. Incremental or differential tape backups of all project databases are regularly<br />
conducted. Backup copies of the data are maintained in a secure alternate location.<br />
Data Availability<br />
In addition to the “st<strong>and</strong>ardized” data dissemination strategies noted in Chapter IX of the DMP,<br />
data will be made available for research <strong>and</strong> management applications on request (per the<br />
framework established in the DMP). Data requests should be directed to the <strong>CUPN</strong> Coordinator.<br />
Literature Cited<br />
Moore, W. J., R. Byrd, <strong>and</strong> T. Leibfreid. 2005. Data management plan for the Cumberl<strong>and</strong><br />
Piedmont Network <strong>and</strong> Mammoth Cave National Park Prototype monitoring program.<br />
USDI National Park Service. Mammoth Cave, KY. 81pp.<br />
<strong>NPS</strong>, Washington Support Office, <strong>Inventory</strong> <strong>and</strong> <strong>Monitoring</strong> Program. 2006. Natural Resource<br />
Database Template Revised Documentation. National Park Service. Fort Collins, CO.<br />
United States Forest Service. 2008. Phase 3 Field Guide – Section 9. <strong>Ozone</strong> Bioindicator Plants<br />
(east). Southern Research Station. Knoxville, TN. 49pp.<br />
80
A <strong>Protocol</strong> for <strong>Monitoring</strong> <strong>Ozone</strong> <strong>and</strong> <strong>Foliar</strong> <strong>Injury</strong> throughout the<br />
Cumberl<strong>and</strong> Piedmont Network<br />
St<strong>and</strong>ard Operating Procedure (SOP) #FoIn7: <strong>Foliar</strong> <strong>Injury</strong> -<br />
Data Analysis<br />
Revision History Log:<br />
Previous<br />
Version #<br />
Revision<br />
Date<br />
Version 1.0 (November 2011)<br />
Author Changes Made Reason for Change New<br />
Version #<br />
This SOP outlines the data flow <strong>and</strong> expected analyses of the foliar injury data collected within<br />
the <strong>CUPN</strong>. The monitoring questions <strong>and</strong> subsequent analysis of the supporting data address<br />
issues related to status <strong>and</strong> trends in foliar injury throughout the <strong>CUPN</strong>. The status <strong>and</strong> trends of<br />
this parameter are understood to be impacted by the cumulative ozone exposure during the April<br />
through October growing season in most <strong>CUPN</strong> parks. Data collected through this protocol may<br />
be used to assess those impacts in <strong>CUPN</strong> parks. These data may be collected over multi-year<br />
scales. <strong>Monitoring</strong> questions will be addressed using a combination of summary <strong>and</strong> descriptive<br />
statistics, graphic analysis, <strong>and</strong> multivariate comparative <strong>and</strong> correlative analysis.<br />
The protocol was designed to answer the following monitoring questions related to foliar injury:<br />
• At select <strong>CUPN</strong> parks, is foliar injury occurring <strong>and</strong> what is the severity of that injury?<br />
• What are the trends in foliar injury occurrence <strong>and</strong> severity?<br />
Data Flow <strong>and</strong> Data Analysis<br />
<strong>Foliar</strong> injury data will be h<strong>and</strong>written onto field forms as they are collected in the field.<br />
Validation <strong>and</strong> archival of these data will be performed by <strong>CUPN</strong> staff, primarily the project lead<br />
in accordance with procedures outlined in the data management SOP (#FoIn6). Data entry will<br />
be carried out by <strong>CUPN</strong>/USFS staff. Analysis of the data will be h<strong>and</strong>led by the project lead.<br />
<strong>Foliar</strong> injury data will be incorporated into annual <strong>and</strong> multi-year reports that go out to each of<br />
the <strong>CUPN</strong> parks, <strong>and</strong> these reports will be archived as outlined in the reporting SOP (#FoIn8).<br />
Files created during data analysis will be stored on the <strong>CUPN</strong> server.<br />
For annual reports, analysis will be limited to sorting the data by park, site, species <strong>and</strong> whether<br />
the damage was confirmed or unconfirmed during the USFS voucher inspection. These data will<br />
be presented in tabular form within annual reports. A cursory review of these tables will provide<br />
the answer to the <strong>CUPN</strong>’s first monitoring question (is foliar injury occurring <strong>and</strong> what is the<br />
severity of that injury?). Multi-year reports will be written every time a sampling cycle is<br />
81
completed (that is, all of the parks have been sampled as shown in Table 4). The analyses<br />
presented in these reports will use data collected during one six year cycle. In addition to<br />
exploring the correlation between ozone exposure indices <strong>and</strong> injury data, basic statistics will be<br />
computed for the injury data. These statistics may be based on pooled data over different time<br />
periods <strong>and</strong> may include:<br />
• Site-level maximum damage amount <strong>and</strong> severity<br />
• Site-level minimum non-zero damage amount <strong>and</strong> severity<br />
• Site-level mean damage amount <strong>and</strong> severity<br />
• Site-level st<strong>and</strong>ard deviation of the damage amount <strong>and</strong> severity<br />
• Site-level proportion of plants that showed injury<br />
• Park-level maximum damage amount <strong>and</strong> severity<br />
• Park-level minimum non-zero damage amount <strong>and</strong> severity<br />
• Park-level mean damage amount <strong>and</strong> severity<br />
• Park-level st<strong>and</strong>ard deviation of the damage amount <strong>and</strong> severity<br />
• Park-level proportion of plants that showed injury<br />
These data may be analyzed using trend analysis to determine how the data are trending.<br />
Drought severity will also be considered in annual <strong>and</strong> multi-year reports. Drought severity will<br />
be gauged using the Palmer Drought Severity Index (PDSI). Indices vary primarily between -4<br />
<strong>and</strong> +4, but values may extend beyond those extremes. Negative values are used to denote<br />
drought conditions <strong>and</strong> positive values are used to denote wet conditions. Details on the PDSI<br />
may be found at<br />
http://www.cpc.ncep.noaa.gov/products/analysis_monitoring/cdus/palmer_drought/wpdanote.sht<br />
ml.<br />
These are basic questions which the project leader anticipates asking on an annual basis in order<br />
to provide “snapshots” of the current dataset. For more advanced analyses, raw foliar injury <strong>and</strong><br />
ozone concentration data will be imported into a commercial off-the-shelf statistical analysis<br />
software package such as SigmaStat or SigmaPlot. The sequence of steps for data import within<br />
SigmaStat <strong>and</strong> SigmaPlot are:<br />
1. Launch SigmaStat or SigmaPlot.<br />
2. Click on File to view the File menu.<br />
3. Select Import from the File menu.<br />
4. A window will open in which the user can select the appropriate file type <strong>and</strong> the file to be<br />
imported. There will be a drop-down list from which the appropriate file type may be<br />
selected. Select “Plain Text” or “Excel,” as appropriate. Then, navigate to the appropriate<br />
folder <strong>and</strong> select the desired file.<br />
5. Follow the on-screen directions to finish importing the selected file.<br />
82
A <strong>Protocol</strong> for <strong>Monitoring</strong> <strong>Ozone</strong> <strong>and</strong> <strong>Foliar</strong> <strong>Injury</strong> throughout the<br />
Cumberl<strong>and</strong> Piedmont Network<br />
St<strong>and</strong>ard Operating Procedure (SOP) #FoIn8: <strong>Foliar</strong> <strong>Injury</strong> -<br />
Reporting<br />
Revision History Log:<br />
Previous<br />
Version #<br />
Revision<br />
Date<br />
Version 1.0 (November 2011)<br />
Author Changes Made Reason for Change New<br />
Version #<br />
Details on the reporting procedure may be found in SOP #OC8.<br />
83
A <strong>Protocol</strong> for <strong>Monitoring</strong> <strong>Ozone</strong> <strong>and</strong> <strong>Foliar</strong> <strong>Injury</strong> throughout the<br />
Cumberl<strong>and</strong> Piedmont Network<br />
St<strong>and</strong>ard Operating Procedure (SOP) #FoIn9: <strong>Foliar</strong> <strong>Injury</strong> -<br />
Revising the <strong>Protocol</strong><br />
Revision History Log:<br />
Previous<br />
Version #<br />
Revision<br />
Date<br />
Version 1.0 (November 2011)<br />
Author Changes Made Reason for Change New<br />
Version #<br />
Details on how to revise this protocol may be found in SOP #OC9.<br />
84
The Department of the Interior protects <strong>and</strong> manages the nation’s natural resources <strong>and</strong> cultural heritage; provides scientific <strong>and</strong><br />
other information about those resources; <strong>and</strong> honors its special responsibilities to American Indians, Alaska Natives, <strong>and</strong> affiliated<br />
Isl<strong>and</strong> Communities.<br />
<strong>NPS</strong> XXXXXX, Month Year
National Park Service<br />
U.S. Department of the Interior<br />
Natural Resource Program Center<br />
1201 Oakridge Drive, Suite 150<br />
Fort Collins, CO 80525<br />
www.nature.nps.gov<br />
EXPERIENCE YOUR AMERICA TM