external influence in the making of development ... - FES Ethiopia
external influence in the making of development ... - FES Ethiopia
external influence in the making of development ... - FES Ethiopia

Create successful ePaper yourself
Turn your PDF publications into a flip-book with our unique Google optimized e-Paper software.
<strong>in</strong> place <strong>in</strong> different areas <strong>of</strong> <strong>the</strong> economy and <strong>the</strong> market mechanism was made<br />
<strong>in</strong>effective. Moreover, central plann<strong>in</strong>g was exercised with little <strong>in</strong>centive left at local<br />
level for craft<strong>in</strong>g own agenda and strategies. No wonder, <strong>the</strong>refore, welfare situation<br />
cont<strong>in</strong>uously deteriorated dur<strong>in</strong>g this period.<br />
The Derge regime was f<strong>in</strong>ally overthrown by <strong>the</strong> current government <strong>in</strong> 1991. Whereas<br />
important changes with respect to economic management, political adm<strong>in</strong>istration and<br />
governance were made beg<strong>in</strong>n<strong>in</strong>g <strong>in</strong> 1992 by <strong>the</strong> new government, an economic<br />
dynamism that is long sought is not yet achieved. So, <strong>Ethiopia</strong>’s position compared to<br />
<strong>the</strong> status achieved forty years ago is still worse <strong>in</strong> many key areas as shown <strong>in</strong> <strong>the</strong> table<br />
below:<br />
<strong>Ethiopia</strong>’s Selected Key Indicators<br />
N0. Indicators 40 years ago Now<br />
1 Per capita <strong>in</strong>come (<strong>in</strong> Birr) 249.3 252.4<br />
2 %age contribution <strong>of</strong> Agriculture to GDP 39.4<br />
4 Size <strong>of</strong> Loan 371 million USD 4.5 billion<br />
5 Loan as proportion <strong>of</strong> GDP 14 percent 91.3 percent<br />
6 External f<strong>in</strong>ance as proportion <strong>of</strong> total budget 35<br />
7 Proportion <strong>of</strong> population affected by drought 8.5 21<br />
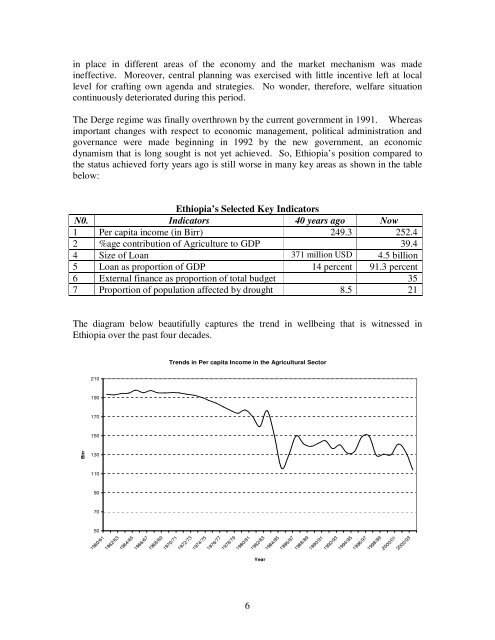
The diagram below beautifully captures <strong>the</strong> trend <strong>in</strong> wellbe<strong>in</strong>g that is witnessed <strong>in</strong><br />
<strong>Ethiopia</strong> over <strong>the</strong> past four decades.<br />
Birr<br />
210<br />
190<br />
170<br />
150<br />
130<br />
110<br />
90<br />
70<br />
50<br />
1960/61<br />
1962/63<br />
1964/65<br />
1966/67<br />
1968/69<br />
Trends <strong>in</strong> Per capita Income <strong>in</strong> <strong>the</strong> Agricultural Sector<br />
1970/71<br />
1972/73<br />
1974/75<br />
1976/77<br />
1978/79<br />
1980/81<br />
6<br />
1982/83<br />
Year<br />
1984/85<br />
1986/87<br />
1988/89<br />
1990/91<br />
1992/93<br />
1994/95<br />
1996/97<br />
1998/99<br />
2000/01<br />
2002/03