Lecture 4: Principles of Psychometrics: Reliability II - jhsph ocw
Lecture 4: Principles of Psychometrics: Reliability II - jhsph ocw
Lecture 4: Principles of Psychometrics: Reliability II - jhsph ocw
SHOW LESS

Create successful ePaper yourself
Turn your PDF publications into a flip-book with our unique Google optimized e-Paper software.
Solution 4<br />
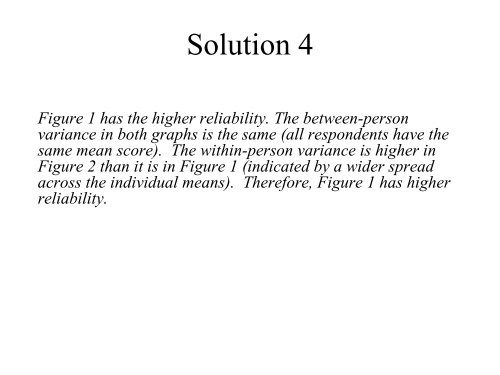
Figure 1 has the higher reliability. The between-person<br />
variance in both graphs is the same (all respondents have the<br />
same mean score). The within-person variance is higher in<br />
Figure 2 than it is in Figure 1 (indicated by a wider spread<br />
across the individual means). Therefore, Figure 1 has higher<br />
reliability.