Spectroscopy of the Gases Interacting with Intense Femtosecond ...
Spectroscopy of the Gases Interacting with Intense Femtosecond ...
Spectroscopy of the Gases Interacting with Intense Femtosecond ...

You also want an ePaper? Increase the reach of your titles
YUMPU automatically turns print PDFs into web optimized ePapers that Google loves.
Laser Physics, Vol. 11, No. 1, 2001, pp. 68–76.<br />
Original Text Copyright © 2001 by Astro, Ltd.<br />
Copyright © 2001 by MAIK “Nauka /Interperiodica” (Russia).<br />
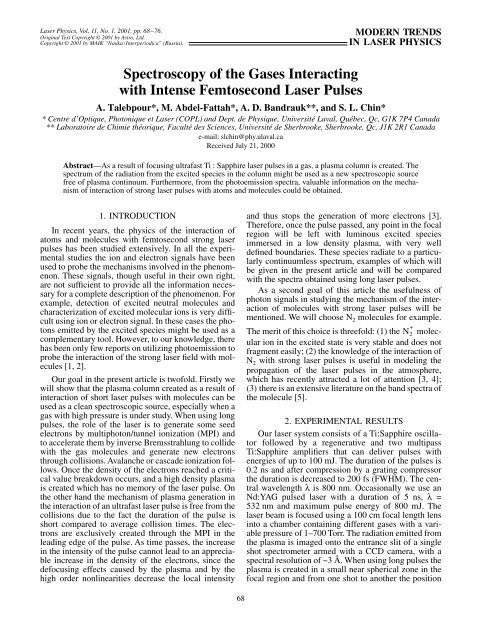
<strong>Spectroscopy</strong> <strong>of</strong> <strong>the</strong> <strong>Gases</strong> <strong>Interacting</strong><br />
<strong>with</strong> <strong>Intense</strong> <strong>Femtosecond</strong> Laser Pulses<br />
1. INTRODUCTION<br />
In recent years, <strong>the</strong> physics <strong>of</strong> <strong>the</strong> interaction <strong>of</strong><br />
atoms and molecules <strong>with</strong> femtosecond strong laser<br />
pulses has been studied extensively. In all <strong>the</strong> experimental<br />
studies <strong>the</strong> ion and electron signals have been<br />
used to probe <strong>the</strong> mechanisms involved in <strong>the</strong> phenomenon.<br />
These signals, though useful in <strong>the</strong>ir own right,<br />
are not sufficient to provide all <strong>the</strong> information necessary<br />
for a complete description <strong>of</strong> <strong>the</strong> phenomenon. For<br />
example, detection <strong>of</strong> excited neutral molecules and<br />
characterization <strong>of</strong> excited molecular ions is very difficult<br />
using ion or electron signal. In <strong>the</strong>se cases <strong>the</strong> photons<br />
emitted by <strong>the</strong> excited species might be used as a<br />
complementary tool. However, to our knowledge, <strong>the</strong>re<br />
has been only few reports on utilizing photoemission to<br />
probe <strong>the</strong> interaction <strong>of</strong> <strong>the</strong> strong laser field <strong>with</strong> molecules<br />
[1, 2].<br />
Our goal in <strong>the</strong> present article is tw<strong>of</strong>old. Firstly we<br />
will show that <strong>the</strong> plasma column created as a result <strong>of</strong><br />
interaction <strong>of</strong> short laser pulses <strong>with</strong> molecules can be<br />
used as a clean spectroscopic source, especially when a<br />
gas <strong>with</strong> high pressure is under study. When using long<br />
pulses, <strong>the</strong> role <strong>of</strong> <strong>the</strong> laser is to generate some seed<br />
electrons by multiphoton/tunnel ionization (MPI) and<br />
to accelerate <strong>the</strong>m by inverse Bremsstrahlung to collide<br />
<strong>with</strong> <strong>the</strong> gas molecules and generate new electrons<br />
through collisions. Avalanche or cascade ionization follows.<br />
Once <strong>the</strong> density <strong>of</strong> <strong>the</strong> electrons reached a critical<br />
value breakdown occurs, and a high density plasma<br />
is created which has no memory <strong>of</strong> <strong>the</strong> laser pulse. On<br />
<strong>the</strong> o<strong>the</strong>r hand <strong>the</strong> mechanism <strong>of</strong> plasma generation in<br />
<strong>the</strong> interaction <strong>of</strong> an ultrafast laser pulse is free from <strong>the</strong><br />
collisions due to <strong>the</strong> fact <strong>the</strong> duration <strong>of</strong> <strong>the</strong> pulse is<br />
short compared to average collision times. The electrons<br />
are exclusively created through <strong>the</strong> MPI in <strong>the</strong><br />
leading edge <strong>of</strong> <strong>the</strong> pulse. As time passes, <strong>the</strong> increase<br />
in <strong>the</strong> intensity <strong>of</strong> <strong>the</strong> pulse cannot lead to an appreciable<br />
increase in <strong>the</strong> density <strong>of</strong> <strong>the</strong> electrons, since <strong>the</strong><br />
defocusing effects caused by <strong>the</strong> plasma and by <strong>the</strong><br />
high order nonlinearities decrease <strong>the</strong> local intensity<br />
68<br />
MODERN TRENDS<br />
IN LASER PHYSICS<br />
A. Talebpour*, M. Abdel-Fattah*, A. D. Bandrauk**, and S. L. Chin*<br />
* Centre d’Optique, Photonique et Laser (COPL) and Dept. de Physique, Université Laval, Québec, Qc, G1K 7P4 Canada<br />
** Laboratoire de Chimie théorique, Faculté des Sciences, Université de Sherbrooke, Sherbrooke, Qc, J1K 2R1 Canada<br />
e-mail: slchin@phy.ulaval.ca<br />
Received July 21, 2000<br />
Abstract—As<br />
a result <strong>of</strong> focusing ultrafast Ti : Sapphire laser pulses in a gas, a plasma column is created. The<br />
spectrum <strong>of</strong> <strong>the</strong> radiation from <strong>the</strong> excited species in <strong>the</strong> column might be used as a new spectroscopic source<br />
free <strong>of</strong> plasma continuum. Fur<strong>the</strong>rmore, from <strong>the</strong> photoemission spectra, valuable information on <strong>the</strong> mechanism<br />
<strong>of</strong> interaction <strong>of</strong> strong laser pulses <strong>with</strong> atoms and molecules could be obtained.<br />
and thus stops <strong>the</strong> generation <strong>of</strong> more electrons [3].<br />
Therefore, once <strong>the</strong> pulse passed, any point in <strong>the</strong> focal<br />
region will be left <strong>with</strong> luminous excited species<br />
immersed in a low density plasma, <strong>with</strong> very well<br />
defined boundaries. These species radiate to a particularly<br />
continuumless spectrum, examples <strong>of</strong> which will<br />
be given in <strong>the</strong> present article and will be compared<br />
<strong>with</strong> <strong>the</strong> spectra obtained using long laser pulses.<br />
As a second goal <strong>of</strong> this article <strong>the</strong> usefulness <strong>of</strong><br />
photon signals in studying <strong>the</strong> mechanism <strong>of</strong> <strong>the</strong> interaction<br />
<strong>of</strong> molecules <strong>with</strong> strong laser pulses will be<br />
mentioned. We will choose N2<br />
molecules for example.<br />
+<br />
The merit <strong>of</strong> this choice is threefold: (1) <strong>the</strong> N2 molecular<br />
ion in <strong>the</strong> excited state is very stable and does not<br />
fragment easily; (2) <strong>the</strong> knowledge <strong>of</strong> <strong>the</strong> interaction <strong>of</strong><br />
N2<br />
<strong>with</strong> strong laser pulses is useful in modeling <strong>the</strong><br />
propagation <strong>of</strong> <strong>the</strong> laser pulses in <strong>the</strong> atmosphere,<br />
which has recently attracted a lot <strong>of</strong> attention [3, 4];<br />
(3) <strong>the</strong>re is an extensive literature on <strong>the</strong> band spectra <strong>of</strong><br />
<strong>the</strong> molecule [5].<br />
2. EXPERIMENTAL RESULTS<br />
Our laser system consists <strong>of</strong> a Ti:Sapphire oscillator<br />
followed by a regenerative and two multipass<br />
Ti:Sapphire amplifiers that can deliver pulses <strong>with</strong><br />
energies <strong>of</strong> up to 100 mJ. The duration <strong>of</strong> <strong>the</strong> pulses is<br />
0.2 ns and after compression by a grating compressor<br />
<strong>the</strong> duration is decreased to 200 fs (FWHM). The central<br />
wavelength λ is 800 nm. Occasionally we use an<br />
Nd:YAG pulsed laser <strong>with</strong> a duration <strong>of</strong> 5 ns,<br />
532 nm and maximum pulse energy <strong>of</strong> 800 mJ. The<br />
laser beam is focused using a 100 cm focal length lens<br />
into a chamber containing different gases <strong>with</strong> a variable<br />
pressure <strong>of</strong> 1–700 Torr. The radiation emitted from<br />
<strong>the</strong> plasma is imaged onto <strong>the</strong> entrance slit <strong>of</strong> a single<br />
shot spectrometer armed <strong>with</strong> a CCD camera, <strong>with</strong> a<br />
spectral resolution <strong>of</strong> ~3 Å. When using long pulses <strong>the</strong><br />
plasma is created in a small near spherical zone in <strong>the</strong><br />
focal region and from one shot to ano<strong>the</strong>r <strong>the</strong> position<br />
λ<br />
=
Signal, arb. units<br />
10<br />
5<br />
0<br />
400 600<br />
Wavelength, nm<br />
<strong>of</strong> breakdown varies along <strong>the</strong> propagation axis. The<br />
emission spectrum <strong>of</strong> this breakdown consists <strong>of</strong> a continuum<br />
modulated by <strong>the</strong> line emissions from atoms<br />
and atomic ions. When using <strong>the</strong> 200 fs laser pulses,<br />
spanning around <strong>the</strong> focal region, a faint filament <strong>with</strong><br />
a length <strong>of</strong> about 10 cm is visually observed. The spatial<br />
shape <strong>of</strong> <strong>the</strong> filament is stable from shot to shot.<br />
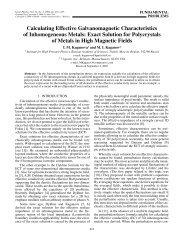
In Fig. 1 we present <strong>the</strong> visible spectrum <strong>of</strong> Xe <strong>with</strong><br />
a pressure <strong>of</strong> 10 Torr interacting <strong>with</strong> Ng:YAG laser<br />
pulses <strong>with</strong> a duration <strong>of</strong> 5 ns (dotted line) and compare<br />
it <strong>with</strong> <strong>the</strong> case <strong>of</strong> 200 fs Ti:Sapphire laser pulses (solid<br />
line). As it is observed <strong>the</strong>re are two distinct differences<br />
between <strong>the</strong> two cases. The first difference is <strong>the</strong><br />
smaller contribution <strong>of</strong> <strong>the</strong> continuum in <strong>the</strong> case <strong>of</strong><br />
short laser pulses. In fact, we have noticed that <strong>the</strong> contribution<br />
<strong>of</strong> <strong>the</strong> continuum from all o<strong>the</strong>r target gases is<br />
very small as it will be seen later. This indicates <strong>the</strong><br />
negligible role <strong>of</strong> plasma recombination in <strong>the</strong> process<br />
<strong>of</strong> <strong>the</strong> photoemission from <strong>the</strong> plasma column (filament)<br />
generated using short laser pulses. The second difference<br />
is <strong>the</strong> amount <strong>of</strong> broadening in <strong>the</strong> spectral lines.<br />
To show this point, in Fig. 2 we present a limited portion<br />
<strong>of</strong> Fig. 1 in <strong>the</strong> wavelength interval <strong>of</strong> 535–548 nm.<br />
While <strong>the</strong> line broadening in <strong>the</strong> case <strong>of</strong> long pulses is<br />
very strong, <strong>the</strong> line widths in <strong>the</strong> case <strong>of</strong> short pulses,<br />
are limited by <strong>the</strong> resolution <strong>of</strong> <strong>the</strong> spectrometer.<br />
The experimental results on Xe showed <strong>the</strong> merits<br />
<strong>of</strong> using short pulses as being <strong>the</strong> reduction in continuum<br />
radiation and reduced line broadening. We verified<br />
LASER PHYSICS<br />
Vol. 11<br />
SPECTROSCOPY OF THE GASES INTERACTING 69<br />
No. 1<br />
Short pulse<br />
Long pulse<br />
Fig. 1. Spectrum <strong>of</strong> Xe at a pressure <strong>of</strong> 10 Torr using long<br />
pulses (5 ns, Nd:YAG laser) <strong>with</strong> an energy <strong>of</strong> 100 mJ/pulse<br />
and short pulse (200 fs, Ti:Sapphire laser) <strong>with</strong> an energy <strong>of</strong><br />
40 mJ/pulse.<br />
2001<br />
Signal, arb. units<br />
5<br />
0<br />
– 7s2P<br />
D0<br />
: 6p2<br />
Xe+<br />
– 6p4P0<br />
: 5s4P<br />
Xe+<br />
[1 ]<br />
1<br />
2<br />
– 6f<br />
0<br />
'[ ]<br />
1<br />
2<br />
: 6s<br />
Xe+<br />
– 6p4D0<br />
: 5s4P<br />
Xe+<br />
Short pulse<br />
Long pulse<br />
– 6p2S0<br />
: 5s2P<br />
Xe+<br />
– 6p2D0<br />
2P<br />
: 6d<br />
Xe+<br />
540 545<br />
Wavelength, nm<br />
– 6p4D0<br />
4D<br />
: 6d<br />
Xe+<br />
– 5p4D0<br />
: 6d4D<br />
Xe+<br />
Fig. 2.<br />
A narrow portion <strong>of</strong> Fig. 1, which presents <strong>the</strong> strong<br />
line broadening in <strong>the</strong> case <strong>of</strong> long pulses. The identification<br />
<strong>of</strong> <strong>the</strong> lines is from [6].<br />
this observation by repeating <strong>the</strong> experiment on different<br />
gases. As an example in <strong>the</strong> case <strong>of</strong> molecules, in<br />
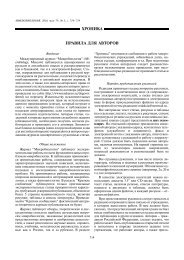
Figs. 3 and 4 we present <strong>the</strong> spectrum <strong>of</strong> air in atmospheric<br />
pressure in <strong>the</strong> visible region using long<br />
(200 ps) and short (200 fs) Ti:Sapphire laser pulses,<br />
respectively. As it is observed, in <strong>the</strong> case <strong>of</strong> long laser<br />
pulses <strong>the</strong> emission spectrum <strong>of</strong> this breakdown consists<br />
<strong>of</strong> two parts; a continuum corresponding to a temperature<br />
<strong>of</strong> about 40000 K modulated by <strong>the</strong> line emissions<br />
from atoms and atomic ions. When short pulses<br />
are used <strong>the</strong>re is no detectable continuum radiation in<br />
<strong>the</strong> spectrum, indicating <strong>the</strong> negligible role <strong>of</strong> plasma<br />
recombination in <strong>the</strong> process <strong>of</strong> <strong>the</strong> photoemission<br />
from <strong>the</strong> filament. This spectrum is assigned to two<br />
band systems; <strong>the</strong> second positive band system <strong>of</strong> N2<br />
( C3Πu–<br />
B3Πg<br />
transition) and <strong>the</strong> first negative band sys-<br />
+ 2 + 2 +<br />
tem <strong>of</strong> N2 ( B Σu<br />
– X Σg<br />
transition) [5]. We have indicated<br />
<strong>the</strong> lines <strong>of</strong> <strong>the</strong> second positive band and <strong>the</strong> first<br />
negative band <strong>with</strong> 2 and 1, respectively. We will discuss<br />
<strong>the</strong> origin <strong>of</strong> this spectrum later in this article. As a<br />
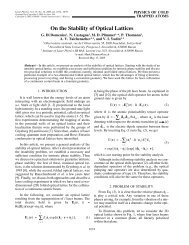
final example in Fig. 5 we present <strong>the</strong> spectrum <strong>of</strong> ethylene<br />
at atmospheric pressure interacting <strong>with</strong> Ti:Sapphire<br />
laser pulses. Again <strong>the</strong> contribution <strong>of</strong> <strong>the</strong> continuum is<br />
negligibly small and due to <strong>the</strong> negligible line broadening<br />
rotational structures <strong>of</strong> <strong>the</strong> bands are very well<br />
resolved.
70<br />
Signal, arb. units<br />
60<br />
30<br />
0<br />
2 : (0–0)<br />
2 : (1–2)<br />
2 : (0–1)<br />
Signal, arb. units<br />
60<br />
40<br />
20<br />
0<br />
N I, II (343.72)<br />
2 : (2–4)<br />
2 : (1–3)<br />
2 : (0–2)<br />
1 : (0–0)<br />
2 : (2–5)<br />
2 : (1–4)<br />
2 : (0–3)<br />
350 400<br />
TALEBPOUR<br />
O II (374.95)<br />
N II (383.51, 385.61)<br />
N II (399.50)<br />
N II (404.13)<br />
O II (407.59)<br />
O II (409.72)<br />
O II (418.98)<br />
N II (423.69, 423.71)<br />
O II (434.56, 434.74, 434.94)<br />
1 : (2–3)<br />
1 : (1–2)<br />
1 : (0–1)<br />
2 : (0–4)<br />
350 400<br />
Wavelength, nm<br />
450<br />
et al.<br />
N II (444.70)<br />
N II (450.76)<br />
N II (460.72)<br />
N II (463.05)<br />
N II (480.33)<br />
N II (499.44, 500.11, 500.15, 500.27, 500.52, 500.73)<br />
450 500<br />
Wavelength, nm<br />
Fig. 3. The emission spectra <strong>of</strong> air in atmospheric pressure interacting <strong>with</strong> a Ti:Sapphire laser pulse <strong>of</strong> duration <strong>of</strong> 0.2 ns. The identification<br />
<strong>of</strong> <strong>the</strong> lines is from [6].<br />
Fig. 4. The emission spectra <strong>of</strong> air in atmospheric pressure<br />
interacting <strong>with</strong> a Ti:Sapphire laser pulse <strong>of</strong> duration <strong>of</strong><br />
200 fs. The lines marked by 1 are assigned to <strong>the</strong> first nega-<br />
+ 2 + 2 +<br />
tive band system <strong>of</strong> N2 ( B Σu<br />
– X Σg<br />
transition) and those<br />
marked by 2 are assigned to <strong>the</strong> second positive band system<br />
<strong>of</strong> N2<br />
( C3Πu–<br />
B3Πg<br />
transition) respectively. In <strong>the</strong> transitions<br />
( v – v'),<br />
v and v'<br />
denote <strong>the</strong> vibrational levels <strong>of</strong> upper<br />
and lower electronic states, respectively.<br />
3. DISCUSSION<br />
3.1. Negligible Contribution <strong>of</strong> Continuum Radiation<br />
As it was mentioned in <strong>the</strong> introduction, <strong>the</strong> main<br />
reason behind <strong>the</strong> superiority <strong>of</strong> <strong>the</strong> spectra in <strong>the</strong> case<br />
<strong>of</strong> short laser pulses is due to low plasma density. To<br />
verify this statement we measure <strong>the</strong> upper limit <strong>of</strong><br />
plasma density created in D2<br />
interacting <strong>with</strong> 200 fs<br />
Ti:Sapphire laser pulses. The merits <strong>of</strong> this choice are<br />
<strong>the</strong> following. Firstly, during <strong>the</strong> interaction <strong>of</strong> D<br />
LASER PHYSICS<br />
Vol. 11<br />
No. 1<br />
2<br />
2001<br />
<strong>with</strong><br />
<strong>the</strong> laser <strong>the</strong>re is a channel which dissociates <strong>the</strong> molecule<br />
into excited atomic ion, D* [2]. The excited ion<br />
fluoresces and <strong>the</strong> bandwidth <strong>of</strong> <strong>the</strong> fluorescence can be<br />
used to characterize <strong>the</strong> plasma density. Secondly, since<br />
<strong>the</strong> Stark broadening in hydrogen depends linearly on<br />
<strong>the</strong> external electric field, <strong>the</strong> fluorescence lines <strong>of</strong><br />
H (D) have <strong>the</strong> largest broadening. This allows <strong>the</strong><br />
measurement <strong>of</strong> small plasma densities [7].<br />
First we try to calculate <strong>the</strong> probability <strong>of</strong> MPI (here<br />
tunnel ionization is included in <strong>the</strong> definition <strong>of</strong> MPI)<br />
<strong>of</strong> D2<br />
as a function <strong>of</strong> pulse energy under <strong>the</strong> condition<br />
<strong>of</strong> low pressure. In this case, <strong>the</strong> effects <strong>of</strong> self focusing<br />
by <strong>the</strong> neutrals and defocusing due to <strong>the</strong> plasma is negligible<br />
and <strong>the</strong>refore <strong>the</strong> intensity <strong>of</strong> <strong>the</strong> laser can be<br />
calculated easily. For our experiments we use 200 fs<br />
Ti:Sapphire laser pulses. The linearly polarized laser<br />
was focused using a lens <strong>with</strong> f/100<br />
optics (1 m focal<br />
N II (517.34, 517.59, 517.94, 517.95)
Intensity, arb. units<br />
40<br />
20<br />
0<br />
400 410 420 430 440 450<br />
C2 swan band system<br />
10<br />
(4–3) 468.5<br />
(3–2) 469.7<br />
(2–1) 471.5<br />
(1–0) 473.7<br />
length lens and beam diameter <strong>of</strong> 1 cm) into an ultrahigh<br />
vacuum chamber having a background pressure <strong>of</strong><br />
2 × 10⁻⁹<br />
Torr. Ion curves were produced by combining<br />
a series <strong>of</strong> intensity scans, each having a different fill<br />
pressure in <strong>the</strong> interaction chamber. The gas pressure in<br />
<strong>the</strong> interaction chamber was controlled by a precision<br />
leak valve and ranged from 10–8<br />
to 10–4<br />
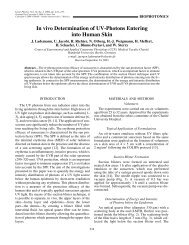
Torr. In Fig. 6<br />
<strong>the</strong> ion versus pulse energy (upper scale) is presented.<br />
In this figure, <strong>the</strong> horizontal axis (bottom) is in terms <strong>of</strong><br />
<strong>the</strong> peak intensity <strong>of</strong> <strong>the</strong> laser. The method for determining<br />
peak laser intensity is given elsewhere [8].<br />
We note that <strong>the</strong> ion signal, Ni,<br />
is related to <strong>the</strong> probability<br />
<strong>of</strong> MPI, , through <strong>the</strong> following relation:<br />
P<br />
i<br />
N i<br />
LASER PHYSICS<br />
=<br />
∫<br />
V<br />
Vol. 11<br />
Pi( r)<br />
dV<br />
SPECTROSCOPY OF THE GASES INTERACTING 71<br />
CH 4300 system<br />
431.42 (0–0)<br />
0<br />
450 460 470 480 490 500 510 520 530<br />
C2 swan band system<br />
10<br />
(4–5) 547.0<br />
(3–4) 550.2<br />
(2–3) 554.1<br />
(1–2) 558.6<br />
(0–1) 563.6<br />
No. 1<br />
, (1)<br />
where V is that part <strong>of</strong> <strong>the</strong> interaction volume from<br />
where <strong>the</strong> ions are collected. To find Pi<br />
one should solve<br />
this integral equation. However, this is impossible due<br />
to <strong>the</strong> fact that in <strong>the</strong> experiment we measure only <strong>the</strong><br />
relative value <strong>of</strong> <strong>the</strong> ions. Thus, we chose ano<strong>the</strong>r<br />
approach, i.e., we calculate from <strong>the</strong> <strong>the</strong>ory in such a<br />
P<br />
i<br />
432.4 (2–2)<br />
(0–0) 516.5<br />
(1–1) 512.9<br />
2001<br />
C 2 swan band system<br />
0<br />
530 540 550 560 570 580 590 600<br />
Wavelength, nm<br />
Fig. 5. The emission spectra <strong>of</strong> ethylene in atmospheric<br />
pressure interacting <strong>with</strong> a Ti:Sapphire laser pulse <strong>of</strong> duration<br />
<strong>of</strong> 200 fs.<br />
Ion signal, arb. units<br />
10 1<br />
10 –2<br />
10 –5<br />
10 –8<br />
+<br />
D2 D +<br />
Pulse energy, mJ<br />
5 10 50<br />
+<br />
D2 cal.<br />
10 14 10 15<br />
Intensity, W/cm 2<br />
way that when it is substituted in Eq. (1), <strong>the</strong> <strong>the</strong>oretically<br />
calculated curve fit <strong>the</strong> experimentally measured<br />
one. Previously [9], we have shown that <strong>the</strong> rate <strong>of</strong> MPI<br />
<strong>of</strong> D 2, W, is very well predicted by <strong>the</strong> PPT model [10]<br />
by assuming that <strong>the</strong> electron tunnels through a barrier<br />
given by Z eff/r – Fr instead <strong>of</strong> <strong>the</strong> pure Coulomb barrier<br />
1/r – Fr which is used in <strong>the</strong> calculation <strong>of</strong> <strong>the</strong> MPI <strong>of</strong><br />
atoms. Here, Z eff (=0.72 for D 2 molecule) is a fitting<br />
parameter to simulate <strong>the</strong> effective Coulomb potential<br />
felt by <strong>the</strong> electron that tunnels out and F is <strong>the</strong> electric<br />
field <strong>of</strong> <strong>the</strong> laser. According to this model W is given by<br />
<strong>the</strong> following formula (in atomic units):<br />
W Cn*l* E 6<br />
--<br />
π<br />
22E ( nv ) 3/2<br />
=<br />
⎛------------------------ ⎞<br />
⎝ F ⎠<br />
× 1 γ 2<br />
( + ) 3/4<br />
A( ωγ , )e<br />
2n* 3/2 –<br />
22E ( ) 3/2<br />
– ⎛--------------------g ( γ ) ⎞<br />
⎝ 2F ⎠<br />
(2)<br />
where E is <strong>the</strong> ionization potential <strong>of</strong> <strong>the</strong> molecule, ω is<br />
<strong>the</strong> frequency <strong>of</strong> <strong>the</strong> laser and<br />
2<br />
n* = 2E/Zeff Pulse energy, mJ<br />
10 20<br />
,<br />
10 –3<br />
Fig. 6. The ion yield versus peak laser intensity (and pulse<br />
energy) curves <strong>of</strong> and D + +<br />
D2 created as a result <strong>of</strong> interaction<br />
<strong>of</strong> D2 <strong>with</strong> a linearly polarized laser pulse. The <strong>the</strong>oret-<br />
+<br />
ical ion signal versus peak laser intensity curve <strong>of</strong> D2 , calculated<br />
from <strong>the</strong> PPT model (see text), has excellent fit <strong>with</strong><br />
<strong>the</strong> experimental curve. Also <strong>the</strong> probability <strong>of</strong> MPI as a<br />
function <strong>of</strong> peak laser intensity (pulse energy) is shown.<br />
Probability <strong>of</strong> MPI<br />
. (3)
72<br />
Signal, arb. units<br />
10<br />
5<br />
D β<br />
O<strong>the</strong>r quantities are given in [11]. The probability <strong>of</strong><br />
<strong>the</strong> MPI is given by<br />
⎛ ⎛ ⎞⎞<br />
Pi = ⎜1– exp⎜–<br />
∫ dtW⎟⎟<br />
. (4)<br />
⎝ ⎝ ⎠⎠<br />
– ∞<br />
Using this equation we calculated Pi as a function <strong>of</strong><br />
laser intensity and pulse energy and presented it in <strong>the</strong><br />
inset <strong>of</strong> Fig. 6. To see <strong>the</strong> accuracy <strong>of</strong> our semi-empirical<br />
model, we substituted <strong>the</strong> calculated value <strong>of</strong> Pi in<br />
Eq. (1) and presented <strong>the</strong> resulted ion curve in <strong>the</strong><br />
Fig. 6 (solid curve). As it is observed <strong>the</strong>re is a good<br />
overlap between <strong>the</strong>ory and experiment (note that at<br />
intensities above 2 × 10¹⁴ W/cm2 , corresponding to<br />
+<br />
13.35 mJ, <strong>the</strong> dissociation reduces <strong>the</strong> number <strong>of</strong><br />
ions to two D + ions). Thus we might have confidence on<br />
<strong>the</strong> <strong>the</strong>oretically calculated value <strong>of</strong> <strong>the</strong> probability <strong>of</strong><br />
ionization plotted in <strong>the</strong> inset <strong>of</strong> Fig. 6. From this curve<br />
it is observed that under <strong>the</strong> condition <strong>of</strong> low pressure,<br />
any pulse <strong>with</strong> energy above 13.35 mJ will ionize all<br />
molecules. In what follows we will show that this is not<br />
<strong>the</strong> case for high-pressure gas.<br />
In Fig. 7, we present <strong>the</strong> spectrum <strong>of</strong> D 2 at a pressure<br />
<strong>of</strong> 400 Torr. Similar to <strong>the</strong> case <strong>of</strong> air, <strong>the</strong>re is no detectable<br />
continuum radiation in <strong>the</strong> spectrum. There are<br />
two line emission from D atoms, D α and D β. The mechanism<br />
<strong>of</strong> creating excited atoms which radiate <strong>the</strong>se<br />
lines is described in [2]. The importance <strong>of</strong> atomic<br />
emission to characterize <strong>the</strong> plasma created in <strong>the</strong> interaction<br />
region, is well known. Due to <strong>the</strong> linear Stark<br />
effect which occurs in <strong>the</strong> excited atoms in <strong>the</strong> presence<br />
<strong>of</strong> plasma, <strong>the</strong>re will be a line broadening. In <strong>the</strong> case<br />
<strong>of</strong> D β line this broadening is calculated and its relation<br />
+∞<br />
D α<br />
0<br />
450 480 640 650 660 670 680<br />
Wavelength, nm<br />
Fig. 7. The emission spectra <strong>of</strong> D 2 , <strong>with</strong> a pressure <strong>of</strong><br />
400 Torr, interacting <strong>with</strong> a 200 fs Ti:Sapphire laser pulse<br />
<strong>with</strong> an energy <strong>of</strong> 40 mJ.<br />
TALEBPOUR et al.<br />
D 2<br />
Signal, normalized<br />
5<br />
0<br />
Expt.<br />
1 × 10 14<br />
1 × 10 15<br />
1 × 10 16<br />
484 488<br />
Wavelength, nm<br />
Fig. 8. Comparison <strong>of</strong> <strong>the</strong> pr<strong>of</strong>ile <strong>of</strong> <strong>the</strong> D β line <strong>with</strong> <strong>the</strong>oretically<br />
calculated pr<strong>of</strong>iles at different plasma densities.<br />
The densities are in <strong>the</strong> unit <strong>of</strong> cm –3 .<br />
to <strong>the</strong> plasma density is found [7]. In Fig. 8 we have<br />
presented <strong>the</strong> experimental pr<strong>of</strong>ile <strong>of</strong> <strong>the</strong> D β line (open<br />
circles) along <strong>with</strong> <strong>the</strong> <strong>the</strong>oretically calculated line pr<strong>of</strong>iles<br />
at different plasma densities and at a temperature<br />
<strong>of</strong> 10 4 K. This temperature has been chosen because at<br />
low intensities <strong>of</strong> <strong>the</strong> order <strong>of</strong> 10 13 W/cm 2 (<strong>the</strong> intensities<br />
that <strong>the</strong> pulses are focused in <strong>the</strong> high pressure gas)<br />
<strong>the</strong> MPI process corresponds to <strong>the</strong> absorption <strong>of</strong> <strong>the</strong><br />
threshold number <strong>of</strong> photons, just sufficient to overcome<br />
<strong>the</strong> ionization potential. In this case <strong>the</strong> kinetic<br />
energies <strong>of</strong> <strong>the</strong> ionized electrons cannot exceed <strong>the</strong><br />
energy <strong>of</strong> a single photon, which corresponds to a temperature<br />
<strong>of</strong> ~2 × 10 4 K.<br />
As it is observed from Fig. 8, at <strong>the</strong> value <strong>of</strong> plasma<br />
density around 10 14 cm –3 <strong>the</strong>ory and experiment fit each<br />
o<strong>the</strong>r very well. This means that <strong>the</strong> probability <strong>of</strong> MPI<br />
does not reach above 10 –5 (10 14 /10 19 ). From Fig. 6<br />
(inset), this probability <strong>of</strong> MPI corresponds to a laser<br />
intensity <strong>of</strong> 5 × 10 13 W/cm 2 instead <strong>of</strong> 10 15 W/cm 2<br />
which was expected in <strong>the</strong> vacuum. Thus, in a highpressure<br />
gas <strong>the</strong> laser is not able to focus to its geometrical<br />
focal size, and <strong>the</strong> peak intensity <strong>of</strong> <strong>the</strong> pulse<br />
remains so low that <strong>the</strong> density <strong>of</strong> electrons never<br />
reaches <strong>the</strong> critical density necessary for <strong>the</strong> occurrence<br />
<strong>of</strong> breakdown. This explains why in <strong>the</strong> spectrum <strong>of</strong><br />
gases radiated from a filament <strong>the</strong> level <strong>of</strong> continuum<br />
radiation and <strong>the</strong> line broadening are so low.<br />
3.2. The Mechanism <strong>of</strong> Excitation in N2 <strong>Interacting</strong><br />
<strong>with</strong> Ti:Sapphire Laser Pulses<br />
Until here we explained <strong>the</strong> superiority <strong>of</strong> <strong>the</strong><br />
plasma column generated as a result <strong>of</strong> interaction <strong>of</strong><br />
short laser pulses in a high pressure gas. In this section<br />
LASER PHYSICS Vol. 11 No. 1 2001
Signal, arb. units<br />
100<br />
50<br />
20<br />
10<br />
we explain <strong>the</strong> mechanism <strong>of</strong> <strong>the</strong> excitation in <strong>the</strong> case<br />
<strong>of</strong> N2. This mechanism, in our opinion, might explain<br />
<strong>the</strong> excitation <strong>of</strong> species in <strong>the</strong> case <strong>of</strong> o<strong>the</strong>r gases.<br />
In Fig. 9 we present <strong>the</strong> resulting calibrated spectrum<br />
for <strong>the</strong> case when <strong>the</strong> pressure in <strong>the</strong> tube is<br />
50 Torr. As we mentioned earlier, <strong>the</strong> observed violet<br />
degraded lines are assigned to two systems; <strong>the</strong> second<br />
LASER PHYSICS Vol. 11 No. 1 2001<br />
0<br />
2 : (2–5)<br />
SPECTROSCOPY OF THE GASES INTERACTING 73<br />
2 : (0–0)<br />
2 : (1–4)<br />
2 : (0–3)<br />
1 : (5–4)<br />
2 : (1–2)<br />
0<br />
330 340 350 360 370 380 390<br />
1 : (0–1)<br />
1 : (5–6)<br />
1 : (4–5)<br />
1 : (3–4)<br />
1 : (2–3)<br />
1 : (1–2)<br />
1 : (2–1)<br />
1 : (3–2)<br />
2 : (0–1)<br />
1 : (1–0)<br />
1 : (6–8)<br />
1 : (5–7)<br />
400 410 420 430 440 450 460 470<br />
Wavelength, nm<br />
2 : (2–4)<br />
1 : (2–4)<br />
1 : (0–0)<br />
Fig. 9. Spectrum <strong>of</strong> N2 at a pressure <strong>of</strong> 50 Torr interacting <strong>with</strong> linearly polarized Ti:Sapphire laser pulses at an intensity <strong>of</strong><br />
3 × 10¹⁴ W/cm2 .<br />
2 : (1–3)<br />
2 : (0–2)<br />
1 : (1–1)<br />
1 : (1–3)<br />
1 : (0–2)<br />
positive system <strong>of</strong> N2 (C3Πu–B3Πg transition) and <strong>the</strong><br />
+ 2 + 2 +<br />
first negative system <strong>of</strong> N2 (B Σu<br />
–X Σg<br />
transition)<br />
which are labeled in Fig. 9 as 2 and 1, respectively. In<br />
<strong>the</strong> course <strong>of</strong> this article, it will be made clear that <strong>the</strong><br />
first negative system is related to inner valence electron<br />
ionization. The origin <strong>of</strong> <strong>the</strong> second positive band system<br />
will only be discussed briefly.
74<br />
Signal, arb. units<br />
100<br />
50<br />
0<br />
+<br />
391.4 nm (N2) 337.5 nm (N2) 200 400 600<br />
Pressure, Torr<br />
Fig. 10. The pressure dependence <strong>of</strong> <strong>the</strong> strength <strong>of</strong> <strong>the</strong> two<br />
lines 337.13 nm (from <strong>the</strong> second positive band system <strong>of</strong><br />
N2 ) and 391.4 nm (from <strong>the</strong> first negative band system <strong>of</strong><br />
) for <strong>the</strong> case <strong>of</strong> linear polarization at an intensity <strong>of</strong> 3 ×<br />
1014 W/cm 2 +<br />
N2 .<br />
To probe <strong>the</strong> excitation mechanism governing <strong>the</strong>se<br />
two bands, we have studied <strong>the</strong> pressure dependence <strong>of</strong><br />
391.4 nm band head from <strong>the</strong> first negative system and<br />
<strong>the</strong> 337.13 nm band head from <strong>the</strong> second positive band<br />
system. From <strong>the</strong> results shown in Fig. 10 it can be<br />
observed that 391.4 nm band head is independent <strong>of</strong><br />
pressure which could be due to <strong>the</strong> following reasons.<br />
If <strong>the</strong> excitation mechanism directly results from <strong>the</strong><br />
interaction <strong>of</strong> N2 molecules <strong>with</strong> <strong>the</strong> laser pulse, by<br />
increasing <strong>the</strong> pressure <strong>the</strong> number <strong>of</strong> molecular ions in<br />
<strong>the</strong> excited state should increase nearly linearly <strong>with</strong><br />
pressure. At <strong>the</strong> same time due to collisional deactivation<br />
some <strong>of</strong> <strong>the</strong> population is transferred from <strong>the</strong><br />
vibrational levels <strong>of</strong> <strong>the</strong> B electronic state to <strong>the</strong><br />
vibrational levels <strong>of</strong> <strong>the</strong> A2Πu electronic state. This process<br />
reduces <strong>the</strong> number <strong>of</strong> <strong>the</strong> excited molecular ions,<br />
which emit to <strong>the</strong> first negative band. Since <strong>the</strong> deactivation<br />
process depends linearly on pressure [12], <strong>the</strong><br />
number <strong>of</strong> excited ions capable <strong>of</strong> emitting decreases as<br />
<strong>the</strong> inverse <strong>of</strong> pressure. Consequently <strong>the</strong> strength <strong>of</strong><br />
<strong>the</strong> band heads <strong>of</strong> <strong>the</strong> first negative band should not<br />
depend on pressure. In contrast to this, it can be<br />
observed from Fig. 10 that <strong>the</strong> strength <strong>of</strong> 337.13 nm<br />
band head increases linearly <strong>with</strong> pressure. Extending<br />
similar arguments to <strong>the</strong> case <strong>of</strong> <strong>the</strong> bands <strong>of</strong> <strong>the</strong> second<br />
positive system, <strong>the</strong> number <strong>of</strong> excited molecules in <strong>the</strong><br />
C3Πu electronic state must depend on <strong>the</strong> square <strong>of</strong><br />
pressure. This could imply that <strong>the</strong> mechanism <strong>of</strong> populating<br />
<strong>the</strong> vibrational levels <strong>of</strong> <strong>the</strong> upper electronic<br />
state (C3 2 +<br />
Σu<br />
Πu) might be resulting from a combination <strong>of</strong><br />
TALEBPOUR et al.<br />
two pressure dependent processes, one being collision<br />
and <strong>the</strong> o<strong>the</strong>r being laser excitation whose product also<br />
depends linearly on pressure. However, our experimental<br />
results cannot determine <strong>the</strong> dynamics <strong>of</strong> <strong>the</strong> laser<br />
excitation mechanism.<br />
To obtain fur<strong>the</strong>r information on <strong>the</strong> mechanism <strong>of</strong><br />
<strong>the</strong> photoemission in <strong>the</strong> first negative band, we measured<br />
<strong>the</strong> laser intensity dependence <strong>of</strong> <strong>the</strong> strength <strong>of</strong><br />
<strong>the</strong> 391.4 nm band head using linearly and circularly<br />
polarized laser pulses <strong>with</strong> <strong>the</strong> pressure set at 1 Torr<br />
(Fig. 11). The 391.4 nm band head was chosen because<br />
<strong>of</strong> its higher strength compared to <strong>the</strong> o<strong>the</strong>r band heads.<br />
The resulting curves are compared <strong>with</strong> <strong>the</strong> ion yield<br />
versus laser intensity curves <strong>of</strong> obtained from an<br />
independent experiment in a vacuum chamber and were<br />
presented in Fig. 3. For comparison <strong>of</strong> <strong>the</strong> measured<br />
curves <strong>of</strong> <strong>the</strong> ion yield and <strong>the</strong> strength <strong>of</strong> 391.4 nm<br />
band head, we use <strong>the</strong> saturation points <strong>of</strong> <strong>the</strong> curves<br />
indicated by an arrow in Fig. 11. The strength <strong>of</strong> <strong>the</strong><br />
band head was shifted vertically in order to bring <strong>the</strong><br />
two curves to <strong>the</strong> same level in <strong>the</strong>ir respective saturation<br />
intensities. There is no horizontal shift. The overlap<br />
<strong>of</strong> <strong>the</strong> two curves for both polarizations indicates a<br />
close relation between <strong>the</strong> MPI <strong>of</strong> <strong>the</strong> neutral molecule<br />
and <strong>the</strong> excitation <strong>of</strong> <strong>the</strong> ion to B electronic<br />
state. The two possible reasons that could explain <strong>the</strong>se<br />
observations, are considered below.<br />
As a first possibility, <strong>the</strong> ionized electron can rescatter<br />
to its parent ion [13] and through an inelastic<br />
collision excite <strong>the</strong> ion to <strong>the</strong> vibrational levels <strong>of</strong><br />
higher electronic states. At <strong>the</strong> intensities employed in<br />
our experiment, 3 × 10¹⁴ W/cm2 +<br />
N2 +<br />
2 +<br />
N2 Σu<br />
, <strong>the</strong> ponderomotive<br />
energy, Up, amounts to 18 eV and many <strong>of</strong> <strong>the</strong> re-scattered<br />
electrons have energy <strong>of</strong> 3.2Up = 58 eV. These<br />
+<br />
electrons can excite <strong>the</strong> N2 ions to <strong>the</strong> v = 0 and v = 1<br />
vibrational levels (<strong>the</strong>se are <strong>the</strong> only vibrational levels<br />
which have significant Franck–Condon factors for coupling<br />
<strong>with</strong> <strong>the</strong> v = 0 level <strong>of</strong> <strong>the</strong> ground electronic state<br />
2 +<br />
[5]) <strong>of</strong> <strong>the</strong> B Σu<br />
electronic state. However, this possibility<br />
can be ruled out by comparing <strong>the</strong> laser polarization<br />
dependence <strong>of</strong> <strong>the</strong> strength <strong>of</strong> those band heads <strong>of</strong><br />
+<br />
<strong>the</strong> first negative system <strong>of</strong> N2 originating from <strong>the</strong><br />
2 +<br />
v = 0 and v = 1 vibrational levels <strong>of</strong> <strong>the</strong> B Σu<br />
electronic<br />
state. The strength <strong>of</strong> <strong>the</strong>se band heads has<br />
dropped only by a factor <strong>of</strong> ~5 after changing <strong>the</strong> polarization<br />
from linear to circular as shown in Fig. 11. This<br />
can be attributed to <strong>the</strong> decrease in <strong>the</strong> probability <strong>of</strong><br />
MPI as a result <strong>of</strong> changing <strong>the</strong> polarization <strong>of</strong> <strong>the</strong> laser<br />
from linear to circular. The classical picture <strong>of</strong> electron<br />
re-scattering model predicts that <strong>the</strong> probability <strong>of</strong><br />
exciting <strong>the</strong> molecular ion in <strong>the</strong> case <strong>of</strong> circular polarization<br />
decreases to zero which has not been observed<br />
in our experimental results which are shown in Fig. 11.<br />
LASER PHYSICS Vol. 11 No. 1 2001
The o<strong>the</strong>r possibility is populating <strong>the</strong> B state<br />
through <strong>the</strong> MPI <strong>of</strong> inner valence electrons which has<br />
been used <strong>with</strong> great success for <strong>the</strong> explanation <strong>of</strong><br />
<strong>the</strong> observed photoelectron spectra <strong>of</strong> N2 molecule<br />
interacting <strong>with</strong> 308 and 616 nm laser pulses [1].<br />
The electronic configuration <strong>of</strong> N2 molecule is<br />
KK(σg2s) 2 (σu2s) 2 (πu2p) 4 (σg2p) 2 Σu<br />
. If instead <strong>of</strong> <strong>the</strong> two<br />
electrons <strong>of</strong> <strong>the</strong> outermost orbital (σg2p), any <strong>of</strong> <strong>the</strong><br />
electrons <strong>of</strong> <strong>the</strong> inner orbitals (πu2p) or (σu2s) is ionized<br />
through MPI, <strong>the</strong> resulting molecular ion will be produced<br />
in a vibrational level <strong>of</strong> <strong>the</strong> excited electronic<br />
2 + 2 +<br />
states A Πu<br />
or B Σu<br />
, respectively. The number <strong>of</strong> <strong>the</strong><br />
2 + 2 +<br />
ions in <strong>the</strong> excited states A Πu<br />
or B Σu<br />
will be nearly<br />
proportional to <strong>the</strong> total number <strong>of</strong> ions. Therefore <strong>the</strong><br />
strength <strong>of</strong> <strong>the</strong> band heads <strong>of</strong> <strong>the</strong> first negative band system<br />
will have a similar intensity dependence as <strong>the</strong><br />
number <strong>of</strong> ions. This conclusion is in agreement <strong>with</strong><br />
<strong>the</strong> observation in Fig. 11. In particular by changing <strong>the</strong><br />
polarization <strong>of</strong> <strong>the</strong> laser <strong>the</strong> number <strong>of</strong> ions and <strong>the</strong><br />
strength <strong>of</strong> <strong>the</strong> band head decrease at <strong>the</strong> same rate.<br />
Thus, this model is able to explain <strong>the</strong> origin <strong>of</strong> excita-<br />
2 +<br />
tion to <strong>the</strong> v = 0 and v = 1 levels <strong>of</strong> <strong>the</strong> B Σu<br />
electronic<br />
state which results in emission to two <strong>of</strong> <strong>the</strong> strongest<br />
band heads <strong>of</strong> <strong>the</strong> first negative system at 391.44 nm<br />
[(0–0) transition] and 427.81 nm [(0–1) transition].<br />
However, this model cannot explain <strong>the</strong> appreciable<br />
2 +<br />
emission from those vibrational levels <strong>of</strong> B Σu<br />
electronic<br />
states <strong>with</strong> v ≥ 2, since <strong>the</strong> MPI <strong>of</strong> <strong>the</strong> electrons<br />
<strong>of</strong> <strong>the</strong> σu2s orbital cannot populate <strong>the</strong>se higher vibrational<br />
levels due to <strong>the</strong> small Franck–Condon factors<br />
[5]. To account for <strong>the</strong> population <strong>of</strong> those levels <strong>of</strong><br />
2 +<br />
B Σu<br />
<strong>with</strong> v ≥ 2 we might consider <strong>the</strong> mechanism <strong>of</strong><br />
up-pumping <strong>of</strong> population from those levels <strong>of</strong> <strong>the</strong><br />
2 + 2 +<br />
X Σg<br />
and A Πu<br />
electronic states which are appreciably<br />
populated during <strong>the</strong> MPI <strong>of</strong> N2. The up-pumping is<br />
accomplished ei<strong>the</strong>r by three photon coupling from <strong>the</strong><br />
2 +<br />
v = 0 level <strong>of</strong> X Σg<br />
electronic state (similar to <strong>the</strong> three<br />
+<br />
photon coupling as in <strong>the</strong> case <strong>of</strong> H2 discussed in<br />
[14, 15]) or by a two photon coupling from <strong>the</strong> v = 0<br />
2 +<br />
and v = 1 levels <strong>of</strong> A Πu<br />
. In <strong>the</strong> former case, since a<br />
three photon transition is in quasi resonance <strong>with</strong> <strong>the</strong><br />
2 +<br />
v = 5 level <strong>of</strong> <strong>the</strong> B Σu<br />
state, most probably this level<br />
will be populated. In <strong>the</strong> latter case, a two photon reso-<br />
2 +<br />
nance will populate <strong>the</strong> levels v = 3 and v = 4 <strong>of</strong> B Σu<br />
state. To test <strong>the</strong> validity <strong>of</strong> this mechanism <strong>the</strong> dependence<br />
<strong>of</strong> <strong>the</strong> strength <strong>of</strong> <strong>the</strong> band heads on <strong>the</strong> polarization<br />
<strong>of</strong> <strong>the</strong> laser might be used. Since by <strong>the</strong> selection<br />
rules <strong>the</strong> foretold three photon and <strong>the</strong> two photon couplings<br />
are forbidden, using circular polarization it is<br />
expected that in this case <strong>the</strong> strength <strong>of</strong> band heads<br />
LASER PHYSICS Vol. 11 No. 1 2001<br />
SPECTROSCOPY OF THE GASES INTERACTING 75<br />
2 +<br />
Signal, arb. units<br />
10<br />
1<br />
0.1<br />
0.01<br />
Signal, arb. units<br />
6<br />
3<br />
0<br />
10<br />
5<br />
2p 2 3 P-4s 3 P 0<br />
15'th<br />
Saturation point<br />
10 14<br />
Intensity, W/cm 2<br />
2p 2 1 D-3d 1 D 0<br />
13'th<br />
Ion lin.<br />
Photon lin.<br />
Ion cir.<br />
Photon cir.<br />
Fig. 11. Comparison <strong>of</strong> <strong>the</strong> intensity dependence <strong>of</strong> <strong>the</strong><br />
strength <strong>of</strong> <strong>the</strong> 391.4 nm band head (open square for linear<br />
polarization and open circles for circular polarization) and<br />
+<br />
<strong>the</strong> number <strong>of</strong> N2 ions created by pulses <strong>with</strong> different<br />
polarization <strong>of</strong> laser. The saturation point for <strong>the</strong> linear<br />
polarization is indicated by arrow. The photon signals (<strong>the</strong><br />
strength <strong>of</strong> <strong>the</strong> band head) for both polarizations have been<br />
shifted vertically to bring <strong>the</strong> level <strong>of</strong> this signal to <strong>the</strong> same<br />
level <strong>of</strong> <strong>the</strong>ir respective ion signals at <strong>the</strong> saturation point.<br />
2p 2 3 P-3s 3 P 0<br />
50 60 70<br />
11'th<br />
2p 2 1 D-3s 3 P 0<br />
2p 2 1 D-2p 31 D 0<br />
2p 3 3 D 0 -3s 3 P 0<br />
9'th<br />
0<br />
70 80 90<br />
Wavelength, nm<br />
2p 2 3 P-2p 3 3 P 0<br />
Fig. 12. The UV spectrum <strong>of</strong> N 2 gas jet interacting <strong>with</strong> a<br />
linearly polarized Ti:Sapphire laser pulse at an intensity <strong>of</strong><br />
3 × 10 14 W/cm 2 . Apart from high order harmonics <strong>the</strong>re are<br />
two peaks resulting from <strong>the</strong> photoemission <strong>of</strong> N + . The<br />
assignment <strong>of</strong> <strong>the</strong> lines are from [6]. Note that each peak<br />
usually contains few lines which due to <strong>the</strong> low spectral resolution<br />
<strong>of</strong> our system have not been resolved.
76<br />
2 +<br />
originating from those levels <strong>of</strong> B <strong>with</strong> v ≥ 2 must<br />
drop to zero. Indeed, we observed that <strong>the</strong> signal<br />
decreases to zero when circular polarization was used,<br />
in agreement <strong>with</strong> <strong>the</strong> prediction <strong>of</strong> <strong>the</strong> model.<br />
The foregoing arguments strongly suggest <strong>the</strong><br />
occurrence <strong>of</strong> MPI <strong>of</strong> <strong>the</strong> inner valence electrons in N2. To reinforce this suggestion, we did a fur<strong>the</strong>r experiment.<br />
The laser was focused into a pulsed N2 gas jet at<br />
a position <strong>of</strong> about 10 μm under <strong>the</strong> jet nozzle where<br />
<strong>the</strong> pressure <strong>of</strong> <strong>the</strong> gas jet is about 40 Torr. The working<br />
pressure <strong>of</strong> <strong>the</strong> vacuum chamber is 5 × 10 –7 Torr. The<br />
radiation in <strong>the</strong> forward direction is separated by a concave<br />
grating which images <strong>the</strong> lines onto a microchannel<br />
plate <strong>with</strong> a phosphored fiber optic anode. The<br />
image on <strong>the</strong> anode is recorded by a CCD camera and<br />
thus <strong>the</strong> spectrum is obtained [2]. A sample spectrum in<br />
<strong>the</strong> wavelength region 49 < λ < 93 nm is presented in<br />
Fig. 12. Apart from high order harmonics <strong>the</strong>re are<br />
seven peaks in <strong>the</strong> spectrum which are radiated by <strong>the</strong><br />
N + ions created as a result <strong>of</strong> <strong>the</strong> interaction <strong>of</strong> <strong>the</strong> laser<br />
pulse <strong>with</strong> N2 molecule. The transitions responsible for<br />
<strong>the</strong>se peaks are identified in Fig. 12. Similar photoemission<br />
has been observed previously in experiments<br />
involving <strong>the</strong> interaction <strong>of</strong> N2 molecule <strong>with</strong> synchrotron<br />
radiation [16] and electrons [17]. There, it has been<br />
argued that <strong>the</strong> creation <strong>of</strong> <strong>the</strong> excited atomic ions is<br />
due to <strong>the</strong> removal <strong>of</strong> an inner shell σg2s electron which<br />
results in a molecule in G repulsive electronic<br />
state which dissociates to N + ions in 3P0 Σu<br />
+<br />
2 +<br />
N2 Σg<br />
state. Later<br />
experimental and <strong>the</strong>oretical results (see [18] and references<br />
<strong>the</strong>rein) verified this statement. The similarity <strong>of</strong><br />
our observation <strong>with</strong> this well established finding suggests<br />
that in <strong>the</strong> interaction <strong>of</strong> N2 molecule <strong>with</strong> Ti:Sapphire<br />
laser <strong>the</strong> inner shell electrons undergo MPI.<br />
4. CONCLUSION<br />
In conclusion by comparing <strong>the</strong> spectra radiated by<br />
self-luminous plasmas created by a laser pulse interacting<br />
<strong>with</strong> a gas target we have shown that <strong>the</strong> spectrum<br />
resulting from <strong>the</strong> interaction <strong>of</strong> ultrashort pulses is far<br />
superior in terms <strong>of</strong> low level <strong>of</strong> continuum and also<br />
smaller line broadening. This was attributed to <strong>the</strong><br />
lower density <strong>of</strong> <strong>the</strong> plasma in <strong>the</strong> case <strong>of</strong> short laser<br />
pulses due to <strong>the</strong> defocusing effects which limits <strong>the</strong><br />
intensity <strong>of</strong> <strong>the</strong> pulse in <strong>the</strong> interaction region and thus<br />
prevents fur<strong>the</strong>r multiphoton/tunnel ionization <strong>of</strong> <strong>the</strong><br />
gas. We verified our statement by measuring <strong>the</strong> upper<br />
limit <strong>of</strong> <strong>the</strong> plasma density in D2. Also <strong>the</strong> mechanism<br />
<strong>of</strong> excitation was determined in <strong>the</strong> case <strong>of</strong> N2 molecule.<br />
Our observations indicate that <strong>the</strong> first two vibrational<br />
levels <strong>of</strong> <strong>the</strong> B state are populated as a result<br />
<strong>of</strong> <strong>the</strong> MPI <strong>of</strong> <strong>the</strong> inner valence electrons (σu2s orbital).<br />
In <strong>the</strong> UV region <strong>the</strong> photoemission from N + 2 +<br />
Σu<br />
ion was<br />
observed. The creation <strong>of</strong> this ion in <strong>the</strong> excited state<br />
was attributed to <strong>the</strong> MPI <strong>of</strong> <strong>the</strong> inner shell electron<br />
TALEBPOUR et al.<br />
σ g2s. The phenomenon <strong>of</strong> <strong>the</strong> MPI <strong>of</strong> electrons from<br />
<strong>the</strong> inner orbitals has been confirmed from <strong>the</strong>se observations.<br />
ACKNOWLEDGMENTS<br />
It is our pleasure to acknowledge <strong>the</strong> technical assistance<br />
<strong>of</strong> S. Lagace and M. Lambert and fruitful discussions<br />
<strong>with</strong> C.M. Bowden and N. Akozbek. This work<br />
was supported in part by NSERC, le Fonds FCAR, US<br />
Army Research Office and <strong>the</strong> Department <strong>of</strong> National<br />
Defense <strong>of</strong> Canada.<br />
REFERENCES<br />
1. Gibson, G. et al., 1989, Phys. Rev. A, 40, 2378.<br />
2. Liang, Y. et al., 1995, J. Phys. B, 28, 3661.<br />
3. Akozbec, N., Bowden, C.M., Talebpour, A., and<br />
Chin, S.L., 2000, Phys. Rev. E, 61, 4540.<br />
4. Brodeur, A. et al., 1997, Opt. Lett., 22, 304; Mlejnek, M.,<br />
Wright, E.M., and Moloney, J.V., 1998, Opt. Lett., 23,<br />
182.<br />
5. L<strong>of</strong>thus, A. and Krupenie, P.H., 1977, J. Phys. Chem.<br />
Ref. Data, 6, 113.<br />
6. Striganov, A.R. and Sventitski, N.S., 1968, Tables <strong>of</strong><br />
Spectral Lines <strong>of</strong> Neutral and Ionized Atoms (New York:<br />
IFI).<br />
7. Griem, H.R., 1964, Plasma <strong>Spectroscopy</strong> (New York:<br />
McGraw-Hill).<br />
8. Talebpour, A., Petit, S., and Chin, S.L., 1999, Opt. Commun.,<br />
171, 285.<br />
9. Talebpour, A., Larochelle, S., and Chin, S.L., 1998,<br />
J. Phys. B, 31, L49.<br />
10. Perelomov, A.M., Popov, V.S., and Terent’ev, M.V.,<br />
1966, Sov. Phys. JETP, 23, 924.<br />
11. Talebpour, A., Yang, J., and Chin, S.L., 1999, Opt. Commun.,<br />
163, 29. There are some printing errors in this<br />
paper. In Eq. (2), Z should be read Zeff, Eq. (3) should be<br />
ω 2Ei γ = ----------------<br />
, and in Eq. (8), Wn should be wn. The × sign<br />
F<br />
should not be <strong>the</strong>re.<br />
12. Comes, F.J. and Speier, F., 1971, Z. Naturforsch., 26a,<br />
1998.<br />
13. Corkum, P.B., 1993, Phys. Rev. Lett., 71, 1994.<br />
14. Bandrauk, A.D., 1994, Molecules in Laser Fields (New<br />
York: Marcel Dekker).<br />
15. Chelkowski, S., Foisy, C., and Bandrauk, A.D., 1998,<br />
Phys. Rev. A, 57, 1176.<br />
16. Lee, L.C. et al., 1974, J. Phys. Chem., 61, 3266.<br />
17. Aarts, J.F.M. and De Heer, F.J., 1971, Physica, 52, 45.<br />
18. Baltzer, P. et al., 1992, Phys. Rev. A, 46, 5545.<br />
LASER PHYSICS Vol. 11 No. 1 2001