SIMULATION OF BLOWING SNOW IN THE CANADIAN ARCTIC ...
SIMULATION OF BLOWING SNOW IN THE CANADIAN ARCTIC ...
SIMULATION OF BLOWING SNOW IN THE CANADIAN ARCTIC ...

You also want an ePaper? Increase the reach of your titles
YUMPU automatically turns print PDFs into web optimized ePapers that Google loves.
<strong>SIMULATION</strong> <strong>OF</strong> <strong>BLOW<strong>IN</strong>G</strong> <strong>SNOW</strong> <strong>IN</strong> <strong>THE</strong> <strong>CANADIAN</strong> <strong>ARCTIC</strong><br />
US<strong>IN</strong>G A DOUBLE-MOMENT MODEL<br />
STEPHEN J. DÉRY ⋆ and M. K. YAU<br />
Department of Atmospheric and Oceanic Sciences, McGill University, 805 Sherbrooke St. W.,<br />
Montréal, Québec, H3A 2K6 Canada<br />
(Received in final form 7 July 2000)<br />
Abstract. We describe in this paper the development of a double-moment model of blowing snow<br />
and its application to the Canadian Arctic. We first outline the formulation of the numerical model,<br />
which solves a prognostic equation for both the blowing snow mixing ratio and total particle numbers,<br />
both moments of particles that are gamma-distributed. Under idealized simulations, the model<br />
yields realistic evolutions of the blowing snow particle distributions, transport and sublimation rates<br />
as well as the thermodynamic fields at low computational costs. A parametrization of the blowing<br />
snow sublimation rate is subsequently derived. The model and parametrization are then applied to<br />
a Canadian Arctic tundra site prone to frequent blowing snow events. Over a period of 210 days<br />
during the winter of 1996/1997, the near-surface relative humidity consistently approaches saturation<br />
with respect to ice. These conditions limit snowpack erosion by blowing snow sublimation to ≈3<br />
mm snow water equivalent (swe) with surface sublimation removing an additional 7 mm swe. We<br />
find that our results are highly sensitive to the proper assimilation of the humidity measurements<br />
and the evolving thermodynamic fields in the atmospheric boundary layer during blowing snow.<br />
These factors may explain the lower values of blowing snow sublimation reported in this paper than<br />
previously published for the region.<br />
Keywords: Arctic, Blizzard, Blowing snow, Double-moment, Mackenzie Basin, Sublimation.<br />
1. Introduction<br />
In the Canadian Arctic, land and ice surfaces are predominantly covered by snow.<br />
Open and windswept areas thus become subject to frequent and hazardous blowing<br />
snow and blizzard events (Stewart et al., 1995; Déry and Yau, 1999a). As a<br />
consequence of these adverse meteorological conditions, the surface mass balance<br />
of the Canadian Arctic may be altered significantly by wind redistribution and<br />
concurrent sublimation.<br />
The hydrometeorological implications of blowing snow have motivated a number<br />
of recent studies on the topic (e.g., King et al., 1996; Pomeroy et al., 1997;<br />
Bintanja, 1998; Essery et al., 1999; Mann et al., 2000). Nevertheless, questions<br />
remain on the importance of blowing snow sublimation in the surface water budget.<br />
For instance, Pomeroy et al. (1997) and Essery et al. (1999) estimate the seasonal<br />
⋆ Present address: Lamont-Doherty Earth Observatory, Columbia University, 206 Oceanography,<br />
Route 9W, Palisades, NY 10964-8000, U.S.A.<br />
Boundary-Layer Meteorology 99: 297–316, 2001.<br />
© 2001 Kluwer Academic Publishers. Printed in the Netherlands.
298 STEPHEN J. DÉRY AND M. K. YAU<br />
removal of 37 to 85 mm snow water equivalent (swe) through blowing snow sublimation<br />
at a Canadian Arctic tundra site. In contrast, King et al. (1996) evaluate the<br />
erosion of no more than 4 mm swe over a period of six months from a snow-covered<br />
Antarctic ice shelf. The reported variations on the significance of blowing snow<br />
sublimation in the surface mass balance are, in large part, a consequence of the<br />
numerical modelling strategies employed by the respective authors. Specifically,<br />
assumptions on the background thermodynamic profiles and their temporal and<br />
spatial evolutions are critical in evaluating the rates of snowdrift sublimation.<br />
Déry and Yau (1999a) suggested that coupled simulations of a mesoscale model,<br />
such as the mesoscale compressible community (MC2) model (Benoit et al., 1997)<br />
and a blowing snow model, such as PIEKTUK (Déry et al., 1998) would improve<br />
our understanding of the snowdrift phenomenon and its interaction with the atmospheric<br />
boundary layer (ABL). However, to suit the requirements of the MC2<br />
model, Déry and Yau (1999b, hereafter DY99b) derived a bulk formulation of the<br />
PIEKTUK model (PIEKTUK-B) that increased its computational efficiency by a<br />
factor of 100, allowing for coupled simulations of the two models at reasonable<br />
numerical costs.<br />
In a recent intercomparison project of four blowing snow models (Xiao et al.,<br />
2000), it was found that PIEKTUK-B performed relatively well in predicting the<br />
blowing snow transport and sublimation rates and impact to the thermodynamic<br />
profiles. However, its predictions of the numbers and size distribution of particles<br />
appeared less realistic. This deficiency is understandable because the primary purpose<br />
of PIEKTUK-B was to predict accurately the transport and sublimation rates,<br />
and not the particle size spectra, of blowing snow. Since certain properties of blowing<br />
snow, such as its radar reflectivity and its impact on the horizontal visibility,<br />
are dependent on the numbers and size distribution of suspended ice particles,<br />
it is highly desirable to simulate realistically the total numbers of blowing snow<br />
particles, in addition to its transport and sublimation fluxes. The first goal of this<br />
paper, therefore, is to remove this deficiency of PIEKTUK-B while maintaining the<br />
numerical efficiency of the model.<br />
Although our ultimate objective for the development of a computationally inexpensive<br />
model of blowing snow is to perform coupled simulations with the MC2<br />
model, we take advantage here of its efficiency by applying it to a lengthy and continuous<br />
meteorological dataset. These data were collected at an Arctic tundra site<br />
situated near the Mackenzie River Basin (MRB) in Northern Canada over a period<br />
of 210 days during the winter of 1996/1997 as part of the Mackenzie GEWEX<br />
Study (MAGS; Stewart et al., 1998). This intensive field programme aims to shed<br />
light on the water and energy budgets of the MRB, including the largely unknown<br />
role of blowing snow as a component of the surface mass balance (Lawford, 1994;<br />
Stewart et al., 1998). Although previous studies by Pomeroy et al. (1997) and<br />
Essery et al. (1999) have begun this process, their high values of blowing snow<br />
sublimation remain questionable. Therefore, our second objective is to assess the<br />
seasonal contribution of blowing snow to the Arctic tundra water budget using
<strong>SIMULATION</strong> <strong>OF</strong> <strong>BLOW<strong>IN</strong>G</strong> <strong>SNOW</strong> 299<br />
an updated numerical model with evolving thermodynamic fields. We will then<br />
consider some possible factors that lead to the high values of sublimation reported<br />
by Essery et al. (1999) obtained from a steady-state numerical model applied to the<br />
same dataset.<br />
A third and final goal of this work is the parametrization of blowing snow<br />
sublimation in terms of the ambient meteorological conditions. Even a simplified<br />
model of blowing snow can become computationally restrictive for long-term,<br />
basin-scale mass balance studies. The paper therefore introduces one such parametrization<br />
obtained from multiple integrations of the simplified blowing snow<br />
model and verified with the Canadian Arctic data.<br />
The paper is structured as follows. In Section 2, we first describe the formulation<br />
and perform tests of the updated PIEKTUK model before the derivation of a parametrization<br />
of blowing snow sublimation rates. The model and parametrization are<br />
then applied to the Canadian Arctic to evaluate the possible role of blowing snow<br />
in the local surface mass balance. Section 4 contains a discussion of our results<br />
followed by a summary and some conclusions, which close the paper in Section 5.<br />
2. Numerical Model<br />
The algorithm discussed in this section is an extension of the original spectral and<br />
bulk formulations of the PIEKTUK model, which are already well documented<br />
in the literature (Déry and Taylor, 1996; Déry et al., 1998; DY99b). The spectral<br />
model (PIEKTUK-S) is referred to as such due to its explicit treatment of blowing<br />
snow particles using 64 or more size classes. On the other hand, the latter model<br />
expressed blowing snow in terms of a single (and hence ‘bulk’) quantity, thereby<br />
reducing significantly the computational requirements of the model. To maintain<br />
brevity, we now describe steps leading only from the single-moment, bulk blowing<br />
snow scheme to one where two moments of the size distribution of the particles<br />
are solved and encourage the reader to the aforementioned references for a more<br />
complete description of PIEKTUK. We then perform a few tests to evaluate the<br />
updated model in comparison to its spectral formulation.<br />
2.1. MODEL FORMULATION<br />
2.1.1. Bulk Model (PIEKTUK-B)<br />
The single-moment formulation of PIEKTUK was developed by DY99b based on<br />
the premise that the evolution of the suspension and sublimation of blowing snow<br />
can be obtained through the solution of one prognostic equation for the mixing<br />
ratio of blowing snow qb (kg kg −1 ) instead of the spectral number density F(r)
300 STEPHEN J. DÉRY AND M. K. YAU<br />
(m −4 ) of spherical particles of radius r (m). By definition, the two quantities are<br />
related through:<br />
qb = 4πρice<br />
3ρ<br />
∞<br />
0<br />
r 3 F(r)dr, (1)<br />
where ρ (kg m −3 )andρice (= 900 kg m −3 ) denote the densities of air and ice,<br />
respectively.<br />
Based on the field measurements of Budd (1966) and Schmidt (1982), DY99b<br />
assumed that the particle spectrum can be described by a two-parameter gamma<br />
distribution of the form<br />
F(r) = Nrα−1 exp −r/β<br />
β α Ɣ(α)<br />
, (2)<br />
with N (m −3 ) representing the total number concentration of particles and α (dimensionless)<br />
and β (m) the shape and scale parameters of the gamma distribution<br />
Ɣ.<br />
Substituting Equation (2) into (1), integrating and solving for β, we obtain<br />
<br />
3ρqbƔ(α)<br />
β =<br />
4πρiceƔ(α + 3)N<br />
1/3<br />
. (3)<br />
Equation (3) states that α, β, N and qb are all interrelated. To obtain the complete<br />
spectrum, we need to have knowledge of only three of the variables.<br />
For the bulk model, DY99b specify α and N, but predict the evolution of qb,the<br />
air temperature Ta (K), and the water vapour mixing ratio qv (kg kg −1 )inacolumn<br />
of air from<br />
and<br />
∂qb<br />
∂t<br />
∂Ta<br />
∂t<br />
∂qv<br />
∂t<br />
= ∂<br />
∂z<br />
<br />
Kb<br />
∂qb<br />
∂z<br />
+ vbqb<br />
<br />
+ Sb , (4a)<br />
<br />
∂ ∂Ta<br />
= Kh +<br />
∂z ∂z<br />
SbLs<br />
, (4b)<br />
cp<br />
<br />
∂<br />
= Kv<br />
∂z<br />
<br />
∂qv<br />
− Sb , (4c)<br />
∂z<br />
where t (s) denotes time, z (m) the vertical coordinate, Ls (J kg −1 ) the latent heat<br />
of sublimation, and cp (J kg −1 K −1 ) the heat capacity for air. The terms Kb, Kh and<br />
Kv (m 2 s −1 ) represent the turbulent eddy diffusivities for blowing snow, heat and<br />
moisture, respectively. Note that each equation has a source/sink term associated<br />
with the bulk sublimation rate Sb (kg kg −1 s −1 ) of blowing snow. Unlike the heat
<strong>SIMULATION</strong> <strong>OF</strong> <strong>BLOW<strong>IN</strong>G</strong> <strong>SNOW</strong> 301<br />
and moisture variables, blowing snow is subject to sedimentation with a settling<br />
velocity denoted by vb (m s −1 ).<br />
They further set α = constant = 2 and N = kNs(z) = 3Ns(z), whereNs(z)<br />
(m −3 ) is a steady-state solution for the total particle number concentration in a<br />
saturated environment. DY99b showed that this bulk formulation predicts well the<br />
sublimation and transport rates of blowing snow. However, N is only a function of<br />
height and is physically less realistic because it does not evolve in time.<br />
2.1.2. Double-Moment Model (PIEKTUK-D)<br />
To relax the assumption on N, we introduce an explicit equation for this quantity.<br />
Just as with the other three prognostic variables, N is taken to satisfy<br />
∂N<br />
∂t<br />
= ∂<br />
∂z<br />
<br />
KN<br />
∂N<br />
∂z<br />
+ vNN<br />
<br />
+ SN . (4d)<br />
Here, KN (m 2 s −1 ) denotes the eddy diffusivity for N, vN (m s −1 ) a representative<br />
terminal velocity for the total number of blowing snow particles, and SN (m −3<br />
s −1 ) denotes the rate of change of particle numbers due to the sublimation process.<br />
Note that other processes such as fractionation or coalescence of particles are included<br />
implicitly in Equation (4d) through the assumed form of the particle size<br />
distribution.<br />
Equations (4a) - (4d) describe the double-moment model, so-called because<br />
the model predicts both the zeroth moment (N) and the third moment (qb) of<br />
the size distribution function F(r). As seen in the recent literature, doublemoment<br />
schemes have been successfully applied to the modelling of microphysical<br />
processes (e.g., Harrington et al., 1995; Reisner et al., 1998).<br />
Similarly to the other turbulent diffusion coefficients, we take KN to be<br />
KN = ζKm = ζu∗l, (5)<br />
where u∗ (m s −1 ) is the friction velocity, Km (m 2 s −1 ) the turbulent diffusion coefficient<br />
for momentum, and l (m) the mixing length defined as in DY99b. Note that<br />
the quantity ζ (≡ KN/Km), is taken as unity. Our methodology for the specification<br />
of vN follows that of DY99b for vb, with the exception that vN is weighted by the<br />
second moment n of the gamma distribution. We set n = 2 in their Equation (13)<br />
for the setting of vN. This value is found experimentally to give the best comparisons<br />
with analytical solutions for profiles of N when blowing snow sublimation is<br />
inactive.<br />
In Equation (4d), we also need to define the reduction in particle numbers due<br />
to blowing snow sublimation. In principle, computation of the number of particles<br />
that completely sublimate in one timestep can be obtained by the integration of an<br />
incomplete gamma function. Keeping in mind, however, that we are striving for a<br />
numerically efficient blowing snow model, it is in our best interest to avoid this<br />
computationally expensive step. Thus we employ here the method of Harrington et
302 STEPHEN J. DÉRY AND M. K. YAU<br />
a) b)<br />
c) d)<br />
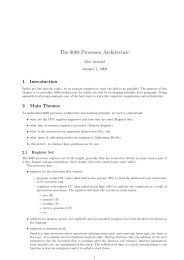
Figure 1. The profiles of (a) blowing snow mixing ratio, (b) total particle number density and (c)<br />
mean particle radius predicted by the double-moment and spectral versions of the PIEKTUK model<br />
10 minutes after blowing snow initiation for the control experiment. The steady-state, analytical<br />
results without sublimation (‘Analysis’) are also shown. In (d), the implicit particle distributions<br />
within the double-moment scheme are compared to the explicit ones of the spectral model. Thick<br />
(thin) lines depict results at z =0.1m(z =2.5m).<br />
al. (1995) who express SN in terms of the mass lost to sublimation. The assumption<br />
here is that SN is proportional to a change in blowing snow mass, i.e.,<br />
SNt<br />
N = Sb t<br />
, (6)<br />
qb<br />
where t (s) denotes a model timestep. Model results are found to be quite sensitive<br />
to this assumption, but it is shown in the following section that this methodology<br />
yields realistic evolutions of N.<br />
Boundary conditions on N are imposed as follows. At the model lid (zub =1<br />
km), we assume no vertical gradient in particle numbers. During blowing snow, we<br />
take the lower boundary (at zlb = 0.1 m) on N to be invariable and given by<br />
N =<br />
3ρqbα3Ɣ(α) 4πρicer3 , (7)<br />
mƔ(α + 3)<br />
where rm = αβ (m) is the mean radius of a spectrum of particles that are gammadistributed.<br />
This constraint is obtained by solving for N in Equation (3) and then<br />
substituting β = rm/α. In Equation (7), values of rm and qb at zlb are obtained
<strong>SIMULATION</strong> <strong>OF</strong> <strong>BLOW<strong>IN</strong>G</strong> <strong>SNOW</strong> 303<br />
a) b)<br />
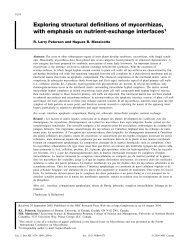
Figure 2. The profiles of (a) ambient air temperature and relative humidity with respect to ice and<br />
(b) sensible (Qh) and latent (Qe) heat fluxes predicted by the double-moment (D.M.) and spectral<br />
versions of the PIEKTUK model 10 minutes after blowing snow initiation for the control experiment.<br />
by extrapolation from their respective values in the saltation layer. Through its<br />
dependence on the saltation mixing ratio, therefore, N(zlb) is influenced by various<br />
environmental factors such as wind speed, temperature and aerodynamic roughness<br />
length of the surface. Further details on the designation of these boundary<br />
conditions and values of the physical parameters can be found in DY99b.<br />
2.2. MODEL TEST<strong>IN</strong>G<br />
To verify the ability of PIEKTUK-D to reproduce the results of its antecedent<br />
spectral and bulk versions, we conduct similar numerical experiments to those of<br />
DY99b. For the control experiment, we take as initial conditions an isothermal<br />
ABL at Ta = −10 ◦ C and a relative humidity with respect to ice (RHi) profile<br />
that varies logarithmically with height from z = 100 m where RHi =0.70tozlb<br />
where saturation with respect to ice is assumed. The wind speed profile also varies<br />
logarithmically with the 10-m wind speed U10 =15ms −1 .Wealsotakeα =2<br />
at all heights and extrapolate a value for rm at zlb by taking rm = 100 µm atthe<br />
saltation layer height zs (see DY99b for further details). Our use of t = 5 s yields<br />
an integration that is about 100 times faster than PIEKTUK-S.<br />
Figure 1 shows the profiles of blowing snow mixing ratio, total particle number<br />
density, mean particle radius, as well as the distribution of particles at two levels<br />
above the surface, 10 minutes subsequent to the initiation of blowing snow. As<br />
shown in Figures 1a and 1b, agreement is very good between the spectral and<br />
double-moment models in terms of the vertical distribution of qb and N.<br />
The profiles of rm predicted from both versions of PIEKTUK are also quite<br />
similar, with PIEKTUK-D matching more closely the analytical profile (Figure<br />
1c). Values of rm decrease with height as the suspension of heavier, larger particles<br />
becomes more difficult. Despite the constraint imposed on α in PIEKTUK-D, its<br />
implicit particle size distributions resemble closely the explicit ones of PIEKTUK-<br />
S (Figure 1d). The observed differences can be explained in part by the fact that
304 STEPHEN J. DÉRY AND M. K. YAU<br />
a) b)<br />
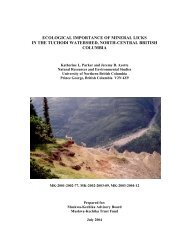
Figure 3. The profiles of (a) the local and (b) cumulative sublimation rates of blowing snow, predicted<br />
by the double-moment and spectral versions of the PIEKTUK model 10 minutes after blowing snow<br />
initiation for the control experiment.<br />
other spectral blowing snow models predict an increase in α with height from<br />
values of 2 near the surface to about 3 at higher elevations (Xiao et al., 2000).<br />
Figure 2 illustrates the thermodynamic and heat flux profiles 10 minutes following<br />
the initiation of blowing snow. Although the changes in qv and (especially)<br />
Ta profiles as a result of the sublimation process are less in PIEKTUK-D than<br />
in PIEKTUK-S, they do have similar shapes. Associated with the sublimation of<br />
blowing snow are perturbations in the sensible Qh (W m −2 ) and latent Qe (W m −2 )<br />
heat fluxes, defined here as<br />
∂Ta<br />
Qh =−ρcpKh , (8a)<br />
∂z<br />
and<br />
∂qv<br />
Qe =−ρLsKv , (8b)<br />
∂z<br />
with positive (negative) heat fluxes directed towards the atmosphere (surface). The<br />
Qh and Qe profiles demonstrate the potentially large impact of blowing snow<br />
sublimation on ABL heat fluxes (Figure 2b). Although the largest temperature<br />
decreases occur near the surface at t = 10 min., the heat fluxes reach a maximum<br />
amplitude (> 50 W m −2 )atz ≈ 50 m. In the low-energy, wintertime environment<br />
of the Arctic, these heat flux perturbations can be quite significant (Déry et al.,<br />
1998).<br />
The next illustration depicts the vertical profiles of the local sublimation rate<br />
qsubl =−ρSb (kg m −3 s −1 ) and its cumulative value when integrated over height<br />
(using the trapezoidal rule), again 10 minutes subsequent to the start of blowing<br />
snow (Figure 3). Similar qsubl profiles are predicted by both models but with the<br />
most notable differences near the lower model boundary. Since this region is relatively<br />
small compared to the overall model domain, it contributes negligibly to<br />
differences in the cumulative sublimation rate (Figure 3b). In addition, Figure 3b
<strong>SIMULATION</strong> <strong>OF</strong> <strong>BLOW<strong>IN</strong>G</strong> <strong>SNOW</strong> 305<br />
a) b)<br />
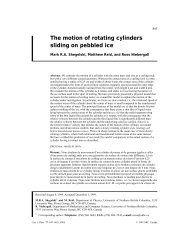
Figure 4. The temporal evolution of the vertically-integrated (a) sublimation rate and (b) transport<br />
rate of blowing snow, predicted by the double-moment and spectral versions of PIEKTUK for the<br />
control experiment.<br />
TABLE I<br />
The blowing snow sublimation (Qs) and transport (Qt ) rates for three values of the 10-m<br />
wind speed (U10) and two time integrations forecast by the spectral (S) and double-moment<br />
(D) versions of PIEKTUK. Time integrated values of sublimation (QTs) and transport (QTt )<br />
of blowing snow are also listed.<br />
U10 Time Model Qs QTs Qt QTt<br />
(m s −1 ) (min.) Version (mm d −1 swe) (mm swe) (kg m −1 s −1 ) (kgm −1 )<br />
10 10 S 0.6847 0.004778 0.1076 64.32<br />
D 0.7155 0.004962 0.1095 65.32<br />
60 S 0.5632 0.02598 0.1086 388.9<br />
D 0.5915 0.02718 0.1113 396.9<br />
15 10 S 2.746 0.02042 0.2059 117.4<br />
D 2.688 0.01971 0.2148 121.9<br />
60 S 1.767 0.09412 0.2374 789.7<br />
D 1.766 0.09286 0.2520 830.5<br />
20 10 S 5.231 0.04168 0.5691 300.0<br />
D 5.145 0.04060 0.6167 326.6<br />
60 S 2.718 0.1654 0.7811 2380.<br />
D 2.648 0.1621 0.8253 2548.<br />
demonstrates that the region between 1 m
306 STEPHEN J. DÉRY AND M. K. YAU<br />
and<br />
Qt = ρ<br />
zub<br />
qbU dz, (9b)<br />
z0<br />
respectively. In these two equations, ρ ′ is a conversion factor from the units of<br />
ms−1 to mm d−1 swe and U (m s−1 ) is the wind speed. We observe in Figure<br />
4 slight underestimates of the transport and sublimation rates by PIEKTUK-D in<br />
comparison to PIEKTUK-S. Additional tests for three wind speeds and two time<br />
periods are conducted and show generally excellent agreement for both quantities<br />
(Table I).<br />
2.3. PARAMETRIZATION <strong>OF</strong> <strong>THE</strong> <strong>BLOW<strong>IN</strong>G</strong> <strong>SNOW</strong> SUBLIMATION RATE<br />
We have shown in the previous section that PIEKTUK-D yields, at a much lesser<br />
computational cost, similar results for the transport and sublimation rates of blowing<br />
snow as its spectral counterpart. We extend these results by conducting multiple<br />
integrations of PIEKTUK-D in order to parametrize the blowing snow sublimation<br />
rate in terms of the meteorological conditions of wind speed, air temperature and<br />
humidity. First, we investigate the possibility of combining the two thermodynamic<br />
quantities into one. Recall from DY99b that the bulk sublimation rate of blowing<br />
snow is given by<br />
Sb = qbNu(qv/qis − 1)<br />
2ρicer2 m (Fk<br />
, (10)<br />
+ Fd)<br />
where Nu depicts the Nusselt number, qis (kg kg −1 ) the saturation mixing ratio<br />
with respect to ice and Fk and Fd (m s kg −1 ) the conductivity and diffusion terms<br />
associated with the sublimation process. By introducing a new variable ξ (m 2 s −1 )<br />
defined as<br />
ξ = (qv/qis − 1)<br />
,<br />
2ρice(Fk + Fd)<br />
we may then express the bulk sublimation rate simply as<br />
(11)<br />
Sb = qbNuξ<br />
r2 .<br />
m<br />
(12)<br />
Hence, the effects of temperature and moisture on Sb are now combined into a<br />
single term ξ that is analogous to the condensation growth parameter discussed by<br />
Rogers and Yau (1989).<br />
Before proceeding, we also introduce a new variable Q ′ s (mm d−1 swe), which<br />
is a normalized column-integrated sublimation rate defined as<br />
Q ′ s<br />
= Qsqb0 /qbsalt , (13)
<strong>SIMULATION</strong> <strong>OF</strong> <strong>BLOW<strong>IN</strong>G</strong> <strong>SNOW</strong> 307<br />
a) b)<br />
Figure 5. The variation of the normalized sublimation rate Q ′ s (a) with ξ for three values of U 10 and<br />
(b) with U10 for two values of ξ. The variables are defined in the text.<br />
where qbsalt (kg kg−1 ) is the saltation mixing ratio and qb0 (kg kg−1 ) its value when<br />
the 10-m threshold wind speed for transport Ut = 6.975 m s −1 . This removes a<br />
dependence of the sublimation rate on qbsalt , which varies with Ut (see DY99b).<br />
Furthermore, we remark that values of RHi and Ta for the computation of ξ are<br />
taken here to be 2 m above the surface. In this case, a logarithmic RHi profile is<br />
assumed below z = 2 m (with RHi =1.0atz = zlb), but RHi is taken as constant<br />
above this height. The distinct relationships for Q ′ s in terms of ξ and U10 shown in<br />
Figure 5 confirm that a parametrization for the sublimation rate of blowing snow<br />
may only involve these two dependent variables.<br />
After multiple integrations, we obtain the results shown in Figure 6. Values of<br />
Q ′ s for half-hour periods, expressed in mm d−1 swe, demonstrate a strong depend-<br />
ence on both U10 and ξ. As the wind speed, temperature and subsaturation increase,<br />
so does the sublimation rate. We can then estimate Q ′ s from an expression such as<br />
Q ′ s = a0 + a1ξ + a2ξ 2 + a3ξ 3 + a4U10<br />
+a5ξU10 + a6ξ 2 U10 + a7U 2 10 + a8ξU 2 10 + a9U 3 10 , (14)<br />
where U10 has units of m s −1 and ξ has units of −1 × 10 −12 m 2 s −1 . Values for<br />
the coefficients a0 - a9 are given in Table II. Note that Equation (14) is innovative<br />
compared to the parametrizations of Bintanja (1998) and Essery et al. (1999) in<br />
that it considers the unsteady effects of both temperature and humidity, in addition<br />
to the wind speed, up to heights of 1 km above the surface, on the process of<br />
blowing snow sublimation. The parametrization is tested with model predictions in<br />
the following section.<br />
3. Application to the Arctic<br />
The windswept tundra regions of the Canadian Arctic are notorious for their adverse<br />
wintertime weather conditions. Given the high frequency of blowing snow
308 STEPHEN J. DÉRY AND M. K. YAU<br />
Figure 6. Contours of Q ′ s (at intervals of 2 mm d−1 swe) in terms of the 10-m wind speed U 10 and<br />
the thermodynamic quantity ξ (as defined in the text).<br />
TABLE II<br />
Coefficients for Equation (14).<br />
Coefficient Value Coefficient Value<br />
a 0 3.78407× 10 −1 a 5 2.48430× 10 −2<br />
a 1 −8.64089× 10 −2 a 6 −9.56871× 10 −4<br />
a 2 −1.60570× 10 −2 a7 1.24600× 10 −2<br />
a3 7.25516× 10 −4 a8 1.56862× 10 −3<br />
a4 −1.25650× 10 −1 a9 −2.93002× 10 −4<br />
and blizzard events in certain sections of the high-latitude MRB, its water and<br />
energy budgets are potentially susceptible to the effects of blowing snow (Déry and<br />
Yau, 1999a). As part of MAGS, special observations were conducted at Trail Valley<br />
Creek (68◦45 ′<br />
N, 133◦30 ′<br />
W), Northwest Territories (NWT), Canada, between 11<br />
September 1996 to 8 April 1997 by researchers from the University of Saskat-
<strong>SIMULATION</strong> <strong>OF</strong> <strong>BLOW<strong>IN</strong>G</strong> <strong>SNOW</strong> 309<br />
chewan and the National Hydrology Research Centre (NHRC; Essery et al., 1999).<br />
Although not within the MRB, the Trail Valley Creek research basin was determined<br />
to be a representative Arctic tundra site with undulating terrain and little<br />
vegetation (Pomeroy et al., 1997). Measurements of air temperature, wind speed<br />
and relative humidity were sampled every 30 seconds and averaged half-hourly.<br />
Details of the meteorological instruments can be found in Essery et al. (1999).<br />
We have shown in the previous section that PIEKTUK-D yields comparable results<br />
to PIEKTUK-S in idealized situations with much lesser computational costs.<br />
We now take advantage of the updated model’s efficiency by applying it to the<br />
meteorological dataset collected at Trail Valley Creek in 1996/1997. This allows us<br />
to make an assessment of the role of blowing snow in the local water budget when<br />
the “self-limiting” aspect of the sublimation process is considered. In addition, it<br />
will allow us to understand several factors that lead to the high sublimation rates<br />
reported by Essery et al. (1999) at the same location and time period.<br />
For these simulations, PIEKTUK-D is initialized with the meteorological data<br />
and the model integrated forward in time for each half-hour period. The initial<br />
temperature is assumed constant within the ABL at the near-surface value but<br />
the initial humidity profile is taken to be logarithmic from the instrument height<br />
to the lower model boundary where saturation with respect to ice is assumed. A<br />
logarithmic wind profile is also inferred from the measured values. A uniform,<br />
snow-covered surface with no protruding vegetation, typical of the Arctic tundra<br />
during winter, is assumed within PIEKTUK-D. Note that the transport and sublimation<br />
rates of blowing snow are computed only when a blowing snow event, as<br />
defined by Déry and Yau (1999a), is detected, but that the sublimation rate is taken<br />
to be zero whenever RHi ≥ 1.0.<br />
Over the course of this 210-day period, blowing snow conditions are inferred<br />
10% of the total measurement time, with wind transport of snow occurring at least<br />
once daily on 71 days. This is consistent with the blowing snow climatology of<br />
Déry and Yau (1999a). Figure 7 shows the temporal evolution of the meteorological<br />
variables during the winter of 1996/1997 at Trail Valley Creek, including<br />
the modelled rates of blowing snow sublimation and transport. We see clearly that<br />
during the cold winter months, air over the snow-covered Arctic tundra remains<br />
near the saturation point with respect to ice despite large wind and temperature<br />
fluctuations. These ambient humidity conditions, which limit apriorithe sublimation<br />
of blowing snow at low levels, are often observed over ice- or snow-covered<br />
surfaces (Vowinckel and Orvig, 1970; Schwertdfeger, 1984; King and Anderson,<br />
1999). Thus blowing snow events characterized by strong winds, and hence, large<br />
transport rates (e.g., 11 March 1997), do not necessarily lead to large sublimation<br />
fluxes. Significant blowing snow sublimation events occur more prominently<br />
during the early or late winter when drier (in a relative sense) and warmer (but<br />
nonetheless subfreezing) conditions exist, such as on 17 November 1996. This is<br />
clearly demonstrated in Table III, which shows that 85% of the erosion of mass<br />
through blowing snow sublimation occurs during the months of November, March
310 STEPHEN J. DÉRY AND M. K. YAU<br />
Figure 7. The temporal evolution of half-hourly averaged values of the ambient air temperature<br />
(Ta), the relative humidity with respect to ice (RHi), the 10-m wind speed (U 10), and the modelled<br />
sublimation (Qs) and transport (Qt ) rates of blowing snow from 11 September 1996 to 8 April 1997<br />
at Trail Valley Creek, Northwest Territories.<br />
and April. For the entire winter of 1996/1997, PIEKTUK-D estimates the sublimation<br />
of about 3 mm swe whereas the wind displaces about 194 Mg m −1 of<br />
snow.<br />
The parametrization of Qs discussed in the previous section yields reasonable<br />
estimates in comparison to the double-moment predictions for the sublimation rate<br />
of blowing snow, with the parametrization giving QTs = 3.2 mm swe (Figure 8).<br />
The correlation coefficient between the two datasets is about R 2 = 0.95, indicating
<strong>SIMULATION</strong> <strong>OF</strong> <strong>BLOW<strong>IN</strong>G</strong> <strong>SNOW</strong> 311<br />
TABLE III<br />
Mean monthly values of observed air temperature (Ta), relative humidity with<br />
respect to ice (RHi), 10-m wind speed (U10), and total monthly values of estimated<br />
blowing snow transport (QTt ), sublimation (QTs) and surface sublimation<br />
rates (QTsurf ) at Trail Valley Valley Creek, Northwest Territories, between 11<br />
September 1996 to 8 April 1997. Note that a negative value of QTsurf indicates<br />
net deposition at the snow surface.<br />
Month Ta RHi U10 QTt QTs QTsurf<br />
( ◦ C) (m s −1 ) (Mg m −1 ) (mm swe) (mm swe)<br />
Sep. −1.1 0.98 2.5 0.632 0.0106 0.718<br />
Oct. −13.0 0.98 2.0 1.98 0.112 1.41<br />
Nov. −18.5 0.98 2.0 14.5 0.820 1.05<br />
Dec. −23.6 1.00 2.1 31.9 0.0896 −0.0731<br />
Jan. −26.8 0.97 3.2 41.4 0.299 0.488<br />
Feb. −24.7 0.99 2.0 1.69 0.00687 0.0560<br />
Mar. −25.1 0.95 5.4 87.9 0.776 0.677<br />
Apr. −18.4 0.79 5.3 21.0 1.27 2.71<br />
Mean −19.8 0.97 2.9<br />
Total 194.0 3.38 7.04<br />
that, as a first approximation, sublimation of blowing snow can be determined from<br />
the parametrized expression.<br />
4. Discussion<br />
In the previous section, we estimated that blowing snow sublimation erodes ≈ 3<br />
mm swe from the snowpack at Trail Valley Creek, NWT during winter. Similar<br />
values of the impact of blowing snow sublimation to the surface mass balance have<br />
been reported by King et al. (1996), Bintanja (1998), and Mann et al. (2000) for<br />
the Antarctic. However, in comparison with Essery et al. (1999), who assess losses<br />
of 44 to 85 mm swe due to blowing snow sublimation at Trail Valley Creek during<br />
the exact same 210-day period, we significantly underestimate its importance.<br />
Considering that an order of magnitude separates our results with those of<br />
Essery et al. (1999), some possible factors accounting for these differences are<br />
now investigated. Following the methodology of Anderson (1994), we find that the<br />
relative humidity measurements presented by Essery et al. (1999) are, in fact, with<br />
respect to water and not with respect to ice. Since the sublimation of blowing snow<br />
is constrained by ice saturation, we apply the parametrization of Essery et al. (1999)<br />
for Qs to the relative humidity measurements at Trail Valley Creek following their
312 STEPHEN J. DÉRY AND M. K. YAU<br />
Figure 8. Comparison of the parametrized and modelled sublimation rates of blowing snow for Trail<br />
Valley Creek, Northwest Territories, during the winter of 1996/1997.<br />
conversion to RHi. We then obtain a range between 11 and 22 mm swe for the total<br />
seasonal blowing snow sublimation, about a quarter of the original values reported<br />
by Essery et al. (1999) for this location.<br />
In addition, we note that the parametrizations of Essery et al. (1999) are based<br />
on the steady-state Prairie Blowing Snow Model (PBSM; Pomeroy et al., 1993).<br />
The PBSM assumes a fully-developed column of sublimating, blowing snow up to<br />
zub and does not take into account self-limitation of the blowing snow sublimation<br />
process (Pomeroy et al., 1993; Déry et al., 1998). In the PBSM, zub is obtained<br />
through an iterative process and varies with both wind speed and fetch x (m) for<br />
blowing snow (Pomeroy et al., 1993; Déry and Taylor, 1996). Incorporating the<br />
PBSM assumptions into PIEKTUK-D and taking x = 1 km as in Essery et al.<br />
(1999), we then compute a seasonal blowing snow sublimation rate of 14.6 mm<br />
swe at Trail Valley Creek in 1996/1997. This is well within the range of values<br />
found above when the snowdrift sublimation rate of Essery et al. (1999) is derived<br />
from the observations of humidity with respect to ice. The increase of 11.2 mm in<br />
the total seasonal sublimation rate when a steady-state environment during blowing<br />
snow is assumed points to the fact that it is a critical assumption in assessing its<br />
role in the surface mass balance.<br />
An additional component in the water budget of snow-covered regions not considered<br />
by Essery et al. (1999) consists of direct sublimation from the snowpack.<br />
Surface sublimation is known to remove locally substantial amounts of mass from
<strong>SIMULATION</strong> <strong>OF</strong> <strong>BLOW<strong>IN</strong>G</strong> <strong>SNOW</strong> 313<br />
the snowpack (e.g., van den Broeke, 1997; Hoode et al., 1999). Following the<br />
method described by van den Broeke (1997), we computed the surface sublimation<br />
rate Qsurf (mm d −1 swe) for the winter of 1996/1997 at Trail Valley Creek from<br />
Qsurf = ρ ′ u∗q∗, (15)<br />
where q∗ (kg kg −1 ) is the humidity scale. Here, saturation with respect to ice at<br />
the snow surface is assumed for the computation of q∗. Surface sublimation is then<br />
estimated to erode an additional 7 mm swe from the snowpack during the winter<br />
of 1996/1997 at Trail Valley Creek, about twice as much as blowing snow sublimation<br />
(see Table III). Depending on the assumptions that govern the operation<br />
of PIEKTUK-D, the combined effects of surface and blowing snow sublimation<br />
deplete between 10 and 22 mm swe from the snowpack, in close agreement with<br />
the results of Essery et al. (1999) for sublimation based on the computations with<br />
RHi.<br />
Finally, we need to mention that the results of Section 3 clearly indicate that,<br />
despite values of RHi ≈ 1 near the snow surface, substantial blowing snow<br />
sublimation may occur aloft in the ABL. Thus the assumption that sublimation<br />
completely shuts off in these conditions is perhaps misleading. However, without<br />
detailed information about the vertical distributions of Ta and qv, itisdifficult<br />
to make conclusions about the total column-integrated sublimation rate in these<br />
circumstances.<br />
5. Summary and Conclusions<br />
An extension to a double-moment scheme of the bulk blowing snow (PIEKTUK-<br />
B) model of DY99b has been proposed. It is shown that predicting explicitly the<br />
profiles of total particle numbers of blowing snow, in addition to the temperature,<br />
water vapour and blowing snow mixing ratio profiles, provides consistent results<br />
with the spectral version of the model (PIEKTUK-S) for the evolution of particle<br />
concentrations and distributions. The double-moment model (PIEKTUK-D) also<br />
yields comparable blowing snow sublimation and transport rates as PIEKTUK-<br />
B at about the same computational cost since longer timesteps are employed in<br />
the integration of PIEKTUK-D. Thus, PIEKTUK-D provides a suitable alternative<br />
to the computationally expensive scheme of PIEKTUK-S without compromising<br />
some of the implicit characteristics of the blowing snow particle distributions as<br />
does PIEKTUK-B.<br />
PIEKTUK-D is then used to derive a parametrization for the sublimation rate of<br />
blowing snow in terms of wind speed and a thermodynamic variable to include the<br />
effects of evolving temperature and humidity profiles on the sublimation process.<br />
The model and parametrization are then applied to experimental data collected<br />
in the Canadian Arctic and reveal that blowing snow sublimation may remove,
314 STEPHEN J. DÉRY AND M. K. YAU<br />
particularly during the early or late stages of the cold season, several millimetres<br />
swe from the surface mass balance. The combined effects of surface and blowing<br />
snow sublimation are estimated to erode 10 mm swe from the surface during the<br />
winter of 1996/1997 at Trail Valley Creek, Northwest Territories. This total is at<br />
the lower end of values presented by Essery et al. (1999) exclusively for blowing<br />
snow sublimation at the same location and time period when their relative humidity<br />
measurements are reported with respect to ice.<br />
Despite the emphasis on blowing snow sublimation in this paper, its precise<br />
role in the Arctic tundra water budget remains somewhat inconclusive. This is<br />
particularly evident given the sensitivity of the modelling results to various parameters<br />
as well as the lack of extensive, frequent in situ meteorological and snow<br />
stake measurements to confirm model predictions. Since blowing snow sublimation<br />
may significantly impact the heat flux profiles well above the surface, assumptions<br />
about the background thermodynamic profiles also become critical in evaluating<br />
the blowing snow sublimation and transport rates. For instance, although RHi may<br />
approach saturation near the surface, as is often the case in cold climate regimes,<br />
dry air aloft in the ABL could nonetheless sustain large blowing snow sublimation<br />
rates. Therefore, to obtain more realistic simulations of blowing snow and its interaction<br />
with the environment, we are currently coupling PIEKTUK-D to the MC2<br />
model (Benoit et al., 1997). We anticipate that this work will provide more accurate<br />
estimates of the effects of blowing snow in the hydrometeorology of the MRB and,<br />
concurrently, yield improved parametrizations of blowing snow sublimation.<br />
Acknowledgements<br />
We thank Dr. Richard Bintanja (Utrecht University), Dr. Graham Mann (University<br />
of Leeds), Prof. Peter Taylor and Mrs. Jingbing Xiao (York University), for<br />
discussions which have led to improvements in our blowing snow model discussed<br />
in the paper. We are much grateful to Dr. Long Li, Dr. Richard Essery (NHRC)<br />
and Dr. John Pomeroy (University of Saskatchewan) who provided generously the<br />
field data used in this study and to Dr. P. S. Anderson (British Antarctic Survey) for<br />
support in its interpretation. We acknowledge the support of the Natural Sciences<br />
and Engineering Research Council of Canada who have funded this work through<br />
a collaborative research agreement as part of the Canadian GEWEX program.<br />
References<br />
Anderson, P. S.: 1994, ‘A Method for Rescaling Humidity Sensors at Temperatures Well Below<br />
Freezing’, J. Atmos. Oceanic Tech. 11, 1388–1391.<br />
Benoit, R., Desgagné, M., Pellerin, P., Pellerin, S., Chartier, Y., and Desjardins, S.: 1997, ‘The<br />
Canadian MC2: A Semi-Lagrangian, Semi-Implicit Wideband Atmospheric Model Suited for<br />
Finescale Process Studies and Simulation’, Mon. Wea. Rev. 125, 2382–2415.
<strong>SIMULATION</strong> <strong>OF</strong> <strong>BLOW<strong>IN</strong>G</strong> <strong>SNOW</strong> 315<br />
Bintanja, R.: 1998, ‘The Contribution of Snowdrift Sublimation to the Surface Mass Balance of<br />
Antarctica’, Ann. Glaciol. 27, 251–259.<br />
Budd, W. F.: 1966, ‘The Drifting of Non-Uniform Snow Particles’, in M. J. Rubin (ed.), Studies<br />
in Antarctic Meteorology, Antarctic Research Series, Vol. 9, American Geophysical Union,<br />
Washington, DC, pp. 59–70.<br />
Déry, S. J. and Taylor, P. A.: 1996, ‘Some Aspects of the Interaction of Blowing Snow with the<br />
Atmospheric Boundary Layer’, Hydrol. Proc. 10, 1345–1358.<br />
Déry, S. J. and Yau, M. K.: 1999a, ‘A Climatology of Adverse Winter-Type Weather Events’, J.<br />
Geophys. Res. 104(D14), 15,657–16,672.<br />
Déry, S. J. and Yau, M. K.: 1999b, ‘A Bulk Blowing Snow Model’, Boundary-Layer Meteorol. 93,<br />
237–251.<br />
Déry, S. J., Taylor, P. A., and Xiao, J.: 1998, ‘The Thermodynamic Effects of Sublimating, Blowing<br />
Snow in the Atmospheric Boundary Layer’, Boundary-Layer Meteorol. 89, 251–283.<br />
Essery, R., Li, L., and Pomeroy, J. W.: 1999, ‘A Distributed Model of Blowing Snow over Complex<br />
Terrain’, Hydrol. Proc. 13, 2423–2438.<br />
Harrington, J. Y., Meyers, M. P., Walko, R. L., and Cotton, W. R.: 1995, ‘Parameterization of Ice<br />
Crystal Conversion Process Due to Vapor Deposition for Mesoscale Models Using Doublemoment<br />
Basis Functions. Part I: Basic Formulation and Parcel Model Results’, J. Atmos. Sc.<br />
52, 4344–4366.<br />
Hoode, E., Williams, M., and Cline, D.: 1999, ‘Sublimation from a Seasonal Snowpack at a<br />
Continental, Mid-Latitude Alpine Site’, Hydrol. Proc. 13, 1781–1797.<br />
King, J. C. and Anderson, P. S.: 1999, ‘A Humidity Climatology for Halley, Antarctica Based on<br />
Hygrometer Measurements’, Antarct. Sci. 11, 100–104.<br />
King, J. C., Anderson, P. S., Smith, M. C., and Mobbs, S. D.: 1996, ‘The Surface Energy and Mass<br />
Balance at Halley, Antarctica during Winter’, J. Geophys. Res. 101(D14), 19,119–19,128.<br />
Lawford, R. G.: 1994, ‘Knowns and Unknowns in the Hydroclimatology of the Mackenzie River<br />
Basin’, in S. D. Cohen (ed.), Mackenzie Basin Impact Study (MBIS), Interim Report #2,<br />
Yellowknife, NWT, pp. 173–195.<br />
Mann, G. W., Anderson, P. S., and Mobbs, S. D.: 2000, ‘Profile Measurements of Blowing Snow at<br />
Halley, Antarctica’, J. Geophys. Res., 105(D19), 24,491–24,508.<br />
Pomeroy, J. W., Gray, D. M., and Landine, P. G.: 1993, ‘The Prairie Blowing Snow Model:<br />
Characteristics, Validation, Operation’, J. Hydrol. 144, 165–192.<br />
Pomeroy, J. W., Marsh, P., and Gray, D. M.: 1997, ‘Application of a Distributed Blowing Snow Model<br />
to the Arctic’, Hydrol. Proc. 11, 1451–1464.<br />
Reisner, J., Rasmussen, R. M., and Bruintjes, R. T.: 1998, ‘Explicit Forecasting of Supercooled<br />
Liquid Water in Winter Storms Using the MM5 Mesoscale Model’, Quart. J. Roy. Meteorol.<br />
Soc. 124, 1071–1107.<br />
Rogers, R. R. and Yau, M. K.: 1989, A Short Course in Cloud Physics, Third Edition, Pergamon<br />
Press, 293 pp.<br />
Schmidt, R. A.: 1982, ‘Vertical Profiles of Wind Speed, Snow Concentrations, and Humidity in<br />
Blowing Snow’, Boundary-Layer Meteorol. 23, 223–246.<br />
Schwerdtfeger, W.: 1984, Climate of the Antarctic, Developments in Atmospheric Science 15,<br />
Elsevier, 261 pp.<br />
Stewart, R. E., Bachard, D., Dunkley, R. R., Giles, A. C., Lawson, B., Legal, L., Miller, S. T., Murphy,<br />
B. P., Parker, M. N., Paruk, B. J., and Yau, M. K.: 1995, ‘Winter Storms over Canada’, Atmos.-<br />
Ocean 33, 223–247.<br />
Stewart, R. E., Leighton, H. G., Marsh, P., Moore, G. W. K., Rouse, W. R., Soulis, S. D., Strong,<br />
G. S., Crawford, R. W., and Kochtubajda, B.: 1998, ‘The Mackenzie GEWEX Study: The Water<br />
and Energy Cycles of a Major North American River Basin’, Bull. Amer. Meteorol. Soc. 79,<br />
2665–2684.
316 STEPHEN J. DÉRY AND M. K. YAU<br />
van den Broeke, M. R.: 1997, ‘Spatial and Temporal Variation of Sublimation on Antarctica: Results<br />
of a High-Resolution General Circulation Model’, J. Geophys. Res. 102(D25), 29,765–29,777.<br />
Vowinckel, E. and Orvig, S.: 1970, ‘The Climate of the North Polar Basin’, in S. Orvig (ed.), Climate<br />
of the Polar Regions, World Survey of Climatology, Vol. 7, Elsevier, pp. 129–252.<br />
Xiao, J., Bintanja, R., Déry, S. J., Mann, G. W., and Taylor, P. A.: 2000, ‘An Intercomparison among<br />
Four Models of Blowing Snow’, Boundary-Layer Meteorol. 97, 109–135.