ANSON COUNTY, NORTH CAROLINA - Department of Commerce
ANSON COUNTY, NORTH CAROLINA - Department of Commerce
ANSON COUNTY, NORTH CAROLINA - Department of Commerce

Create successful ePaper yourself
Turn your PDF publications into a flip-book with our unique Google optimized e-Paper software.
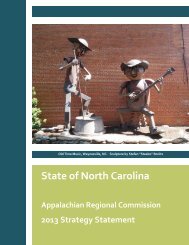
<strong>ANSON</strong> <strong>COUNTY</strong>, <strong>NORTH</strong> <strong>CAROLINA</strong><br />
Population: 26,948 Population: Rural: 15,528 (58%)<br />
(7) Towns:<br />
Wadesboro 5,813<br />
Peachland 437<br />
Polkton 1,207<br />
Lilesville 536 > In Town: 11,420 (42%)<br />
Morven 511<br />
Ansonville 631<br />
McFarlan 117<br />
(3) Prisons: 2,168 Inmate population + new 500 bed facility under construction – 2,668 population<br />
Tier: 1 (Anson County is one <strong>of</strong> the Top 20 most economically distressed counties - # 8 <strong>of</strong> 100 in North Carolina)<br />
Poverty Rate: (County) 25.6% (2010 Census)-State (12.3%)<br />
Unemployment Rate: (County) 12.7% (2010-2011 average 12.5%)<br />
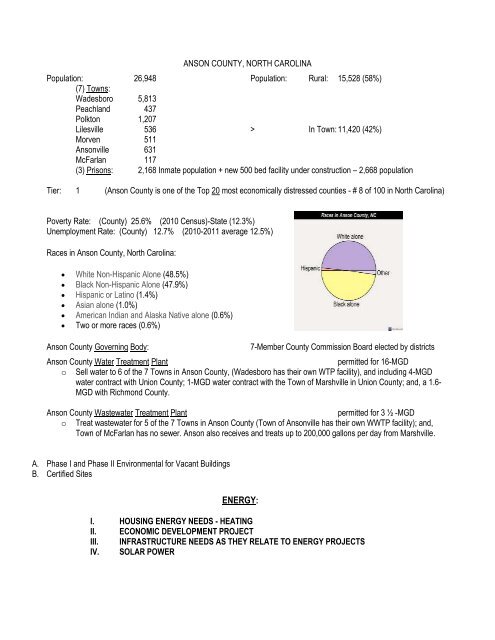
Races in Anson County, North Carolina:<br />
White Non-Hispanic Alone (48.5%)<br />
Black Non-Hispanic Alone (47.9%)<br />
Hispanic or Latino (1.4%)<br />
Asian alone (1.0%)<br />
American Indian and Alaska Native alone (0.6%)<br />
Two or more races (0.6%)<br />
Anson County Governing Body: 7-Member County Commission Board elected by districts<br />
Anson County Water Treatment Plant permitted for 16-MGD<br />
o Sell water to 6 <strong>of</strong> the 7 Towns in Anson County, (Wadesboro has their own WTP facility), and including 4-MGD<br />
water contract with Union County; 1-MGD water contract with the Town <strong>of</strong> Marshville in Union County; and, a 1.6-<br />
MGD with Richmond County.<br />
Anson County Wastewater Treatment Plant permitted for 3 ½ -MGD<br />
o Treat wastewater for 5 <strong>of</strong> the 7 Towns in Anson County (Town <strong>of</strong> Ansonville has their own WWTP facility); and,<br />
Town <strong>of</strong> McFarlan has no sewer. Anson also receives and treats up to 200,000 gallons per day from Marshville.<br />
A. Phase I and Phase II Environmental for Vacant Buildings<br />
B. Certified Sites<br />
ENERGY:<br />
I. HOUSING ENERGY NEEDS - HEATING<br />
II. ECONOMIC DEVELOPMENT PROJECT<br />
III. INFRASTRUCTURE NEEDS AS THEY RELATE TO ENERGY PROJECTS<br />
IV. SOLAR POWER
I. Housing:<br />
Housing Tenure: Total Housing Units 11,489<br />
o Occupied housing Units 9,768<br />
Owner-occupied housing units 6,376<br />
Renter-occupied housing units 3,392<br />
Vacant housing Units 1,721<br />
* Mobile Homes (2,941 <strong>of</strong> the occupied dwelling units are mobile home units)<br />
Housing Stock: 5,543 housing units or 48% <strong>of</strong> the housing stock in Anson County is older than 50 years<br />
Built 2005 or later 101 Built 1960 to 1969 1,539<br />
Built 2000 to 2004 216 Built 1950 to 1959 1,528<br />
Built 1990 to 1999 1,382 Built 1940 to 1949 1,029<br />
Built 1980 to 1989 1,367 Built 1939 or earlier 1,447<br />
Built 1970 to 1979 2,880<br />
Heating Assistance: Of the 3 fuel distributors who serve Anson County residences with heating oil, none were willing to<br />
quote a per gallon cost for anything other than for the fuel that they have on hand. One distributor reported that prices are<br />
increasing as much as 6 to 8-cents per day. Average sized fuel tank used for home heating holds around 270 gallons <strong>of</strong> fuel;<br />
therefore, 270 gallons @ $4.00 per gallon is $1,080.00 X 5 months per year = $$5,400.00 per year in heating costs alone.<br />
Fuel Oil Customers 1,038 households in Anson County who use # 2 Fuel Oil for Heating<br />
150 households in Anson County who use # 1 Fuel Oil (Kerosene)<br />
Wood Heat Customers 375 households utilize wood for heating<br />
No Heat or Other Alternatives 100 households use Kerosene for space units – and we believe that is much higher<br />
than what is estimated.<br />
Solar Heat 0<br />
Heating assistance needs are creating many challenges for the elderly and individuals on fixed incomes in Anson County.<br />
DSS has had a significant increase in requests for heating assistance, as well as Crisis Ministries as more and more<br />
households are unable to meet these rising fuel costs.<br />
o Is it possible for the Energy <strong>Department</strong> and CDBG to merge heating funding program together in an effort to<br />
replace heating systems in CDBG income eligible households?<br />
“Emergency Needs” dollars are not available but every 3 years with CDBG Scattered Site Housing Programs – and only<br />
10% <strong>of</strong> Scattered Housing dollars may be used for “Emergency Needs” and approximately 75% <strong>of</strong> the CDBG Scattered Site<br />
“Emergency Needs” dollars spent in Anson County are used to replace inoperable heating systems.<br />
The County averages receiving around 10-12 calls per year for requests for replacement <strong>of</strong> heating and cooling systems;<br />
however, as we are currently required to “identify” the households in the Scattered Site Housing Grant Application that will<br />
receive “Emergency Needs” this leaves “no” money available to assist households on an on-going basis.<br />
While Anson County also applies for NCHFA “Urgent Repairs” funding, and have received award <strong>of</strong> four (4) URP grants in<br />
the past 10 years, the County did not receive funding last year because <strong>of</strong> shortfalls in the URP program. URP funds;<br />
however, must be spent on extremely low-income (30%) households, leaving households that are just above the 30% and<br />
the 50% very low-income ineligible to receive assistance under this program. Once 75% <strong>of</strong> the URP funding has been<br />
expended, only then may the County use URP funding on an above 30% income household. This generally only allows<br />
enough money remaining to work on one (1) house. Therefore, households needing heating systems <strong>of</strong>ten wait up to 3<br />
years until the next Scattered Site Housing dollars are again available to address their heating needs in their home.
We would like to request the possibility <strong>of</strong> either: not having to pre-identify homes in the Scattered Site application for<br />
“Emergency Needs” in order that the most “severe” needs be met on an on-going basis throughout the year; or that there<br />
possibly be some category <strong>of</strong> funding made available on an “ongoing basis” to meet “severe” needs such as the<br />
“replacement <strong>of</strong> heating systems”. (Catalyst Grant)<br />
Heating Systems – Changes in the SEER (efficiency rating) <strong>of</strong> units and efficiency and cost in order to meet <strong>Department</strong><br />
<strong>of</strong> Energy standards:<br />
Heating systems are rated by SEER (Seasonal Energy Efficiency Ratio). The SEER is the efficiency rating <strong>of</strong> a heating unit<br />
when it is in the cooling mode, which is weighed in BTU (British thermal unit) or the output <strong>of</strong> the cooling unit, during a<br />
typical cooling-season. To figure the heat loss and heat gain in a home - this is divided by the total electric energy input in<br />
watt-hours during the same period. The higher the unit's SEER rating - the more energy efficient the unit is.<br />
Since January 1, 2006, in conjunction with the <strong>Department</strong> <strong>of</strong> Energy requirements, the County has installed 13 to 14 SEER<br />
HVAC units in homes, which was to represent a 30% increase in air conditioning or heat pump energy efficiency. The<br />
installation <strong>of</strong> the HVAC unit also requires installation <strong>of</strong> duct work; thermostats; and, more <strong>of</strong>ten than not, electrical<br />
upgrades on the home. The SEER upgrades set by the <strong>Department</strong> <strong>of</strong> Energy are in an effort to reduce the cost in electric<br />
bills in order to handle the heating system. The price <strong>of</strong> metal continues to impact the cost <strong>of</strong> this equipment.<br />
Many homes that we work with, have little to no wall, attic, or floor insulation; some homes have no shade outside the home;<br />
many have old windows and doors; etc., which all affect the heating and cooling ability <strong>of</strong> a unit in the home.<br />
The new technology to save 30% on energy consumption is continually driving the SEER size up as well as the cost <strong>of</strong> the<br />
unit. The technology to save 30% on energy consumption will be the standard as mandated by the <strong>Department</strong> <strong>of</strong> Energy.<br />
But, in order to achieve that energy savings, this will impact the size <strong>of</strong> the SEER, and the up front cost <strong>of</strong> installation. This is<br />
already impacting the costs <strong>of</strong> installing a new heating system in our homes. The first changes we have seen have been<br />
with the new technology in compressors. New technology compressors run quiet and provide excellent efficiency and are<br />
much more durable. The second changes that are affecting costs are in the effort to increase the equipment's efficiency is to<br />
increase the size <strong>of</strong> the evaporator and condenser coils in the system. The new compressors and larger coils are adding to<br />
the increase in the cost <strong>of</strong> the equipment.<br />
In an attempt to meet these new energy standards “ENERGY STAR STANDARDS”, we are currently required to use 15 to<br />
15.99 SEER units, and/or 16 SEER units, which is going to nearly double the cost associated with replacing an HVAC<br />
system in homes. The higher the SEER, the more metal that is going to be needed in manufacturing HVAC units. Electrical<br />
cost are also increasing and while the County used an average <strong>of</strong> $900 in the past to upgrade electrical systems in homes,<br />
that cost is now averaging $1,200.00 per home.<br />
The average cost associated with the installation <strong>of</strong> a 13-14 SEER HVAC system, depending on the size <strong>of</strong> the unit has<br />
generally required a 2 ½ to 3-ton unit for most homes. The cost has been around $4,500.00, which has included electrical<br />
upgrades. With a 15 to 15.99 SEER unit, the County can expect the cost to be around $6,000.00 for installation <strong>of</strong> new<br />
heating systems, plus around $1,500.00 for the electrical upgrades.<br />
NCHFA has already increased their URP maximum to $6,000.00; however, we are looking at new heating systems possibly<br />
costing up to $7,500.00 to $8,000.00.
II. Economic Development Project:<br />
“GrowGreen Power is made up <strong>of</strong> visionaries and entrepreneurs with a unified mission: provide fresh, local produce and<br />
clean energy to the population.”<br />
GrowGreen Power integrates greenhouse growing systems and renewable energy; combined solar thermal and biomass<br />
plants providing electricity and produce. The integration <strong>of</strong> systems provides full use <strong>of</strong> all waste heat from the power plant<br />
to heat and cool the greenhouse, one <strong>of</strong> the first in the world to make this claim. GrowGreen Power centers provide<br />
communities with fresh food and renewable energy by combining a hydroponic greenhouse with a solar thermal / biomass<br />
power plant. Each project infuses areas with more than 300 permanent new jobs, while also boosting local economies in the<br />
areas <strong>of</strong> manufacturing, transportation, wholesale, retail and food service.<br />
The hydroponic greenhouse is a completely controlled growing environment capable <strong>of</strong> producing up to 30 times more high<br />
quality, safe produce than traditional farming. Initially, GrowGreen Power centers will produce tomatoes on the vine. U.S.<br />
annual per capita use <strong>of</strong> tomatoes and tomato products has increased nearly 30 percent over the past 20 years according to<br />
the U.S. <strong>Department</strong> <strong>of</strong> Agriculture’s (USDA) Economic Research Service (ERS).<br />
The GrowGreen Power center’s solar thermal and biomass power plant produces approximately 45 MW <strong>of</strong> clean, renewable<br />
energy, most <strong>of</strong> which will be sold to the local power grid. The remaining energy will be used to power the greenhouse and<br />
power plant, making the GrowGreen center fully sustainable. The electricity produced will provide local power companies<br />
the option to purchase Renewable Energy Credits (RECs), allowing them to meet State mandates requiring more and more<br />
energy come from renewable sources.<br />
Additionally, the plant’s CO2 emissions are scrubbed to food grade quality and used to feed the greenhouse crops.<br />
GrowGreen Power centers are fully sustainable and operate twenty-four hours a day. The advanced integration technology<br />
allows controlled growing environments to operate within a wide variety <strong>of</strong> climate zones.<br />
GrowGreen Power systems represent an innovative new way to integrate existing technologies to provide communities with<br />
fresh produce and renewable energy.<br />
This company has the ability to “feed” and “heat” the world.
300 to 400 new jobs will be created in Anson County as a result <strong>of</strong> this project. GrowGreen Power will need 850,000 gallons<br />
<strong>of</strong> water per day as well as public sewer. Two (2) 25-acre greenhouses will be constructed on site, along with a bio-mass<br />
power plant. The site for the power plant must be constructed in close proximity to a power sub-station. As most power substations<br />
are located outside <strong>of</strong> a Town, water and sewer availability are not always easily accessible.<br />
The location <strong>of</strong> the proposed site for GrowGreen, which is located outside the Town <strong>of</strong> Wadesboro will require a 1-million<br />
gallon water tank or storage tank system, estimated to cost around $ 3-million. GrowGreen will also need public sewer,<br />
estimated cost around $500,000.00.<br />
III. Infrastructure Needs:<br />
FY 2009 Income<br />
Limit Area<br />
Median<br />
Income<br />
Anson County $44,100<br />
FY 2011<br />
Income Limit<br />
Area<br />
Anson<br />
County<br />
Median<br />
Income<br />
$38,600<br />
FY 2009 Income<br />
Limit Category<br />
Very Low (50%)<br />
Income Limits<br />
Extremely Low (30%)<br />
Income Limits<br />
Low (80%) Income<br />
Limits<br />
FY 2011 Income<br />
Limit Category<br />
Very Low (50%)<br />
Income Limits<br />
Extremely Low<br />
(30%) Income<br />
Limits<br />
Low (80%) Income<br />
Limits<br />
Anson County, North Carolina<br />
1<br />
Person<br />
2<br />
Person<br />
3<br />
Person<br />
4<br />
Person<br />
5<br />
Person<br />
6<br />
Person<br />
7<br />
Person<br />
8<br />
Person<br />
$17,450 $19,950 $22,450 $24,950 $26,950 $28,950 $30,950 $32,950<br />
$10,450 $11,950 $13,450 $14,950 $16,150 $17,350 $18,550 $19,750<br />
$27,950 $31,900 $35,900 $39,900 $43,100 $46,300 $49,500 $52,650<br />
Anson County, North Carolina<br />
1<br />
Person<br />
2<br />
Person<br />
3<br />
Person<br />
4<br />
Person<br />
5<br />
Person<br />
6<br />
Person<br />
7<br />
Person<br />
8<br />
Person<br />
$17,350 $19,800 $22,300 $24,750 $26,750 $28,750 $30,700 $32,700<br />
$10,400 $11,900 $13,400 $14,850 $16,050 $17,250 $18,450 $19,650<br />
$27,750 $31,700 $35,650 $39,600 $42,800 $45,950 $49,150 $52,300<br />
2009 Median Household Income for Anson County was $ 44,100.00 Tax Credits - $ 549.00 Income per week<br />
2011 Median Household Income for Anson County is $ 38,600.00 Tax Credits - $ 595.00 Income per week (2011)<br />
$ 5,500.00 less Median H/H Income since 2009<br />
$ 46.00 a week increase in salary from 2009 until 2011.<br />
GrowGreen – 100 power plant jobs - $65,000.00 to $100,000.00 per year jobs + benefits SIC & NAICS<br />
GrowGreen – 300 greenhouse hobs - $10.00 per hour jobs + benefits
IV. Solar Power<br />
Courtesy <strong>of</strong> the Solar Energy Industries Association, below are the Top 10 list for cumulative installed solar capacity in the<br />
United States as <strong>of</strong> 2010.<br />
California: 47 percent with 971 megawatts; 2. New Jersey: 14 percent with 293 MW; 3. Colorado: 5 percent with 108<br />
MW; 4. Arizona: 5 percent with 101 MW; 5. Nevada: 5 percent with 97 MW; 6. Florida: 4 percent with 73 MW; 7. New<br />
York: 3 percent with 54 MW; 8. Pennsylvania: 3 percent with 54 MW; 9. New Mexico: 2 percent with 45 MW; and 10.<br />
North Carolina: 2 percent with 42 MW.<br />
New York is politically and financially stepping out in front in an attempt to become the “major” solar state. Quoted below is a<br />
news article from March 2011:<br />
It’s time for New York to take the next step as the “progressive capital <strong>of</strong> the nation” (to quote Governor Andrew Cuomo in<br />
his Jan 2011 Inauguration) and show that we have the conviction to meet the Governor’s calling by taking action to support<br />
our very own homegrown solar industry. Yesterday an important bill designed to dramatically increase solar energy<br />
investment in New York State was introduced in the New York State Assembly. The bill, titled the New York State Solar<br />
Industry Development and Jobs Act (shorthand the “NY Solar Jobs Bill”) <strong>of</strong> 2011, is a top priority for the NRDC along with a<br />
broad coalition <strong>of</strong> clean energy, labor, investment and environmental community in New York State.<br />
In the fall <strong>of</strong> 2011, ICMA (International Capital Market Association) conducted a solar survey <strong>of</strong> local governments. This<br />
survey, which was sent to 10,423 city- and county-type local governments with populations over 2,500, aimed to gather<br />
information on what local governments are doing related to the adoption <strong>of</strong> solar energy, particularly solar photovoltaic<br />
(PV). The survey had a response rate <strong>of</strong> 24.1% (2,507 local governments), and the data provide an overview <strong>of</strong> the solar<br />
landscape as it pertains to local governments across the country – the challenges they are facing, the solar initiatives<br />
underway, and areas where local governments can still take steps to help facilitate the increased adoption <strong>of</strong> solar PV in<br />
their communities.<br />
Nearly a third <strong>of</strong> local governments report facing challenges to solar energy development, and <strong>of</strong> those, nearly two thirds<br />
(64.0%) cite the high cost <strong>of</strong> solar as a challenge to solar energy development. The next most frequently reported<br />
challenges are aesthetic impact concerns (28.7%), lack <strong>of</strong> interest in or awareness about solar energy development<br />
(27.1%), and lack <strong>of</strong> enabling legislation to incentivize solar installations (26.5%).<br />
Despite these challenges, nearly half <strong>of</strong> local governments responding to the survey (47.6%) report having installed a solar<br />
system on local-government-owned facility or land (84.8% <strong>of</strong> these systems are solar PV, and 24.5% are solar water<br />
heating). For these systems, 60.8% <strong>of</strong> local governments report owning them outright, while 33.3% report buying the power,<br />
and 11.4% say they lease the ro<strong>of</strong> space or land on which the system is located. Close to one-third (30.6%) <strong>of</strong> local<br />
governments report that they have installed one or more solar PV demonstration projects, intended as a public showcase<br />
and educational opportunity, with the most common location for demonstration projects being on government facilities<br />
(70.8%).<br />
Local governments are also addressing solar through planning. Zoning ordinances were the most commonly reported to<br />
address solar (43.1%), followed by comprehensive plans (34.8%), and green building codes (27.6%). Over half (54%) <strong>of</strong><br />
local governments responding to the question also say that they have discussed solar energy in the visioning process.<br />
When it comes to financing incentives for solar, 17.2% <strong>of</strong> local governments report that financial incentives for installing<br />
solar PV are available either through the local government or the municipal utility. Of these, the most common are rebates,<br />
which 60.7% <strong>of</strong> those <strong>of</strong>fering incentives report <strong>of</strong>fering for residential installations and 63.4% report <strong>of</strong>fering for commercial<br />
installations, followed by direct loans/low-interest loans (23.0% and 20.8% for residential and commercial respectively).
Local governments <strong>of</strong>fering direct incentives for solar PV installations are most likely to fund them through either state and<br />
federal grants or a publicly-owned utility budget (25.7% for both).<br />
Permitting saw lower levels <strong>of</strong> local governments <strong>of</strong>fering incentives. Only 12.9% <strong>of</strong> local governments report <strong>of</strong>fering<br />
mechanism for expediting permitting, such as expedited review for standard installations, expedited review for qualified<br />
contractors, or expedited review for customers willing to pay an extra fee) for solar PV installations.<br />
As the survey data shows, there are many areas where local governments can make changes to help facilitate the adoption<br />
<strong>of</strong> solar energy technologies on the local level. Some <strong>of</strong> these are relatively easy changes. For example, fewer than a third<br />
<strong>of</strong> local governments (29.1%) make information about permitting processes and associated fees for solar PV installations<br />
available online and only 20.5% report that information about the local utility’s interconnection process for PV online. And<br />
some are more challenging, like creating expedited permitting processes, updating zoning codes, and finding financing<br />
incentives that help address the high costs <strong>of</strong> solar.<br />
Geography<br />
Response rates were highest from local governments in the West (Alaska, Arizona, California, Colorado, Hawaii, Idaho,<br />
Montana, Nevada, New Mexico, Oregon, Utah, Washington, and Wyoming) at 32.6%. The next highest response rate for<br />
was North-Central (Illinois, Indiana, Iowa, Kansas, Michigan, Minnesota, Missouri, Nebraska, North Dakota, Ohio, South<br />
Dakota, and Wisconsin) at 25.9%. The lowest response rate was from the Northeast (Connecticut, Massachusetts, Maine,<br />
New Jersey, New Hampshire, New York, Pennsylvania, Rhode Island, and Vermont) at 18.2%. The response rate for the<br />
South (Alabama, Arkansas, Delaware, Florida, Georgia, Kentucky, Louisiana, Maryland, Mississippi, North Carolina,<br />
Oklahoma, South Carolina, Tennessee, Texas, Virginia, and West Virginia) was 22.4%.<br />
Form <strong>of</strong> Government<br />
The highest response rates came from jurisdictions with council-manager (30.7%) and council-administrator (28.6%) forms<br />
<strong>of</strong> government, followed by jurisdictions with Representative town meetings (23.4%). Response rates were above 20% for all<br />
forms <strong>of</strong> government except town meeting (17.7%) and county commission (17.3%).