Guide to key performance indicators - PwC
Guide to key performance indicators - PwC
Guide to key performance indicators - PwC

You also want an ePaper? Increase the reach of your titles
YUMPU automatically turns print PDFs into web optimized ePapers that Google loves.
Trend data Segmental Changes Benchmarking<br />
Reconciliation<br />
<strong>to</strong> GAAP<br />
Future targets<br />
Source and<br />
assumptions/limitations<br />
Purpose<br />
Defi nition and<br />
calculation<br />
BMO Financial Group<br />
Source: BMO Financial Group 189th Annual Report 2006<br />
14<br />
OUR<br />
MD&A<br />
and Analysis<br />
nce and Condition at a Glance<br />
Our Performance Peer Group Comparison<br />
Total Shareholder R<br />
• BMO’s average annual fiv<br />
13.8% a year ago and w<br />
the financial services ind<br />
• BMO’s one-year TSR of<br />
of the Canadian peer gr<br />
TSR and marks returns o<br />
five years.<br />
Further details are provided on page 3<br />
BMO Financial Group 189th Annual Report 2006<br />
Net Economic Profit (NEP) Growth<br />
• NEP, a measure of added economic value, grew 10.3% <strong>to</strong> a<br />
record $1,230 million.<br />
• Results in Private Client Group and Corporate Services drove<br />
the improvement, as the other operating groups were allocated<br />
higher capital in 2006.<br />
Further details are provided on page 33.<br />
Revenue Growth<br />
• Revenue* increased $154 million or 1.5% in 2006, but increased<br />
5.9% excluding the effects of the sale of Harrisdirect and<br />
the weaker U.S. dollar. On this basis, revenue in each of our<br />
operating groups improved, with most of this improvement<br />
reflected in P&C Canada and Private Client Group.<br />
Further details are provided on page 36.<br />
Expense-<strong>to</strong>-Revenue Ratio (Productivity Ratio)<br />
• The productivity ratio improved 77 basis points <strong>to</strong> 62.8% in<br />
2006. The cash productivity ratio improved 25 basis points <strong>to</strong><br />
62.4%, following 538 basis points of <strong>to</strong>tal improvement in<br />
the three previous years. We had targeted an improvement of<br />
100 <strong>to</strong> 150 basis points in the cash productivity ratio in 2006.<br />
Further details are provided on page 40.<br />
*Revenue and income taxes are reported in the MD&A on a taxable equivalent basis.<br />
See pages 34, 36 and 41.<br />
24 • BMO Financial Group 189th Annual Report 2006<br />
91.8<br />
(15.2)<br />
Five-Year TSR (%)<br />
• BMO’s average annual five-year TSR of 19.1% was<br />
19.1 below the Canadian peer group average of 19.6%<br />
but substantially above the North American peer<br />
13.8<br />
group average of 14.4%.<br />
• Our strong one-year TSR narrowed the gap <strong>to</strong><br />
the Canadian peer group average and improved<br />
our advantage over the North American peer<br />
group average.<br />
2005 2006<br />
EPS Growth (%)<br />
• BMO’s EPS growth of 11.2% in 2006 improved but was<br />
below a Canadian peer group average of 59.2% that<br />
was elevated by the impact of litigation provisions in<br />
2005 and a significant gain on the sale of a business<br />
in 2006. These same fac<strong>to</strong>rs contributed <strong>to</strong> a strong<br />
11.2<br />
5.2<br />
North American peer group average of 21.0%.<br />
2005 2006<br />
ROE (%)<br />
• ROE of 19.2% in 2006 was below the Canadian<br />
18.8 19.2<br />
peer group average of 23.2% but above the North<br />
American peer group average of 17.5%.<br />
• BMO has earned ROE of more than 13% in each of<br />
the past 17 years, the only major North American<br />
bank with this record of earnings consistency.<br />
2005 2006<br />
NEP Growth (%)<br />
• NEP growth of 10.3% in 2006 was below the Canadian<br />
peer group average of 92.1% and the North American<br />
peer group average of 37.7%. The averages were<br />
favourably affected by the 2005 litigation provisions<br />
and the 2006 gain on sale of a business.<br />
58.4 10.3<br />
0.1<br />
2002 2003 2004 2005 2006<br />
3.7<br />
4.7<br />
5.0<br />
1.5<br />
(0.1)<br />
2002 2003 2004 2005 2006<br />
Canadian peer group NEP growth for 2002 (–104%) and<br />
2003 (3,112%) is not <strong>to</strong> scale.<br />
Revenue Growth (%)<br />
• Revenue growth of 1.5% in 2006 was below<br />
the Canadian peer group average of 7.2% and the<br />
strong North American peer group average of<br />
8.4%. Excluding the sale of Harrisdirect and<br />
the impact of the weaker U.S. dollar, BMO’s<br />
revenue growth was 5.9%.<br />
Expense-<strong>to</strong>-Revenue Ratio (%)<br />
69.0<br />
• BMO’s productivity ratio of 62.8% was worse than<br />
66.5<br />
65.0<br />
the Canadian peer group average of 60.8% and the<br />
63.6<br />
62.8 North American peer group average of 57.3%.<br />
• BMO is targeting <strong>to</strong> improve the cash productivity<br />
ratio by 100–150 bps in 2007.<br />
2002 2003 2004 2005 2006<br />
BMO Financial Group<br />
Canadian peer group average<br />
North American peer group average<br />
See page 26 for further comments on peer<br />
group comparisons.<br />
Certain prior year data has been restated.<br />
See Note 1 on page 26.<br />
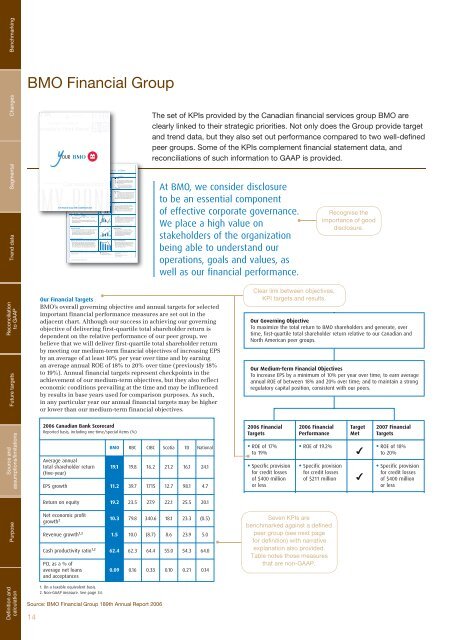
Our Financial Targets<br />
BMO’s overall governing objective and annual targets for selected<br />
important financial <strong>performance</strong> measures are set out in the<br />
adjacent chart. Although our success in achieving our governing<br />
objective of delivering first-quartile <strong>to</strong>tal shareholder return is<br />
dependent on the relative <strong>performance</strong> of our peer group, we<br />
believe that we will deliver first-quartile <strong>to</strong>tal shareholder return<br />
by meeting our medium-term financial objectives of increasing EPS<br />
by an average of at least 10% per year over time and by earning<br />
an average annual ROE of 18% <strong>to</strong> 20% over time (previously 18%<br />
<strong>to</strong> 19%). Annual financial targets represent checkpoints in the<br />
achievement of our medium-term objectives, but they also reflect<br />
economic conditions prevailing at the time and may be influenced<br />
by results in base years used for comparison purposes. As such,<br />
in any particular year our annual financial targets may be higher<br />
or lower than our medium-term financial objectives.<br />
2006 Canadian Bank Scorecard<br />
Reported basis, including one-time/special items (%)<br />
Average annual<br />
<strong>to</strong>tal shareholder return 19.1<br />
(five-year)<br />
The set of KPIs provided by the Canadian fi nancial services group BMO are<br />
clearly linked <strong>to</strong> their strategic priorities. Not only does the Group provide target<br />
and trend data, but they also set out <strong>performance</strong> compared <strong>to</strong> two well-defi ned<br />
peer groups. Some of the KPIs complement fi nancial statement data, and<br />
reconciliations of such information <strong>to</strong> GAAP is provided.<br />
At BMO, we consider disclosure<br />
<strong>to</strong> be an essential component<br />
of effective corporate governance.<br />
We place a high value on<br />
stakeholders of the organization<br />
being able <strong>to</strong> understand our<br />
operations, goals and values, as<br />
well as our financial <strong>performance</strong>.<br />
BMO RBC CIBC Scotia TD National<br />
EPS growth 11.2 39.7 1715 12.7 98.1 4.7<br />
Return on equity 19.2 23.5 27.9 22.1 25.5 20.1<br />
Net economic profit<br />
growth2 10.3<br />
Revenue growth 1.5<br />
1,2 10.0 (8.7) 8.6 23.9 5.0<br />
Cash productivity ratio 62.4<br />
1,2 62.3 64.4 55.0 54.3 64.0<br />
PCL as a % of<br />
average net loans<br />
and acceptances<br />
0.09 0.16 0.33 0.10 0.21 0.14<br />
1. On a taxable equivalent basis.<br />
2. Non-GAAP measure. See page 34.<br />
19.8 16.2 21.2 16.1 24.1<br />
79.8 340.6 18.1 23.3 (0.5)<br />
Clear link between objectives,<br />
KPI targets and results.<br />
2006 Financial<br />
Targets<br />
2006 Financial<br />
Performance<br />
Recognise the<br />
importance of good<br />
disclosure.<br />
Our Governing Objective<br />
To maximize the <strong>to</strong>tal return <strong>to</strong> BMO shareholders and generate, over<br />
time, first-quartile <strong>to</strong>tal shareholder return relative <strong>to</strong> our Canadian and<br />
North American peer groups.<br />
Our Medium-Term Financial Objectives<br />
To increase EPS by a minimum of 10% per year over time; <strong>to</strong> earn average<br />
annual ROE of between 18% and 20% over time; and <strong>to</strong> maintain a strong<br />
regula<strong>to</strong>ry capital position, consistent with our peers.<br />
• ROE of 17%<br />
<strong>to</strong> 19%<br />
• Specific provision<br />
for credit losses<br />
of $400 million<br />
or less<br />
• ROE of 19.2%<br />
• Specific provision<br />
for credit losses<br />
of $211 million<br />
Seven KPIs are<br />
benchmarked against a defi ned<br />
peer group (see next page<br />
for defi nition) with narrative<br />
explanation also provided.<br />
Table notes those measures<br />
that are non-GAAP.<br />
Target<br />
Met<br />
✔<br />
✔<br />
2007 Financial<br />
Targets<br />
• ROE of 18%<br />
<strong>to</strong> 20%<br />
• Specific provision<br />
for credit losses<br />
of $400 million<br />
or less