2 The Water Cycle - Hawke's Bay Regional Council
2 The Water Cycle - Hawke's Bay Regional Council
2 The Water Cycle - Hawke's Bay Regional Council

You also want an ePaper? Increase the reach of your titles
YUMPU automatically turns print PDFs into web optimized ePapers that Google loves.
2 <strong>The</strong> <strong>Water</strong> <strong>Cycle</strong><br />
2.1 <strong>The</strong> hydrologic cycle<br />
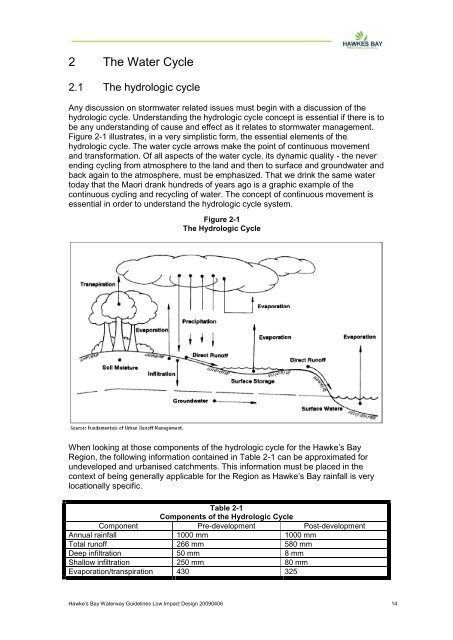
Any discussion on stormwater related issues must begin with a discussion of the<br />
hydrologic cycle. Understanding the hydrologic cycle concept is essential if there is to<br />
be any understanding of cause and effect as it relates to stormwater management.<br />
Figure 2-1 illustrates, in a very simplistic form, the essential elements of the<br />
hydrologic cycle. <strong>The</strong> water cycle arrows make the point of continuous movement<br />
and transformation. Of all aspects of the water cycle, its dynamic quality - the never<br />
ending cycling from atmosphere to the land and then to surface and groundwater and<br />
back again to the atmosphere, must be emphasized. That we drink the same water<br />
today that the Maori drank hundreds of years ago is a graphic example of the<br />
continuous cycling and recycling of water. <strong>The</strong> concept of continuous movement is<br />
essential in order to understand the hydrologic cycle system.<br />
Figure 2-1<br />
<strong>The</strong> Hydrologic <strong>Cycle</strong><br />
When looking at those components of the hydrologic cycle for the Hawke‟s <strong>Bay</strong><br />
Region, the following information contained in Table 2-1 can be approximated for<br />
undeveloped and urbanised catchments. This information must be placed in the<br />
context of being generally applicable for the Region as Hawke‟s <strong>Bay</strong> rainfall is very<br />
locationally specific.<br />
Table 2-1<br />
Components of the Hydrologic <strong>Cycle</strong><br />
Component Pre-development Post-development<br />
Annual rainfall 1000 mm 1000 mm<br />
Total runoff 266 mm 580 mm<br />
Deep infiltration 50 mm 8 mm<br />
Shallow infiltration 250 mm 80 mm<br />
Evaporation/transpiration 430 325<br />
Hawke‟s <strong>Bay</strong> <strong>Water</strong>way Guidelines Low Impact Design 20090406 14
It is important to appreciate that the system itself is a closed loop. What goes in must<br />
come out. Impacts on one part of the cycle create comparable impacts elsewhere in<br />
the cycle. If inputs to infiltration are decreased by 170 mm per year, then inputs to<br />
surface runoff must be comparably increased by this amount. Stormwater<br />
programmes, which focus on one aspect of stormwater (detention or channelisation)<br />
without paying attention to the other aspects of the hydrologic cycle, will not function<br />
effectively.<br />
Land development has come to mean a significant change in the natural landscape,<br />
including creation of impervious surfaces. When we pave areas we increase surface<br />
runoff. Figure 2-2 demonstrates that impact. <strong>The</strong> arrows in the illustration are drawn<br />
to suggest size or extent of impact (in this case, total quantities of water involved<br />
year after year). Note that when we move from the predevelopment to postdevelopment<br />
condition, the three medium-sized arrows become one increased<br />
surface runoff arrow with both evapotranspiration and infiltration substantially<br />
reduced. Increasing surface runoff total volumes translates into significantly reduced<br />
total volumes reduced from infiltration with significant consequences later in the<br />
water cycle.<br />
Figure 2-2<br />
Changes to <strong>Water</strong> Direction Due to Urban Development<br />
In the past, stormwater management programmes have focused on peak rate<br />
management or water quality treatment. Because such efforts are so partial in<br />
concept and in effect, this approach fails to acknowledge and plan for critical system<br />
wide water cycle impacts, which can mean that the stormwater management<br />
approach itself becomes a problem, rather than a solution. Only through<br />
understanding full water cycle dynamics can we hope to achieve some sort of system<br />
balance and minimise water cycle impacts when managing stormwater.<br />
Hawke‟s <strong>Bay</strong> <strong>Water</strong>way Guidelines Low Impact Design 20090406 15
2.2 Precipitation<br />
Hawke‟s <strong>Bay</strong> has a highly varied rainfall throughout the Region. <strong>The</strong> rainfall totals in<br />
western areas (3000 mm max.) can be up to three times those in eastern areas.<br />
Figure 2-3 provides information on rainfall patterns in the Region.<br />
<strong>The</strong> following information<br />
provides some context around<br />
rainfall in the Region.<br />
Through 136 years of<br />
record the average dry<br />
period between storms<br />
(greater than 5 mm)<br />
during the summer is<br />
12.9 days.<br />
<strong>The</strong> mean annual<br />
number of dry days in<br />
the summer is 43 days<br />
and the 5-year average<br />
is 52 dry days.<br />
During winter the<br />
average dry period is<br />
11.4 days with the<br />
annual number of dry<br />
days being 36 days and<br />
the 5-year average<br />
number of dry days is 44<br />
days.<br />
<strong>The</strong>re is not much variation<br />
between summer and winter in<br />
terms of inter-event dry periods but there is a slightly greater seasonal rainfall in the<br />
winter months (approximately 28%) than during other times of the year.<br />
A percentage of Hawke‟s <strong>Bay</strong> streams dry up completely during some summers. It<br />
is important to recognise the seasonal variability of rainfall and stream flow and the<br />
behaviour of various land use types on runoff generation. For instance, native<br />
vegetation provides a greater buffer and flow moderating influence on stormwater<br />
runoff than more modified environments. Streams are less inclined to dry up over<br />
summer months if there is abundant vegetation in a catchment as movement of<br />
water into the soil recharges groundwaters.<br />
2.3 Groundwater Considerations<br />
Figure 2-3<br />
Annual Rainfall for the Hawke’s <strong>Bay</strong> Region<br />
Groundwater is that part of the water cycle that has soaked into and flows through<br />
the ground. It is mainly derived from rainfall that has soaked into the ground instead<br />
of running off over the ground surface, evaporating or being used by plants. It may<br />
also be derived from water soaking into the ground from stream or lakebeds. <strong>The</strong><br />
replenishment of groundwater in this way is called groundwater recharge.<br />
<strong>Water</strong> that soaks into the ground moves down through soil pores or rock fractures<br />
until it hits the water table. <strong>The</strong> zone above the water table is known as the<br />
unsaturated zone. Below the water table soil pores or rock fractures are fully<br />
Hawke‟s <strong>Bay</strong> <strong>Water</strong>way Guidelines Low Impact Design 20090406 16
saturated and the groundwater mainly moves laterally through these pores and<br />
fractures.<br />
Groundwater underlies all of the Hawke‟s <strong>Bay</strong> Region. However, differences in<br />
geology, hydraulic properties of the soil or rock, topography, recharge rates and its<br />
relationship with surface water means that groundwater flow and bore yields are<br />
greater in some areas than others. <strong>The</strong> layers of rock that allow groundwater flow<br />
are called aquifers. <strong>The</strong>re are two main types of aquifer, which are:<br />
Unconfined or water table aquifers. <strong>The</strong>se are recharged by rainwater<br />
percolating down from the land surface (see Figure 2-4)<br />
Confined or artesian aquifers. <strong>The</strong>se are pressurised and may give rise to<br />
artesian or free-flowing bores. <strong>The</strong>y are recharged only where they are<br />
exposed at the land surface.<br />
Confining beds<br />
or layers that<br />
don‟t allow<br />
groundwater flow<br />
are called<br />
aquitards.<br />
Groundwater<br />
discharges from<br />
aquifers into the<br />
ocean, streams,<br />
lakes and<br />
springs. Aquifer<br />
discharge plays<br />
an important role<br />
in providing<br />
water to streams<br />
during dry<br />
periods. This<br />
flow to streams is<br />
called baseflow.<br />
Figure 2-4<br />
Common Types of Aquifers<br />
<strong>The</strong>re is a dynamic equilibrium between groundwater recharge, aquifer storage and<br />
aquifer outflow. For example recharge increases during a rainfall event and there is<br />
an increase in aquifer storage (the water tables rise) and there is a corresponding<br />
increase in aquifer outflow particularly baseflow and spring flow. This equilibrium is<br />
also changed by changes in land use. Where changes in land use reduce recharge<br />
rates there is a reduction in aquifer storage (the water table declines) and<br />
consequent reduction in baseflow in streams and in spring flow. Aquifer outflow is<br />
very important in maintaining stream ecology particularly during periods of low<br />
rainfall. During such times baseflow and spring flow is maintained from aquifer<br />
storage. If aquifer storage is not replenished by recharge a new equilibrium is<br />
reached with reduced baseflow and subsequent effects on stream ecology.<br />
Groundwater resources in the region vary from place to place according to the<br />
characteristics of the soils and underlying rock type. Primary soils in the Region<br />
include:<br />
Hawke‟s <strong>Bay</strong> <strong>Water</strong>way Guidelines Low Impact Design 20090406 17
Pallic Soils<br />
Pallic soils consist of loess derived from schist or greywacke. <strong>The</strong>y tend to have a<br />
slow permeability with limited rooting depth. <strong>The</strong>y are susceptible to erosion due to<br />
high potential for slaking and dispersion. <strong>The</strong>y tend to be dry in the summer and wet<br />
in the winter.<br />
Podzols Soils<br />
<strong>The</strong>se soils are strongly acidic and occur in areas of high rainfall. <strong>The</strong>y are<br />
associated with forest trees with an acid litter and have a slow permeability and<br />
limited root depth. Podzol soils have low biological activity.<br />
Pumice Soils<br />
Pumice soils are sandy or gravelly soils dominated by pumice, or pumice sand with a<br />
high content of natural glass. Drainage of excess water is rapid but the soils are<br />
capable of storing large amounts of water for plants. <strong>The</strong>y have a low clay content<br />
(
<strong>The</strong> figure provides for a hypothetical development at a hypothetical site and<br />
presents a post-development hydrograph with the assumption that there is no<br />
stormwater management. <br />
Figure 2-5<br />
Typical Pre- and Post-Development Hydrographs<br />
<strong>The</strong>re is a significant increase in the peak discharge from the development<br />
activity versus the predevelopment condition<br />
As the total volumes of the runoff are the areas under the curves, there is a<br />
significant increase in the total volume of runoff from the pre- to the post-<br />
condition.<br />
<strong>The</strong> post-development hydrograph rises or increases earlier in time than does<br />
the predevelopment hydrograph. Runoff starts earlier as portions of the site<br />
have been made impervious and immediately start to discharge water as rain<br />
begins.<br />
Under existing approaches to stormwater management a developer might be<br />
required to construct a pond for water quantity peak flow control, and possibly water<br />
quality, control. Ponds provide numerous benefits but they cannot reduce the total<br />
volume of water that must pass through them. This means that water is discharged<br />
from them for a longer period of time than would have occurred under<br />
predevelopment conditions. Figure 2-6 shows hydrographs under three different<br />
Figure 2-6<br />
Post Development Hydrograph with Detention<br />
Hawke‟s <strong>Bay</strong> <strong>Water</strong>way Guidelines Low Impact Design 20090406 19
scenarios now with the total volume for the uncontrolled condition being the same as<br />
the volume for the hydrograph where there is a stormwater pond. Where this<br />
situation occurs, it may not always cause problems downstream of the facility but<br />
duration of flows downstream of where a number of ponds are located on different<br />
tributaries may aggravate existing flooding problems.<br />
Figure 2-7 illustrates the possible flooding impacts (depending on location within a<br />
catchment) that can result when a peak rate control approach is used catchment<br />
wide. Under the assumption that they illustrate five sub-catchments within a single<br />
catchment, each of which undergoes development and relies on a peak rate control<br />
approach for stormwater ponds. Under this analysis, there is a predevelopment<br />
hydrograph which sums the individual sub-catchments, five different hydrographs<br />
from sub-areas, and those five combined to provide a resultant post-development<br />
catchment hydrograph. Not surprisingly, the resultant post-development hydrograph<br />
with detention exceeds the predevelopment condition for volume (as expected) but<br />
also for the peak rate of discharge, which goes against the intent of implementing the<br />
programme to begin with. In short, flooding may worsen downstream. A programme<br />
cannot be based<br />
only on structural<br />
detention facilities. It<br />
must be supported<br />
by various<br />
approaches that can<br />
complement<br />
detention to prevent<br />
aggravating an<br />
existing catchment<br />
condition.<br />
Figure 2-7<br />
Possible Effects of Detention on Catchment Hydrology<br />
Urbanisation of<br />
catchments can<br />
result in major<br />
flooding and<br />
sedimentation<br />
problems. <strong>The</strong> more<br />
important<br />
stormwater quantity effects of urbanisation which have been generated in the<br />
Hawke‟s <strong>Bay</strong> Region include the following:<br />
Complete reticulation of a catchment when urbanised will almost double the<br />
mean annual flood return period<br />
A fully urbanised catchment, completely reticulated and with approximately<br />
50% impervious cover will increase the peak discharge of a two year storm by<br />
approximately four times<br />
Large floods of low frequency, such as 50 to 100 year events, show a<br />
relatively lesser effect from urbanisation, their peak flows increasing about 2.5<br />
times.<br />
<strong>The</strong> number of bank overflows increases, perhaps doubling where the<br />
catchment is 20% storm reticulated and 20% impervious.<br />
Floods rise to a higher peak more quickly than under previous rural conditions<br />
and also runoff more rapidly.<br />
Natural baseflow may decrease as a result of reduced groundwater infiltration<br />
Where channel materials are erodible, the stream channel will tend to enlarge<br />
as part of the process of larger and more frequent floods.<br />
Hawke‟s <strong>Bay</strong> <strong>Water</strong>way Guidelines Low Impact Design 20090406 20
2.5 Stormwater Quality<br />
2.5.1 Contaminant Types<br />
Urban stormwater carries with it a wide variety of contaminants from multiple<br />
sources. Representing the majority of recognised classes of water contaminants,<br />
these originate not only from land activities in the catchment but also from<br />
atmospheric deposition. Moreover, surface and groundwaters can exchange.<br />
Streams flowing during times with no rain are an indication of the surface<br />
groundwater interaction.<br />
Contaminants commonly found in urban stormwater that can harm receiving waters<br />
and the specific measures that express them are listed in Table 2-3. Contaminants<br />
other than solids and pathogens are associated with being in a solid or in a dissolved<br />
state. In urban runoff most contaminants are associated with solids or soil or other<br />
natural particulates. This condition differs among the specific contaminants. For<br />
example, depending on overall chemical conditions, each metal differs in solubility.<br />
For instance, lead (Pb) is relatively insoluble and will generally be seen in a<br />
particulate form, while zinc (Zn) may be found in either a particulate or dissolved<br />
form. <strong>The</strong> nutrients phosphorus (P) and nitrogen (N) typically differ substantially in<br />
that phosphorus can be found either in particulate or soluble form while nitrogen is<br />
generally found in soluble form only.<br />
Besides these contaminants, other water quality characteristics affect the behaviour<br />
and fate of materials in water. <strong>The</strong>se characteristics include:<br />
Temperature<br />
pH - an expression of the relative hydrogen ion concentration<br />
Dissolved oxygen<br />
Alkalinity - the capacity of a solution to neutralise acid<br />
Hardness - an expression of the relative concentration of divalent cations,<br />
principally calcium and magnesium<br />
Conductivity - a measure of a water‟s ability to conduct an electrical current as<br />
a result of its total content of dissolved substances (often expressed as salinity<br />
in estuarine and marine waters or total dissolved solids (TDS))<br />
<strong>The</strong>se characteristics affect contaminant behaviour in several ways. Metals generally<br />
become more soluble as pH drops below neutral and hence become more available<br />
to harm organisms (often referred to as bioavailability). In addition, pH also affects<br />
the toxicity of some metals and ammonia. Depleted dissolved oxygen can also make<br />
some metals more soluble. Anaerobic conditions in the bottom of lakes release<br />
phosphorus from sediments, as iron changes from the ferric to the ferrous form.<br />
Elements creating hardness reduce toxicity of many heavy metals. <strong>Water</strong> quality<br />
analyses take this relationship into account by varying the allowable level as a<br />
function of hardness.<br />
Hawke‟s <strong>Bay</strong> <strong>Water</strong>way Guidelines Low Impact Design 20090406 21
Category<br />
Table 2-3<br />
Urban Contaminants<br />
Specific Measures<br />
Solids Settleable solids (SS)<br />
Total suspended solids (TSS)<br />
Turbidity<br />
Oxygen demanding substances Biochemical oxygen demand (BOD)<br />
Chemical oxygen demand (COD)<br />
Phosphorus Total phosphorus (TP)<br />
Soluble reactive phosphorus (SRP)<br />
Biologically available phosphorus (BAP)<br />
Nitrogen Total nitrogen<br />
Total Kjeldahl nitrogen (TKN)<br />
(ammonia + organic)<br />
Ammonia-nitrogen (NH3)<br />
Metals Copper (Cu), Lead (Pb), Zinc (Zn), Cadmium<br />
(Cd), Arsenic (As), Nickel (Ni), Chromium<br />
(Cr), Mercury (Hg), Selenium (Se), Silver<br />
(Ag)<br />
Micro-organisms Fecal coliform bacteria (FC)<br />
Enterococci bacteria (Ent)<br />
Viruses<br />
Petroleum hydrocarbons Oil and Grease (O+G)<br />
Total petroleum hydrocarbons (TPH)<br />
Synthetic organics Polynuclear aromatic hydrocarbons (PAHs)<br />
Phthalates<br />
Pesticides<br />
Polychlorobiphenols (PCBs)<br />
Solvents<br />
Etc.<br />
2.5.2 Contaminant Sources<br />
Now that types of contaminants have been discussed, it is important to recognise<br />
their sources. Knowing where contaminants come from can assist in developing a<br />
strategy to reduce their impact on receiving systems. Stormwater practices and<br />
approaches do not equally address contaminants and recognising the various land<br />
uses that exist in a catchment will assist in evaluating the range of pollutants that can<br />
be expected and thus the approach that needs to be taken to reduce their impact.<br />
Table 2-4 lists typical sources of contaminants.<br />
Table 2-4<br />
Sources of Urban Contaminants at Individual Sites<br />
Atmospheric deposition From urban and rural areas: fine particles, phosphorus,<br />
ammonia, nitrate, metals, pesticides, petroleum products,<br />
toxic organics and metals<br />
Litter and leaf fall Personal and commercial debris discarded to roadways<br />
and parking lots such as plastics, paper, cans, and food;<br />
leaves and organic debris from roadside and parking lot<br />
trees; BOD, nitrogen, phosphorus, humic organics, metals<br />
Residential and roadside Phosphorus and nitrogen, pesticides and herbicides,<br />
landscape maintenance dissolved organics from soil amendments<br />
Urban wildlife and pets Bacteria, phosphorus and nitrogen<br />
Transportation vehicles Fuels, brake drum and tire wear, body rust, fine particles,<br />
metals in particular zinc, copper, cadmium, lead, and<br />
Hawke‟s <strong>Bay</strong> <strong>Water</strong>way Guidelines Low Impact Design 20090406 22
chromium; and petroleum products such as oil/grease and<br />
PAH<br />
Pavement and pavement Temperature modification, petroleum derivatives from<br />
maintenance<br />
asphalt<br />
Pavement deicing Chlorides, sulfates, organics from acetate deicers, coarse<br />
sediments, and cyanide<br />
Building exteriors Galvanised metals, chipped and eroded paints, corrosion of<br />
surfaces accelerated by acid rain, metals<br />
Industrial businesses Varies widely with the industry. Includes the contaminants<br />
commonly contributed by other sources but may also<br />
include those less commonly detected in general urban<br />
runoff or at concentrations greater than normally found in<br />
contaminants from inappropriate connections, petroleum<br />
products, phenols, solvents, metals.<br />
Commercial businesses Parked vehicles, improperly disposed refuse such as<br />
discarded food, used cooking oil and grease, and<br />
packaging materials, internal drains improperly connected<br />
to the stormwater system, metals, BOD, bacteria,<br />
phosphorus, nitrogen, oil and grease<br />
Residential activities Landscaping, pest control, moss control, vehicle<br />
maintenance, painting, wood preservation, pesticides and<br />
herbicides, phosphorus, nitrogen, petroleum products, zinc<br />
and bacteria<br />
Site development High pH from fresh concrete surfaces, petroleum products<br />
from fresh asphalt and spills, organics and particles from<br />
landscaping materials, eroded sediment and associated<br />
constituents such as phosphorus, contaminants associated<br />
with improperly disposed construction materials like fresh<br />
concrete and paints, cement from preparation of exposed<br />
aggregate concrete<br />
Public infrastructure Metals from galvanised stormwater drain systems, metals<br />
and petroleum products from maintenance shops, bacteria,<br />
nitrogen, phosphorus and organics from exfiltration or<br />
overflowing sanitary sewer<br />
When considering water quality there are a number of statements that can be made.<br />
Stormwater‟s impact on the aquatic environment is due to three factors: a<br />
large increase in the volume of water that runs off impervious urban surfaces<br />
compared with more absorbent vegetated land uses, the greatly accelerated<br />
rate of runoff; and contamination of stormwater with a wide range of<br />
substances.<br />
Contaminants are collected by runoff from a variety of diffuse and point<br />
sources within a wide catchment area, but are often concentrated by the<br />
piped collection system at outfalls into aquatic receiving environments.<br />
<strong>The</strong> contaminants of most concern are suspended solids, a range of heavy<br />
metals, organochlorines, polynuclear aromatic hydrocarbons and human<br />
pathogens. Sources are widespread throughout the urban catchment and are<br />
classified as diffuse, or nonpoint sources.<br />
Many sources of stormwater contamination are difficult to control because of<br />
their diffuse distribution catchment-wide.<br />
Point sources of stormwater contaminants may be increased in industrial<br />
areas through yard and equipment washing and accidental or deliberate<br />
discharge of products and wastes from industrial processes that allow<br />
contaminants to enter the stormwater system.<br />
Hawke‟s <strong>Bay</strong> <strong>Water</strong>way Guidelines Low Impact Design 20090406 23
A large proportion of most contaminants are bound to particulate matter in the<br />
stormwater. A high proportion of these suspended solids pass through the<br />
drainage channels and eventually reach the marine receiving environment. In<br />
the marine receiving environment, suspended solids settle and are<br />
incorporated into marine sediments.<br />
Other settling processes also occur when contaminants move from freshwater<br />
to estuarine or saline waters.<br />
Settling occurs least along open coasts and harbour entrances as a result of<br />
wave action and littoral drift and most occurs in upper estuaries where flow<br />
velocities are reduced and salt tends to flocculate finer particles. <strong>The</strong><br />
headwaters of most estuaries are poorly flushed because much of the water<br />
draining on the ebb tide returns on the following flood tide. In contrast, open<br />
coastal regions are well flushed by tides and contaminants can be remobilised<br />
into the water column by wave, current and tidal action and are<br />
widely dispersed.<br />
Upper estuaries are therefore regarded as highly sensitive to stormwater<br />
contamination, because they act as retention zones where suspended solids<br />
are deposited, and where contaminants continually accumulate. <strong>The</strong>re is a<br />
higher rate of build-up of contaminants near stormwater outfalls.<br />
Concentrations then decrease with increasing distance from individual<br />
stormwater outfalls.<br />
Stormwater in New Zealand has similar concentrations and types of<br />
contaminants to those found in other developed countries.<br />
In urban streams, acute and chronic toxicity water quality criteria for the<br />
protection of sensitive biological species are regularly exceeded for heavy<br />
metal contaminates. Organic contaminant levels in stormwater may<br />
sometimes exceed the relevant chronic water quality criteria but the New<br />
Zealand information base is sparse. Further downstream where urban<br />
streams discharge into larger water bodies, water quality criteria are predicted<br />
to be rarely exceeded because of dilution and settling of particulates, which<br />
carry most of the contaminants.<br />
<strong>The</strong> impacts of urban development on small Hawke‟s <strong>Bay</strong> streams have been<br />
severe. Many of these impacts have been caused by modifications to channel<br />
and riparian areas, as well as by the hydrological changes accompanying<br />
urbanisation.<br />
In sheltered coastal sediments there is a clear link between urban stormwater<br />
contamination and build-up of contaminants. <strong>The</strong>re is strong evidence that<br />
this build-up is detrimental to animals that live in the sediment and which<br />
provide the basis of the estuarine ecosystem. Sediment contaminant<br />
concentrations in some of urban estuaries and harbours exceed North<br />
American sediment quality criteria, and there is evidence for stormwater<br />
impacts on aquatic animals in Hawke‟s <strong>Bay</strong> through chronic toxic effects.<br />
In streams and near stormwater outfalls, many contaminants regularly exceed<br />
sediment quality criteria for the protection of sediment-dwelling animals. Many<br />
of the retention zones of Hawke‟s <strong>Bay</strong> estuaries with significantly urbanised<br />
catchments exceed the criteria for the major contaminants lead, zinc, and<br />
organochlorines.<br />
If contaminants continue to be generated at present day rates, the rate of<br />
sediment contamination will accelerate with urban expansion, and the extent<br />
of the affected areas will increase.<br />
Hawke‟s <strong>Bay</strong> <strong>Water</strong>way Guidelines Low Impact Design 20090406 24
2.6 Stream Morphology<br />
<strong>The</strong> physical appearance and function of a stream‟s boundaries, generally called<br />
stream morphology, is a product of the magnitude of stream flow and erosional<br />
debris produced by a catchment. <strong>The</strong> influence of channel materials, catchment<br />
slope, and other features of catchment morphology further modify the individual<br />
stream characteristics. As the catchment area increases so do the requirements of<br />
the stream to convey water and sediment.<br />
2.6.1 Bankfull discharge<br />
A common term used in stream morphology is “bankfull” flow. This is a term that is<br />
used to denote channel capacity. When bankfull flow is exceeded, floodplain flow<br />
initiates. Stream dimensions, patterns, and bed features are a function of channel<br />
width measures at bankfull stage. <strong>The</strong> bankfull stage corresponds to the discharge at<br />
which channel maintenance is most effective, that is, the discharge at which moving<br />
sediment, forming or removing bars, forming or changing bends and meanders, and<br />
generally doing work that results in the average morphologic characteristics of<br />
channels. Typical velocity distributions are shown in Figure 2-8 (Chow, 1959). It is<br />
this discharge in concert with the range of flows that make up an annual hydrograph<br />
which govern the shape and size of the channel. Bankfull discharge is associated<br />
with a momentary maximum flow that, on the average, has a recurrence interval of<br />
1.5 years as determined using a flood frequency analysis. Although great erosion<br />
and enlargement of steep, incised channels may occur during extreme flood events,<br />
it is the<br />
modest flow<br />
regimes<br />
which often<br />
transports<br />
the greatest<br />
quantity of<br />
sediment<br />
material over<br />
time, due to<br />
the higher<br />
frequency of<br />
occurrence for such events.<br />
2.6.2 Stream channel dimensions<br />
Figure 2-8<br />
Stream Cross-section Showing Velocity Distributions<br />
Stream width is a function of stream flow occurrence and magnitude, size and type of<br />
transported sediment, and the bed and bank materials of the channel. Channel<br />
widths generally increase downstream as the square root of the discharge. Channel<br />
width can be modified by the following influences:<br />
Direct channel disturbance such as channelisation<br />
Changes in riparian vegetation that may alter boundary resistance and<br />
increase channel erosion potential<br />
Changes in streamflow regime due to catchment changes such as increased<br />
impervious surfaces or increased sediment delivery resulting from<br />
construction<br />
Hawke‟s <strong>Bay</strong> <strong>Water</strong>way Guidelines Low Impact Design 20090406 25
2.6.3 Stream channel patterns<br />
Streams are rarely straight for any substantial distance; rather they tend to follow a<br />
sinuous course. Meander geometry is most often expressed as a function of bankfull<br />
width. An example of the relationships that exist and the various components of a<br />
meander pattern are shown in Figure 2-9. <strong>The</strong> parameters include bankfull width,<br />
meander wavelength, and radius of curvature. Stream flow regimes not only include<br />
bankfull channel widths but can also change stream patterns, depending on the<br />
magnitude and duration of flows. As catchments are urbanised, widening of streams<br />
and changes in channel patterns can be observed. <strong>The</strong>se channel adjustments are<br />
brought on by an acceleration of streambank and bed erosion.<br />
<strong>The</strong> patterns of streams are naturally developed to provide for the dissipation of the<br />
kinetic energy of moving water and the transport of sediment. <strong>The</strong> meander geometry<br />
and associated riffles and pools adjust in such a way that the work expended on<br />
natural processes is minimised. Consequently, straightening stream channels<br />
ultimately leads to a state of disequilibrium or instability, often causing entrenchment<br />
and changes in morphology and stability. Over the last 150 years, numerous streams<br />
have been straightened under the assumption that their functional efficiency would<br />
increase.<br />
<strong>The</strong> meander patterns that streams exhibit result in maintaining a slope such that the<br />
stream neither degrades nor aggrades. When reducing the natural meander changes<br />
the alignment of the stream, local stream reach slopes are changed and instability<br />
may result.<br />
2.6.4 Stream channel profile<br />
Figure 2-9<br />
Stream Channel Geometry<br />
Generally, channel gradient decreases in a downstream direction with increases in<br />
stream flow. <strong>The</strong> shape of a longitudinal profile of a first or second order stream at<br />
the top of the catchment to the lower part of the catchment is generally concave.<br />
Since steep gradient streams are relatively straight, they dissipate energy along the<br />
longitudinal profile in relatively close spaced features, normally called riffles and<br />
Hawke‟s <strong>Bay</strong> <strong>Water</strong>way Guidelines Low Impact Design 20090406 26
pools. <strong>The</strong>ir spacing is inversely related to slope and proportional to the bankfull<br />
width.<br />
2.7 Stream Ecology<br />
As water in streams only moves in one direction (down hill) there is a constant loss of<br />
organisms and materials to the sea, the stream community is totally dependent on<br />
materials entering the system from mostly terrestrial ecosystems, typically as<br />
particulate matter (leaves, organic and inorganic matter). As a result, different<br />
streams and reaches of streams have different aquatic communities. Upland fastflowing<br />
streams with stony beds differ in community structure from slow-flowing<br />
lowland rivers with muddy bottoms. Looking at what lives in a stream in an<br />
undisturbed forested condition and relating that to what commonly exists in a stream<br />
that is impacted by urban development can provide a barometer of what we can<br />
expect if development was to occur in a traditional manner. A discussion of<br />
ecological issues also can provide guidance of what site resources are important to<br />
maintain if aquatic ecosystem protection is a goal.<br />
<strong>The</strong> dynamic nature of wet-weather flow regimes and water quality make it difficult to<br />
assess the impact of urbanisation and stormwater on aquatic ecosystems. Physical<br />
habitat and biological measures reflect aquatic ecosystem conditions over months<br />
and years and thus integrate these variable conditions into a more easily understood<br />
set of measures. Physical habitat is a principal element of ecological analysis.<br />
Without the proper channel and riparian characteristics (floodplain, shade, stable<br />
channel, riffles, pools, etc.) improvements in hydrology and water quality will<br />
demonstrate little change in ecosystem function or value. Most importantly, the<br />
aquatic community (plants, invertebrates, fish) provides a direct measure of<br />
ecosystem quality and sustainability.<br />
2.7.1 Physical habitat<br />
<strong>The</strong> increased frequency and magnitude of peak flows destabilises stream banks and<br />
increases sedimentation. Sedimentation can smother stable and productive aquatic<br />
habitats such as rocks, logs, and aquatic plants. <strong>The</strong> roots of large trees are undercut<br />
and fall into the stream while new growth has less opportunity to become<br />
established. Bare soil stream banks also result from deliberate removal of vegetation<br />
and are a common feature of urban streams.<br />
<strong>The</strong> loss of stable riparian vegetation is further accelerated by the direct removal of<br />
trees and shrubs as part of urban development. <strong>The</strong> resulting stream ecosystem is in<br />
a constant state of instability with little opportunity to become stable and more<br />
complex.<br />
Ecosystem function and quality increases with increased complexity, and the more<br />
complex the habitat, the more complex the ecosystem functions. Forests are more<br />
complex ecosystems than pastures. Table 2-5 shows typical impacts of urbanisation<br />
on stream habitats.<br />
Hawke‟s <strong>Bay</strong> <strong>Water</strong>way Guidelines Low Impact Design 20090406 27
Table 2-5<br />
Impacts of Urbanisation on Stream Habitats<br />
Adverse impacts<br />
Accelerated bank erosion<br />
Accelerated bank undercutting<br />
Increased siltation Stable habitats<br />
Elimination of meanders Rocks<br />
Channel widening Woody debris<br />
Reduced depth Aquatic plants<br />
Reduced baseflow Vegetated banks<br />
Increased flood flows<br />
Loss of shading<br />
Loss of pools<br />
Increased water temperature<br />
2.7.2 Ecological stress factors<br />
<strong>The</strong> main factors influencing plants and animals in streams are the following:<br />
Physical habitat<br />
Temperature<br />
Dissolved oxygen<br />
Suspended solids<br />
Stream flow<br />
Nutrients<br />
Light<br />
Contaminants<br />
Instream barriers<br />
Clearance of riparian vegetation<br />
Urbanisation results in impacts related to all of the above items. No one single item is<br />
of primary importance. If we are to reduce impacts to aquatic ecosystems, we must<br />
develop approaches to address all of the above items. Thus the LID design<br />
approaches listed in Section 4 attempt to reduce the impacts associated with each<br />
item.<br />
2.8 Importance of First and Second Order Streams<br />
When considering aquatic resource protection, it is important to consider the entire<br />
catchment and to recognise that all waterways regardless of how small are integral<br />
components of the whole. To understand the relative importance of each part it is<br />
helpful to classify streams in terms of their „order‟. Order is based upon smaller<br />
streams draining into larger ones. First order streams are catchment headwater<br />
streams. <strong>The</strong>y are generally the smallest streams and flow can be perennial or<br />
ephemeral. Second order streams are those formed by the junction of two first order<br />
streams. <strong>The</strong> junction of two second order streams forms a third order stream. A<br />
schematic representation of stream order is shown in Figure 2-10.<br />
<strong>The</strong> definition of what is a stream is not easily provided. <strong>The</strong>re are a number of<br />
definitions that are not necessarily in agreement with one another. <strong>The</strong> Resource<br />
Management Act does not define a stream but does define a river as:<br />
Hawke‟s <strong>Bay</strong> <strong>Water</strong>way Guidelines Low Impact Design 20090406 28
“River” means a<br />
continually or<br />
intermittently<br />
flowing body of<br />
fresh water; and<br />
includes a stream<br />
and modified<br />
watercourse; but<br />
does not include<br />
any artificial<br />
watercourse<br />
(including an<br />
irrigation canal,<br />
water supply race,<br />
canal for the<br />
Figure 2-10<br />
Conceptualisation of a Stream Hierarchy<br />
supply of water for electricity power generation, and farm drainage canal).<br />
To provide further guidance, a stream as discussed here will be a natural body of<br />
water, which includes a free flowing area of concentrated flow, an area having stable<br />
pools of water, a spring outfall, or a wetland. In the context of a stream, the area of<br />
concentrated flow shall have defined banks and bottom. This would not include areas<br />
of sheet or shallow concentrated flow such as swales or field flow.<br />
To provide specific information on the Auckland Region (a similar stream inventory<br />
has not been done for the Hawke‟s <strong>Bay</strong> Region) regarding streams and their order,<br />
including percentage of total length, a review of Auckland streams was done by<br />
NIWA (O‟Brien,1999), detailed in Table 2-6, and provides the following information.<br />
Table 2-6<br />
Stream Inventory Table<br />
Auckland Region Streams Number Length<br />
Order Number of Length (m) % of total Cumulative % of total Cumulative<br />
Streams % %<br />
1 810 1,961,112 60.18 60.18 68.25 68.25<br />
2 365 598,097 27.12 87.30 20.81 89.07<br />
3 108 187,888 8.02 95.32 6.54 95.60<br />
4 56 105,073 4.16 99.48 3.66 99.26<br />
5 7 21,233 0.52 100.00 0.74 100.00<br />
Total 1,346 2,873,403 100.00 100.00<br />
It is important to recognise that almost 70 percent of Auckland streams, in terms of<br />
total length, are first order streams. When combined with second order streams, that<br />
total increases to almost 90 percent. A similar review of U.S. streams indicates that<br />
approximately 70% of all streams are first and second order streams. It is not<br />
unreasonable to assume that between 70 - 90% of Hawke‟s <strong>Bay</strong> streams are first or<br />
second order streams. If it is a programme goal to protect third order or larger<br />
streams, that goal cannot be attained if first and second order streams are destroyed<br />
by mass earthworks or enclosed in pipes.<br />
Hawke‟s <strong>Bay</strong> <strong>Water</strong>way Guidelines Low Impact Design 20090406 29
2.9 Bibliography<br />
Auckland <strong>Regional</strong> Authority, Review Ecology of Streams, Upper Waitemata Harbour<br />
Catchment Study, 1983.<br />
Soil Conservation Service, Urban Hydrology for Small <strong>Water</strong>sheds, June 1986.<br />
State of Delaware, Conservation Design for Stormwater Management, 1997.<br />
McDowall, R. M., New Zealand Freshwater Fishes A Natural History and Guide,<br />
revised edition 1990.<br />
Horner R. R., Skupien J. J., Livingston E. H., Shaver H. E., Fundamentals of Urban<br />
Runoff Management: Technical and Institutional Issues, August, 1994<br />
Chow, V., T., Open - Channel Hydraulics, McGraw-Hill Publishing Company, 1959.<br />
Rosgen, Dave, Applied River Morphology, 1996<br />
O‟Brien, R., Auckland Stream Inventory, prepared for ARC Environment, NIWA Client<br />
Report: CHC99/4, February 1999.<br />
Hawke‟s <strong>Bay</strong> <strong>Water</strong>way Guidelines Low Impact Design 20090406 30