Water Chestnut (Trapa natans L.) Infestation in the ... - SUNY Oneonta
Water Chestnut (Trapa natans L.) Infestation in the ... - SUNY Oneonta
Water Chestnut (Trapa natans L.) Infestation in the ... - SUNY Oneonta

Create successful ePaper yourself
Turn your PDF publications into a flip-book with our unique Google optimized e-Paper software.
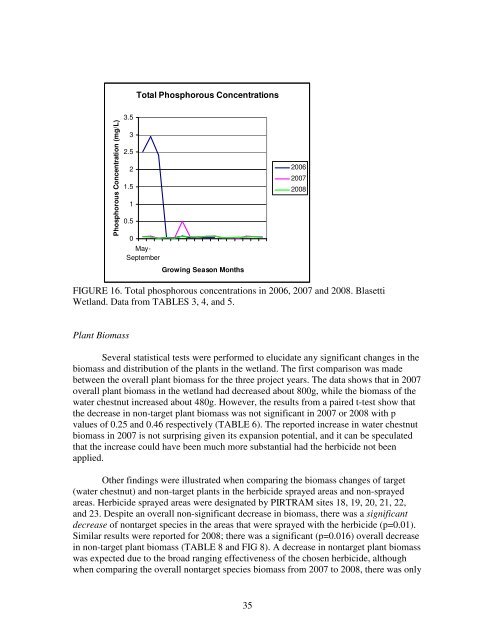
Phosphorous Concentration (mg/L)<br />
3.5<br />
3<br />
2.5<br />
2<br />
1.5<br />
1<br />
0.5<br />
0<br />
Total Phosphorous Concentrations<br />
May-<br />
September<br />
Grow<strong>in</strong>g Season Months<br />
FIGURE 16. Total phosphorous concentrations <strong>in</strong> 2006, 2007 and 2008. Blasetti<br />
Wetland. Data from TABLES 3, 4, and 5.<br />
Plant Biomass<br />
Several statistical tests were performed to elucidate any significant changes <strong>in</strong> <strong>the</strong><br />
biomass and distribution of <strong>the</strong> plants <strong>in</strong> <strong>the</strong> wetland. The first comparison was made<br />
between <strong>the</strong> overall plant biomass for <strong>the</strong> three project years. The data shows that <strong>in</strong> 2007<br />
overall plant biomass <strong>in</strong> <strong>the</strong> wetland had decreased about 800g, while <strong>the</strong> biomass of <strong>the</strong><br />
water chestnut <strong>in</strong>creased about 480g. However, <strong>the</strong> results from a paired t-test show that<br />
<strong>the</strong> decrease <strong>in</strong> non-target plant biomass was not significant <strong>in</strong> 2007 or 2008 with p<br />
values of 0.25 and 0.46 respectively (TABLE 6). The reported <strong>in</strong>crease <strong>in</strong> water chestnut<br />
biomass <strong>in</strong> 2007 is not surpris<strong>in</strong>g given its expansion potential, and it can be speculated<br />
that <strong>the</strong> <strong>in</strong>crease could have been much more substantial had <strong>the</strong> herbicide not been<br />
applied.<br />
O<strong>the</strong>r f<strong>in</strong>d<strong>in</strong>gs were illustrated when compar<strong>in</strong>g <strong>the</strong> biomass changes of target<br />
(water chestnut) and non-target plants <strong>in</strong> <strong>the</strong> herbicide sprayed areas and non-sprayed<br />
areas. Herbicide sprayed areas were designated by PIRTRAM sites 18, 19, 20, 21, 22,<br />
and 23. Despite an overall non-significant decrease <strong>in</strong> biomass, <strong>the</strong>re was a significant<br />
decrease of nontarget species <strong>in</strong> <strong>the</strong> areas that were sprayed with <strong>the</strong> herbicide (p=0.01).<br />
Similar results were reported for 2008; <strong>the</strong>re was a significant (p=0.016) overall decrease<br />
<strong>in</strong> non-target plant biomass (TABLE 8 and FIG 8). A decrease <strong>in</strong> nontarget plant biomass<br />
was expected due to <strong>the</strong> broad rang<strong>in</strong>g effectiveness of <strong>the</strong> chosen herbicide, although<br />
when compar<strong>in</strong>g <strong>the</strong> overall nontarget species biomass from 2007 to 2008, <strong>the</strong>re was only<br />
35<br />
2006<br />
2007<br />
2008