
You also want an ePaper? Increase the reach of your titles
YUMPU automatically turns print PDFs into web optimized ePapers that Google loves.
<strong>Bandolier</strong><br />
Independent evidence-based thinking about health care 150<br />
On reaching 150<br />
<strong>Bandolier</strong> some-<br />
<strong>Bandolier</strong>’s Little Book of Making Sense of the<br />
Medical Evidence<br />
times feels old,<br />
<strong>Bandolier</strong> is delighted to announce that its little book of<br />
just as if we have<br />
making sense of the medical evidence has been published<br />
been dug out of the<br />
by Oxford University Press. It provides practical guidelines<br />
ground and found<br />
on how to make sense of and interpret available evidence,<br />
as in inscription<br />
with information on how to avoid straying beyond evidence<br />
for future genera-<br />
into conjecture, supposition, and wishful thinking. It covers<br />
tions to scratch<br />
size, trial design, harm as well as benefi t, from randomised<br />
their heads over. There is a Churchillian expression that trials and observational studies, and includes as well in-<br />
sums up our attitude to life. A small prize for the fi rst person formation about diagnostic testing, health economics, and<br />
to email in what the expression may be.<br />
management evidence.<br />
On taking things on trust<br />
We take an awful lot of things on trust. Of course, some of<br />
us have more acutely tuned antennae for spotting nonsense<br />
than others, and <strong>Bandolier</strong> is all about spotting it, which is<br />
why we’ve even tuned it into a book.<br />
Times columnist Matthew Parris decided to source the barrage<br />
of advice about turning off electrical units on standby, a<br />
supposed major cause of wasted electricity. Little red lights<br />
wasted up to 10% of the electricity supply, or 1% of global<br />
carbon emissions. This was big. Even Andrew’s mother’s<br />
hairdresser’s friend knew about it, and religiously turned<br />
everything off.<br />
Matthew tracked down a review of the topic [1], and was<br />
astonished to fi nd that UK data was from a single study<br />
in only 32 homes. Whole-house measurements of standby<br />
power use in 21 studies had examined between 1 and 178<br />
homes. But worldwide results were pretty consistent, with<br />
annual standby use of 300-1000 kWh/year. The UK fi gure<br />
averaged 280 kWh/year, supposedly 8% of total residential<br />
electricity use, though in <strong>Bandolier</strong>’s mean (both meanings)<br />
pad it would be half that. Another review [2] estimates<br />
standby power uses 1.5% of all electricity consumption<br />
in OECD countries: a small percentage but an awful lot of<br />
power.<br />
Redesigning circuits could reduce standby power consumption<br />
by 90%. Standby power use by individual appliances<br />
varies up to 20-fold. The message is not just about taking<br />
fi gures on trust, but governments getting a grip on what is<br />
known doing something, rather than just bleating at us.<br />
1 AK Meier. A worldwide review of standby power use in<br />
homes. 2001 Lawrence Berkeley National Laboratory. Paper<br />
LBNL-49377: repositories.cdlib.org/lbnl/LBNL-49377.<br />
2 B Mohanty. Standby power losses in household electrical<br />
appliances and offi ce equipment. Presented in 2001.<br />
The book's origins lie in lectures for medical students,<br />
healthcare professionals, and journalists. It was not written<br />
as a comprehensive manual for those who want to do<br />
a systematic review or meta-analysis, nor as a statistical or<br />
methodological textbook. Rather, summarises tools <strong>Bandolier</strong><br />
uses to assess evidence, to be able to distinguish good<br />
evidence from bad. It will (hopefully) be an invaluable resource<br />
for university course and GP tutors, family doctors,<br />
hospital consultants involved in research, pharmacists, and<br />
anyone interested in evidence-based health care.<br />
Why did we write it? Reasons stem from writing 150 issues<br />
of <strong>Bandolier</strong>, trying to get our brains around why things<br />
seem so complicated, and then trying to explain it simply to<br />
others. We have been helped by being intimately involved<br />
in over 100 systematic reviews in different areas, and trying<br />
to get to grips with some of the methodological complexities<br />
that can help, and sometimes hinder.<br />
Much wool is being be pulled over many eyes, and from<br />
many different directions. Our working theme was one of<br />
bullshit detection. If it helps some of you become bullshit<br />
detectors, then we will be happy with that result. Buy it if<br />
you like, but it won’t make <strong>Bandolier</strong> rich.<br />
Available from Oxford University Press<br />
Flexicovers / 0-19-856604-2 / 978-0-19-856604-5 / £24.95<br />
2006 / 440 pp / 164 illustrations<br />
In this issue<br />
Marijuana smoking and lung cancer ...................p. 2<br />
Statins and albuminuria .........................................p. 3<br />
Sudden cardiac death .............................................p. 4<br />
Mosquito repellent evidence .................................p. 5<br />
Industry bias in clinical trials ................................p. 6<br />
BNP cost-effectiveness ...........................................p. 8<br />
August 2006 Volume 13 Issue 8 £3.00<br />
www.ebandolier.com 1<br />
<strong>Bandolier</strong> 150 .
DOES SMOKING MARIJUANA CAUSE<br />
LUNG CANCER?<br />
One might well think so. We know that burning plant<br />
products produces smoke, which contains tars, carcinogens,<br />
and other unpleasant compounds. We know that breathing<br />
smoke gets these materials deep into our lungs – which is<br />
why, in part, inhaling drugs can be an important option for<br />
drug delivery. We know that breathing smoke regularly, as<br />
in cigarette and other tobacco smoking, leads to increased<br />
rates of lung cancer, in a dose dependent manner. OK, we<br />
don’t have much in the way of randomised trials in humans,<br />
but we have mountains of observational data.<br />
So our starting point is to expect marijuana smoking to<br />
cause cancer, by simple analogy. But some might want the<br />
evidence for this, which is where it gets complicated. A systematic<br />
review [1] helps, because it has looked for evidence<br />
from various sources to test the biological plausibility that<br />
smoking marijuana causes lung cancer.<br />
Systematic review [1]<br />
The review used a broad search strategy for experimental<br />
studies of any design published up to the end of 2005, but<br />
only in English. The 19 that were finally included were<br />
divided into which relationship was investigated between<br />
marijuana smoking and possible lung cancer.<br />
Results<br />
These are summarised in Table 1. Five general areas were<br />
examined, the relationship between marijuana smoking and<br />
exposure to tar, cytology of sputum, changes in alveolar<br />
macrophages and bronchial biopsies, and epidemiological<br />
studies examining lung cancer or related conditions.<br />
Smoking marijuana led to increased tar delivery, more cellular<br />
changes in sputum, damage to alveolar macrophages,<br />
and increased abnormality in bronchial biopsies, with increased<br />
surrogate markers for lung cancer.<br />
The epidemiological studies did not find any consistent<br />
relationship between marijuana smoking and cancer of all<br />
sites, though the bulk of the participants were from a retrospective<br />
review of a health plan from the early 1980s. Small<br />
studies of a few hundred patients indicated non-significant<br />
increases in lung cancer with marijuana smoking.<br />
Comment<br />
There is abundant circumstantial evidence pointing to a<br />
plausible biological relationship between marijuana smoking<br />
and lung cancer. We may be lacking the smoking gun,<br />
but few juries could fail to convict on this evidence.<br />
We have the advantage of knowing that consistent smoke<br />
inhalation, whether tobacco, marijuana, or anything else, is<br />
a really bad thing. For instance, the high incidence of lung<br />
cancer among non-smoking Chinese women in Hong Kong<br />
has been linked, at least in part, to cooking fumes associated<br />
with frying [2]. Smoke in wildland fires in the USA has at<br />
least 15 carcinogens, and risk assessment for firefighters<br />
with chronic smoke exposure includes a significant excess<br />
of cancers [3]. This allows us to be even more certain of a<br />
probable link between marijuana smoking and lung cancer,<br />
and not to be too hung up about wanting more evidence.<br />
References:<br />
1 R Mehra et al. The association between marijuana<br />
smoking and lung cancer. A systematic review. Archives<br />
of Internal Medicine 2006 166: 1359-1367.<br />
2 IT Yu et al. Dose-relationship between cooking fumes<br />
exposures and lung cancer among Chinese nonsmoking<br />
women. Cancer Research 2006 66: 4961-4967.<br />
3 TF Booze et al. A screening-level assessment of the<br />
health risks of chronic smoke exposure for wildland<br />
firefighters. Journal of Occupational and Environmental<br />
Hygiene 2004 1: 296-305.<br />
Table 1: Summary of studies of association between marijuana smoking and lung cancer<br />
Type of study Number Synopsis<br />
Exposure to tar 4 experimental studies with 45<br />
participants<br />
Cytomorphology of sputum<br />
samples<br />
Alveolar macrophage<br />
changes<br />
Histopathology and<br />
molecular alterations in<br />
bronchial biopsies<br />
Lung cancer or related<br />
outcomes<br />
Smoking marijuana is associated with increased tar delivery to the<br />
lungs, to a greater extent than smoking cigarettes, perhaps by a<br />
factor of three<br />
2 studies with 150 participants Marijuana smokers who did not use tobacco had more metaplastic<br />
cells, pigmented macrophages and columnar cells than<br />
nonsmokers. Dysplasia in 0% of non-smokers, but 12% and 4% of<br />
tobacco or marijuana smokers<br />
3 studies with 128 participants Alveolar macrophages from marijuana smokers had less tumoricidal<br />
ability, enhanced oxidative stress, and a dose-dependent<br />
relationship between THC and reactive oxygen species. Possibly<br />
increased DNA damage<br />
6 studies with 494 participants<br />
undergoing bronchoscopy<br />
4 studies with 65,000<br />
participants, predominantly in<br />
a single study<br />
Increase in abnormal and precancerous findings in marijuana<br />
smokers compared with tobacco smokers. Surrogate markers for<br />
lung malignancy more often found in marijuana smokers<br />
No relationship between marijuana smoking and diagnosis of lung<br />
cancer. Limited evidence of higher use of marijuana in younger<br />
patients with lung cancer<br />
<strong>Bandolier</strong> 150 2<br />
www.ebandolier.com
STATINS AND ALBUMINURIA<br />
There are times when you just don’t know what to think<br />
of evidence, especially when it comes on a topic that one’s<br />
tired mind has not considered before. Is it overwhelming,<br />
underwhelming, or something in between? A systematic<br />
review [1] looking at the effects of statins on urinary albumin<br />
or protein excretion is a useful example of how to look at<br />
evidence, over and above being of interest in itself.<br />
Systematic review<br />
Many databases were searched for randomised studies in<br />
adults of statin compared with placebo, with urinary excretion<br />
of albumin or protein as an outcome. Information<br />
required was the mean baseline and final excretion rates<br />
for statin and placebo groups. Prior intent was to analyse<br />
according to the level of albumin or protein excretion, with<br />
below 30 mg/day as normal excretion, between 30 and 299<br />
mg/day as microalbuminuria, and 300 mg/day or more<br />
being macroalbuminuria.<br />
Results<br />
Fifteen trials with 1,384 participants were found. Three trials<br />
with 938 patients had normal urinary albumin excretion<br />
(based on average of all patients), six (171 patients) had<br />
microalbuminuria, and six (275 patients) had macroalbuminuria<br />
or proteinuria above 300 mg/day. Two of the trials<br />
were not double blind, and one had no clear eligibility<br />
criteria.<br />
There was clinical heterogeneity between studies, with<br />
causes of raised albumin including diabetes, IgA nephropa-<br />
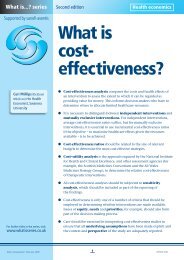
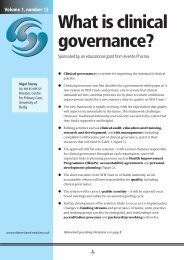
Figure 1: Individual studies showing baseline and<br />
final urinary albumin excretion, by normal albumin<br />
excretion, and micro- and macroalbuminuria<br />
10000<br />
1000<br />
100<br />
10<br />
1<br />
Mean final albumin or protein excretion mg/day<br />
Normal Micro Macro<br />
500<br />
250<br />
thy, hypertension, and complex kidney disease, or not being<br />
reported in one trial. There was one large trial, but most<br />
were small, with only eight patients treated with statins in<br />
two trials. Trial duration was three to 46 months, with most<br />
between three and 12 months.<br />
The results of the statin treatment arms in individual trials<br />
are shown in Figure 1, using a logarithmic scale because<br />
baseline excretion varied between
SUDDEN CARDIAC DEATH<br />
It becomes obvious when one begins to write about risk, as<br />
<strong>Bandolier</strong> has been doing in recent issues, that some sort of<br />
background is needed. Risk examines mainly serious consequences,<br />
most often death. While Keynes’ dictum about us<br />
all being dead in the long run is all very well, it is the short<br />
run that we worry about most.<br />
So what is the chance of us dying tomorrow, from anything,<br />
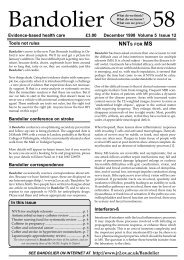
or from something? Figure 1 shows UK data on mortality<br />
from 2003, by age and by sex. It tells us what we already<br />
know, that our risk of dying increases as we get older, and<br />
is higher for men (filled symbols) than women (open symbols)<br />
at almost all ages. Of course, these are averages, and<br />
people leading healthy lifestyles are likely always to have<br />
lower risk than those who do not.<br />
What about looking at particular causes of death? Governments<br />
produce lots of useful information, and in the UK<br />
there have been impressive reductions since 1979 in death<br />
rates for both sexes, at almost all ages, but especially in<br />
middle age, and from many causes. But if we want answers<br />
to more specific questions, we have turn to the epidemiologists.<br />
So let’s look at sudden cardiac death, where definitions<br />
have changed in recent years, with the time interval<br />
between onset of symptoms and death reduced from 24 to<br />
one hour.<br />
Study<br />
The study [1] was conducted in Holland using an electronic<br />
database of about 500,000 people registered with a general<br />
practitioner. The records contain coded comprehensive and<br />
anonymous data that allows for epidemiological studies. In<br />
this case the study was over six years, from 1995 to 2001,<br />
in people aged 18 years or older, registered for at least one<br />
Figure 1: Risk of death in UK by age and sex, for 2003.<br />
Open symbols, women; solid circles, men<br />
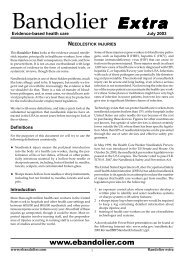
Figure 2: Incidence of sudden cardiac death in<br />
Holland, by year<br />
Sudden cardiac death, per 1,000 person years<br />
1.2<br />
1.1<br />
1<br />
0.9<br />
0.8<br />
0.7<br />
0.6<br />
96 97 98 99 '00<br />
year. Medical records of all deaths were examined to classify<br />
the circumstances, whether the death could be classified as<br />
cardiac, and whether people were previously in good health.<br />
Only deaths from suicide and in patients with cancer were<br />
excluded from examination.<br />
Results<br />
Annual risk of death in UK, 2003, by age and by sex<br />
Age 1-14 years<br />
Age 15-44 years<br />
Age 45-64 years<br />
Age 65-84 years<br />
Age ≥85 years<br />
The final population was 250,000 people, with a median<br />
age of 40 years, and 51% female. There were 4,892 deaths,<br />
of which 582 (12%) were probable sudden cardiac deaths.<br />
The median age of cases was 72 years, with 59% male. The<br />
median age of male cases was 70 years, compared with 76<br />
years for female cases.<br />
Sudden death was witnessed in 354 cases, with 76% occurring<br />
in the home, 14% in a public place and 5% in an<br />
ambulance or on arrival at hospital. In the 228 unwitnessed<br />
cases, the majority occurred at home when a place was<br />
mentioned.<br />
The incidence of sudden cardiac death declined slightly over<br />
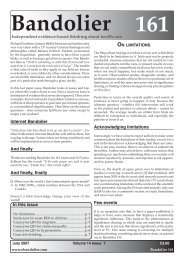
the period (Figure 2). The incidence increased with age in<br />
women and men (Figure 3), with and<br />
age adjusted rate of 2.3.<br />
The incidence was highest in October,<br />
and lowest in August, with more<br />
cases on Mondays and Tuesdays than<br />
Thursdays.<br />
Comment<br />
As always, it is useful to recognise that<br />
stuff happens. Whoever and wherever<br />
we are, bad things can come out of<br />
that blue sky, sometimes without any<br />
warning. For men over the age of 70<br />
years, 1 in 100 are likely to have a sudden<br />
cardiac death each year. For men<br />
in their 60s, sudden cardiac death runs<br />
at about 2 per 1000, or 1 in 500. That is<br />
40 times more likely than being killed<br />
in a road traffic accident.<br />
<strong>Bandolier</strong> 150 4<br />
So if we put our seat belts on when we<br />
drive to keep us safe, and avoid doing<br />
crazy things on the road, it makes even<br />
www.ebandolier.com
Figure 3: Incidence of sudden cardiac death in Holland, by age and sex<br />
Sudden cardiac death, per 1,000 person years<br />
12<br />
10<br />
8<br />
6<br />
4<br />
2<br />
0<br />
Women<br />
Men<br />
18-50 51-55 56-60 61-65 66-70 71-75 76-80 >80<br />
Age (years)<br />
more sense to avoid doing crazy things with our hearts. Not<br />
smoking, eating healthily, and a modicum of exercise and<br />
alcohol makes sense, really. If a behaviour is less risky than<br />
driving (chance of dying 1 in 20,000 per year) we probably<br />
accept it. Having an unhealthy lifestyle is much, much,<br />
more risky than that.<br />
Avoiding being bitten by mosquitoes<br />
or other little nasties is usually about<br />
preventing discomfort in the short or<br />
medium term. Because those little nasties<br />
can sometimes be vectors of several<br />
unpleasant diseases in different parts of<br />
the world, though, it can be more important<br />
than that. So, as one <strong>Bandolier</strong> reader asked, what’s<br />
the evidence for which repellent works best?<br />
This is not quite so easy to answer as one might think, because<br />
the number of variables is legion. The mosquito, for<br />
a start. It’s sex, the number of them, how hungry they are,<br />
the temperature, humidity, and wind speed can all affect<br />
the likelihood of being bitten, with or without any repellent<br />
present. So controlled laboratory tests are the order<br />
of the day, and the best is a study looking at 16 different<br />
repellents tested in 15 intrepid volunteers in controlled<br />
circumstances [1].<br />
The test<br />
Basically, the test comprised one arm being placed in a cage<br />
containing a fixed number of unfed mosquitoes and measuring<br />
how long it took until the first bite. Cages contained<br />
10 disease-free female Aedes aegypti mosquitoes between<br />
seven and 24 days old, reared in a laboratory, and not previously<br />
exposed to a repellent. Temperature, humidity and<br />
light-dark cycles were controlled.<br />
Before each test, the readiness of mosquitoes to bite was<br />
measured by inserting an untreated arm, and observing five<br />
mosquito landings on the arm. Repellent was then applied<br />
(or worn in the case of wristbands), and the arm reinserted,<br />
according to a set schedule.<br />
Simply, this started with insertion of the treated arm for<br />
one minute in every five for the first 20 minutes, then one<br />
minute every 15 minutes until the first bite, the time of which<br />
Reference:<br />
1 SM Straus et al. The incidence of sudden cardiac<br />
death in the general population. Journal of Clinical<br />
Epidemiology 2004 57: 98-102.<br />
MOSQUITO REPELLENT EVIDENCE<br />
Table 1: Complete protection time against<br />
mosquito bite<br />
Active ingredient<br />
Synthetics<br />
Mean complete<br />
protection time<br />
(minutes)<br />
DEET, 24% 302<br />
DEET, 20% 234<br />
DEET, 6.7% 112<br />
DEET, 4.8% 88<br />
IR3535, 7.5%<br />
Natural products<br />
23<br />
Soybean oil, 2% 95<br />
Citronella, 10% 20<br />
Citronella, 12% plus other oils 19<br />
Citronella, 10% plus peppermint 14<br />
Citronella, 5% 14<br />
Citronella, 1% bath oil 10<br />
Uncertain mix bath oil 10<br />
Citronella, 0.05%<br />
Wristbands<br />
2.8<br />
DEET, 9.5% wristband 0.3<br />
DEET, 9.5% wristband 0.2<br />
Citronella, 25% wristband 0.2<br />
Products were applied to the skin from elbow to fingertips,<br />
except wristbands.<br />
was recorded. Each volunteer made three measures for<br />
each repellent. This was done for each of 16 commercially<br />
obtained products. The order of testing was determined by<br />
a random number generator for each subject.<br />
www.ebandolier.com 5<br />
<strong>Bandolier</strong> 150
Results<br />
The results are shown in Table 1. Certain results are obvious.<br />
• No wristband worked.<br />
• Natural products or oils were ineffective, except for<br />
about 1.5 hours of protection with a product containing<br />
soybean oil.<br />
• The European product IR3535 was ineffective.<br />
• DEET at higher concentrations applied to the skin provided<br />
up to five hours of complete protection against<br />
mosquito bites.<br />
Comment<br />
This paper tested 16 products available commercially in the<br />
USA. It was one of those studies, beautifully done, that did<br />
not need statistics. The answer was obvious.<br />
But all may not be up for natural products, or different<br />
products available in different countries, though we could<br />
not find any that had been tested in the same stringent<br />
way. For instance, testing of 38 essential oils in laboratory<br />
conditions found that only four (citronella, patchuli, clove,<br />
and makaen) gave two hours protection, and only at 100%<br />
concentration [2]. Diluted to 50% or 10%, they were largely<br />
ineffective, echoing the US findings [1]. However, three commercially<br />
available products in South Africa (one with 15%<br />
DEET, one with another synthetic agent, and one containing<br />
a mixture of oils) all produced 3-4 hours of almost complete<br />
protection, though the natural oil product declined rapidly<br />
after that time [3].<br />
Undoubtedly there is more literature than this, but right<br />
now, unless there is good data to show that another product<br />
works, choosing DEET repellent products is the sensible<br />
and safe thing to do. For travellers, the Centres for Disease<br />
Control has much useful advice about general preventative<br />
measures and repellents, at www2.ncid.cdc.gov/travel<br />
(look for the yellow book section). The main points are:<br />
• Use repellent on exposed skin, but not on cuts, wounds,<br />
or irritated skin. Wash off repellent when you come<br />
indoors again.<br />
• Avoid known foci of disease transmission. Simple changes<br />
in itinerary can greatly reduce risk. Avoid times when<br />
mosquitoes are most active, in twilight for instance.<br />
• Wear long sleeved shirts, long trousers, minimise exposed<br />
skin. Tuck trousers into socks.<br />
• Use bed nets and gear with repellents.<br />
References:<br />
1 MS Fradin, JF Day. Comparative efficacy of insect<br />
repellents against mosquito bites. NEJM 2002 347: 13-<br />
18.<br />
2 Y Trongtokit et al. Comparative repellency of 38<br />
essential oils against mosquito bites. Phytotherapy<br />
Research 2005 19: 303-309.<br />
3 J Govere et al. Efficacy of three insect repellents<br />
against the malaria vector Anopheles arabiensis.<br />
Medical and Veterinary Entomology 2000 14: 441-444.<br />
INDUSTRY BIAS IN CLINICAL TRIALS?<br />
We have become used to finding potential sources of bias in<br />
clinical trials. What we find is usually empirical evidence of<br />
bias from some examples, and then we look for the possibility<br />
that bias from that particular source might be affecting<br />
other results we are considering. If there is sufficient information,<br />
we might test whether that bias exists in our data<br />
using a sensitivity analysis. As a simple example, we might<br />
test randomised or double blind studies against those that<br />
are not randomised or double blind.<br />
Industry bias<br />
The majority of clinical and laboratory work undertaken<br />
is funded by industry, small or large. Concerns have been<br />
expressed about whether this can lead to bias, and there is<br />
a considerable, if somewhat confused, literature. In part<br />
this is because at least two possible issues come under this<br />
heading:<br />
1 Marketing bias. Companies want to present their products<br />
in the best possible light, and will be selective about<br />
what they say. This applies to small spin-offs looking for<br />
development capital, to large organisations seeking to<br />
market new pharmaceuticals, tests, or devices.<br />
2 Sponsorship bias. Narrowly defined, this is whether the<br />
source of funding for a clinical trial affects the results of<br />
the clinical trials in a systematic way.<br />
The existence of marketing bias would be conceded universally.<br />
It is part of the world we work in. You don’t see<br />
adverts, for instance, saying that margarine tastes worse<br />
than butter. Every book on the bookstand is an international<br />
best seller.<br />
Whether sponsorship bias exists, though, is another matter.<br />
Although there have been many reviews claiming the<br />
existence of industry bias, these have typically made a heap<br />
of what they could find, irrespective of criteria of quality,<br />
validity, and size, and have typically not compared like with<br />
like. A new systematic review [1] is possibly the first to look<br />
specifically at whether sponsorship bias exists in clinical<br />
trials, and gives a useful summary of some of the reviews<br />
that claim to have found industry bias.<br />
Review<br />
The review used existing meta-analyses of high quality<br />
acute pain and migraine interventions, which had chosen<br />
randomised and double blind trials that were valid, used a<br />
defined dose, and used consistent methods, had the same<br />
outcomes measured over the same time, and where there<br />
was a large amount of information. These were oral aspirin<br />
600/650 mg, paracetamol 1000 mg, ibuprofen 400 mg and<br />
rofecoxib 50 mg in acute pain, and oral sumatriptan 100 mg<br />
and 50 mg for migraine; all were compared with placebo.<br />
The intention was to compare efficacy in trials sponsored<br />
by for-profit organisations with those without for-profit<br />
sponsorship.<br />
<strong>Bandolier</strong> 150 6<br />
www.ebandolier.com
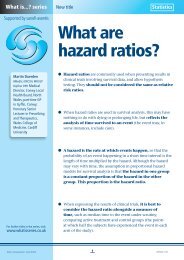
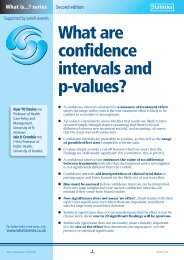
Figure 1: Strategy for examining the existence of differential sponsorship bias in randomised trials<br />
in acute pain and migraine where source of sponsorship was definite<br />
Results<br />
Of 176 individual trials, only two could be identified as being<br />
definitely sponsored by non-profit sources, compared<br />
with 144 sponsored by for-profit sources. No statement was<br />
made in 31 trials. Clearly no comparison between for-profit<br />
and not for-profit sponsorship was possible.<br />
An alternative strategy was used (Figure 1). In the 143 forprofit<br />
trials, a distinction was made between trials where<br />
a drug was being used as a test, or as a comparator. The<br />
argument was that if bias existed, there would be conflicts<br />
of interest within industry-sponsored trials. The bias should<br />
act to maximise efficacy when a drug was used as the test<br />
drug (the aim being to make it look as good as possible),<br />
and to minimise efficacy when the same drug was used as<br />
a comparator (the aim being to minimise efficacy compared<br />
to a second, newer, test drug).<br />
When this strategy was applied to four analgesics in acute<br />
pain trials, no difference in efficacy was found (Figure 2)<br />
as measured by the NNT for at least half pain relief over<br />
4-6 hours compared with placebo. For sumatriptan in acute<br />
migraine, there were no consistent differences at 50 mg or<br />
100 mg, for three different outcomes.<br />
Comment<br />
Test<br />
53<br />
90<br />
Comparator<br />
The conclusion here was that the only way of testing these<br />
studies was to look for differential sponsorship bias. When<br />
sought, no bias was found. It looks very much as if for-profit<br />
industry sponsorship does not influence the outcome of<br />
good quality, randomised trials in acute pain and migraine.<br />
There are also examples of large, high quality for-profit and<br />
not for-profit sponsorship trials of statins and finasteride<br />
giving essentially the same result.<br />
For-profit Not for-profit<br />
143 2<br />
• Numbers in the arrows refer to the number of trials found of<br />
aspirin, paracetamol, ibuprofen and rofe coxib in acute pain, and<br />
sumatriptan in migraine<br />
• 143 of 176 tri als were definitely sponsored by for-profit<br />
organisations , only 2 definitely sponsored by not for-profit<br />
organisations<br />
• Of the 143 trials, 53 used the drug as the test, and 9 0 as the<br />
comparator<br />
Figure 2: NNT for four analgesics in identical<br />
randomised, double blind acute pain trials<br />
reporting the same outcome over the same<br />
period of time, where drug was used as test or<br />
comparator<br />
Aspirin 600/650 mg<br />
Ibuprofen 400 mg<br />
Paracetamol 1000 mg<br />
Rofecoxib 50 mg<br />
1 2 3 4 5 6<br />
NNT for at least 50% pain relief over 6 hours cf placebo<br />
www.ebandolier.com 7<br />
<strong>Bandolier</strong> 150<br />
Test<br />
Comparator<br />
This is very good news, and should be looked at in other<br />
areas. Had differential sponsorship bias been found, it<br />
would mean that we would probably not be able to trust<br />
randomised trials, since almost all have for-profit sponsorship.<br />
That would have been a bit of a blow.<br />
The paper [1] gives examples, though, of marketing bias,<br />
where individual trials with particular beneficial characteristics<br />
were picked out for special marketing attention.<br />
The lesson is to treat all sources of information, industry or<br />
other, as if they were used car salespeople trying to sell you<br />
a dud. Ask for the evidence, and accept only good evidence,<br />
not airy-fairy nonsense about contented customers. If they<br />
can't show it, it may be because there isn't any. Never mind<br />
the shine, look for the quality.<br />
Reference:<br />
1 J Barden et al. Bias from industry trial funding? A<br />
framework, a suggested approach, and a negative<br />
result. Pain 2006 121: 207-218.
COST EFFECTIVENESS OF<br />
BNP TESTING<br />
<strong>Bandolier</strong> 149 examined a systematic review of the accuracy<br />
of BNP testing. It showed that in secondary care situations<br />
where about 50% of patients had heart failure according to<br />
gold standard diagnostic procedures, the test had reasonable<br />
accuracy, though that depended somewhat on the<br />
cut-off values set in individual studies. That leaves open<br />
the question of whether it is not only useful clinically, but<br />
whether also cost effective. A new randomised trial suggests<br />
that it is [1].<br />
Trial<br />
This was conducted on 452 patients presenting with acute<br />
dyspnoea to the emergency department of a Swiss university<br />
hospital. Trauma patients, and those with severe renal<br />
disease or cardiogenic shock were excluded. Randomisation<br />
was to a diagnostic strategy that included measurement of<br />
BNP, or a conventional diagnostic strategy.<br />
Two BNP cut-offs were used to separate heart failure from<br />
other causes of acute dyspnoea, less than 100 ng/L to rule<br />
out heart failure, and >500 ng/L to rule in heart failure. In<br />
this case rapid therapy with diuretics, nitroglycerin, and<br />
ACE inhibitors was recommended. Patients in the control<br />
group were examined and treated according to most recent<br />
guidelines.<br />
Various outcomes were recorded over six months, includeing<br />
mortality, time in hospital, and costs. These were analysed<br />
for the initial hospital visit, and at 90 and 180 days.<br />
Results<br />
Patients had an average age of 71 years, about 40% were<br />
women, and they were comparable in terms of baseline characteristics.<br />
Follow up was complete in all but one patient.<br />
Figure 1: Total treatment costs with emergency<br />
room BNP testing or conventional diagnostic<br />
strategy in patients admitted with acute dyspnoea<br />
12000<br />
10000<br />
8000<br />
6000<br />
4000<br />
2000<br />
Average total treatment cost (US$)<br />
BNP Control<br />
Acute heart failure was the final discharge diagnosis in<br />
45% in the BNP group and 51% in the control group, with<br />
exacerbated COPD or asthma in 23% and 11% respectively.<br />
In the BNP group, BNP levels were less than 100 ng/L in<br />
36%, between 100 and 500 ng/L in 28%, and above 500<br />
ng/L in 36%.<br />
In patients in whom BNP had been used diagnostically,<br />
compared with the control group using standard diagnostic<br />
procedures, there was significantly less use of intensive care<br />
beds, 15% of patients compared with 24%, 10 vs 18 hours<br />
average use per patient, and 6% rather than 12% of patients<br />
required any ventilatory support. There was insignificant<br />
but consistently less use of echocardiography (40% vs 49%)<br />
and coronary angiography (5% vs 9%).<br />
Patients in the BNP group required fewer days in hospital,<br />
8 vs 10 following the initial visit, with a greater difference<br />
of 10 vs 14 days over 180 days. Initially and over 180 days,<br />
mortality was lower, by about 2 or 3 per 100 patients.<br />
Total treatment costs were lower when BNP tests were<br />
used for the initial diagnosis, at all stages during the first<br />
180 days (Figure 1). The average saving per patient initially<br />
was $1,900, rising to $2,600 over 180 days. Medication costs<br />
were the same, and most of the saving came from reduced<br />
use of hospital beds.<br />
Comment<br />
Isn’t it terrific when it all comes together? If good systematic<br />
reviews of good studies of diagnostic tests are rare as<br />
hens’ teeth (as in <strong>Bandolier</strong> 149), then good randomised<br />
trials of effectiveness with good cost information are even<br />
rarer. This formidable study from Switzerland even comes<br />
with modelling around how this looks in a cost-effectiveness<br />
plane looking at costs and mortality. Most of 5,000<br />
simulations were in the dominant quadrant of lower cost<br />
and lower mortality with use of BNP tests in the emergency<br />
department.<br />
A word of caution, though. This is a particular, and probably<br />
most important, use of BNP in secondary care. How the<br />
model would work in a primary care situation is something<br />
we do not yet know with the same degree of certainty. More<br />
thinking still needs to be done for that setting.<br />
Reference:<br />
EDITORS<br />
Andrew Moore Henry McQuay<br />
Pain Relief Unit<br />
The Churchill, Oxford OX3 7LJ<br />
Editorial office: 01865 226132<br />
Editorial fax: 01865 226978<br />
Email: andrew.moore@pru.ox.ac.uk<br />
Internet: www.ebandolier.com<br />
ISSN 1353-9906<br />
0<br />
Initial 90 days 180 days<br />
1 C Mueller et al. Cost-effectiveness of B-type natriuretic<br />
peptide testing in patients with acute dyspnoea.<br />
Archives of Internal Medicine 2006 166: 1081-1087.<br />
<strong>Bandolier</strong> 150 8<br />
www.ebandolier.com