climate change, disaster risk - Open Knowledge Repository - World ...
climate change, disaster risk - Open Knowledge Repository - World ...
climate change, disaster risk - Open Knowledge Repository - World ...

You also want an ePaper? Increase the reach of your titles
YUMPU automatically turns print PDFs into web optimized ePapers that Google loves.
Public Disclosure Authorized<br />
Public Disclosure Authorized<br />
Public Disclosure Authorized<br />
blic Disclosure Authorized<br />
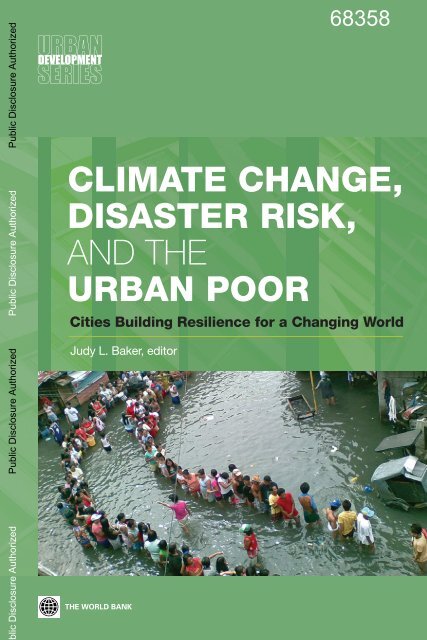
CLIMATE CHANGE,<br />
DISASTER RISK,<br />
AND THE<br />
URBAN POOR<br />
Cities Building Resilience for a Changing <strong>World</strong><br />
Judy L. Baker, editor
CLIMATE CHANGE,<br />
DISASTER RISK,<br />
AND THE URBAN<br />
POOR
CLIMATE<br />
CHANGE,<br />
DISASTER RISK,<br />
AND THE URBAN<br />
POOR<br />
Cities Building Resilience for a<br />
Changing <strong>World</strong><br />
Judy L. Baker, Editor
© 2012 Th e International Bank for Reconstruction and Development / Th e <strong>World</strong> Bank<br />
1818 H Street NW<br />
Washington DC 20433<br />
Telephone: 202-473-1000<br />
Internet: www.worldbank.org<br />
All rights reserved<br />
1 2 3 4 15 14 13 12<br />
Th is volume is a product of the staff of the International Bank for Reconstruction and<br />
Development / Th e <strong>World</strong> Bank. Th e fi ndings, interpretations, and conclusions expressed<br />
in this volume do not necessarily refl ect the views of the Executive Directors of Th e <strong>World</strong><br />
Bank or the governments they represent.<br />
Th e <strong>World</strong> Bank does not guarantee the accuracy of the data included in this work. Th e<br />
boundaries, colors, denominations, and other information shown on any map in this work<br />
do not imply any judgement on the part of Th e <strong>World</strong> Bank concerning the legal status of<br />
any territory or the endorsement or acceptance of such boundaries.<br />
Rights and Permissions<br />
Th e material in this publication is copyrighted. Copying and/or transmitting portions or<br />
all of this work without permission may be a violation of applicable law. Th e International<br />
Bank for Reconstruction and Development / Th e <strong>World</strong> Bank encourages dissemination of<br />
its work and will normally grant permission to reproduce portions of the work promptly.<br />
For permission to photocopy or reprint any part of this work, please send a request<br />
with complete information to the Copyright Clearance Center Inc., 222 Rosewood Drive,<br />
Danvers, MA 01923, USA; telephone: 978-750-8400; fax: 978-750-4470; Internet: www.<br />
copyright.com.<br />
All other queries on rights and licenses, including subsidiary rights, should be<br />
addressed to the Offi ce of the Publisher, Th e <strong>World</strong> Bank, 1818 H Street NW, Washington,<br />
DC 20433, USA; fax: 202-522-2422; e-mail: pubrights@worldbank.org.<br />
ISBN: 978-0-8213-8845-7<br />
eISBN: 978-0-8213-8960-7<br />
DOI: 10.1596/978-0-8213-8845-7<br />
Cover design: Naylor Design, Inc.<br />
Cover photo: iStockphoto.com<br />
Library of Congress Cataloging-in-Publication Data has been requested
Contents<br />
Foreword xiii<br />
Acknowledgments xv<br />
Abbreviations xvii<br />
Overview<br />
Recommended Actions to Build Resilience of the<br />
1<br />
Urban Poor 2<br />
Chapter 1. Vulnerable Cities: Assessing Climate Change<br />
and Disaster Risk in Urban Centers of the<br />
Developing <strong>World</strong> 7<br />
Introduction and Objective of the Study 7<br />
Background, Analytical Framework, and Approach<br />
Climate Change, Disaster Risk, and Urban Areas:<br />
9<br />
Assessing Hazard Risk 12<br />
Efforts to Estimate Exposure in Cities 22<br />
Notes 23<br />
References 23<br />
Chapter 2. Vulnerability of the Urban Poor 27<br />
Exposure: Location and Settlement Patterns of the<br />
Urban Poor 28<br />
Climate Change, Disaster Risk, and the Delivery of<br />
Basic Services for the Urban Poor 38<br />
Other Key Issues Affecting the Vulnerability of the<br />
Urban Poor 51<br />
■ v
vi ■ CONTENTS<br />
Notes 58<br />
References 59<br />
Chapter 3. Building Resilience for the Urban Poor 63<br />
Assessing Risk at the City and Community Levels<br />
to Inform Decision Making and Action Planning 64<br />
Integrating Climate Change and Disaster Risk<br />
Reduction Policies for the Poor into Urban Planning<br />
and Management 70<br />
Balancing Policy Tradeoffs among Risk Reduction,<br />
Urban Development, and Poverty Reduction in<br />
Decision Making 76<br />
Strengthening Institutional Capacity to Deliver Basic<br />
Services and Reduce Vulnerability to Climate and<br />
Disaster Risk 86<br />
Bridging Communities and Local Governments to<br />
Work Together on Local Solutions 89<br />
Notes 94<br />
References 94<br />
Chapter 4. <strong>Open</strong>ing New Finance Opportunities for<br />
Cities to Address Pro-poor Adaptation and<br />
Risk Reduction 99<br />
Costing Adaptation and Risk Reduction<br />
Sources of Financing for Adaptation and<br />
100<br />
Risk Reduction 103<br />
Bringing It All Together 121<br />
Notes 122<br />
References 122<br />
Annex 1: Literature Review 125<br />
Linking Climate Change and DRR 128<br />
Climate Change, DRR, and Urban Poverty 128<br />
Service Delivery and the Urban Poor 129<br />
Housing 131<br />
Climate Change: Adaptation and Mitigation 132<br />
Finance 134<br />
Gaps in Existing Literature 134<br />
References 135
CONTENTS ■ vii<br />
Annex 2: Efforts to Estimate Exposure in Cities 141<br />
OECD Study on Ranking Port Cities with High<br />
Exposure and Vulnerability to Climate Extremes 141<br />
Munich Re’s Study on Megacities—Megacities Mega<strong>risk</strong>s 143<br />
GFDRR—Economics of Disaster Risk Reduction 144<br />
Mega-Stress for Mega-Cities: A Climate Vulnerability<br />
Ranking of Major Coastal Cities in Asia 144<br />
Earthquake Disaster Risk Index 145<br />
Multi-Hazard City Risk Index (MHCRI) 145<br />
Note 146<br />
References 146<br />
Annex 3: Learning from Project and Program<br />
Experiences: Individuals, Community, and<br />
Local Government Partnering to Manage Risk 149<br />
Introduction<br />
Educate—Good Practices in <strong>Knowledge</strong><br />
149<br />
Sharing and Training 151<br />
Identify—Good Practices in Risk Identifi cation<br />
Prepare—Good Practices in Risk Reduction<br />
155<br />
through Early-Warning Systems<br />
Mitigate—Good Practices in Risk Reduction<br />
158<br />
through Mitigation 160<br />
Flood Management and Urban Planning 160<br />
Water Supply and Sanitation 163<br />
Wastewater Management and Energy 164<br />
Water Supply and Energy Effi ciency 165<br />
Neighborhood Upgrading 166<br />
Job Creation 167<br />
Transfer—Recent Practices in Risk Defl ection 168<br />
Recover—Good Practices in Building-Back-Better 170<br />
Lessons Learned and Recommendations 173<br />
Notes 177<br />
References 177<br />
Annex 4: Dar es Salaam Case Study 181<br />
Overview and Key Findings 181<br />
Case Study Summary 186<br />
Reference 197
viii ■ CONTENTS<br />
Annex 5: Jakarta Case Study 199<br />
Overview and Key Findings 199<br />
Case Study Summary 204<br />
Notes 215<br />
Reference 215<br />
Annex 6: Mexico City Case Study 217<br />
Overview and Key Findings 217<br />
Case Study Summary 220<br />
Notes 233<br />
Reference 233<br />
Annex 7: São Paulo Case Study 235<br />
Overview and Key Findings 235<br />
Case Study Summary 239<br />
Notes 267<br />
Reference 267<br />
Color Section 269<br />
Index 277<br />
Boxes<br />
1.1 Increase in the Number of Heat Waves in the Mexico<br />
City Metropolitan Area (MCMA) 21<br />
2.1 Locating Vulnerable Households in the Mexico City<br />
Metropolitan Area (MCMA) 31<br />
2.2 Jardim Ana Maria: A Slum Pocket in São Paulo 33<br />
2.3 São Paulo’s Geotechnical Hazard Areas and Declivity<br />
Hazard Areas 35<br />
2.4 Pattern between Flood-Prone Areas and Where the Poor<br />
Live in Jakarta 36<br />
2.5 Exposure in Slums of South Asia and Latin America 37<br />
2.6 Water Supply in Dar es Salaam 43<br />
2.7 Water Scarcity in Mexico City 45<br />
2.8 Incidents of Dengue in Jakarta 50<br />
2.9 Settlements and Environmentally Sensitive Lands 52<br />
3.1 Urban Risk Assessment 66<br />
3.2 Lessons Learned from Carrying out City-level Risk<br />
Assessments under the Mayor’s Task Force 67
CONTENTS ■ ix<br />
3.3 Developing Action Plans in Vietnam, New York City,<br />
and Mexico City 68<br />
3.4 Decision Making for Adaptation Planning in Chicago 84<br />
3.5 Robust Decision Making for Road Design in a<br />
Flood-Prone Area 85<br />
3.6 Locally Organized Early-Warning System in Kampung<br />
Melayu in Jakarta 93<br />
4.1 Bangkok’s GHG Emissions and the Clean Technology Fund 106<br />
4.2 Combining Resources to Maximize Synergies: Supporting<br />
Mexico’s Urban Low-Carbon Transformation 107<br />
4.3 MultiCat Mexico 109<br />
4.4 Landfi ll Gas-to-Energy Projects in São Paulo 116<br />
4.5 Tokyo’s Emissions Trading System 117<br />
4.6 Getting Private Water Utilities into Slums: Metro Manila<br />
Water Concessions 118<br />
Figures<br />
2.1 Percentage of Urban Population Using Improved<br />
Sanitation (2008) 44<br />
4.1 Adaptation Cost Curve: Florida Test Case 101<br />
4.2 Benefi t-Cost Ratio by Risk Category for Tunis<br />
and Casablanca 102<br />
A3.1 Examples of Current Good Practices, by Approach to<br />
Risk Management 152<br />
A4.2 Trend of Mean Maximum Temperature Anomalies<br />
during Warm est Months (December–February)<br />
at Dar es Salaam International Airport 193<br />
A4.3 Timeseries of Mean Annual Rainfall in Dar es Salaam 193<br />
A4.4 Mean and Absolute 24 Hours Maximum Rainfall for<br />
Dar es Salaam 195<br />
A4.5 Exposed Population in Dar es Salaam in 2005, 2030,<br />
2050, and 2070 to a 1-in-100-Year Flood under the<br />
A1B Mid-range Sea-Level Rise Scenario, No Adaptation 196<br />
A6.1 Administrative Map of Mexico City Metropolitan Area 220<br />
A6.2 Urban Expansion of Mexico City Metropolitan<br />
Areas, 1950–2005 221<br />
A6.3 90th Percentile of Maximum Temperature, in Celsius,<br />
in 1979–2003 (left) and 2015–2039 (right) 229<br />
A6.4 95th Percentile of Precipitation (mm/day) in 1979–2003<br />
(left) and 2015–39 (right) 230<br />
A7.1 Administrative Map of São Paulo 239
x ■ CONTENTS<br />
A7.2 Growth Rates for City of São Paulo, 1950–2010 240<br />
A7.3 São Paulo City Social Vulnerability Index, IPVS 241<br />
A7.5 Greenhouse Gas Emissions from Electric Energy Use by<br />
Sector in São Paulo 243<br />
A7.6 Transport Use in São Paulo 243<br />
A7.7 Days with Intense Rainfall per Decade 248<br />
A7.8 Number of Flooding Points Registered by CGE in São Paulo per<br />
Year, 2004–2011 248<br />
A7.10 Main Flooding Points of Streets 255<br />
A7.11 Spatial Distribution of Precarious Settlements in City 258<br />
Color Section<br />
A1.1 Population and Megacities in Low-Elevation Coastal Zone<br />
(LECZ) Threatened by Sea-Level Rise and Storm Surges 269<br />
A2.1 Exposure in Large Cities to Cyclones and Earthquakes<br />
Rises from 680 Million in 2000 to 1.5 Billion 270<br />
A4.1 Administrative Map of Dar es Salaam 271<br />
A5.3 Impact of Sea-level Rise on North Jakarta with<br />
Business as Usual 271<br />
A4.6 Map of Flood Hazard Zone Overlaid on Urban Poor<br />
Settlements, Dar es Salaam 272<br />
A5.1 Administrative Map of Jakarta 273<br />
A5.4 Population Exposure to Hazards, Jakarta 274<br />
A5.5 Slum Areas, Flooding and Unregistered Land, Jakarta 274<br />
A6.5 Vulnerable Areas in Terms of Population and Housing,<br />
Mexico City 275<br />
A7.4 São Paulo´s Topography and Main Waterways 275<br />
A7.9 Geotechnical Hazard Areas, São Paulo 276<br />
Tables<br />
1.1 Analytical Framework for Assessing Risk 11<br />
1.2 Hazards Impacting the Urban Poor in Case Study Cities 12<br />
1.3 Summary Findings of Risk Assessments for Dar es Salaam,<br />
Jakarta, Mexico City, and São Paulo 13<br />
1.4 Large Disasters with Major Impacts on Cities,<br />
2000–2010 16<br />
1.5 Global Frequency and Risk of Natural Hazards 17<br />
1.6 Incremental Impacts of Climate Change and Natural Hazards<br />
on Urban Systems and Residents 18<br />
1.7 Major Efforts to Rank Exposure in Cities 22
CONTENTS ■ xi<br />
2.1 Impacts of Recent Disasters in Informal Settlements:<br />
The Philippines 41<br />
2.2 Adaptation Strategies Applied during Heavy Rain 56<br />
3.1 Consequences of Risk-Reduction Policies and Actions in<br />
Urban Areas 78<br />
3.2 Sectors for which Climate Change Should Be Incorporated<br />
Due to Time Scale or Sensitivity to Climate Conditions 83<br />
3.3 Capacity Programs Aimed at <strong>Knowledge</strong> Sharing, Education,<br />
and Training for Urban Resilience 90<br />
4.1 Current Sources of Financing and Instruments for<br />
Climate Change, Disaster Risk, and Slum Improvements 103<br />
4.2 Summary of Catalytic Financing and Technical Assistance<br />
Programs at the <strong>World</strong> Bank 108<br />
4.3 Main Instruments for Financing Climate Action in the<br />
Urban Context 111<br />
A2.1 Port Cities with Populations over 1 Million Estimated to<br />
Have Highest Increased Exposure to Surge-Induced Floods,<br />
2005 to 2070 142<br />
A3.1 Matrix of Recent Practice Cases 174<br />
A4.1 Dar es Salaam Profi le 187<br />
A4.2 Natural Hazards 192<br />
A4.3 Effects and Losses 194<br />
A4.4 Signifi cant Floods in Dar es Salaam, 1983–2006 194<br />
A5.1 Jakarta Profi le 205<br />
A5.2 Infrastructure Investments per Year DKI 209<br />
A5.3 Institutional Mapping of Disaster Risk Management<br />
Functions 210<br />
A5.4 Natural Hazards 211<br />
A5.5 Jakarta’s Kota in National Ranking of Kabupaten or<br />
Regencies at High Risk for Various Disasters 211<br />
A5.6 Main Climate Hazards 212<br />
A5.7 Social Assessment 214<br />
A6.1 Mexico City Profi le 222<br />
A6.2 Institutional Responsibilities Relating to Climate<br />
and Disasters 224<br />
A6.3 Status of Main Projects to Adapt to Climate Change 226<br />
A6.4 Natural Hazards 228<br />
A6.5 Vulnerability Matrix in Terms of Population and Housing 231<br />
A6.6 Social Assessment 231<br />
A6.7 Distribution of Vulnerable Groups Located in High-Risk Zones 232<br />
A6.8 Costs in Terms of GDP and Additional Poor 233
xii ■ CONTENTS<br />
A7.1 São Paulo Profi le 240<br />
A7.2 Institutional Mapping of Disaster Risk Management Functions 247<br />
A7.3 Natural Hazards 247<br />
A7.4 Hazards, Effects, and Losses 247<br />
A7.5 Climate Projection for Metropolitan São Paulo 250<br />
A7.6 Incidence of Hazardous Areas in Informal Settlements<br />
in São Paulo 252<br />
A7.7 Degrees of Landslide Hazard 253<br />
A7.8 Cross-Referencing Data: Areas Ranked by Their Critical<br />
Level and Types of Settlements in São Paulo 253<br />
A7.9 Social Assessment 254<br />
A7.10 Houses by Type of Precarious Settlements and<br />
Administrative Regions of City Housing Secretariat 259<br />
A7.11 Access to Urban Services and Infrastructure in<br />
Precarious Settlements in São Paulo 259<br />
A7.12 Number of Precarious Inhabitants per Level of Poverty 260
Foreword<br />
Th e number of people living in slums is on the rise all over the developing world.<br />
Increasingly, as cities grow, marginal land is consumed by residents who cannot<br />
aff ord to live elsewhere. Th is land is oft en on steep hillsides, fl ood plains, coastal<br />
zones, or situated near hazardous waste, putting residents at high <strong>risk</strong> from the<br />
impacts of <strong>climate</strong> <strong>change</strong> and natural hazards.<br />
Slum dwellers typically live in poor quality and overcrowded housing, and<br />
have limited access to water, energy, sanitation, and solid waste services. A<br />
heavy rain can quickly turn to a disastrous fl ood. Such fl ooding can destroy<br />
the assets of the poor, halt economic activity, destroy their productivity, and<br />
interrupt their income. It can contaminate the water supply, lead to disease, and<br />
displace populations.<br />
Th is study calls on cities to take a lead role in proactively addressing the <strong>risk</strong>s<br />
of <strong>climate</strong> <strong>change</strong> and natural hazards at the local level, with a focus on populations<br />
at highest <strong>risk</strong>. It suggests a number of actions that cities can take to build<br />
resilience, beginning with mainstreaming pro-poor <strong>risk</strong> reduction policies into<br />
urban planning and management. Such policies—including those dealing with<br />
land use, relocation, or new development—come with diffi cult tradeoff s that<br />
must be carefully balanced in consultation with stakeholders at the local level.<br />
Th ey also come with substantial fi nancing needs that must be met through<br />
public and private resources, and will require new fi nancing opportunities.<br />
Th e cities of the Mayor’s Task Force on Climate Change, Disaster Risk, and<br />
the Urban Poor—Dar es Salaam, Jakarta, Mexico City, and São Paulo—provide<br />
examples of good practice at the local level to address <strong>risk</strong>, through slum upgrading<br />
programs, early warning systems, safety net programs, and adaptation planning.<br />
Such examples demonstrate what is possible when local governments work<br />
across boundaries—both administrative and institutional, and in collaboration<br />
with communities—to develop and implement sustainable solutions.<br />
■ xiii
xiv ■ FOREWORD<br />
We invite other cities to share successful examples of programs and policies<br />
that have built resilience for the urban poor so that this knowledge can be broadly<br />
disseminated. We also call upon the development community to work with cities<br />
to identify fi nancing solutions for the pressing needs that are faced by the urban<br />
poor in today’s changing environment. Th e <strong>World</strong> Bank is committed to supporting<br />
such eff orts through both our fi nancing and our global knowledge products<br />
and services.<br />
Rachel Kyte Sanjay Pradhan<br />
Vice President Vice President<br />
Sustainable Development Network <strong>World</strong> Bank Institute<br />
Th e <strong>World</strong> Bank Th e <strong>World</strong> Bank
Acknowledgments<br />
Th is study was prepared by a team led by Judy L. Baker, lead economist, the<br />
<strong>World</strong> Bank. Key contributions to the overall study and case studies were provided<br />
by Christa Anderson and Maria Catalina Ochoa. Background papers were<br />
prepared by Anthony Bigio and Stephane Hallegatte (Planning, Policy, Synergies<br />
and Tradeoff s for Urban Risk Management, Climate Change Adaptation and Poverty<br />
Reduction); JoAnne Carmin, Sabrina McCormick, Sai Balakrishnan, and Eric<br />
Chu (Institutions and Governance in a Changing Climate: Implications for Service<br />
Provision for the Urban Poor); Soumya Dharmavaram (Courting Hazards: Where<br />
the Urban Poor Live); Ari Huhtala, Daniel Hoornweg, and Marcus Lee (Climate<br />
Finance for Cities); Kristina Katich (Beyond Assessment: A Review of Global Best<br />
Practices Addressing Climate Change and Disaster Risk Management for the Urban<br />
Poor, and Th e Impacts of Climate Change and Disasters on Urban Services); and<br />
David Satterthwaite (How Local Governments Can Work with Communities in the<br />
Delivery of Basic Services). Background research was conducted by Aafrin Kidwai<br />
and Austin Kilroy.<br />
Th e study was part of the work program of the Mayor’s Task Force on Climate<br />
Change, Disaster Risk, and the Urban Poor, comprising the mayors of Dar es<br />
Salaam, Jakarta, Mexico City, and São Paulo. David Miller, mayor of Toronto<br />
(2003–10) and Chair of C–40 (the Large Cities Climate Change Group) (2008–<br />
10) was an adviser to the Task Force.<br />
Th e preparation of city-level case studies for Dar es Salaam, Jakarta, Mexico<br />
City, and São Paulo were carried out as part of the work program, with teams<br />
led by each city government. From the <strong>World</strong> Bank, these studies were led<br />
by Eric Dickson (Mexico City), with Gisela Campillo, Marcus Lee, and Peter<br />
Ellis (Jakarta), and Federica Ranghieri and Andre Herzog (São Paulo and Dar<br />
es Salaam). Each of the case studies has resulted in an individual report that<br />
acknowledges the extensive teams involved in the report’s preparation. Th e<br />
■ xv
xvi ■ ACKNOWLEDGMENTS<br />
work benefi tted from the fi nancial support and insight provided by Cities<br />
Alliance, the Global Facility for Disaster Risk Reduction, and the <strong>World</strong> Bank<br />
Institute Climate Change Practice (WBICC).<br />
Peer reviewers included Margaret Arnold, Uwe Deichmann, and Abhas Jha.<br />
Helpful comments were also received from David Miller, Glen Pearce-Oroz,<br />
Apurva Sanghi, and the team members listed above.<br />
Th e work is a joint eff ort by the Finance, Economics, and Urban Department<br />
and the <strong>World</strong> Bank Institute. Th e study was carried out under the overall guidance<br />
of Zoubida Allaoua, Marianne Fay, Abha Joshi-Ghani, Christine Kessides,<br />
and Konrad von Ritter.
Abbreviations<br />
ACCRN Asian Cities Climate Change Resilience Network<br />
ADB Asian Development Bank<br />
ASCCUE Adaptation Strategies for Climate Change in the Urban<br />
Environment<br />
AURAN African Urban Risk Analysis Network<br />
BAPPEDA Badan Perencanaan Pembangunan Daerah (Jakarta)<br />
B/C benefi t/cost ratio<br />
BEHD buildings expected to be heavily damaged<br />
BMA Bangkok Metropolitan Administration<br />
BPBD Badan Penanggulangan Bencana Daerah (Jakarta)<br />
BPLHD Badan Pengelola Linkungan Hidup Daerah (Jakarta)<br />
CAT DDO Catastrophe Risk Deferred Drawdown Option<br />
CCRIF Caribbean Catastrophe Risk Insurance Facility<br />
CDCF Community Development Carbon Fund<br />
CDM Clean Development Mechanism<br />
CER certifi ed emission reduction<br />
CGE Emergency Management Center (São Paulo)<br />
CIUP Community Infrastructure Upgrading Program<br />
CLACC Capacity Strengthening of Least Developing Countries for<br />
Adaptation to Climate Change<br />
CODEL local emergency committee<br />
COMDEC City Emergency Management Agency (São Paulo)<br />
COP Conference of the Parties<br />
CRC <strong>climate</strong> resilient cities<br />
CRED Centre for Research on the Epidemiology of Disasters<br />
CTF Clean Technology Fund<br />
CVCCCM Virtual Center on Climate Change for Mexico City<br />
■ xvii
xviii ■ ABBREVIATIONS<br />
DANIDA Danish International Development Agency<br />
DAWASA Dar es Salaam Water Supply and Sewerage Agency<br />
DCC Dar es Salaam City Council<br />
DKI Special Capital District of Jakarta<br />
DRR <strong>disaster</strong> <strong>risk</strong> reduction<br />
ETS emissions trading system<br />
FAR Floor-area ratio<br />
FIP Forest Investment Program<br />
FONDEN Fondo de Desastres Naturales (Mexico)<br />
GDP gross domestic product<br />
GEF Global Environment Facility<br />
GEO-CAN Global Watch Observation Catastrophe Assessment Network<br />
GFDRR Global Facility for Disaster Reduction and Recovery<br />
GHG greenhouse gas<br />
GPOBA Global Partnership on Output-Based Aid<br />
Ha hectare<br />
HABISP Sistema de informações para habitação social (São Paulo)<br />
HRM Halifax Region Municipality<br />
IBGE Instituto Brasileiro de Geografi a e Estatística<br />
IBRD International Bank for Reconstruction and Development<br />
ICLEI Local Governments for Sustainability<br />
IDA International Development Association<br />
IFRC International Federation of Red Cross and Red Crescent<br />
Societies<br />
IIED International Institute for Environment and Development<br />
INPE Instituto Nacional de Pesquisas Espaciais (São Paulo)<br />
IPCC Inter-Governmental Panel on Climate Change<br />
IPT Instituto de Pesquisas Tecnológicas do Estado de São Paulo<br />
IPVS Index of social vulnerability (São Paulo)<br />
ISDR United Nations International Strategy for Disaster Reduction<br />
JMP Joint Monitoring Programme<br />
KICAMP Kinondoni Integrated Coastal Area Management Project<br />
(Tanzania)<br />
LDCF Least Developed Countries Fund<br />
LECZ Low Elevation Coastal Zones<br />
LRAP Local Resilience Action Plan<br />
MAMUCA Mancomunidad de los Municipios del Centro de Atlantida<br />
(Honduras)<br />
MCCAP Mexico City’s Climate Action Program<br />
MCMA Mexico City Metropolitan Area<br />
NAPA national adaptation program of action
ABBREVIATIONS ■ xix<br />
NAP-DRR National Action Plan for Disaster Risk Reduction<br />
NGO nongovernmental organization<br />
NYCPCC New York City Panel on Climate Change<br />
OBA output-based aid<br />
OECD Organisation for Economic Co-operation and Development<br />
OFDA Offi ce of Foreign Disaster Assistance<br />
OPP-RTI Orangi Pilot Project Research and Training Institute (Pakistan)<br />
PCG partial credit guarantee<br />
Pemprov Provincial Government of the Special Capital District of Jakarta<br />
PHPF Philippines Homeless People’s Federation<br />
PNPM Program Nasional Pemberdayaan Masyarakat (Indonesia)<br />
PPIAF <strong>World</strong> Bank Public-Private Infrastructure Advisory Facility<br />
PPP public-private partnership<br />
RBF results-based fi nancing<br />
REDD Reduced Emissions from Deforestation and Forest Degradation<br />
SATKORLAK Satuan Tugas Koordinasi dan Pelaksana (Indonesia)<br />
SEHAB Secretaria da Habitação e Desenvolvimento Urbano (São Paulo)<br />
SLD Shared Learning Dialogue<br />
SMART Sustainable Mitigation and Adaptation Risk Toolkit<br />
SPDMI Strategic Plan for Disaster Mitigation in Istanbul<br />
SVMA Green and Environment Secretariat (São Paulo)<br />
TCIP Turkish Catastrophic Insurance Pool<br />
UNEP United Nations Environmental Programme<br />
UNFCCC United Nations Framework Convention on Climate Change<br />
URA Urban Risk Assessment<br />
VTC Volunteer Technology Community<br />
VUUP Vietnam National Urban Upgrading Program<br />
WDR <strong>World</strong> Development Report<br />
WHO <strong>World</strong> Health Organization<br />
WWF <strong>World</strong> Wildlife Fund
Overview<br />
Poor people living in slums are at particularly high <strong>risk</strong> from the impacts of <strong>climate</strong><br />
<strong>change</strong> and natural hazards. Th ey live on the most vulnerable land within<br />
cities, typically areas deemed undesirable by others and thus aff ordable. Residents<br />
are exposed to the impacts of landslides, sea-level rise, fl ooding, and other<br />
hazards.<br />
Exposure to <strong>risk</strong> is exacerbated by overcrowded living conditions, lack of adequate<br />
infrastructure and services, unsafe housing, inadequate nutrition, and poor<br />
health. Th ese conditions can swift ly turn a natural hazard or <strong>change</strong> in <strong>climate</strong><br />
into a <strong>disaster</strong>, and result in the loss of basic services, damage or destruction to<br />
homes, loss of livelihoods, malnutrition, disease, disability, and loss of life.<br />
Th is study analyzes the key challenges facing the urban poor, given the <strong>risk</strong>s<br />
associated with <strong>climate</strong> <strong>change</strong> and <strong>disaster</strong>s, particularly with regard to the<br />
delivery of basic services, and identifi es strategies and fi nancing opportunities<br />
for addressing these <strong>risk</strong>s. Th e main audience for this study includes mayors and<br />
other city managers, national governments, donors, and practitioners in the fi elds<br />
of <strong>climate</strong> <strong>change</strong>, <strong>disaster</strong>-<strong>risk</strong> management, and urban development.<br />
Th e work is part of a broader program under the Mayor’s Task Force on<br />
Climate Change, Disaster Risk and the Urban Poor. Th is task force was launched<br />
at the Mayor’s Summit in Copenhagen in 2009 with the aim to better understand<br />
these issues, identify examples of good practices, and propose policy and investment<br />
programs to improve the resilience of the urban poor. Th e task force comprises<br />
the mayors of Dar es Salaam, Jakarta, Mexico City, and São Paulo, who have<br />
recognized the importance of these issues in their cities and have demonstrated<br />
strong support for taking action. In each of the four cities, urban <strong>risk</strong> assessments<br />
have been carried out that provide the basis for much of the knowledge in the<br />
study. Summaries of those cases are included in annexes 5–7 of this report.<br />
■ 1
2 ■ CLIMATE CHANGE, DISASTER RISK, AND THE URBAN POOR<br />
Th e study is organized in four chapters covering (1) a broad look at <strong>climate</strong><br />
<strong>change</strong> and <strong>disaster</strong> <strong>risk</strong> in cities of the developing world, with particular implications<br />
for the urban poor; (2) analysis of the vulnerability of the urban poor;<br />
(3) discussion of recommended approaches for building resilience for the urban<br />
poor; and (4) review of the fi nancing opportunities for covering investments in<br />
basic services and other needs associated with <strong>climate</strong> and <strong>disaster</strong> <strong>risk</strong>.<br />
Several key fi ndings emerge from the study and provide guidance for addressing<br />
<strong>risk</strong>:<br />
• Th e urban poor are on the front line. Th e poor are particularly vulnerable to<br />
<strong>climate</strong> <strong>change</strong> and natural hazards because of where they live within cities,<br />
and the lack of reliable basic services there.<br />
• City governments are the drivers for addressing <strong>risk</strong>s. Local governments<br />
play a vital role in providing basic services that are critical to improving the<br />
resilience of the urban poor.<br />
• City offi cials build resilience by mainstreaming <strong>risk</strong> reduction into urban<br />
management. Adapting to <strong>climate</strong> <strong>change</strong> and reducing <strong>disaster</strong> <strong>risk</strong> can be<br />
best addressed and sustained over time through integration with existing<br />
urban planning and management practices.<br />
• Signifi cant fi nancial support is needed. Local governments need to leverage<br />
existing and new resources to meet shortfalls in service delivery and basic<br />
infrastructure adaptation.<br />
Recommended Actions to Build Resilience<br />
of the Urban Poor<br />
Th ere are a number of actions that can help build resilience for those at greatest<br />
<strong>risk</strong> in cities. Implementing these actions will involve a strong commitment by<br />
local governments working with communities, as well as national and international<br />
institutions.<br />
Assessing <strong>risk</strong> at the city and community levels to inform decision making<br />
and action planning. City-level case studies carried out in Dar es Salaam,<br />
Jakarta, Mexico City, and São Paulo as part of the Mayor’s Task Force program<br />
have demonstrated the importance of understanding environmental, socioeconomic,<br />
and institutional <strong>risk</strong>s as an important fi rst step to developing plans for<br />
adaptation and <strong>disaster</strong> <strong>risk</strong> reduction. A <strong>risk</strong> assessment can defi ne the nature of<br />
<strong>risk</strong>s, answer questions about the characteristics of potential hazards, and identify<br />
community vulnerabilities and potential exposure to given hazards. Such information<br />
helps in prioritizing <strong>risk</strong> measures, giving due consideration to the probability<br />
and impact of potential events, the cost eff ectiveness of the measures, and<br />
resource availability. Experiences from the four task force cities and elsewhere
OVERVIEW ■ 3<br />
also demonstrate that, through the process of assessing <strong>risk</strong>, it is imperative to<br />
get multiple agencies and community residents involved to ex<strong>change</strong> ideas, collaborate,<br />
and communicate with the aim of establishing eff ective adaptation and<br />
<strong>disaster</strong> <strong>risk</strong> reduction plans.<br />
Integrating policies for <strong>climate</strong> <strong>change</strong> and <strong>disaster</strong> <strong>risk</strong> reduction for the<br />
poor into urban planning and management. Policies to address <strong>climate</strong> <strong>risk</strong>s<br />
and natural hazards have links to many sectors and therefore come with important<br />
synergies that are best captured through systemwide approaches. Comprehensive<br />
urban planning is thus critical to integrating approaches to addressing<br />
such <strong>risk</strong>s but can oft en be challenging, given the many institutions involved in<br />
managing cities. Cities such as London, New York, Quito, and Toronto demonstrate<br />
comprehensive planning approaches that address <strong>risk</strong>. At a minimum, cities<br />
can identify <strong>risk</strong>-prone areas and through urban planning discourage new<br />
construction in these areas.<br />
Balancing policy tradeoff s among <strong>risk</strong> reduction, urban development,<br />
and poverty reduction in decision making. Policy decisions typically involve<br />
diffi cult decisions with outcomes that will have both positive and negative consequences<br />
that local decision makers and stakeholders must carefully weigh.<br />
Decisions and investments in public service provision, <strong>disaster</strong> <strong>risk</strong> reduction,<br />
and <strong>climate</strong> <strong>change</strong> adaptation will have consequences for many decades to<br />
come, given the longevity of many infrastructure investments. Yet these decisions<br />
are particularly sensitive to <strong>change</strong>s in <strong>climate</strong> conditions, where there is much<br />
uncertainty. Th is makes decision making particularly complex and has invoked<br />
some new approaches for policy makers to consider. From an operational perspective,<br />
policy makers must also consider the context of broader priorities that<br />
involve tradeoff s to be balanced.<br />
Better policies for land use planning and management will have the biggest<br />
impact. As cities grow, they expand into marginal areas such as fl ood plains,<br />
water catchments, and steep hillsides, requiring land-use planning to consider<br />
fl ood, seismic, and other hazard zones when determining where new development<br />
should be permitted. Effi cient transport systems can make land available<br />
in new areas by enabling access and mobility, thereby reducing incentives to<br />
develop in vulnerable locations. Preventing building and settlements in high-<strong>risk</strong><br />
areas can save lives and prevent destruction. At the building scale, retrofi tting of<br />
existing building stock may be necessary, in addition to more robust design standards<br />
for new construction. A framework for the regularization of land tenure,<br />
including partial or incremental solutions, can spur investments and encourage<br />
improvements in infrastructure. Proactive policies can assist in making safe and<br />
aff ordable sites available for low-income residents, reducing <strong>risk</strong> for the poor.<br />
Strengthening institutional capacity to deliver basic services and reduce<br />
vulnerability to <strong>climate</strong> and <strong>disaster</strong> <strong>risk</strong>. In many cities, weak institutional
4 ■ CLIMATE CHANGE, DISASTER RISK, AND THE URBAN POOR<br />
capacity is a major constraint to delivering services. Local governments oft en do<br />
not have adequate staffi ng, technical skills, or fi nancial capacity. Climate <strong>change</strong><br />
and <strong>disaster</strong> <strong>risk</strong> only exacerbate the challenges of urban management and service<br />
delivery. Informal institutions, such as nongovernmental organizations and<br />
community-based organizations, have emerged to respond to the needs of the<br />
urban poor in the absence of formal institutions. Th ey contribute to adaptive<br />
capacity by addressing gaps in service delivery and, at times, facilitating coordinated<br />
action in both ongoing and emergency contexts. Th ese institutions play an<br />
important role; however, they are not a substitute for formal institutions and the<br />
associated provision of basic and infrastructure services. Investments in building<br />
capacity for better urban planning and management have the potential to<br />
strengthen the resilience of cities. Th ere are several approaches to capacity development<br />
at the city level, with many successes in city networks at the country,<br />
regional, and international levels; training programs; and knowledge ex<strong>change</strong><br />
through twinning and other programs that allow cities to learn from each other.<br />
Emerging examples include Boston, Cape Town, Ho Chi Minh City, London,<br />
New York City, Quito, Rotterdam, and Toronto.<br />
Bridging communities and local governments to work together on local<br />
solutions. At the household and community levels, much is already happening<br />
that governments can draw upon. Th ere are also examples of successful partnerships<br />
between community organizations and local governments around<br />
basic services. For example, initiatives in Ilolo, Philippines, and Quelimane City,<br />
Mozambique, demonstrate eff ective community mapping and the creation of<br />
partnerships for eff ective service delivery. Such partnerships show that cooperation<br />
can be facilitated through mutual recognition of the role that each group<br />
plays, improving the dialogue to dispel misunderstandings, understanding and<br />
recognizing what is happening at the local level, and forming partnerships with<br />
local organizations. For the poor, understanding what the city can and cannot<br />
provide and what its constraints are is a fi rst step. Th is also can mean communities<br />
proactively demonstrating what resources and capacity they have rather<br />
than making demands and opposing government policies or practices that go<br />
against their needs. For local governments, this means recognizing the contribution<br />
that the urban poor make to a city’s economy and society and involving<br />
them in discussions about needs and priorities. Local participation is crucial to<br />
ensure that the approach taken suits the needs of residents and meets quality<br />
standards. Many of the examples of partnerships between local governments and<br />
community organizations in Africa and Asia have been initiated by federations<br />
of slum dwellers who are engaged in initiatives to upgrade slums, secure land tenure,<br />
develop new housing that low-income households can aff ord, and improve<br />
provision for infrastructure and services.
OVERVIEW ■ 5<br />
<strong>Open</strong>ing new fi nance opportunities for cities to address pro-poor adaptation<br />
and <strong>risk</strong> reduction. Cities need fi nancing for urban infrastructure, basic<br />
services for the urban poor, capacity building, <strong>risk</strong> assessments, and tools for<br />
integrating <strong>climate</strong> <strong>change</strong> and <strong>disaster</strong> <strong>risk</strong> management into urban planning.<br />
Cities currently rely on national and local tax revenues, the private sector, publicprivate<br />
partnerships, and loans and concessional sources through multilateral<br />
development banks and donors. Existing programs also provide smaller-scale<br />
grants or technical assistance for projects and programs at the city level. Most<br />
international funds, however, are channeled through national implementing<br />
entities. Given the enormous need, it is recommended that international donors<br />
consider a new Program for Climate Finance and Assistance for Cities that would<br />
bring together existing resources and draw on new and innovative instruments.<br />
Th is program would facilitate access to resources through a more unifi ed “window”<br />
that would reduce overhead and administrative complexity. To encourage cities<br />
to achieve specifi ed targets, such a program could consider a more standardized<br />
approach to benchmarking and monitoring through metrics commonly agreed<br />
upon by the international community, such as a city-level greenhouse gas index,<br />
urban <strong>risk</strong> assessments, or Local Resilience Action Plans. By meeting specifi ed<br />
targets, cities would then be eligible for accessing such fi nancing through a designated<br />
window.
Key Messages<br />
Vulnerable Cities: Assessing<br />
Climate Change and Disaster<br />
Risk in Urban Centers of the<br />
Developing <strong>World</strong><br />
Exposure to the impacts of <strong>climate</strong> <strong>change</strong> and natural hazards is on the rise<br />
in cities.<br />
The urban poor disproportionately bear the brunt of changing weather patterns<br />
and natural hazards.<br />
The scope and intensity of <strong>disaster</strong> <strong>risk</strong>s vary considerably across cities, with<br />
differential impacts on the urban poor.<br />
The increased exposure of the urban poor to extensive <strong>risk</strong>s can transform<br />
frequent everyday hazards into <strong>disaster</strong>s.<br />
Introduction and Objective of the Study<br />
1<br />
Cities are concentrated centers of people, assets, and economic activity. Th is concentration<br />
increases exposure to the impacts of <strong>climate</strong> <strong>change</strong> and natural hazards,<br />
making urban residents particularly vulnerable to rising sea levels, storm<br />
surges, earthquakes, and fl oods. Climate <strong>change</strong> also poses <strong>risk</strong>s of drought and<br />
extreme heat.<br />
Th e <strong>risk</strong>s for the urban poor are oft en even greater, exacerbated by their limited<br />
access to basic infrastructure and services, and by where they live within cities.<br />
■ 7
8 ■ CLIMATE CHANGE, DISASTER RISK, AND THE URBAN POOR<br />
With rapid urbanization, cities throughout the developing world struggle to meet<br />
the basic needs of their growing populations. Today, some 1 billion urban residents<br />
live in slums, which lack basic infrastructure and services. More than half<br />
the urban population in Sub-Saharan Africa and 40 percent in South Asia lack<br />
access to basic sanitation (Joint Monitoring Programme (JMP) 2010). In Sub-<br />
Saharan Africa, close to 20 percent of urban residents do not have access to safe<br />
water (JMP 2010). Many more live without access to proper drainage or wastewater<br />
removal.<br />
Th e poor typically settle in areas undesirable to others and thus aff ordable.<br />
Th is includes informal settlements on precarious land, at high <strong>risk</strong> from landslides,<br />
sea-level rise, and fl ooding. Th ese neighborhoods are made even more<br />
vulnerable by overcrowded living conditions, unsafe housing, inadequate nutrition,<br />
poor health, and lack of safety nets. When a <strong>disaster</strong> hits, impacts can<br />
include the loss of basic services, damage or destruction to homes, reduction or<br />
loss of livelihoods, threats to food security, and the rapid spread of malnutrition<br />
and water- and vector-borne diseases.<br />
One has to look back only to the past few years to get a sense of the destruction<br />
natural hazards can cause in cities, particularly for low-income residents. In<br />
the past two years alone, major <strong>disaster</strong>s—such as earthquakes in Japan (2011),<br />
Haiti (2010), Chile (2010), and China, (2010); and fl ooding in China (2010),<br />
Pakistan (2010), and Brazil (2010, 2011)—have killed many. Annually, almost<br />
70,000 people are killed by natural hazards, with the majority of related mortality<br />
and economic losses being concentrated in low- and middle-income countries. 1<br />
Th e objective of this study is to analyze the key challenges facing the urban<br />
poor, given the <strong>risk</strong>s associated with <strong>climate</strong> <strong>change</strong> and <strong>disaster</strong>s, particularly<br />
regarding the delivery of basic services, and to identify strategies and fi nancing<br />
opportunities for addressing these <strong>risk</strong>s. Th e study is aimed at mayors and other<br />
city managers, national governments, donors, and practitioners in the fi elds of<br />
<strong>climate</strong> <strong>change</strong>, <strong>disaster</strong> <strong>risk</strong> management, and urban development. It is organized<br />
into four main chapters. Chapter 1 introduces the study and presents an<br />
overview of <strong>risk</strong> in cities of the developing world and the implications of those<br />
<strong>risk</strong>s for the urban poor. Chapter 2 analyzes the vulnerability of the urban poor<br />
based on location and other characteristics, particularly those related to access<br />
to basic services and infrastructure. Chapter 3 is more forward looking, focusing<br />
on recommended approaches to building resilience for the urban poor and discussing<br />
the key policy issues and tradeoff s that must be considered. Chapter 4<br />
concludes with a practical discussion of existing fi nancing tools for <strong>climate</strong><br />
<strong>change</strong>, <strong>disaster</strong> <strong>risk</strong>, and urban development and how they could be further<br />
oriented for growing needs. Th roughout the study are examples from the four<br />
city-level case studies undertaken as part of this work, as well as good practices
VULNERABLE CITIES ■ 9<br />
from other cities. Annexes include a literature review, good practice cases, and<br />
summaries of the four city-level case studies.<br />
Th is study is part of a larger program under the Mayor’s Task Force on Climate<br />
Change, Disaster Risk and the Urban Poor. Th is task force was created in<br />
December 2009 at the Climate Summit for Mayors in Copenhagen, with strong<br />
support by key members: the mayors of Mexico City (lead convener), Jakarta,<br />
Dar es Salaam, and São Paulo. Th e task force’s work program has three main<br />
objectives and is supported by the <strong>World</strong> Bank Group. Th ese objectives are<br />
to (1) take stock of our understanding of the linkages between urban poverty<br />
and <strong>climate</strong> <strong>change</strong>; (2) identify examples of good practices where shelter and<br />
services for the urban poor have been improved and have resulted in reduced<br />
vulnerability; and (3) propose policy and investment programs and municipal<br />
management practices that benefi t the urban poor. Each of the four cities has<br />
carried out in-depth studies to assess <strong>risk</strong> in their cities with a particular focus<br />
on the urban poor that provides an important contribution to the overall study.<br />
Background, Analytical Framework, and Approach<br />
Th e existing literature on <strong>climate</strong> <strong>change</strong>, <strong>disaster</strong> <strong>risk</strong> management, urbanization,<br />
and urban poverty is expanding rapidly with important contributions emerging<br />
in recent years. Some of the key documents include the Inter Governmental<br />
Panel on Climate Change (IPCC) Assessment Reports; the <strong>World</strong> Bank’s 2010<br />
<strong>World</strong> Development Report on Climate Change; the <strong>World</strong> Bank and UN study,<br />
Natural Hazards, UnNatural Disasters, 2010; the <strong>World</strong> Watch Institute’s State of<br />
the <strong>World</strong> Report, Our Urban Future (2007); the Global Assessment Report on<br />
Disaster Risk Reduction (ISDR 2009); and the <strong>World</strong> Disasters Report: Focus on<br />
Urban Risk (IFPC 2010). Th ese studies, reviewed in annex 1, have brought to the<br />
fore many of the <strong>risk</strong>s that cities face, and in a few cases, some coverage of the<br />
particular challenges in low-income areas.<br />
Th ere is consensus that the poor disproportionately bear the brunt of changing<br />
weather patterns and natural hazards, and have limited adaptive capacity to<br />
cope with <strong>climate</strong> <strong>change</strong>. Th ere is much reference regarding vulnerabilities to<br />
fl ooding, land subsidence, heat waves, and increased health <strong>risk</strong>s. One of the frequently<br />
cited works is Moser et al. (2008), which refers to pro-poor adaptation<br />
in cities. It examines the role of assets—“natural, physical, social, fi nancial, and<br />
human capital”—in increasing the adaptive capacity of the urban poor. Th ese<br />
assets are particularly important because city authorities may not have adequate<br />
fi nancial resources to provide services, and may be reluctant to work with the<br />
poor, particularly in informal settlements, where formalizing the assets of the
10 ■ CLIMATE CHANGE, DISASTER RISK, AND THE URBAN POOR<br />
poor could increase the likelihood of holding local governments accountable for<br />
provision of services.<br />
Th ere is relatively less published research available on the relationship between<br />
the impacts of <strong>climate</strong> <strong>change</strong> and natural hazards on access to basic services,<br />
and vice versa. Of all basic services, water, sanitation, and drainage have received<br />
more attention because of their direct impact on human health. Other gaps in the<br />
literature include limited empirical evidence on the impacts of <strong>climate</strong> <strong>change</strong><br />
and <strong>disaster</strong>s on the urban poor, and little documentation of how <strong>risk</strong>s for the<br />
urban poor have been addressed and how cities can integrate policies for improving<br />
resiliency among the urban poor into urban planning. While this study does<br />
not purport to fully fi ll this void, it attempts to contribute to improving our<br />
understanding of the issues.<br />
Analytical Framework<br />
Th e analytical framework used in the study is based on the approach developed<br />
by the IPCC, which looks at the <strong>risk</strong>s posed by natural hazards and defi nes vulnerability<br />
as a function of a system’s exposure, sensitivity, and adaptive capacity.<br />
Th is framework was introduced in the 2001 IPCC Th ird Assessment Report and<br />
has been adapted somewhat over time. Various studies analyzing the impact of<br />
<strong>climate</strong> <strong>change</strong> have used diff erent adaptations of this framework. As discussed<br />
in the IPCC Fourth Assessment Report (2007, Section 19.1.2), “Key impacts that<br />
may be associated with key vulnerabilities are found in many social, economic,<br />
biological, and geophysical systems, and various tabulations of <strong>risk</strong>s, impacts and<br />
vulnerabilities have been provided in the literature.”<br />
Th e application of the analytical framework will focus on a core function of<br />
cities—the provision of basic protection and services for its residents. For the<br />
purposes of the study, these basic services will include housing, water and sanitation,<br />
drainage, solid-waste treatment, transport, roads, and public and environmental<br />
health. Table 1.1 presents the analytical framework, with defi nitions used<br />
most commonly by the IPCC working groups.<br />
A further distinction useful for the analysis of <strong>risk</strong> is the concept of intensive<br />
and extensive <strong>risk</strong>s found in the <strong>disaster</strong> <strong>risk</strong> literature. Intensive <strong>risk</strong> refers<br />
to areas where major concentrations of vulnerable people and economic assets<br />
are exposed to very severe hazards (for example, major earthquakes, tropical<br />
cyclones, severe fl ooding, or tsunamis). In contrast, extensive <strong>risk</strong>s refer to wide<br />
regions exposed to more frequently occurring low- or moderate-intensity losses<br />
(for example, localized fl ooding, fi res, and landslides in informal settlements).<br />
Th e frequency and intensity of such everyday hazards is increasing with the very<br />
gradual rise in variability and extremes in temperature and rainfall induced by<br />
<strong>climate</strong> <strong>change</strong>. Th ese widespread low-intensity losses are associated with other
TABLE 1.1<br />
Analytical Framework for Assessing Risk<br />
Sector<br />
The study will<br />
cover the<br />
subsectors<br />
related to the<br />
basic provision<br />
of shelter and<br />
services for the<br />
urban poor:<br />
housing, water<br />
and sanitation,<br />
drainage, solidwaste<br />
treatment,<br />
energy, transport<br />
services, roads,<br />
and public and<br />
environmental<br />
health.<br />
VULNERABLE CITIES ■ 11<br />
<strong>risk</strong> impacts, such as a large number of aff ected people and damage to housing<br />
and local infrastructure, particularly aff ecting the urban poor. Such events are<br />
typically not associated with major mortality or destruction of large economic<br />
assets (ISDR 2009). Yet frequent everyday hazards can turn into <strong>disaster</strong>s for the<br />
urban poor, who lack basic infrastructure and services.<br />
Approach<br />
Vulnerability<br />
Natural hazard Exposure Sensitivity<br />
Hazards (<strong>risk</strong>s in<br />
economics<br />
literature) are<br />
potentially<br />
damaging physical<br />
events or<br />
phenomena that<br />
may cause the<br />
loss of life or<br />
injury, property<br />
damage, social<br />
and economic<br />
disruption, or<br />
environmental<br />
degradation. 1<br />
The nature and<br />
degree to which<br />
a system is<br />
exposed to signifi<br />
cant climatic<br />
variations (IPCC<br />
2001)<br />
Sensitivity is<br />
the degree to<br />
which a system<br />
is affected, either<br />
adversely or<br />
benefi cially, by<br />
<strong>climate</strong> variability<br />
or <strong>change</strong>. The<br />
effect may be<br />
direct or indirect.<br />
Adaptive<br />
capacity<br />
The ability of<br />
a system to<br />
adjust to<br />
<strong>climate</strong> <strong>change</strong><br />
(including <strong>climate</strong><br />
variability and<br />
extremes), to<br />
moderate<br />
potential<br />
damages, to<br />
take advantage<br />
of opportunities,<br />
or to cope<br />
with the<br />
consequences<br />
Source: Glossary, IPCC (2007); ISDR (2009).<br />
1. A distinction made in the <strong>disaster</strong> literature is the defi nition of a <strong>disaster</strong> as the hazard’s effect on society<br />
as a result of the combination of exposure and vulnerability. Disasters, not hazards, cause deaths and<br />
damage. (<strong>World</strong> Bank and United Nations 2010).<br />
Th e approach for carrying out this study is based on several eff orts. Background<br />
papers were prepared on topics that were not well covered in the<br />
literature and were considered key to understanding <strong>risk</strong>s to the delivery of<br />
basic services for the urban poor, given <strong>climate</strong> <strong>change</strong> and <strong>disaster</strong> <strong>risk</strong>. Four<br />
city-level case studies, in Dar es Salaam, Jakarta, Mexico City, and São Paulo,<br />
have also been carried out to gather new empirical evidence on the <strong>risk</strong>s of<br />
<strong>climate</strong> <strong>change</strong> and <strong>disaster</strong>s for the urban poor, particularly with regard to
12 ■ CLIMATE CHANGE, DISASTER RISK, AND THE URBAN POOR<br />
the delivery of basic services. Key fi ndings from those studies are integrated<br />
throughout this report, and case study summaries for each city are included<br />
in annexes 5–7. 2 Th e case studies follow a methodology for assessing urban<br />
<strong>risk</strong> that is based on three pillars: institutional assessment, hazard assessment,<br />
and social assessment. 3 Because the amount of data available for the diff erent<br />
cities varies, the depth of the information on each case study varies. Th e key<br />
fi ndings are summarized in tables 1.2 and 1.3.<br />
Climate Change, Disaster Risk, and Urban Areas:<br />
Assessing Hazard Risk<br />
Th e unprecedented rate of urban growth in the developing world is increasingly<br />
exposing the population and economic assets to the potential impacts of <strong>climate</strong><br />
<strong>change</strong> and natural hazards. Th e world’s urban population is currently estimated<br />
at 3.3 billion. Most of the urban population resides in the developing world,<br />
where nearly all future urban growth will take place. During the next 20 years, it<br />
is projected that over 95 percent of the population growth in developing countries<br />
will take place in urban areas, with the urban populations of Africa and<br />
South Asia increasing by an average of 62 million people each year. 4 In East Asia<br />
TABLE 1.2<br />
Hazards Impacting the Urban Poor in Case Study Cities<br />
Hazard<br />
Dar es<br />
Salaam Jakarta São Paulo<br />
Earthquake<br />
Wind storm<br />
River fl ow<br />
Floods, inundations, and<br />
waterlogs<br />
Drought<br />
Volcano<br />
Landslide<br />
Storm surge<br />
Extreme temperature NA<br />
Source: Author.<br />
High <strong>risk</strong><br />
Medium <strong>risk</strong><br />
Low <strong>risk</strong><br />
Mexico<br />
City
TABLE 1.3<br />
Summary Findings of Risk Assessments for Dar es Salaam, Jakarta, Mexico City, and São Paulo<br />
Overview<br />
Vulnerability of the urban poor<br />
Pop.<br />
Hazards, vulnerability, and basic services<br />
Dar es Salaam Jakarta Mexico City São Paulo<br />
2.5 million in 1,590 km 2<br />
Between 4% and 8% annual<br />
population growth<br />
Main hazards—heavy rainfall,<br />
fl ooding, droughts<br />
70% of Dar es Salaam’s<br />
population lives in poor,<br />
unplanned settlements; human<br />
development indicators very low.<br />
Basic infrastructure is very low;<br />
access to clean water and<br />
sanitation is a major problem; less<br />
than 60% of the road network is<br />
paved.<br />
Drainage channels are regularly<br />
blocked, causing houses to<br />
be fl ooded by sewage-based<br />
waste-water, causing water-borne<br />
diseases.<br />
9.6 million in the metro area (650<br />
km 2 ); 28 million in greater Jakarta<br />
250,000 immigrate to Jakarta<br />
yearly<br />
Main hazards—water<br />
management and fl ood control.<br />
About 40% of the city is below<br />
sea level.<br />
Regular fl ooding affects city<br />
throughout the year with impacts<br />
on traffi c, damage to homes, and<br />
economic losses.<br />
There is currently no citywide<br />
solid waste–management plan for<br />
Jakarta.<br />
Poorest people live close to river<br />
banks, canals, drainage areas.<br />
21.2 million in the metro area<br />
(4,250 km 2 )<br />
3% annual population growth rate<br />
Main hazards—high seismic <strong>risk</strong>,<br />
no natural drainage for runoff from<br />
the surrounding mountains, and<br />
vulnerability to fl ooding. Regularly<br />
affected by severe storms, heat<br />
waves, and droughts<br />
Projections estimate rise in mean<br />
temperature by 2–3 °C by end of<br />
this century; extreme precipitation<br />
episodes expected to increase.<br />
By 2015, water consumption<br />
rates will increase by 20%<br />
compared with 2000 levels.<br />
Infrastructure and public services<br />
are stretched thin.<br />
City’s generation of garbage is<br />
increasing at a rate of 5% a year.<br />
15% of the population is ranked<br />
with high level of housing and<br />
population vulnerability.<br />
19.7 million in the metro area<br />
(2,140 km 2 )<br />
Increasing low-income population<br />
in the periphery<br />
Main hazards—heavy rains,<br />
fl ooding, landslides, and<br />
washouts.<br />
13% of the population is<br />
considered as having high or very<br />
high social vulnerability.<br />
More than 85% of high-<strong>risk</strong><br />
households (890,000) are located<br />
in slums across the city.<br />
More than 5% of slum areas are<br />
highly likely to be affected by<br />
destructive events.<br />
52% of households in slums<br />
are without access to sanitation<br />
facilities and 33% of households<br />
in slums have no access to paved<br />
roads close to their homes.<br />
20% of sewage lacks proper<br />
treatment.<br />
(continued next page)<br />
VULNERABLE CITIES ■ 13
TABLE 1.3 continued<br />
Building resilience for the urban poor<br />
Achievements<br />
Challenges<br />
Source: Author.<br />
Dar es Salaam Jakarta Mexico City São Paulo<br />
Government is identifying all<br />
properties in informal settlements<br />
in Dar es Salaam and issuing<br />
land/property licenses or right of<br />
occupancy to improve security<br />
of tenure, which could be used<br />
as collateral for economic<br />
empowerment.<br />
Signifi cant slum upgrading<br />
program is also under way.<br />
Disaster <strong>risk</strong> management has<br />
largely been ignored and needs<br />
to be integrated in all aspects of<br />
urban planning in Dar es Salaam.<br />
Limited capacity in city planning<br />
departments to assess the longterm<br />
sectoral impacts of <strong>climate</strong><br />
<strong>change</strong> for the city.<br />
Large-scale adaptation<br />
infrastructure projects being<br />
developed include Jakarta Coastal<br />
Defense to protect from tidal<br />
surges, and Jakarta Urgent Flood<br />
Mitigation Plan.<br />
Innovative early-warning systems<br />
via SMS at the urban ward level<br />
inform people of upcoming fl oods.<br />
Adaptation plans to cope with<br />
extreme weather and sea level<br />
rise are not coordinated across<br />
multiple agencies.<br />
Lack of comprehensive <strong>disaster</strong><br />
<strong>risk</strong> management program or<br />
<strong>disaster</strong> response plan for Jakarta.<br />
First city in Latin America to<br />
introduce a local <strong>climate</strong> action<br />
strategy to reduce emissions by<br />
7 million MT between 2008 and<br />
2012.<br />
Strategy is part of a 15-year plan<br />
in which the city is investing US$1<br />
billion a year (9% of the yearly<br />
budget) in land conservation,<br />
public spaces, air pollution, waste<br />
management and recycling,<br />
water supply and sanitation,<br />
transportation, and mobility.<br />
Disaster <strong>risk</strong> in Mexico City<br />
is primarily handled in a<br />
reactive manner and limited<br />
preventative measures have been<br />
implemented.<br />
Evident need to improve the<br />
sharing of information among the<br />
relevant government agencies.<br />
The São Paulo Agenda 2012 and<br />
the Municipal Climate Law set out<br />
targets by sector to be reached<br />
by the municipality, private actors,<br />
and other public bodies.<br />
Risky areas for landslides are<br />
already identifi ed and georeferenced<br />
by the municipality,<br />
allowing the prioritization of<br />
adaptation actions.<br />
Major slum upgrading efforts<br />
based on social vulnerability index<br />
and incidence of areas subject to<br />
landslides.<br />
Additional efforts are needed to<br />
increase coverage of sewage<br />
system and avoid illegal disposal<br />
of sewage into water courses.<br />
Mitigate <strong>risk</strong>s in fl ood- and<br />
landslide-prone areas and<br />
consider relocating families where<br />
mitigation proves ineffective.<br />
14 ■ CLIMATE CHANGE, DISASTER RISK, AND THE URBAN POOR
VULNERABLE CITIES ■ 15<br />
alone, 500 million people will become urban residents over the next 25 years,<br />
joining the current 750 million people living in cities.<br />
Likewise the geographic location where the bulk of the urban growth is happening<br />
also increases population exposure to <strong>climate</strong> <strong>change</strong> and natural hazards.<br />
Urban centers are oft en located in naturally hazardous zones, prone to fl oods and<br />
cyclones—Low Elevation Coastal Zones (LECZ); earthquake, volcanic, and landslide<br />
zones; and drought zones (fi gure 1.1 in color section). Nearly two-thirds of<br />
the urban settlements with more than 5 million people are located partly in a lowelevation<br />
coastal zone (Mc Granahan, Balk, and Anderson 2007). Indeed, 70 percent<br />
of the countries with population in the low-elevation coastal zone have their<br />
largest urban area extending into that zone (Mc Granahan, Balk, and Anderson<br />
2007). Climate <strong>change</strong> poses a <strong>risk</strong> of more extreme weather and can cause devastating<br />
urban fl ooding and coastal storms, as well as longer-term <strong>change</strong>s such<br />
as sea-level rise and increased ambient temperatures. Risks are especially high in<br />
low- and middle-income countries, where a third to a half of the population in<br />
cities lives in slums (Kinyanjui 2010).<br />
Urban exposure of population and economic assets to natural hazards and<br />
to the impacts of <strong>climate</strong> <strong>change</strong> is therefore increasing signifi cantly, with a high<br />
degree of vulnerability for a large share of cities, especially those located along the<br />
coastal areas. At the same time, the frequency and intensity of natural hazards are<br />
becoming more signifi cant, compounded by the early manifestations of <strong>climate</strong><br />
<strong>change</strong>, which are likely to result in more severe impacts in the decades to come.<br />
Table 1.4 shows the impacts of the major <strong>disaster</strong> events that aff ected cities over<br />
the past decade.<br />
Th e <strong>risk</strong>s for each hazard—fl oods and cyclones, earthquakes, volcanoes and<br />
landslides, drought, and heat waves—vary considerably, with diff erent impacts<br />
on the population. Notably, many cities are aff ected by multiple hazards. Th e<br />
Mexico City metropolitan area, for example, is aff ected by seismic <strong>risk</strong>, severe<br />
storms, heat waves, and droughts. Also, with no natural drainage for runoff from<br />
the surrounding mountains, the area is vulnerable to fl ooding, particularly to the<br />
west. Main <strong>risk</strong>s for cities, with particular implications for the urban poor, are<br />
discussed below, followed by a summary (tables 1.5 and 1.6).<br />
Floods and Cyclones<br />
Close to 2 billion people, or 38 percent of the world’s populations, live in highly<br />
fl ood-prone areas. Low Elevation Coastal Zones (LECZ) that are oft en exposed<br />
to cyclones and storm surges cover 2 percent of the world’s land area, but contain<br />
13 percent of the world’s urban population (McGranahan, Balk, and Anderson<br />
2007). Tropical storms and cyclones aff ect 1.4 billion people, or 24 percent of the<br />
world’s population that live in densely populated coastal areas. Areas most prone
TABLE 1.4<br />
Large Disasters with Major Impacts on Cities, 2000–2010<br />
Disaster Main countries affected Year Main cities affected<br />
Total number<br />
of deaths<br />
Total number<br />
affected<br />
Total damages<br />
(US$)<br />
Floods Pakistan 2010 Peshawar, Sukkur, Thatta,<br />
Mingora, Multan, Chilas<br />
1,985 18,102,327 9.5 billion<br />
Floods China 2010 Fujian, Guangxi, Fuzhou, Nanping 1,691 134,000,000 18 billion<br />
Earthquake Chile 2010 Concepción 562 2,671,556 30 billion<br />
Earthquake Haiti 2010 Port-au-Prince 222,570 3,700,000 8 billion<br />
Sichuan<br />
earthquake<br />
China 2008 Beichuan, Dujiangyan, Shifang,<br />
Mianzhu, Juyuan, Jiangyou,<br />
Mianyang, Chengdu, Qionglai,<br />
Deyang<br />
87,476 45,976,596 85 billion<br />
Cyclone Nargis Myanmar 2008 Yangon 138,366 2,420,000 4 billion<br />
Java earthquake Indonesia 2006 Yogyakarta 5,778 3,177,923 3.1 billion<br />
Kashmir<br />
earthquake<br />
Pakistan 2005 Muzaffarabad 73,338 5,128,000 5.2 billion<br />
Hurricane Katrina United States 2005 New Orleans 1,833 500,000 125 billion<br />
Floods India 2005 Mumbai 1,200 20,000,055 3.3 billion<br />
South Asian Indonesia, Sri Lanka, India, Thailand, 2004 Banda Aceh, Chennai (some 226,408 2,321,700 9.2 billion<br />
tsunami<br />
Malaysia, Maldives, Myanmar<br />
damages)<br />
Earthquake Iran 2003 Bam 26,796 267,628 500 million<br />
European heat Italy, France, Spain, Germany, 2003 Various 72,210 Not reported Not reported<br />
wave<br />
Portugal, Switzerland<br />
Floods Germany 2002 Dresden 27 330,108 11.6 billion<br />
Gujurat earthquake India 2001 Bhuj, Ahmedabad 20,005 6,321,812 2.6 billion<br />
Source: EM-DAT: The OFDA/CRED International Disaster Database, Université catholique de Louvain-Brussels—Belgium and IFRC (2010).<br />
Note: Technological and biological <strong>disaster</strong>s are not included. OFDA: Offi ce of Foreign Disaster Assistance; CRED: Centre for Research on the Epidemiology of Disasters;<br />
IFRC: International Federation of Red Cross and Red Crescent Societies.<br />
16 ■ CLIMATE CHANGE, DISASTER RISK, AND THE URBAN POOR
TABLE 1.5<br />
Global Frequency and Risk of Natural Hazards<br />
Natural hazard<br />
Number<br />
of events<br />
(2002–2010) a<br />
VULNERABLE CITIES ■ 17<br />
Mortality<br />
<strong>risk</strong> b<br />
Vulnerable<br />
urban areas<br />
Geophysical Earthquake 228 High Cities on or near<br />
fault lines<br />
Volcano 53 Low Cities near<br />
volcanoes<br />
Geophysical and<br />
hydrological<br />
Tsunami 19 High Coastal cities<br />
Mass movement<br />
(landslide, rockfall,<br />
avalanche, subsidence)<br />
167 Low —<br />
Hydrological Flood 1,501 Medium Coastal cities<br />
Storm surge 25 Low Coastal cities<br />
Meteorological Storm and cyclone 899 High Coastal cities;<br />
tropical cities<br />
Climatological Drought 133 Low Cities in or near<br />
desserts and dry<br />
areas<br />
Extreme temps<br />
(heat and cold)<br />
173 Medium–high Inland cities<br />
Wildfi re 101 Low —<br />
Source: EMDAT, OFDA/CRED International Disaster Database 2011.<br />
Note: In addition to the standard classifi cation of natural hazards represented in the above chart, this<br />
study also examines additional incipient natural hazards linked to <strong>climate</strong> <strong>change</strong>. Climate <strong>change</strong> will<br />
impact the frequency and severity of many of the hazards listed in the chart, but will also have slowonset<br />
impacts, which are not represented above, most notably (1) water scarcity and (2) sea level rise.<br />
As emerging hazards, water scarcity and sea level rise are not included in the chart, but are included<br />
throughout this study.<br />
a. Events included if (a) more than 9 fatalities, (b) 100 people reported affected, (c) a call for international<br />
assistance is issued, or (d) a state of emergency is declared.<br />
b. Mortality <strong>risk</strong> is classifi ed as follows for 2002–2010 data: Low, deaths < 10,000; medium, deaths <<br />
100,000; high, deaths > 100,000.<br />
are Central America, the Caribbean, Bay of Bengal, China, and the Philippines (see<br />
fi gure 1.1 in the color section). Th e population in large cities exposed to cyclones<br />
is projected to increase from 310 to 680 million during 2000–2050. South Asia is<br />
expected to see most of this increase, where 246 million residents of large cities will<br />
be exposed to severe storms by 2050 (Lall and Deichmann 2009).<br />
Coastal cities are exposed to a rise in sea level and face the impacts of fl ooding,<br />
increased storm damage, coastal erosion, <strong>change</strong>s in sedimentation patterns,<br />
and salt intrusion. Th e IPCC estimates that global sea levels rose by about 2 mm<br />
per year during the 20th century. Flooding and water logging can render large
18 ■ CLIMATE CHANGE, DISASTER RISK, AND THE URBAN POOR<br />
Table 1.6<br />
Incremental Impacts of Climate Change and Natural Hazards on Urban<br />
Systems and Residents<br />
Incremental impacts on urban systems Impacts on urban residents<br />
Built environment<br />
Stress on building foundations<br />
Road washouts<br />
Changing disease vectors<br />
Stress on storm-water and sewage<br />
systems<br />
Stress on water treatment systems<br />
Disruption to shipping and ports<br />
Increased energy demand<br />
Increased road surface damage<br />
Increased demand for water<br />
Natural environment<br />
Coastal erosion, altered ecosystems and<br />
wetlands<br />
Salinization of water sources<br />
Slope instability<br />
Groundwater depletion<br />
Reduction in green space and growing<br />
conditions, including urban agriculture<br />
Changes in fi sh populations<br />
Increased runoff contamination<br />
Increased heat island effect<br />
Increased air pollution<br />
Illness—heat stress, stroke, malnutrition,<br />
water-borne disease, asthma, physical<br />
and mental disability<br />
Exposure to elements from substandard<br />
construction<br />
Disruption of basic service provision and<br />
access to supplies<br />
Housing instability<br />
Property loss and relocation<br />
Loss of livelihoods<br />
Community fragmentation<br />
Exposure to fl ood-related toxins and<br />
wastes<br />
Disruption in availability of potable water,<br />
food, and other supplies<br />
Water shortages<br />
Food shortages; higher food prices<br />
Disruptions of electricity<br />
Source: Adapted from Carmin and Zhang (2009); Dickson et al. (2010); Dodman and Satterthwaite<br />
(2008); Wilbanks et al. (2007).<br />
areas of a city completely uninhabitable, or damage existing infrastructure such<br />
as transportation systems and energy plants.<br />
For the urban poor, fl oods and storms can have multiple impacts. Th e lack<br />
of storm drainage or of solid-waste disposal in slums can worsen and extend<br />
fl ooding, thus increasing exposure for slum residents. Extended fl ooding can<br />
result in disability and death by drowning or collapsing structures, sickness<br />
transmitted by water-borne vectors, displacement, and destruction of property<br />
and livelihood. Drowning and physical injury during storm surges are a signifi<br />
cant cause of mortality in coastal storms in South Asia and Latin America<br />
(IPCC 2007). Overcrowded slums are particularly exposed to the rapid spread<br />
of infectious diseases that are transmitted through fl ood waters (for example,<br />
diarrhea, cholera, typhoid, leptospirosis, and meningitis). Malaria- and<br />
dengue-carrying mosquitoes also breed in stagnant water—especially when<br />
temperatures are high. Exposed wells and broken water pipes elevate the <strong>risk</strong>
VULNERABLE CITIES ■ 19<br />
of water-borne diseases. Fecal and other hazardous matter such as chemicals<br />
and heavy metals can contaminate fl ood-waters, leading to chronic illnesses<br />
and epidemics long aft er fl ood-waters recede. In Dar es Salaam, when residents<br />
in low-income neighborhoods were asked about major problems they face in<br />
general, 35 percent identifi ed fl oods as the top problem, followed by disease and<br />
heat/increased temperatures.<br />
Salt-water intrusion can aff ect coastal habitats and aff ect the livelihoods of<br />
populations dependent on fi sheries and other coastal industries and can result<br />
in permanent damage to sensitive ecosystems. In Mombasa, Kenya, a city of<br />
870,000 on a low-lying coastal plain, a rise in sea level of just 0.3 meters would<br />
submerge about 4,600 Ha (17 percent of the city’s land area). Salt stress in<br />
Mombasa is expected to have two signifi cant impacts. It can potentially leave<br />
large areas of agricultural lands that surround the city unproductive, as well<br />
as salinate inland waterways that supply potable water. A decrease in agricultural<br />
productivity can result in rising food prices, which would impact lowincome<br />
families the most. Similarly in the poor neighborhood of Kamal Muara<br />
in Jakarta, residents rely on fi shing for their livelihood. For them, salt intrusion<br />
can result in the loss of valuable wetlands, increased salination of ground water<br />
and soil, and a greater infl ux of diverse pollutants—all of which threaten their<br />
sources of income and their livelihoods particularly in the absence of poor with<br />
no safety nets to fall back on.<br />
Earthquakes, Volcanoes, and Landslides<br />
Close to 1.2 billion people (20 percent of the world’s population) live in highly<br />
earthquake-prone areas (7.5 percent of the world’s land area). Half of the<br />
world’s cities are located on seismic fault lines. Th e urban population in areas<br />
with a signifi cant probability of a major earthquake is projected to increase<br />
from 370 million in 2000 to 870 million in 2050. Th e urban population<br />
exposed to earthquakes is expected to increase the most in East Asia and the<br />
Pacifi c from 83 million in 2000 to 267 million in 2050 (Lall and Deichmann<br />
2009). China, India, and Indonesia are the countries with the highest absolute<br />
mortality <strong>risk</strong> (ISDR 2009).<br />
Landslides are oft en a result of fl oods and storms, or earthquakes. Approximately<br />
2.2 million people are exposed to landslides globally. Exposure is very<br />
high in several large Asian countries, especially India, Indonesia, and China<br />
(ISDR 2009). Increased construction on steep and unstable hillsides, oft en by the<br />
urban poor, has contributed to landslides, intensifying the impacts of fl ooding<br />
and earthquakes in cities. Heavy rains in early 2011 in the states of Rio de Janeiro<br />
and São Paulo caused landslides resulting in an estimated 647 deaths and almost<br />
6,000 people homeless (Fohla do São Paulo, January 2011).
20 ■ CLIMATE CHANGE, DISASTER RISK, AND THE URBAN POOR<br />
Volcanic regions are spatially concentrated, with about 9 percent of the<br />
world’s population living within a 100 kilometer range of a historically active<br />
volcano (Small and Naumann 2001). A larger proportion of people live near<br />
historically active volcanoes in Southeast Asia and Central America, and most<br />
cities exposed are in developing countries (Small and Naumann 2001; Lall and<br />
Deichmann 2009). Cities that have long experienced volcanoes report that the<br />
most important components of dealing with volcanic activity are (1) early warning<br />
and (2) advanced <strong>risk</strong> assessment, especially for vulnerable communities,<br />
facilities, and infrastructure (VSJ and IAVECI 2007). In addition to possible<br />
mud and lava fl ows, volcanoes emit large quantities of ash that can aff ect a much<br />
larger area and population through impacts on agricultural production.<br />
Drought<br />
With <strong>climate</strong> <strong>change</strong>, dryland cities experience extended droughts that create<br />
water scarcity and frequent sandstorms aggravated by poor infrastructure.<br />
Water shortages increase food prices, particularly aff ecting the urban poor, and<br />
water stored during droughts has a higher <strong>risk</strong> of contamination. Th irst, hunger,<br />
under-nutrition, protein energy malnutrition, and micronutrient defi ciencies are<br />
common during drought, which have long-lasting consequences for the health<br />
and well-being of the population, particularly children (IPCC 2007). Drought<br />
is prevalent in interior and coastal regions of semiarid tropical areas. Close to<br />
70 percent of the world’s population live in drought-prone areas (38 percent of<br />
world’s land area). Sub-Saharan Africa is the most aff ected (Dilley et al. 2005).<br />
It is estimated that 75 million to 250 million people in Africa will be exposed to<br />
water stress due to desertifi cation induced by <strong>climate</strong> <strong>change</strong> (IIED undated). In<br />
cities, drought is also linked to a rise in infectious diseases, such as meningitis,<br />
malaria, dengue, and the West Nile Virus. In Dar es Salaam, for example, between<br />
2 percent and 10 percent of school children living in the city are infected with<br />
malaria (De Castro et al. 2010).<br />
Heat Waves<br />
Climate <strong>change</strong> has resulted in extreme temperature fl uctuations—aggravating<br />
a variety of existing health conditions and pollutants, and bringing about<br />
additional unhealthy <strong>change</strong>s in water and air quality. Heat waves can also contribute<br />
to an increase in fi res. Th e IPCC predicts an increase in the frequency<br />
and intensity of heat waves in populations in high-density urban areas with poor<br />
housing, increasing heat-related deaths (IPCC 2007). Most of those who died<br />
during the heat wave in France in 2003 were the elderly, women, and poor living<br />
in the urban areas of Paris (Poumadère et al. 2005).
VULNERABLE CITIES ■ 21<br />
Such “excess deaths”—or deaths above established seasonal norms (Rabie<br />
et al. 2010)—are increasing at an alarming rate. Hot days, hot nights, and heat<br />
waves have become more frequent due to global warming, and this <strong>risk</strong> of<br />
heat-induced morbidity and mortality will increase (IPCC 2007). Cities experience<br />
more intense heat waves due to denser populations, buildings, traffi c,<br />
and sparse vegetation. Climate <strong>change</strong> is expected to increase the occurrence of<br />
this “urban heat island” eff ect, resulting in locally acute harm to human health<br />
(Corburn 2009).<br />
Again, the urban poor are particularly aff ected, as they cannot avoid exposure<br />
by remaining indoors in cool or air-conditioned surroundings. Heat is an<br />
BOX 1.1<br />
Increase in the Number of Heat Waves in the Mexico<br />
City Metropolitan Area (MCMA)<br />
0–3<br />
4–7<br />
8–10<br />
11–15<br />
16–20<br />
21–30<br />
31–40<br />
41–70<br />
The temperature in MCMA is expected to rise between 2°C and 3°C by the<br />
end of the century. This temperature increase will be more noticeable during<br />
the spring months. Therefore, it is expected that heat waves (defi ned as two or<br />
more consecutive days with temperatures above 30°C) during this time of the<br />
year would become longer and more intense. The comparison of number of<br />
heat waves in MCMA between 1986 and 1997 and between 1998 and 2009<br />
clearly shows an increase in frequency. The elderly population and infants are at<br />
highest <strong>risk</strong> of dehydration. Given that the number of adults above 65 is rapidly<br />
increasing (0.66 percent to 1.22 percent between the 1980s and 1990s), more<br />
people will be exposed to the damaging effects of heat waves.<br />
Source: Leon et al. (2010).<br />
Comparison of number of heat waves in MCMA<br />
between 1986 and 1997 and between 1998 and 2009
22 ■ CLIMATE CHANGE, DISASTER RISK, AND THE URBAN POOR<br />
occupational hazard for low-income residents that are reliant on outdoor labor<br />
activities such as construction, vending, and rickshaw pulling. Increased exposure<br />
can result in dehydration, heat stroke, and, in the severest of cases, death.<br />
Efforts to Estimate Exposure in Cities<br />
Several studies have estimated the magnitude of urban exposure to natural hazards<br />
and <strong>climate</strong> <strong>change</strong> impacts. While each study has limitations in rigorously<br />
quantifying aggregate vulnerability to <strong>climate</strong> and natural hazard impacts given<br />
the high degree of complexity and uncertainty, and none explicitly includes <strong>risk</strong><br />
to the urban poor, they provide a useful macro-level look at <strong>risk</strong> and exposure<br />
in cities. Each study approaches urban <strong>risk</strong> from a diff erent angle, covering different<br />
sets of cities, diff erent types of hazards, diff erent timeframes, and diff erent<br />
asset measurements. Th at being said, all approaches confi rm that such <strong>risk</strong> is<br />
increasing and that with the increasing manifestations of <strong>climate</strong> <strong>change</strong>, it will<br />
signifi cantly worsen in the coming decades. Th e approaches are summarized in<br />
table 1.7; annex 2 discusses each approach.<br />
TABLE 1.7<br />
Major Efforts to Rank Exposure in Cities<br />
Study Approach Summary of rankings<br />
OECD ranking of port<br />
cities with high exposure<br />
and vulnerability to <strong>climate</strong><br />
extremes<br />
Munich Re’s study on<br />
megacities<br />
<strong>World</strong> Wildlife Fund <strong>climate</strong><br />
<strong>change</strong> variability in Asia<br />
Ranks 136 port cities of over<br />
1 million with high exposure to<br />
1 in 100-year surge-induced<br />
fl oods. Exposure of population<br />
and assets circa 2005 and<br />
predictions for 2070.<br />
Multihazard <strong>risk</strong> index for 50<br />
of the world’s largest and<br />
most economically important<br />
cities. Exposure to hazards,<br />
vulnerability of the built<br />
environment, and value of<br />
exposed property.<br />
Ranks 11 large cities in Asia<br />
(mostly coastal cities), based<br />
on combined rankings of<br />
exposure, sensitivity, and<br />
adaptive capacity.<br />
14 of the top 20 cities in<br />
Asia rank most vulnerable.<br />
17 of the top 20 cities are<br />
in high-income countries,<br />
given the higher value of<br />
exposed assets.<br />
Dhaka, Jakarta, and Manila<br />
ranked highest and most<br />
vulnerable.<br />
(continued next page)
TABLE 1.7 continued<br />
Earthquake <strong>disaster</strong> <strong>risk</strong><br />
index for cities (Stanford<br />
University)<br />
Resilient Cities: A Multi-<br />
Hazard City Risk Index<br />
(methodology report and city<br />
profi les)<br />
Ranks earthquake <strong>risk</strong> in cities<br />
based on hazard, exposure,<br />
vulnerability, external context,<br />
and emergency response<br />
and recovery. Methodology<br />
developed and used for<br />
sample of 10 cities.<br />
A model has been developed<br />
to rank cities based on <strong>risk</strong><br />
to population, buildings, and<br />
infrastructure using data<br />
on metropolitan elements,<br />
indices for 13 hazards, and<br />
vulnerability parameters.<br />
Current (2010) and future<br />
(2030) <strong>risk</strong> is calculated. The<br />
methodology was piloted in<br />
Bangkok, Ningbo, and Manila.<br />
VULNERABLE CITIES ■ 23<br />
Study Approach Summary of rankings<br />
Source: Author.<br />
Notes<br />
Of the 10-city sample,<br />
Tokyo was ranked highest.<br />
Metro Manila ranks the<br />
highest among the three<br />
pilot cities. Risk is growing<br />
for all cities in 2030<br />
compared to 2010; <strong>risk</strong>s<br />
from more frequent events<br />
(2-year return periods) is<br />
higher than less frequent<br />
events (30-year return).<br />
1. ISDR (2009) based on EMDAT data. Between 1975 and 2008, 78.2 percent of mortality<br />
in signifi cant natural hazards occurred in only 0.3 percent of recorded events.<br />
2. Th e full case studies are also available.<br />
3. See Dickson et al. (2010).<br />
4. United Nations, “<strong>World</strong> Urbanization Prospects,” http://esa.un.org/unup/. Th is table<br />
covers through 2010 and thus does not include the recent earthquake and tsunami in<br />
Japan.<br />
References<br />
Carmin, JoAnn, and Yan F. Zhang. 2009. “Achieving Urban Climate Adaptation in Europe<br />
and Central Asia.” Policy Research Working Paper 5088, <strong>World</strong> Bank, Washington, DC.<br />
Corburn, Jason. 2009. “Cities, Climate Change and Urban Heat Island Mitigation: Localising<br />
Global Environmental Science.” Urban Studies 46 (2): 413–427.<br />
De Castro, M.C., Y. Yamagata, D. Mtasiwa, M. Tanner, J. Utzinger, J. Keiser, and B.H.<br />
Singer. 2004. “Integrated Urban Malaria Control: A Case Study in Dar es Salaam, Tanzania.”<br />
American Journal of Tropical Medicine and Hygiene, 103–117.
24 ■ CLIMATE CHANGE, DISASTER RISK, AND THE URBAN POOR<br />
Dickson, Eric, Judy Baker, Daniel Hoornweg, and Asmita Tiwari. 2012. “Urban Risk<br />
Assessments <strong>World</strong> Bank, Washington, DC.<br />
Dilley, Maxx, Robert S. Chen, Uwe Deichmann, Art L. Lerner-Lam, and Margaret Arnold.<br />
2005. Natural Disaster Hotspots: A Global Risk Analysis. Washington, DC: <strong>World</strong> Bank/<br />
Columbia University.<br />
Dodman, David, and David Satterthwaite. 2008. “Institutional Capacity, Climate Change<br />
Adaptation and the Urban Poor.” IDS Bulletin 39(4): 67–74.<br />
Intergovernmental Panel on Climate Change (IPCC). 2007. IPCC Fourth Assessment<br />
Report: Climate Change 2007.<br />
International Federation of Red Cross and Red Cresent Societies (IFRC). 2010. <strong>World</strong><br />
Disasters Report: Focus on Urban Risk. Geneva: IFRC.<br />
International Institute for Environment and Development (IIED). 2009. Adapting Cities<br />
to Climate Change: Understanding and Addressing the Development Challenges. Ed. by<br />
Jane Bicknell, David Dodman and David Satterthwaite. London: Earthscan.<br />
———. undated. Climate Change and the Urban Poor: Risk and Resilience in 15 of the<br />
<strong>World</strong>’s Most Vulnerable Cities. London: IIED.<br />
ISDR. 2009. Global Assessment Report on Disaster Risk Reduction. Geneva: UN International<br />
Strategy for Disaster Reduction.<br />
Kinyanjui, Micahel. 2010. “Development Context and the Millennium Agenda.” In Th e<br />
Challenge of Slums: Global Report on Human Settlements 2003, revised and updated<br />
version (April 2010). UN-HABITAT: Nairobi, Kenya.<br />
Lall, S.V., and U. Deichmann. 2009. “Density and Disasters: Economics of Urban Hazard<br />
Risk.” Policy Research Working Paper 5161, <strong>World</strong> Bank, Washington, DC.<br />
Leon, C., V. Magaña, B. Graizbord, R. González, A. Damian, and F. Estrada. 2010. “Pobreza<br />
Urbana y Cambio Climático para La Ciudad de México.” Unpublished, Mayor’s Task<br />
Force Study, Mexico City.<br />
McGranahan, Gordon, Deborah Balk, and Bridget Anderson. 2007. “Th e Rising Tide:<br />
Assessing the Risks of Climate Change and Human Settlements in Low Elevation<br />
Coastal Zones.” Environment and Urbanization 19 (1): 17–37.<br />
Moser, Caroline, David Satterthwaite, et al.. 2008. “Pro-Poor Climate Change Adaptation<br />
in the Urban Centres of Low- and Middle-Income Countries.” Background<br />
paper for the “Social Dimensions of Climate Change” workshop, Washington, DC,<br />
March 5–6.<br />
Poumadère, M., C. Mays, S. Le Mer, and R. Blong. 2005. “Th e 2003 Heat Wave in France:<br />
Dangerous Climate Change Here and Now.” Risk Analysis 25: 1483–1494.<br />
Small, Christopher, and Terry Naumann. 2001. “Th e Global Distribution of Human Population<br />
and Recent Volcanism.” Global Environmental Change Part B: Environmental<br />
Hazards 3 (3–4): 93–109.<br />
UN-HABITAT. 2003a. Th e Challenge of Slums: Global Report on Human Settlements. London/Sterling,<br />
VA: Earthscan Publications Ltd.<br />
UN-HABITAT. 2003b. “Slums of the <strong>World</strong>: Th e Face of Urban Poverty in the New Millennium?<br />
Monitoring the Millennium Development Goal, Target 11 – <strong>World</strong> Wide<br />
Slum Dweller Estimation.” Working Paper.<br />
Volcanological Society of Japan (VSJ) and International Association of Volcanology and<br />
Chemistry of the Earth’s Interior (IAVCEI). 2007. Cities on Volcanoes 5 Conference Proceedings.<br />
http://www.eri.u-tokyo.ac.jp/nakada/cov5_hp/documents/abstract_e.pdf
VULNERABLE CITIES ■ 25<br />
Wilbanks, Tom J., Patricia Romero Lankao, Manzhu Bao, Frans Berkhout, Sandy<br />
Cairncross, Jean-Paul Ceron, Manmohan Kapshe, Robert Muir-Wood, and Ricardo<br />
Zapata-Marti. 2007. “Industry, Settlement and Society.” In Climate Change 2007:<br />
Impacts, Adaptation and Vulnerability. Contribution of Working Group II to the Fourth<br />
Assessment Report of the Intergovernmental Panel on Climate Change, ed. by Martin<br />
Parry, Osvaldo Canziani, Jean Palutikof, Paul van der Linden and Clair Hanson.<br />
Cambridge, UK: Cambridge University Press.<br />
<strong>World</strong> Watch Institute. 2007. State of the <strong>World</strong>: Our Urban Future. New York: W.W.<br />
Norton and Company.<br />
<strong>World</strong> Bank and United Nations. 2010. Natural Hazards, UnNatural Disasters. Washington,<br />
DC: <strong>World</strong> Bank.
Key Messages<br />
2<br />
Vulnerability of the Urban Poor<br />
Distinctions in spatial and location characteristics affect the nature and<br />
degree to which slum residents are impacted by natural <strong>disaster</strong> and <strong>climate</strong><br />
<strong>change</strong> events.<br />
Exposure to <strong>risk</strong> by the urban poor is exacerbated by where they live within<br />
cities and their limited access to basic infrastructure and services.<br />
Cities typically do not have the resources or capacity to keep up with growing<br />
needs of service provision in poor urban areas.<br />
Land tenure, employment, fi nancial security, and availability of social networks<br />
affect the sensitivity and adaptive capacity of the urban poor to <strong>climate</strong><br />
<strong>change</strong> and <strong>disaster</strong> <strong>risk</strong>.<br />
As discussed in Chapter 1, the <strong>risk</strong>s in cities are on the rise as countries urbanize,<br />
particularly in cyclone-prone coastal areas and earthquake zones. Th is has<br />
major implications for the urban poor, with estimates that the population living<br />
in informal settlements is increasing by about 25 million per year (ISDR 2009).<br />
A number of characteristics directly relate to where and how the urban poor live<br />
and their access to basic services that increase their exposure and sensitivity to<br />
the <strong>risk</strong>s associated with <strong>climate</strong> <strong>change</strong> and natural hazards. Other factors such<br />
as social networks and density can positively aff ect their adaptive capacity. Th is<br />
chapter discusses how the location, physical layout, and lack of infrastructure<br />
■ 27
28 ■ CLIMATE CHANGE, DISASTER RISK, AND THE URBAN POOR<br />
and basic services in slums increase exposure to <strong>risk</strong>, and how key characteristics<br />
such as tenure, employment, fi nancial insecurity, and social networks aff ect their<br />
vulnerability.<br />
Exposure: Location and Settlement Patterns<br />
of the Urban Poor<br />
Th e choice of where to live within cities is driven by tradeoff s between what is<br />
aff ordable, proximity to income-earning opportunities, and where individuals<br />
may have social networks and kinship ties. Typically the areas aff ordable to the<br />
poor are those that others deem undesirable for residential purposes, or unusable<br />
for other urban activities. Slums have resulted from squatting on vacant or<br />
undeveloped lands, or from the deterioration of existing neighborhoods such<br />
as inner cities and public and industrial housing (UN-HABITAT 2003a). Many,<br />
though not all, of the urban poor live in slums that have the most visible concentrations<br />
of poor people, with lower-quality housing and services. Yet not all<br />
slum residents are poor. In many cities, such as Mumbai, where housing supply is<br />
extremely limited, the cost of housing, even for middle-income families, is unaffordable,<br />
with some living in slums.<br />
Slum sites may be unsafe, and un-serviced, two conditions exacerbated by lack<br />
of security of tenure. Unsafe sites can be on fragile, dangerous, or polluted lands<br />
that are fl ood prone, on unstable soils, such as steep slopes or landfi lls, or are close<br />
to physical or environmental hazards such as toxic urban and industrial wastes,<br />
rail corridors, and electricity lines. Housing is typically small, overcrowded, of<br />
substandard quality, in poor structural condition, and located in highly dense<br />
areas with haphazard or irregular layouts that lack basic services. Th e insecurity<br />
of tenure puts the poor at constant <strong>risk</strong> of eviction, hampering residents from<br />
investing in housing improvements and eff orts to provide services.<br />
Th e lack of aff ordable land is, in many cities, attributed to ineffi cient land use<br />
and housing regulations, and a lack of public and private housing fi nance. Density<br />
regulations, such as low fl oor-area ratio (FAR) 1 and unaff ordable minimum<br />
development and housing standards restrict the supply of land and housing and<br />
drive up prices, particularly aff ecting low-income groups.<br />
Although the percentage share of urban population living in slums has<br />
decreased markedly over the last 20 years, in absolute terms the number of slumdwellers<br />
is growing and is expected to rise due to both rural–urban migration<br />
and natural increase. It is estimated that about one-third of the urban population<br />
in developing countries—nearly 1 billion people are living in slums. 2 In Africa,<br />
the proportion of urban residents living in slums is astoundingly at 72 percent, up<br />
from 62 percent a decade ago (UN-HABITAT 2010).
VULNERABILITY OF THE URBAN POOR ■ 29<br />
Across slums, there are many diff erent types, with important distinctions in<br />
spatial and location characteristics that aff ect the nature and degree to which<br />
slum residents are impacted by natural <strong>disaster</strong> and <strong>climate</strong> <strong>change</strong>.<br />
Slum Formation<br />
Th e physical formation of slums can be categorized as follows: (1) the inner city<br />
or historic core, (2) scattered pockets within the city, and (3) peri-urban areas<br />
(UN-HABITAT 2003a). Each has its own characteristics, which result in diff erent<br />
types of vulnerability for residents.<br />
Inner-City Slums<br />
In many older cities, a common urbanization pattern has been an increase in<br />
commercial and manufacturing activities in the historic core, which results in<br />
deterioration of residential areas as wealthier residents move out to newer neighborhoods.<br />
Abandoned buildings have been subdivided to provide rental housing<br />
with shared amenities that oft en degenerate into slum conditions. Inner-city<br />
slums are highly dense, rooming houses are overcrowded, and very small apartments<br />
accommodate growing families. Th e older parts of most Asian and African<br />
cities, such as Delhi, Dhaka, Cairo, and Istanbul, are inner-city slums.<br />
Although the structures are made of permanent materials, they are typically in<br />
poor condition due to deterioration over time and lack of maintenance. Absentee<br />
landlords have little incentive to maintain or redevelop the structures due to rent<br />
controls and cost, and renters lack the incentive and are too poor to invest in<br />
maintenance. 3 In an earthquake or landslide, the poor condition of such structures<br />
can amplify the destruction and damage.<br />
Scattered Slum Pockets<br />
Squatter settlements interspersed within a city account for much of the lowincome<br />
housing in rapidly developing cities. Most low-income households<br />
illegally occupy or “squat” on vacant land close to their work place without the<br />
consent of the owner or the local authorities. 4 Th e land may be left vacant for several<br />
reasons: it may be reserved for public amenities, under litigation, owned by<br />
absentee landlords, or physically and environmentally hazardous. Land is informally<br />
divided, sold, leased, sub-leased to households who build dwelling units<br />
incrementally, with limited or no services (UN-HABITAT 2003a).<br />
Although eviction in such areas is always a possibility, in many cities continued<br />
presence has given squatters a de facto right to develop and, in fact, older<br />
slums have better access to services and more permanent structures. Th ey face<br />
little political opposition since they off er sizable vote banks. In the older slums, a<br />
vast majority of residents invest in upgrading their structures with more durable
30 ■ CLIMATE CHANGE, DISASTER RISK, AND THE URBAN POOR<br />
and permanent materials over time. Older slums have more owner-occupied and<br />
self-employed residents than newer, poorer settlements. However, renting and<br />
subletting from subsistence landlords, absentee landlords, developers, and rent<br />
agents is common (UN-HABITAT 2003a).<br />
Peri-urban Slums<br />
Slums in peri-urban areas are formed by one of three processes: squatting; deterioration<br />
of public and industrial housing that created slum estates; and illegal<br />
subdivision of land with the permission of the owner, but not of local authorities.<br />
While land is less expensive than in the inner cities, the cost of transportation<br />
can be high and travel times long, making access to work, markets, and social<br />
amenities more diffi cult and costly. Slum estates were typically built between the<br />
1950s and 1970s, when many cities built public housing to rehabilitate residents<br />
of center-city slums and squatter settlements with minimal services. Although<br />
the structures are relatively recent, they were built of poor materials and construction<br />
quality. Examples include “newtowns” in Cairo (Helwan, Moktam, and<br />
Shubra), Ciudad Kenedy in Bogota, large State Housing Board housing developments<br />
constructed in almost all the major Indian cities during the 1970s and<br />
1980s, and housing for industrial workers, such as hostels and estates of small<br />
dwellings for mine workers in Southern Africa, “chawls” built for textile industry<br />
workers in Mumbai, India, and slab blocs in the former communist countries<br />
(UN-HABITAT 2003a).<br />
In illegal subdivisions, low-income households purchase or rent private land<br />
of relatively lower value at the periphery from developers that is developed<br />
without the consent of the local authorities, and hence is illegal. Th e developer<br />
may be a well-connected businessman or politician who has the resources<br />
and power to purchase, lay out, and allocate land. Th e layouts, however, may<br />
not meet offi cial development standards. Since trunk infrastructure is limited<br />
in peri-urban locations, most illegal subdivisions have poor or no services.<br />
Housing conditions are typically better than adjoining rural areas and squatter<br />
settlements of the same age. Dwellings are mostly owner occupied, although<br />
renting also exists.<br />
Spatial Contiguity and Size<br />
Th ere are slums laid out contiguously that are typically either physically isolated<br />
from surrounding planned neighborhoods by canals, storm drains, railway<br />
tracks, and motorways, or may be interspersed within planned residential areas.<br />
Th e size of slums can also vary substantially, also aff ecting exposure.<br />
Although some slums are larger than many cities, medium-sized slums are<br />
more common. Kibera, in Nairobi, is a 550-acre slum with between 200,000
BOX 2.1<br />
VULNERABILITY OF THE URBAN POOR ■ 31<br />
Locating Vulnerable Households in the Mexico City<br />
Metropolitan Area (MCMA)<br />
Legend<br />
vulnerable populations<br />
Distribution of vulnerable population in MCMA<br />
Legend<br />
vulnerable housing<br />
Distribution of vulnerable housing in MCMA<br />
In preparing a socioeconomic assessment of Mexico City, two areas were<br />
selected for determining household vulnerability: population and housing<br />
characteristics. Understanding the characteristics of population and housing<br />
separately can have signifi cant policy implications related to more effective<br />
targeting of social programs or housing upgrades. Overlaying the spatial<br />
distribution of vulnerable population and vulnerable housing also provided an<br />
expanded understanding of at-<strong>risk</strong> areas, which was critical for subsequently<br />
assessing hazard impact.<br />
The top map was developed to assess vulnerable populations based on<br />
an index using the following indicators: percentage of adult population without<br />
formal education, percentage of population over 65 years old, percentage<br />
(continued next page)
32 ■ CLIMATE CHANGE, DISASTER RISK, AND THE URBAN POOR<br />
BOX 2.1 continued<br />
of recent migrants, percentage of households headed by women, and percentage<br />
of adult population earning below the minimum wage. The analysis<br />
determined that 42 percent of the urban population is highly vulnerable from a<br />
demographic and human development point of view.<br />
The lower map was developed to assess housing vulnerability based on<br />
an index combining indicators of roof quality, walls quality, availability of basic<br />
services, availability of a refrigerator, and security of tenure. The analysis found<br />
that 30 percent of the population (27 percent of households) lives in highly<br />
vulnerable housing units.<br />
An overlay of housing vulnerability and population vulnerability—through a<br />
simple vulnerability matrix—shows that 27 percent of the total population of<br />
MCMA is vulnerable individuals living in vulnerable housing. It is evident also<br />
from the map above that in MCMA most vulnerable houses are located in the<br />
peri-urban areas.<br />
Source: Leon et al. (2010).<br />
Legend<br />
Population and housing not vulnerable<br />
Vulnerable population<br />
Vulnerable population and housing<br />
Vulnerable housing<br />
Distribution of highly vulnerable areas in MCMA<br />
and 1 million inhabitants; 5 Dharavi, the largest slum in India (in Mumbai), has<br />
a population estimated between 600,000 and 1 million residing on 430 acres. 6 In<br />
Ghana, Aishaman (population 150,000), is as large as or larger than Tema, the<br />
city it is located in (population 140,000) (UN-HABITAT 2003a). Th ese very large<br />
slums are, however, relatively uncommon. More common are medium-sized<br />
slums interspersed within a city or peri-urban slums described above.<br />
Th e layout of slums may have costs and benefi ts in terms of destruction or<br />
damage from extreme weather or hazards. For example, if contiguous slums
VULNERABILITY OF THE URBAN POOR ■ 33<br />
share the same network of services, the disruption of water supply, sanitation,<br />
drainage, and electricity can aff ect more slum residents. Contamination of water<br />
sources and poor solid-waste disposal can spread infectious diseases more easily<br />
over the larger area and aff ect more residents. At the same time, it is possible to<br />
provide safety and emergency relief to more slum households in a contiguous<br />
area through reaching one location. Equally, it is possible to effi ciently provide<br />
services to more urban poor, improving their resilience to hazards.<br />
Households in interspersed slum pockets might have a slightly higher adaptive<br />
capacity due to stronger linkages with higher-income households for whom<br />
they perform services. Th eir employers may be in a better position to provide<br />
emergency fi nancial relief than other slum residents and these relationships may<br />
improve their adaptive capacity in crisis. Small slums use mostly the services of<br />
the neighboring planned areas. Th ey illegally tap the public water supply, as well<br />
as use open public drains and public open space for sanitation and garbage disposal.<br />
Th ese slum pockets are oft en overlooked or even protected by neighboring<br />
upper-income areas, since they depend on the slum residents for domestic<br />
services (UN-HABITAT 2003)—thereby improving the coping capacity of the<br />
residents to impacts of <strong>disaster</strong>s.<br />
BOX 2.2<br />
Jardim Ana Maria: A Slum Pocket in São Paulo<br />
Jardim Ana Maria is a slum area in São Paulo with 600 housing units in approximately<br />
21,000 square meters. Located in the district of Brasilandia, one of the<br />
poorest in the city, Jardim Ana Maria is classifi ed as highly and very highly vulnerable<br />
in 97 percent of its territory. More than 99 percent of the slum is under<br />
some kind of hazard; 92 percent of the area is exposed to landslides and<br />
(continued next page)
34 ■ CLIMATE CHANGE, DISASTER RISK, AND THE URBAN POOR<br />
BOX 2.2 continued<br />
6 percent to washout alongside the water courses. Exposure is exacerbated<br />
by poverty and high concentrations of garbage and construction rubbish in<br />
the streets, lack of a superfi cial drainage system, and lack of a water supply<br />
in some of the residences. Jardim Ana Maria only began to be occupied in<br />
1973. Today, the government of São Paulo has classifi ed Jardim Ana Maria<br />
as a Special Interest Area, a denomination that guarantees that the area can<br />
be used only for social housing; this will prevent future evictions motivated by<br />
commercial purposes.<br />
Source: <strong>World</strong> Bank and Diagonal Ltd. (2011).<br />
Site Conditions<br />
Hazardous sites, where slums are oft en located, may be in fl ood zones, low-lying<br />
dry season river beds, swamps, marshes, steep slopes, and garbage landfi lls. Th e<br />
sites may be dangerous, such as close to high-tension lines, railway tracks, or<br />
highways, or may be polluted because of being close to toxic industries. Poor<br />
conditions of structures, as well as the lack of services, compound the impact of<br />
hazards on the urban poor and increase their <strong>risk</strong>s.<br />
In São Paulo, approximately 20 percent of the land where slums are located<br />
is subject to geo-technical hazard, vulnerable to landslides and washouts. Th is<br />
includes 407 highly hazardous areas located in 26 subdistricts, all of which are<br />
informal settlements. Overall, more than 5 percent of slum areas are highly or<br />
very highly exposed. Th is means that the areas are highly prone to be aff ected by<br />
destructive events in the next 12 months (box 2.3).<br />
Density and Morphology<br />
Slum density is measured by a combination of population density and density of<br />
dwelling units and can be both a liability and an asset. It is no surprise that due to<br />
the high cost of urban land, slums have high population and dwelling density. For<br />
example, in Mumbai, 60 percent of its total population lives in slums that occupy<br />
a mere 8 percent of its total area.<br />
Although spatial contiguity and high density might increase the adaptive<br />
capacity of the urban poor, these factors might also increase the population<br />
exposure of the urban poor to loss of life and injury, and destruction and damage<br />
to infrastructure and transportation linkages. Lack of, or poorly maintained,<br />
infrastructure in dense slums can magnify the impact of small hazards and aff ect
BOX 2.3<br />
VULNERABILITY OF THE URBAN POOR ■ 35<br />
São Paulo’s Geotechnical Hazard Areas and Declivity<br />
Hazard Areas<br />
Legend<br />
Geotechnical Risk Areas<br />
Slope<br />
0–5%<br />
5–25%<br />
25–60%<br />
>60%<br />
Legend<br />
Rivers<br />
Informal settlements<br />
Slums<br />
Wellsprings<br />
Areas ranked by their critical level and by types of settlements in São<br />
Paulo City.<br />
Low<br />
hazard<br />
Medium<br />
hazard<br />
High<br />
hazard<br />
Very high<br />
hazard<br />
Slums 2.92% 11.90% 4.11% 1.40%<br />
Settlements/<br />
allotments<br />
0.65% 2.93% 0.97% 0.43%<br />
Urbanized centers 4.59% 7.62% 0.56% 0.09%<br />
Source: HABISP [Sistema de informações para habitação social] – SEHAB [ Secretaria da<br />
Habitação e Desenvolvimento Urbano]; IPT [Instituto de Pesquisas Tecnológicas do Estado de<br />
São Paulo] 2010; <strong>World</strong> Bank and Diagonal Ltd. (2011).<br />
more slum residents. As mentioned above, in dense inner-city slums, aging<br />
infrastructure and poor conditions of old, historic structures aggravate damages<br />
from hazards. Infrastructure in such areas was typically planned for a smaller<br />
population and is now inadequate. Frequent rainfall can cause drainage challenges,<br />
dis ruption of transportation services, and destruction or damage to roads.
36 ■ CLIMATE CHANGE, DISASTER RISK, AND THE URBAN POOR<br />
BOX 2.4<br />
Pattern between Flood-Prone Areas and Where the<br />
Poor Live in Jakarta<br />
Flood Areas<br />
JAKARTA<br />
District Boundary<br />
Subdistrict Boundary<br />
Administrative Village Boundary<br />
Number of Poor Household<br />
0–150<br />
151–450<br />
451–750<br />
751–1,050<br />
1,051–3,000<br />
Source: <strong>World</strong> Bank (2011b). The map on the top illustrates the areas of Jakarta that would be<br />
affected by a fl ood with the same magnitude as the one that affected the city in 2007. The map<br />
on the bottom shows the concentration of poor households in Jakarta by subdistrict. An overlay<br />
of the two maps confi rms that the poor are more likely to live in <strong>disaster</strong>-prone areas.
VULNERABILITY OF THE URBAN POOR ■ 37<br />
Th e economies of scale off ered by the high density of slum settlements can, on<br />
the other hand, increase the adaptive capacity of cities through effi ciencies in the<br />
provision of basic services.<br />
Th e morphology of slums refers to the layout of slums and the distribution of<br />
built-up areas to open areas. Slums are usually characterized by irregular layouts,<br />
with very little open space in comparison to built-up areas. Haphazard layouts<br />
with minimal open space, such as those in inner-city slums, can create poorly<br />
ventilated living conditions, and extensive built-up areas increase local ambient<br />
temperatures. Irregular layouts and narrow streets that were originally suited for<br />
pedestrian traffi c also limit the possible locations for water supply, sanitation services,<br />
and the collection of solid waste. During crises, irregular street networks<br />
impede relief eff orts, especially in larger slums. Aft er the Gujarat (India) earthquake<br />
of 2001, major casualties were seen in the old parts of towns where the<br />
traditional street network trapped residents and hindered rescue eff orts.<br />
Subdivisions in peripheral areas have increasingly gridiron layouts, since land<br />
is not a constraint and therefore easy to lay out; additionally, residents recognize<br />
that it is easy to install services later. Such a pattern reduces the exposure of these<br />
residents to hazards.<br />
BOX 2.5<br />
Exposure in Slums of South Asia and Latin America<br />
A study of slums in six cities in Bangladesh showed that the major concentrations<br />
of slum settlements were on both sides of railway lines, low-lying riverbanks,<br />
or along embankments that have poor drainage. More than 50 percent<br />
of the slum clusters were typically fully fl ooded or partially fl ooded when the<br />
country experienced fl oods due to moderate-to-heavy rainfall during the rainy<br />
season (Center for Urban Studies 2006).<br />
In Kathmandu, Nepal, a city of 1 million people located in a Himalayan<br />
valley, squatter settlements in the city are growing at an alarming rate. Most<br />
are located along the banks of its three rivers on steep slopes. Approximately<br />
25 percent of the households fl ood due to inadequate drainage. The squatter<br />
settlements fl ood when water levels rise in the monsoon season. Some<br />
seek shelter with relatives and friends during the monsoon season as rising<br />
water inundates their homes. People who live here are also susceptible to<br />
water-borne diseases that increase when fl ood water stagnates in and around<br />
their homes. Solid waste is regularly thrown into the rivers, since the squatter<br />
(continued next page)
38 ■ CLIMATE CHANGE, DISASTER RISK, AND THE URBAN POOR<br />
BOX 2.5 continued<br />
settlements do not have any waste-collection service. The storm-water and<br />
sewage network operates at 40 percent capacity, since it is blocked by sludge<br />
and debris. This increases the incidence of disease, exacerbated by the lack<br />
of affordable medical treatment for the urban poor.<br />
In Bogota, Colombia, correlation of data on the location of properties,<br />
income-levels of households, and earthquake <strong>risk</strong> revealed that poor households<br />
are located closer to fault lines and face a disproportionate burden, almost<br />
twice the seismic <strong>risk</strong> compared to higher-income households (Lall and<br />
Deichmann 2009). Location of poor settlements on steep terrain increases<br />
erosion and landslide <strong>risk</strong> due to natural hazards and <strong>climate</strong> <strong>change</strong> (Lall and<br />
Deichmann 2009).<br />
In Caracas, Venezuela, which is located in a high-<strong>risk</strong> seismic zone, highrise<br />
buildings and densely packed apartment blocks are concentrated where<br />
shaking is expected to be highest during an earthquake. Lack of building<br />
codes and enforcement allowed residents to build on alluvial fans, which reactivated<br />
during December 1999. That month experienced over 900 millimeters<br />
of rain in a 72-hour period, triggering landslides, mudfl ows, and debris fl ows.<br />
“Barrios” or slums occupy the low-lying, rugged mountains to the east and<br />
west of the city center, where rainfall-induced debris fl ows are expected to be<br />
the greatest. The dwelling units in the barrios are constructed of unreinforced<br />
masonry, making them particularly vulnerable to earthquakes. Although various<br />
groups are working to repair and rebuild housing in safe locations, poor<br />
planning and code enforcement are allowing squatters to return to the alluvial<br />
fans and streambeds where most of the December 1999 destruction was concentrated<br />
(Dilley et al. 2005).<br />
Source: Author.<br />
Climate Change, Disaster Risk, and the Delivery<br />
of Basic Services for the Urban Poor<br />
Access to safe shelter, water, sanitation, proper drainage, reliable transport, roads,<br />
solid-waste removal, and public health services remains an elusive goal for many<br />
of the urban poor. With rapid urbanization comes the challenge of providing<br />
basic services to a growing population, oft en to people with limited means and<br />
living in informal settlements. Cities typically do not have the resources or capacity<br />
to keep up with the growing need for services. Issues of informality further
VULNERABILITY OF THE URBAN POOR ■ 39<br />
exacerbate the challenges, given that many governments, nongovernmental organizations<br />
(NGOs), and the private sector are reluctant to invest where residents<br />
lack secure tenure, as they perceive these investments as <strong>risk</strong>y. Th ere is also a<br />
perception that the urban poor are unable to pay for basic services, yet in many<br />
cities, the urban poor pay more than the non-poor, as they have to rely on expensive<br />
delivery systems.<br />
A lack of basic services coupled with overcrowded living conditions reduces<br />
the resilience of the urban poor. Th e absence of drainage may turn a heavy rainfall<br />
into a disastrous fl ood. Lack of solid-waste disposal blocks drainage channels<br />
and compounds the <strong>risk</strong> of fl ooding. Destruction or damage to infrastructure can<br />
lead to water scarcity, contamination, and spread of disease. Infectious diseases<br />
can spread rapidly through slums. Lack of access roads can prevent relief eff orts<br />
from reaching households. Lack of income and lack of access to safe housing<br />
with good provision for water, sanitation, health care, and education aff ects the<br />
capacity of slum residents to recover. Insecure tenure coupled with socio-spatial<br />
exclusion also reduces their access to receive information and fi nancial assistance<br />
to cope with <strong>disaster</strong>s (Lall and Deichmann 2009) (see table 1.3).<br />
Th ese potential impacts emphasize the urgency of providing access to clean,<br />
safe, and reliable services. Such priorities are consistent with the Millennium<br />
Development Goals and basic development goals for human settlements of the<br />
past decades—ensuring adequate shelter, provision of safe water and basic sanitation,<br />
reliable energy, proper drainage, solid-waste collection, transport, and<br />
protection from disease. Th e <strong>risk</strong>s from <strong>disaster</strong>s, <strong>climate</strong> <strong>change</strong>, and growing<br />
exposure provide added incentive for increased investments in existing and new<br />
infrastructure. As seen in recent <strong>disaster</strong>s in Pakistan, Haiti, and elsewhere, such<br />
catastrophes can wipe out decades of development gains in infrastructure and<br />
service delivery. Proper investments now can protect citizens, save lives, and<br />
minimize loss and destruction in the decades to come. Some of the key issues<br />
related to the provision of safe shelter, water, drainage, solid-waste collection,<br />
roads and transport, energy, and public and environmental health to the urban<br />
poor in the context of natural hazards and <strong>climate</strong> <strong>change</strong> are discussed below. 7<br />
Shelter<br />
Th e housing in low-income urban settlements tends to be of poor quality and<br />
located on precarious sites. While formal housing for the urban poor does exist,<br />
it is more common for housing to be self-constructed and made from low-quality<br />
materials. For squatters, the threat of eviction prevents the investment in durable<br />
materials.<br />
New patterns in temperature and precipitation will, in some cases, alter the<br />
habitability and stability of residences, while increased frequency and intensity of
40 ■ CLIMATE CHANGE, DISASTER RISK, AND THE URBAN POOR<br />
natural hazards will place settlements and homes at greater <strong>risk</strong>. Although there<br />
are wide variations in impacts, the presence of substandard housing, lack of housing<br />
standards and policy enforcement, and reliance on informal service providers<br />
in most settlements result in increased <strong>risk</strong>s as the <strong>climate</strong> <strong>change</strong>s.<br />
From the perspective of managing the <strong>risk</strong> of <strong>disaster</strong>s, the collapse of<br />
one poorly constructed structure can trigger the collapse of multiple houses.<br />
Th e accumulation of debris can block access to relief. For example, the collapse<br />
of a building aft er an earthquake can cause a major fi re that in turn<br />
can damage other structures that had not been originally aff ected by the<br />
earthquake (Kunreuther and Roth 1998). Research conducted by the Architectural<br />
Institute of Japan in 1997 on the Great Hanshim-Awaji earthquake<br />
highlighted that poorly constructed houses compounded the severity of<br />
the impacts. Th e rubble blocked transportation networks, prevented eff ective<br />
fi re-fi ghting, and made recovery more diffi cult (Nakagawaa, Saito, and<br />
Yamaga 2007).<br />
Th e <strong>disaster</strong>s in the Philippines listed in table 2.1 highlight how natural<br />
hazards in informal settlements have major impacts in informal settlements.<br />
Heavy rains, fl oods, mudfl ows, and fi re oft en decimate homes of the urban<br />
poor.<br />
In the wake of <strong>disaster</strong>s that destroy housing in informal settlements, reconstruction<br />
and rehabilitation are complex. Support from community organizations<br />
and the government is oft en needed to ensure that the poor regain housing and<br />
that the new housing is more stable than the structures it replaces. However, this<br />
is not always available, particularly for those in informal settlements. For example,<br />
aft er Mumbai’s devastating fl oods in 2005, the state government announced a<br />
rehabilitation package of approximately US$5 million for the fl ood victims (Concerned<br />
Citizens Commission 2005). Th e poor living in formal settlements were<br />
able to take advantage of this support, while those living in informal settlements<br />
were ineligible for the rehabilitation package (Concerned Citizens Commission<br />
2005).<br />
In the absence of offi cial support to help informal settlers cope with and<br />
recover from <strong>disaster</strong>s, some municipalities are making modest eff orts to extend<br />
assistance. Cape Flats, for instance, is an informal settlement in Cape Town that<br />
is located below sea level and is prone to fl oods each winter. While the city does<br />
not provide services to this area, it has cleaned storm drains and worked with<br />
NGOs to establish emergency shelters, ensure the availability of basic relief provisions,<br />
and disseminate information so that dwellers can take their own measures,<br />
such as raising their homes and diverting fl ood waters (Simply Green 2009). As<br />
this example illustrates, in most instances the urban poor living in fl ood-prone<br />
areas have little or no assistance and therefore rely on ad hoc measures to protect<br />
their homes and well-being. A case in point is the slum of Makoko in Lagos,
VULNERABILITY OF THE URBAN POOR ■ 41<br />
TABLE 2.1<br />
Impacts of Recent Disasters in Informal Settlements: The Philippines<br />
Disaster Year Details<br />
Trash slides at the<br />
Payatas solid-waste<br />
dump in Quezon City<br />
(metro Manila)<br />
Landslide in Barangay<br />
Guinsaugon<br />
Mount Mayor mudfl ow<br />
and fl oods<br />
Fire in the settlement<br />
of the lower Tipolo<br />
Homeowners<br />
Association in Mandaue<br />
2000 Heavy rains from typhoons caused a 15-meter<br />
(50-foot) slope in the dump to collapse, burying<br />
hundreds of homes; 288 people were killed and<br />
several hundred families displaced. Subsequent<br />
fl ash fl oods affected the homes and livelihoods of<br />
many more people.<br />
2006 The whole barangay (district) was buried and<br />
another 80 barangays affected. A total of 154<br />
deaths were recorded, 968 people reported<br />
missing, 3,742 displaced, and 18,862 affected.<br />
2006 Typhoons triggered huge fl oods, mudslides, and<br />
avalanches. In the Bicol region alone, at least<br />
208 people died and another 261 were reported<br />
missing. These settlements were recovering from a<br />
previous typhoon.<br />
2007 246 structures were destroyed, leaving 913 people<br />
homeless.<br />
Flash fl ood in Iloilo 2008 In the city of Iloilo, 152 of its 180 barangays were<br />
affected by heavy rain and fl ooding. Up to 500<br />
people were killed, with 261,335 affected. Many<br />
houses were washed away and many households<br />
lost their documentation.<br />
Flooding in Manila<br />
during typhoons Ondoy<br />
and Pepeng<br />
Source: IFRC (2010).<br />
2009 Typhoon Ondoy alone left 280 people dead and<br />
more than 700,000 people displaced to shelters or<br />
temporary stays with host families; more than<br />
3 million people were affected in total.<br />
Nigeria. To cope with the challenge of being located in a fl ood basin, residents<br />
have raised their homes on stilts. Similarly, in the Alaho settlement in Accra, residents<br />
respond to fl oods by placing barriers across their doors, raising the height<br />
of their furniture, creating elevated storage areas, and putting their homes on<br />
higher foundations (ActionAid 2006).<br />
Water Supply and Sanitation<br />
Th e delivery of a sustainable water supply and sanitation is increasingly diffi cult<br />
in urban areas due to (1) population growth and urbanization, (2) poor management<br />
and aging infrastructure, and (3) the impacts of <strong>climate</strong> <strong>change</strong>. A deteriorating<br />
water supply and sanitation infrastructure with poorly maintained water
42 ■ CLIMATE CHANGE, DISASTER RISK, AND THE URBAN POOR<br />
storage, aging treatment plants, and ineffi cient distribution cannot eff ectively<br />
serve the current population. Moreover, urban population growth will result in<br />
an increased competition for water resources and will threaten the ecosystems<br />
that supply it. Th is means that while urban demand for water increases, supply<br />
is being reduced. Global water consumption increased six-fold in the 20th century,<br />
and it is expected to continue growing due to expanding industrialization in<br />
urban and peri-urban areas.<br />
Most cities in developing countries are challenged with keeping up with the<br />
growing demand. Water supply and sanitation remain particularly weak in informal<br />
settlements. For example, in Mumbai, India, of the more than 7 million residents<br />
living in informal settlements, only 5 percent have individual household<br />
connections to water. About one-half of residents use connections shared among<br />
fi ve or more households (Water and Sanitation Program 2009, 11).<br />
Th e poor routinely use nonresidential sources of supply, which can include<br />
illegal boreholes, kiosks, water-delivery trucks, and a variety of small service providers.<br />
In many cases, water obtained from these private vendors costs several<br />
times more per liter than water obtained through the municipal water system.<br />
For example, water truckers charge as much as 10 to 15 times more per unit volume<br />
than the price of public utilities, which refl ects the substantially higher cost<br />
of delivering water by truck (Baker 2009). In Nairobi’s Kibera slum, more than<br />
500,000 residents get water from some 650 water kiosks, which lay pipes to connect<br />
to the city water utility and sell water to residents (Water and Sanitation<br />
Program 2009, 19). In Dar es Salam, Tanzania, only 86,000 of the city’s 2.5 million<br />
residents are served by the privatized water utility (DAWASA). Alternative coping<br />
mechanisms that the poor use to off set the high costs of water from vendors<br />
include self-imposed rationing, collecting water from surface sources, and rainwater<br />
harvesting.<br />
Th e situation for sanitation is even worse, with almost half of the population in<br />
developing countries without basic sanitation. Further, while progress has been<br />
made in improving access to sanitation in the last two decades, most progress has<br />
occurred in rural areas, where sanitation coverage increased 43 percent. Sanitation<br />
coverage in urban areas over the last two decades, by contrast, has improved<br />
only 5 percent (UN 2010). In São Paulo half of the residents living in informal<br />
settlements do not have access to sanitation facilities. In Dar es Salaam’s Temeke<br />
municipality, 78 percent of residents report using pit latrines and the remaining<br />
population defecate in the open (Water and Sanitation Program 2009, 82).<br />
Water supply and sanitation services will be heavily impacted by <strong>climate</strong><br />
<strong>change</strong>, and with it, inequality in urban water distribution and contamination of<br />
available water will increase. In some regions, the unreliability of clean water and<br />
poor sanitation in low-income urban settlements will only become more acute,<br />
putting these populations at high <strong>risk</strong>. Th e IPCC has projected that increases in
BOX 2.6<br />
Water Supply in Dar es Salaam<br />
VULNERABILITY OF THE URBAN POOR ■ 43<br />
Continuous, full-pressure water supply remains a dream for the urban poor in<br />
Dar es Salaam. Water quality and reliability are poor, especially in low-income<br />
areas, where the poor frequently have to purchase water at exorbitant prices<br />
from vendors, kiosks, and neighbors. In Dar es Salaam, 60 percent of the water<br />
is lost due to poor maintenance of the water-supply network, and another<br />
13 percent through unauthorized use and illegal taps. Only 26 percent of the<br />
water is billed (Greenhill and Wekiya 2004) and only16 percent actually paid for.<br />
Existing constraints to clean-water supply for the residents of Dar es<br />
Salaam’s unplanned settlements will become an increasingly severe issue<br />
given both increased climatic variability (with the possibility of more or longer<br />
droughts) and the projected growth of the city’s population over the coming<br />
decades. At present the city’s water demand already far outstrips its water-treatment<br />
capability. Existing treatment capacity is 282,000 m3 per day;<br />
water demand in 2007 was 412,000 m3 per day. Demand is projected to rise<br />
to 964,000 m3 per day by 2032 (DAWASA 2008). A study of 45 of Dar es<br />
Salaam’s wards, containing 84 percent of the city’s population, found that the<br />
percentage of informal residents without access to improved drinking water<br />
ranged from 37.8 percent to 90 percent, with a mean of 71.8 percent ( Penrose<br />
et al. 2010). Unpredictable water supply has led poorer residents to try to<br />
adapt to the situation by diversifying sources (often expensive) and reducing<br />
consumption. The considerable cost of a piped water connection continues to<br />
pose an obstacle for poorer households; only 8 percent of the city’s residents<br />
had access to piped water.<br />
Sources: Greenhill and Wekiya (2004); and Penrose et al. (2010).<br />
average global temperatures, sea-level rise, and in some areas, more frequent and<br />
intense fl oods and droughts will aff ect water availability for urban water-supply<br />
systems. Higher temperatures and reduced precipitation are expected to cause<br />
supply shortages due to the slower replenishment rates of groundwater aquifers<br />
and reduced surface water (Danilenko et al. 2010).Combined with a lack of sanitation,<br />
the urban poor frequently suff er from contaminated water sources during<br />
dry periods (Stephens 1996, 25). Drinking water is also more vulnerable to contamination<br />
due to stagnant water remaining in settlements, and because fl ooding<br />
will mobilize more pathogens and contaminants. Floods can carry contaminated
44 ■ CLIMATE CHANGE, DISASTER RISK, AND THE URBAN POOR<br />
Figure 2.1 Percentage of Urban Population Using Improved<br />
Sanitation (2008)<br />
water containing wastes and toxic chemicals into living spaces. Th e incidence of<br />
diarrhea may be around 10 percent higher in some countries by 2030 (McMichael<br />
et al. 2006). In Kampala, Uganda, recent outbreaks of cholera, dysentery,<br />
and diarrhea have been attributed to fl ooding. 8<br />
While short- and medium-term measures, such as water rationing or altering<br />
of design parameters, may allow urban water utilities to cope with the eff ects of<br />
<strong>climate</strong> <strong>change</strong>, long-term impacts of <strong>climate</strong> <strong>change</strong> are likely to surpass current<br />
design allowances. Compounding the eff ects of <strong>climate</strong> <strong>change</strong> and urbanization,<br />
many cities fail to properly maintain and rehabilitate water utility networks for<br />
lack of fi nancial resources.<br />
Drainage<br />
South-East Asia<br />
Latin American &<br />
Caribbean<br />
East Asia<br />
South Asia<br />
Sub-Saharan Africa<br />
Developing Regions<br />
Source: UN (2010).<br />
0 20 40<br />
Percent<br />
60 80 100<br />
Th e lack of proper drainage can lead to devastating fl ooding. Th e urban poor are<br />
particularly vulnerable because their homes are frequently located in low-lying<br />
areas, with little or no access to drainage. For example, in Dhaka, Bangladesh,<br />
only 10 percent of slum dwellers had suffi cient drainage to avoid water-logging<br />
during heavy rains (Islam 2005). In most low-income settlements, inadequately<br />
maintained storm drains and poor waste-disposal practices prevent drainage<br />
systems from working during heavy rains, oft en resulting in fl ooding. Stagnant<br />
fl oodwater provides an ideal breeding ground for parasites, which may lead to<br />
an increase in malaria and other vector-transmitted diseases. In Phnom Penh<br />
(1.3 million inhabitants) (Heinonen 2008), some 176,000 of the urban poor live
BOX 2.7<br />
Water Scarcity in Mexico City<br />
VULNERABILITY OF THE URBAN POOR ■ 45<br />
Despite major infrastructural investments to funnel water resources toward<br />
industrial and population centers, water scarcity remains in places such as<br />
Mexico City (Mumme and Lybecker 2002, 313). In these areas, overexploitation<br />
of ground water has led to land subsidence, salinization, and pollution of<br />
ground water (Peritore,1999). Uneven subsidence <strong>change</strong>s the gradients of<br />
water delivery, drainage, and sewage networks, which further contaminates<br />
ground and surface water (Peritore, 147). Leaky and insuffi cient water supply<br />
and drainage infrastructure are complicated by the subsidence of Mexico City<br />
at a rate of 45 centimeters a year. It is estimated that 77 percent of Mexican<br />
rivers are polluted to the point that they pose a <strong>risk</strong> to human health (Mumme<br />
and Lybecker, 312). Treatment is required for most Mexican surface water before<br />
it is considered potable, and fecal contamination is considered responsible<br />
for gastrointestinal illness in one-third of the Mexican population (Peritore, 147).<br />
Source: Leon et al. 2010.<br />
in housing that fl oods regularly due to heavy rainfall and clogged drains; this<br />
population is highly exposed to water-borne diseases and may be increasingly<br />
so as <strong>climate</strong> <strong>change</strong> advances (ADB 2008). In Jakarta, a city highly vulnerable<br />
to sea-level rise, problems of public health related to poor drainage and standing<br />
water are severe. A study in informal settlements in the northern part of the city<br />
reported diarrheal incidence at 342 episodes per 1,000 people, and 43 percent<br />
of children under fi ve were infected with at least one type of intestinal worms<br />
(Harpham, Garner, and Surjadi 1990).<br />
With increases in fl ooding due to <strong>climate</strong> <strong>change</strong> as discussed in Chapter 1,<br />
proper drainage becomes increasingly important. Policy makers and planners can<br />
minimize the consequences of fl ooding through structural, social, economic, and<br />
administrative measures taken now. Storm-water drainage overlaps with other<br />
services, such as solid-waste disposal and Integrated Urban Water Management.<br />
Additionally, drainage can benefi t from sustainable and natural drainage systems.<br />
Solid Waste<br />
In many poor urban areas, solid-waste management presents huge challenges.<br />
While the urban poor may generate less waste than their more affl uent neighbors,
46 ■ CLIMATE CHANGE, DISASTER RISK, AND THE URBAN POOR<br />
they are much more likely to suff er the consequences of inadequate waste management.<br />
Typically, up to two-thirds of the solid waste generated is not collected,<br />
and most oft en municipal authorities focus their limited budget on solidwaste<br />
collection in neighborhoods with wealth and political power (Zurbrügg<br />
2002, 1). Even in places like Brazil, where urban waste collection is relatively high<br />
(80 percent), waste disposal is oft en inadequate, occurring in open dumps that<br />
contaminate soil and water and adversely aff ect the health and safety of the surrounding,<br />
oft en poor, population (IBGE 2003).<br />
Solids, whether they are the sediments from land development or the solid<br />
waste produced by human populations, decrease the fl ow of rivers. In urban areas<br />
with inadequate services, solid waste can block storm-water drains, impeding the<br />
fl ow of water from the impacted area and increasing pollution. In addition, solid<br />
waste contributes to general environmental degradation and increases disease<br />
vectors. In the case of many cities, solid-waste disposal and drainage improvements<br />
are included in general urban upgrading programs and in some cases, such<br />
as Ouagadougou (UN-HABITAT 2008) and several communities in Liberia,<br />
improvements in solid-waste disposal and drainage were also used as a vehicle<br />
for job creation.<br />
Good solid-waste management is also important for mitigating <strong>climate</strong><br />
<strong>change</strong>. Nearly 5 percent of global greenhouse gas (GHG) emissions (1,460<br />
mtCO 2 e) in 2010 came from post-consumer waste (Hoornweg et al. 2010, 40).<br />
Investments in solid-waste management can also be a small but catalytic<br />
source of revenue. For instance, the Dar es Salaam City Council closed the Mtoni<br />
solid-waste dumpsite and, in collaboration with a private company, created<br />
mechanisms for tapping and fl aring the gases produced at the dump. Together<br />
they invested over US$1.25 million in 2008. Th e partnership was able to sell the<br />
13,895 tons of carbon that had been fl ared at a cost of US$15–25 per ton.<br />
Roads and Transport<br />
Access to roads and transport services are critical for mobility to jobs, markets,<br />
health, education, and, during extreme weather, to safety. Oft en the quality of<br />
roads in urban slums is very low, hampering service provision, and, during fl oods<br />
or other <strong>disaster</strong>s, preventing emergency vehicles from getting to residents.<br />
Roads can be washed out, intense heat can warp and crack pavement, and<br />
increased precipitation can cause subsidence. In Ethiopia, where extensive modeling<br />
has been done, increased precipitation due to <strong>climate</strong> <strong>change</strong> is expected<br />
to both decrease the lifespan of unpaved roads and increase the maintenance<br />
needs and costs for paved roads (<strong>World</strong> Bank 2010). Th e condition of pedestrian<br />
paths and roads in slums, which are usually unpaved, is already oft en poor and<br />
will only further deteriorate with increased extreme weather. In Dar es Salaam,
VULNERABILITY OF THE URBAN POOR ■ 47<br />
roads become impossible to navigate during the rainy season, when the increasing<br />
number and depth of holes can completely block vehicles (Olvera et al. 2002).<br />
Daily trips on foot also become much more diffi cult during rains, when people<br />
are cut off from their neighborhoods and bridges or roads collapse. During the<br />
2010 earthquake in Port au Prince, Haiti, the lack of access roads between streets<br />
hindered relief eff orts. Relief vehicles had diffi culty entering the patchwork of<br />
unmarked “corridors” (IFRC 2010).<br />
Squatter settlements are surrounded by planned developments, and most<br />
are well connected to public transportation networks. However, the interior of<br />
large slums may be poorly connected and do not have any transportation services<br />
(UN-HABITAT 2003a). Slums in peri-urban areas typically must rely on<br />
public transport, which is oft en limited or unaff ordable. Slum residents in periurban<br />
areas may spend a substantial portion of their income, up to 30 percent, on<br />
transportation to jobs, markets, and social amenities; some walk as much as 3 to<br />
4 hours a day to reach their places of employment (UN-HABITAT 2003a). Th is<br />
limits employment opportunities and can contribute to social exclusion. Th e economic<br />
and social costs associated with transport are particularly relevant when<br />
assessing the tradeoff s for policy related to relocating slum residents to safer locations,<br />
which may be in peri-urban areas as is discussed in Chapter 3.<br />
Energy<br />
Energy services are critical to raising productivity, creating opportunities at the<br />
household level for income generation, and contributing to improved health and<br />
education. Th e poor’s access to safe, aff ordable, and reliable services is still relatively<br />
low in many cities. Many rely on illegal connections and ineffi cient or dangerous<br />
sources. Th e majority of the urban poor rely on burning biomass (wood,<br />
charcoal, agriculture, and animal waste) for cooking.<br />
Traditional cook stoves worsen indoor air pollution and respiratory health.<br />
Depending on the fuel used, traditional cook stoves also contribute to <strong>climate</strong><br />
<strong>change</strong> and deforestation (<strong>World</strong> Bank 2011). In such cases, improved cook<br />
stoves would decrease indoor air pollution and also contribute to mitigating<br />
<strong>climate</strong> <strong>change</strong>. Th e use of cook stoves is common in countries across the developing<br />
world, including India and China, where projects to introduce improved<br />
cook stoves are underway. In Dar es Salaam, the city administration has pioneered<br />
the production of briquettes made of recycled trash, replacing charcoal<br />
as fuel for family cooking stoves. As a result, the use of wood and related<br />
air pollution has been dramatically reduced. 9 In India, a government subsidy<br />
program has reduced the price of 8 million stoves by 50 percent (<strong>World</strong> Bank<br />
2010a, 312), with impacts both on air pollution and on the health of the urban<br />
poor (<strong>World</strong> Bank 2003).
48 ■ CLIMATE CHANGE, DISASTER RISK, AND THE URBAN POOR<br />
Globally, a new Alliance for Clean Cook Stoves, led by the United Nations,<br />
was established in 2010 to improve low-quality cook stoves that present environmental<br />
and health <strong>risk</strong>s. Th is initiative is important for <strong>climate</strong> <strong>change</strong> because<br />
studies suggest that black carbon, such as the particulates emitted as soot from<br />
rudimentary cook stoves, may have contributed fully 13 percent of the warming<br />
of the Arctic since 1976. 10<br />
Much like other infrastructure, <strong>climate</strong> <strong>change</strong> and extreme weather are<br />
anticipated to have signifi cant impacts on energy infrastructure, as the latter will<br />
be vulnerable to fl ood and wind damage. Meanwhile, heat and cold waves are<br />
expected to produce shift s in energy demand in response to building design and<br />
internal temperature control. Even in high- and middle-income countries, the<br />
increased demand for air conditioning during heat waves can cause widespread<br />
blackouts. Th e high temperatures can prove fatal for the elderly, very young, and<br />
urban poor—many of whom have no access to air conditioning. 11 In Delhi, rising<br />
temperatures and the energy demand for cooling are being cited as signs that<br />
the National Capital Region could become unsustainable, despite rapid economic<br />
growth. 12 Similarly, there is signifi cant overlap between the energy and water sectors.<br />
In areas dependent on hydropower, droughts will aff ect energy generation.<br />
In the other direction, cities that already use energy-intensive pumps to convey<br />
their water supply over long distances may face additional challenges with<br />
increasing drought or competing energy demands. An example would be Mexico<br />
City, which uses pumps to carry a third of its water supply up and over 1,000meter<br />
peaks. 13 To the extent that the urban poor rely on energy services for cooking,<br />
heating, lighting, and home-based businesses, they will similarly be aff ected<br />
by these <strong>change</strong>s.<br />
Public and Environmental Health<br />
Many impacts of <strong>climate</strong> <strong>change</strong> and natural hazards on the urban poor are<br />
most notable in <strong>risk</strong>s to public health. Exposure to changing weather patterns<br />
in temperature, precipitation, sea-level rise, and more frequent earthquakes and<br />
landslides have direct consequences for people’s health: morbidity and mortality.<br />
Many communicable diseases are highly sensitive to changing temperatures and<br />
precipitation. Th ese include vector-borne diseases, such as malaria and dengue,<br />
and water-borne diseases, such as diarrhea and cholera. Th e pathogens that cause<br />
these diseases thrive in living conditions characteristic of those typically found in<br />
slums. Worse, their impact is also likely to be more severe in populations with a<br />
preexisting burden of disease (IPCC 2007).<br />
In Dar es Salaam, accessing clean water and sanitation are major problems<br />
for the poor, contributing to widespread illness, including cholera, malaria, lymphatic<br />
falorisi, and diarrhea, particularly during fl oods. Since the fi rst major
VULNERABILITY OF THE URBAN POOR ■ 49<br />
cholera epidemic was reported in southern Tanzania in 1977, cholera has spread<br />
to most regions of the country and has remained a chronic and widespread problem<br />
in Dar es Salaam. In 2006, 14,297 cases, including 254 deaths (1.8 percent<br />
case fatality rate), were reported from 16 of Tanzania’s 21 regions. Dar es Salaam<br />
represented 62.7 percent of the total cases and 101 deaths (39.8 percent of total<br />
deaths) (Penrose, Werema, and Ryan 2010; WHO 2008).<br />
While research on the impact of <strong>climate</strong> <strong>change</strong> on vulnerable populations is<br />
still in early stages, the link between urban poverty and ill-health is already well<br />
established. In its Fourth Assessment Report, the IPCC has warned that changing<br />
weather patterns are altering the distribution of some infectious- disease<br />
vectors and worsening existing health conditions. Th e report also predicts that<br />
adverse health impacts of <strong>climate</strong> <strong>change</strong> will be greatest in low-income countries,<br />
and the urban poor in all countries will be at greater <strong>risk</strong> apart from the<br />
elderly, children, and coastal populations (IPCC 2007). Th e urban poor are<br />
more prone to diseases such as diarrhea, tuberculosis, dengue, malaria, pneumonia,<br />
cholera, and HIV/AIDS (Montgomery 2009; Harpham 2009; Mercado<br />
et al. 2007; Cattaneo et al. 2007). In cities, the poor tend to live in low-income<br />
settlements or slums with inadequate access to clean water and sanitation facilities,<br />
drainage, and solid-waste management, which exposes them to a “double<br />
burden” of both communicable and noncommunicable diseases 14 causing disability<br />
and death (Harpham 2009). Despite their proximity to better health-care<br />
facilities than people in rural areas, the urban poor oft en do not have access to<br />
quality health care, as services are unaff ordable or facilities are inaccessible.<br />
Th ey also die disproportionately of both infectious and chronic, degenerative<br />
diseases (Montgomery et al. 2004).<br />
Climate <strong>change</strong> is expected to expose 90 million more people in Africa to<br />
malaria by 2030—a 14 percent increase—because of expanded mosquito breeding<br />
grounds and because the disease is now spreading to higher altitudes. 15<br />
Dengue fever is expanding in its geographic range: <strong>climate</strong> <strong>change</strong> is expected<br />
to double the proportion of the world’s population at <strong>risk</strong>, from 30 percent to<br />
60 percent by 2070 (<strong>World</strong> Bank 2010b, 97).<br />
Emergency Services<br />
Emergency services include measures to respond to <strong>disaster</strong>s and catastrophes,<br />
including both preparedness and emergency response and recovery. Th e<br />
lack of, or limited, emergency services in developing countries oft en is crippling<br />
to citizens and economies. A study of natural hazards in Mediterranean<br />
countries noted that <strong>disaster</strong>s in the Southern European countries have had<br />
the lowest levels of fatalities, as well as the lowest livelihood and economic loss,<br />
attributed to the presence of preventive measures and <strong>disaster</strong>-management
50 ■ CLIMATE CHANGE, DISASTER RISK, AND THE URBAN POOR<br />
BOX 2.8<br />
Incidents of Dengue in Jakarta<br />
Kasus<br />
30000<br />
25000<br />
20000<br />
1500<br />
1000<br />
5000<br />
0<br />
8729<br />
2000<br />
Changes in rainfall patterns and increasing temperatures are a signifi cant health<br />
hazard for the urban population, particularly in the area of water- and mosquito-borne<br />
diseases. While often nonfatal when adequately treated, dengue has<br />
a disproportionate impact on the poor, who have lower less access to medical<br />
care. In Jakarta there has been a signifi cant increase in recorded cases of<br />
dengue in recent years attributed to increases in rainfall, humidity, and temperature.<br />
The correlation between monthly rainfall and dengue cases was the<br />
strongest, where one study has estimated that every 9.73 mm increase in<br />
monthly rainfall resulted in an additional 67 cases of dengue. The correlations<br />
with increased temperatures and humidity were positive, although less strong.<br />
Increase in cases of dengue fever is only one indicator of how global meteorological<br />
<strong>change</strong>s are affecting the spread of diseases in Jakarta.<br />
Source: <strong>World</strong> Bank (2011b).<br />
7437<br />
2001<br />
5750<br />
Tahun<br />
14071<br />
20640<br />
23466<br />
24932<br />
2002 2003 2004 2005 2006<br />
Kasus DBD<br />
preparedness. In contrast, North Africa and Turkey had the most debilitating<br />
impacts (Brauch 2003).<br />
One of the core institutional indicators of emergency preparedness is the<br />
presence of national, regional, and sector-level <strong>disaster</strong>-management plans.<br />
Although these are important tools, the presence of plans alone does not ensure<br />
that a country, region, or city is able to adequately respond when <strong>disaster</strong> strikes.
VULNERABILITY OF THE URBAN POOR ■ 51<br />
Mumbai, for instance, has a comprehensive <strong>disaster</strong>-management plan that<br />
lists diff erent calamities that can aff ect the city and identifi es those areas most<br />
at <strong>risk</strong>. It also contains provisions to reduce the impact of <strong>disaster</strong>s through<br />
infrastructure development, communication and public information, and landuse<br />
policies and planning, as well as maps out protocols to be followed when<br />
a <strong>disaster</strong> occurs (Concerned Citizens Commission 2005). Despite the plan,<br />
when the 2005 fl oods hit the city, it became clear that <strong>disaster</strong>-management<br />
strategies such as early-warning systems had not been implemented and fi rst<br />
responders did not have the equipment or training to act (Concerned Citizens<br />
Commission 2005).<br />
While slums and informal settlements are not always able to obtain government<br />
support when emergencies arise, communities, NGOs, and the private sector<br />
respond in various ways. Th e private sector has begun to engage with the<br />
public and NGOs in providing services and warning systems. International organizations<br />
such as the Red Cross, Oxfam, and Save the Children Fund provide<br />
shelter, food, and other forms of humanitarian aid in <strong>disaster</strong>s, when governments<br />
cannot or do not act quickly enough (Beamon and Balcik 2008). At the<br />
most basic level, social networks and social capital are critical aspects of emergency<br />
response. In moments of extreme events, local community members support<br />
one another by providing information and by working together to address<br />
impacts. For example, fl ood management is oft en handled by sand-bagging. Such<br />
approaches are oft en eff ective in emergency scenarios, but are not substitutes for<br />
the levels of prevention that can be achieved through infrastructure and emergency<br />
services.<br />
Other Key Issues Affecting the Vulnerability<br />
of the Urban Poor<br />
Several factors related to the characteristics of the urban poor aff ect their sensitivity<br />
and adaptive capacity to <strong>climate</strong> <strong>change</strong> and <strong>disaster</strong> <strong>risk</strong>, impacting vulnerability.<br />
Among these are security of tenure, employment and fi nancial insecurity,<br />
and social networks.<br />
Security of Tenure<br />
More than a quarter of the world’s urban populations experience various levels of<br />
tenure insecurity, ranging from some level of legality to full illegality (for example,<br />
unauthorized squatting) (UN-HABITAT 2007). Insecure tenure and protection<br />
from forced evictions are key to obtaining public infrastructure services—<br />
municipalities are reluctant to provide infrastructure to slum households, in
52 ■ CLIMATE CHANGE, DISASTER RISK, AND THE URBAN POOR<br />
the absence of property rights, especially in unplanned settlements or on public<br />
land. Security of tenure is also critical to self-investments in property and service<br />
improvements that are critical for ad hoc adaptation of the urban poor. In Dhaka,<br />
Bangladesh, residents, donors, NGOs, and government report lack of tenure<br />
security as a key constraint to service delivery. With the constant threat of evictions,<br />
government agencies, NGOs, and donors are reluctant to invest capital in<br />
erecting permanent structures that residents may stand to lose if evicted (<strong>World</strong><br />
Bank 2005). Th is has obvious implications on vulnerability.<br />
Forced evictions are the most extreme manifestation of tenure insecurity.<br />
At least 2 million people, mostly those with the worst housing, are forcibly<br />
evicted by local government authorities every year. Recent data reveals that<br />
forced evictions worldwide have increased during the last decade, especially<br />
in Africa and Asia (UN-HABITAT 2007). Th e most common reasons cited for<br />
BOX 2.9<br />
Settlements and Environmentally Sensitive Lands<br />
Parks, gardens, natural areas, and recreational spaces are highly valued<br />
in most cities. As a result, informal settlements that encroach upon urban<br />
parks, forests, waterways, and wetlands often are seen as posing threats to<br />
natural resources. The common responses by local governments to these<br />
settlements are displacement and relocation. As a case in point is an informal<br />
settlement in Mumbai that grew over the years and ultimately encroached<br />
upon the city’s Borivali National Park, the only park in India within a metropolis.<br />
This national park contains two of the city’s sources of drinking water<br />
and is home to a variety of fl ora and fauna. The Bombay High Court ruled to<br />
evict and resettle the residents, because of their location (Bavadam 2003).<br />
As a further example, after the 2005 Mumbai fl ood, the local government targeted<br />
some informal settlements that had encroached upon a narrow point<br />
of the Mithi River and planned to evict the residents and construct a park in<br />
that area. At the same time, the encroachment of the high-income Bandra-<br />
Kurla Complex, which was constructed over the mangrove ecosystem of the<br />
Mithi River (Concerned Citizens Commission 2005) was overlooked. These<br />
examples illustrate how local government interventions based on relocation<br />
are used to protect resources, although not necessarily in an equitable way.<br />
(Bartlett et al. 2009).<br />
Source: Carmin, Roberts, and Anguelovski (2009).
VULNERABILITY OF THE URBAN POOR ■ 53<br />
forced evictions are infrastructure projects, international mega-events, and<br />
urban beautifi cation.<br />
Employment and Financial Security of the Urban Poor<br />
While the urban economy provides many income and employment opportunities,<br />
the poor tend to be marginalized on many fronts and oft en face low incomes,<br />
limited (mostly informal) sources of livelihood, lack of social insurance, and limited<br />
access to credit markets. For some, especially those living in peri-urban areas,<br />
accessing jobs is diffi cult. For others, the negative stigma associated with living<br />
in certain neighborhoods provides a barrier to entering the formal job market.<br />
Climate <strong>change</strong> and natural hazards could signifi cantly aff ect access to livelihoods<br />
for the urban poor. For example, slum entrepreneurs operate outside of<br />
formal markets and typically do not have insurance against their assets. Hazards<br />
such as fl oods, mudslides, hurricanes, and storms, especially if increasing in frequency<br />
or severity, can easily destroy the physical assets of these businesses as<br />
well as homes, leaving residents destitute.<br />
Urban agriculture accounts for a substantial percentage of employment in<br />
some cities with links to commercial food and ornamental plant production,<br />
development of small agro-food industries, marketing of agricultural products,<br />
input supply, and waste-recycling enterprises. Urban agriculture could be<br />
aff ected by <strong>climate</strong> <strong>change</strong> in obvious ways related to water shortages, fl ooding,<br />
and heat stresses, but also has an increasing role to play for both <strong>climate</strong>-<strong>change</strong><br />
adaptation and mitigation with implications for job creation. Urban agriculture<br />
can contribute to overall food security, particularly in providing emergency food<br />
in <strong>disaster</strong>s when supply chains do not function. Green rooft ops can contribute<br />
to improved air quality, and rainwater-harvesting systems can help lessen the<br />
eff ects of fl ooding. Urban agriculture can also help to build resilience by keeping<br />
environmentally sensitive and dangerous lands from being used for illegal residential<br />
development.<br />
Social Networks<br />
Traditionally, vulnerable individuals and communities have managed <strong>risk</strong><br />
through ad hoc coping techniques that draw on their local knowledge of hazards<br />
and community resources. Th ere is substantial literature that discusses ad<br />
hoc adaptation to illustrate the strength of social capital. In slums where social<br />
networks and kinship ties are stronger, communities are more resilient. Older<br />
communities have stronger social networks than newer settlements, where residents<br />
may be more transient. Active internal leadership in close-knit communities<br />
can organize relief and rehabilitation more eff ectively and effi ciently. Th is
54 ■ CLIMATE CHANGE, DISASTER RISK, AND THE URBAN POOR<br />
is especially the case for fast-onset events that require temporary relocation; at<br />
these times, residents rely on their existing social capital and existing networks.<br />
A study on adaptation by the poor in Mombasa, Kenya, and Esteli, Nicaragua,<br />
provides examples (<strong>World</strong> Bank 2010b). When slum dwellers in Esteli are forced<br />
to leave their home in time of emergency, they take refuge in churches and with<br />
friends and relatives in other areas. Charitable citizens provide basic needs for<br />
those evacuated, and police protect their homes—oft en their most valuable asset<br />
(<strong>World</strong> Bank 2010b). Th ese systems of mutual support signifi cantly enhance<br />
community resilience to <strong>disaster</strong>s and <strong>climate</strong> <strong>change</strong>.<br />
In these two cities, community organizations are actively involved in adapting<br />
to extreme weather. Adaptation at the household and business level is slightly<br />
more common, but community-scale adaptation occurs in Mombasa in approximately<br />
80 percent of extreme weather events (<strong>World</strong> Bank 2010b). Communities<br />
that lack social capital have more limited capacity to respond to <strong>climate</strong> <strong>change</strong><br />
and <strong>disaster</strong>s. A community’s level of social capital depends on an array of characteristics,<br />
including length of tenure or settlement and pattern of occupation of<br />
an area (Moser and Satterthwaite 2010; Moser and Felton 2007).<br />
Extended family networks, as part of the larger social network, oft en go<br />
beyond the urban arena to rural households. In such networks, urban relatives<br />
are oft en called on for fi nancial support in times of drought or other diffi culty.<br />
In addition, rural family members may move to join urban-dwelling relatives<br />
during droughts or fl oods (Raleigh and Jordan 2010). Th is means that changing<br />
weather patterns and extreme events in far-reaching regions also have an impact<br />
on urban households.<br />
Th e study also found that the asset that the poor value and tend to protect the<br />
most during extreme events is their house. Other important assets were businesses<br />
and electrical appliances. Most households were resourceful at developing<br />
resilience measures (for example, 91% of the households implement some kind<br />
of adaptation action before severe weather event, 100 percent during the event<br />
and 91 percent aft erward). Furthermore, the study revealed that the most critical<br />
dimension of vulnerability of the poor was weak or unclear tenure rights, and<br />
that owner occupiers tend to invest more resources in adaptation measures than<br />
tenants, especially in reinforcing the house before heavy rains.<br />
Notably, such social networks do vary from community to community. A<br />
study of marginalized populations in Mumbai, India, following the 2005 fl oods<br />
found that around 97 percent of the households that undertook reconstruction<br />
of their damaged houses depended on their past savings (Hallegatte et al. 2010).<br />
Only 1.7 percent of the households said they secured the money for reconstruction<br />
from family members, and the reminder relied on loans from money lenders<br />
and other sources.
VULNERABILITY OF THE URBAN POOR ■ 55<br />
Ad hoc Adaptation and Risk of Maladaptation<br />
Some of the coping mechanisms used by the poor also refl ect a short-term perspective<br />
by individuals or communities who may be accustomed to living with<br />
<strong>risk</strong> from recurrent hazards and cannot rely on government protection (Douglas<br />
et al. 2008). Examples of ad hoc adaptation in Accra, Kampala, Lagos, and<br />
Maputo following heavy fl ooding in 2006 show that individuals resorted to using<br />
concrete blocks and furniture to raise valuables above the reach of fl ood waters,<br />
creating small barriers to prevent the fl ood waters from entering their home, or<br />
when this was unavoidable, creating openings to channel fl ood waters through<br />
their homes as quickly as possible. Th ose individuals who lacked safe places for<br />
their assets or vulnerable family members moved away from the impacted area<br />
to stay with family or in public buildings (Douglas et al. 2008). In low-income<br />
areas in Jakarta vulnerable to fl ooding along the coast, residents have raised their<br />
homes on stilts to accommodate rising sea levels and land subsidence. Residents<br />
in one close-knit neighborhood report working together to repair the government-constructed<br />
sea wall, or fi xing boats used for fi shing. While ad hoc adaptation<br />
may save lives and assets in the short term, its unregulated nature creates the<br />
possibility for maladaptation—where a shift in vulnerability from one group to<br />
another may deliver a short-term gain, at the cost of creating long-term, higher<br />
vulnerability such as impacts on future generations.
TABLE 2.2<br />
Adaptation Strategies Applied during Heavy Rain<br />
Asset holder<br />
Mombasa<br />
Strategies<br />
Before During After<br />
Tenants Repair roof<br />
Build stronger foundations<br />
Dig trenches around houses<br />
Clear drainage<br />
Owner occupied Make water drains<br />
Repair houses<br />
Build concrete skirting around houses<br />
Seal holes and leakages<br />
Build barriers at entrance to houses<br />
Build strong houses<br />
Seal leaking areas<br />
Vacate fl ooding houses<br />
<strong>Open</strong> up passage routes<br />
Unblock and clear drains<br />
Move to safer houses<br />
Remove water from house<br />
Block water passage routes<br />
Repair houses<br />
Rebuild and repair<br />
56 ■ CLIMATE CHANGE, DISASTER RISK, AND THE URBAN POOR
Household asset Before/continuous<br />
Esteli<br />
During After<br />
Plots or sites Level the land<br />
Build terraces<br />
Plant local trees<br />
Dig trenches<br />
Build drainage channels<br />
Houses Clean ditches<br />
Replace plastic and zinc<br />
Replace wooden planks<br />
Build stone dykes<br />
Reinforce foundations<br />
Build steps with tires<br />
Latrines/showers and<br />
washstands<br />
Source: <strong>World</strong> Bank (2010b).<br />
Build and maintain<br />
Abandon and eliminate saturated latrines<br />
Improve absorbency with tires<br />
Tie down and secure<br />
Spread dry soil and gravel<br />
Build stone dykes<br />
Dig trenches around plots<br />
<strong>Open</strong> up drainage passages<br />
Block leaks<br />
Collect leakages<br />
Secure zinc roofs with stones<br />
Spread sawdust<br />
Dig drainage ditches<br />
Dig ditches<br />
Channel water away from houses<br />
Plant damp-resistant tress<br />
Replace eroded ground with new soil<br />
and stones<br />
Build stone dykes<br />
Repair fences<br />
Replant trees and plants<br />
Repair leaks<br />
Mend roofs<br />
Reinforce foundations<br />
Maintain drainage ditches<br />
Repair structure<br />
Replace poles and plastic<br />
Reinforce with tires<br />
Dig new holes<br />
VULNERABILITY OF THE URBAN POOR ■ 57
58 ■ CLIMATE CHANGE, DISASTER RISK, AND THE URBAN POOR<br />
Notes<br />
1. FAR, the fl oor-area ratio, determines the total amount of fl oor space (including all<br />
levels) that can be built on a plot of land.<br />
2. Slum estimates are calculated by UN-HABITAT based on the defi nition of a group<br />
of individuals living under the same roof in an urban area lacking at least one of the<br />
following fi ve conditions: access to improved water supply; access to improved sanitation<br />
facilities; suffi cient living area (not more than three people sharing the same<br />
room); structural quality and durability of dwellings; and security of tenure. If a<br />
home has one or all fi ve of these conditions, they would be classifi ed as a slum household<br />
(UN-HABITAT 2008). While there are major defi ciencies with this approach<br />
to measuring slums—such as a lack of the degree of deprivation experienced by a<br />
given household or community, and inability to capture improvements of individual<br />
defi ciencies over time—these estimates provide a basis for understanding the scope of<br />
shelter deprivation in urban areas globally.<br />
3. Rent control introduced in many countries during and aft er <strong>World</strong> War II freezes<br />
rents at levels that are aff ordable to low-income families, but that do not relate to<br />
the value or replacement cost of the accommodation, or to the economic cost of<br />
adequately maintaining the building and its services; owners remove value from the<br />
building by withdrawing maintenance (UN-HABITAT 2003a).<br />
4. Occupation can be a rapid, organized invasion at one end, and incremental growth<br />
at the other. Initially, squatting may have been the result of authorities tolerating<br />
post-independence infl ow of migrants to cities in Asia and Africa. In many cases,<br />
squatting eventually becomes a profi table business in connivance with politicians,<br />
police, and land racketeers. Squatter housing is not free. An entry fee is charged by<br />
an agent who controls land subdivision (UN-HABITAT 2003a).<br />
5. http://siteresources.worldbank.org/WBI/Resources/213798-1278955272198/<br />
Putting_Nairobi_Slums_on_the_Map.pdf.<br />
6. http://www.time.com/time/asia/covers/501060619/slum.html.<br />
7. Much has been written on basic services from a sectoral perspective; this section highlights<br />
key issues related to the urban poor, and provides context for the chapter that<br />
follows on building adaptive capacity and resilience.<br />
8. IIED (2009, 15).<br />
9. http://wbi.worldbank.org/wbi/stories/dar-es-salaam-mayor-“some-will-be-talkingand-some-will-be-doing”-global-video-dialogue-expl.<br />
10. Author’s calculations from <strong>World</strong> Bank (2010a, 312). Black carbon is estimated to<br />
have accounted for as much as 70 percent of this warming eff ect, and cook stoves<br />
in the developing world account for 18 percent of that black carbon (18 percent of<br />
70 percent is 13 percent).<br />
11. As mentioned in the adaptation plans for New York City and Paris.<br />
12. Revi (2008) as cited in Satterthwaite (2007).<br />
13. Romero-Lankao (2007), as cited in Satterthwaite (2007).<br />
14. Communicable diseases are caused by pathogenic microorganisms, such as bacteria,<br />
viruses, parasites, or fungi. Th ey can be spread, directly or indirectly, from<br />
one person to another. Communicable diseases prevalent in developing countries<br />
include diarrhea, viral hepatitis, typhoid fever, HIV/AIDS, tuberculosis, and
VULNERABILITY OF THE URBAN POOR ■ 59<br />
vector-borne infectious diseases, especially malaria, dengue fever, and chikungunya.<br />
Noncommunicable diseases, or NCD, are not contagious. Examples of NCD<br />
include cardiovascular diseases, cancer, diabetes, and allergies.<br />
15. Hay et al. (2006) cited in <strong>World</strong> Bank (2009, 3).<br />
References<br />
ActionAid. 2006. Unjust Waters. Climate <strong>change</strong>, Flooding and the Protection of Poor Urban<br />
Communities: Experiences from Six African Cities. Johannesburg: ActionAid International.<br />
Asian Development Bank (ADB). 2008. Urban Innovations: Partnerships for a Cleaner<br />
City: Community-based Environmental Improvements in Phnom Penh. ADB. http://<br />
www.adb.org/Documents/Urban-Development/Environmental-Improvements.pdf.<br />
Baker, Judy, ed. 2009. Opportunities and Challenges for Small Scale Private Service Providers<br />
in Electricity and Water Supply. Washington, DC: <strong>World</strong> Bank, PPIAF.<br />
Bartlett, Sheridan, David Dodman, Jorgelina Hardoy, David Satterthwaite, and Cecilia<br />
Tacoli. 2009. “Social Aspects of Climate Change in Urban Areas in Low- and Middle-<br />
Income Nations.” Contribution to the <strong>World</strong> Bank Fift h Urban Research Symposium<br />
Cities and Climate Change: Responding to an Urgent Agenda.<br />
Bavadam, Lyla. 2003. “Encroaching on a Lifeline.” Frontline 20(4). http://www.hinduonnet<br />
.com/fl ine/fl ine 2004/stories/20030228002609200.htm.<br />
Beamon, Benita M., and Burcu Balcik. 2008. “Performance Measurement in Humanitarian<br />
Supply Chains.” International Journal of Public Sector Management 1 (21): 4–25.<br />
Brauch. 2003. “Urbanization And Natural Disasters In Th e Mediterranean: Population<br />
Growth And Climate Change in the 21st Century.” In Building Safer Cities: Th e Future of<br />
Disaster Risk, ed. A. Kreimer, M. Arnold, and A. Carlin. Washington, DC: <strong>World</strong> Bank.<br />
Carmin, JoAnn. 2010. “Variations in Urban Climate Adaptation Planning: Implications<br />
for Action.” Paper presented at the International Climate Change Adaptation Conference,<br />
Gold Coast, Australia.<br />
———, Debra Roberts, and Isabelle Anguelovski. 2009. “Planning Climate Resilient Cities:<br />
Early Lessons from Early Adapters.” Paper presented at the Fift h Urban Research<br />
Symposium “Cities and Climate Change: Responding to an Urgent Agenda,” Marseille,<br />
France.<br />
Cattaneo, M., S. Giliani, P. Gertler, S. Martinez, and R. Titiunik, 2007. “Housing, Health<br />
and Happiness.” Policy Research Working Paper 4214, <strong>World</strong> Bank, Washington, DC.<br />
Center for Urban Studies. 2006. Slums of Urban Bangladesh – Mapping and Census.<br />
Concerned Citizen’s Commission. 2005. Mumbai Marooned: An Enquiry into the Mumbai<br />
Floods, 2005 Full Report. Mumbai: Conservation Action Trust, 115. http://cat.org<br />
.in/index.php/site/article/concernedcitizens-commission-an-enquiry-into-mumbaisfl<br />
oods-2005/.<br />
Danilenko, Alexander, Eric Dickson, and Michael Jacobsen. 2010. Climate Change and<br />
Urban Water Utilities: Challenges and Opportunities. Water Working Notes. Washington,<br />
DC: <strong>World</strong> Bank.<br />
Dar es Salaam Water Supply and Sewerage Agency (DAWASA). 2008. “Development of<br />
a Strategic Water Supply Plan for Dar es Salaam,Water Supply Improvement Plan.”
60 ■ CLIMATE CHANGE, DISASTER RISK, AND THE URBAN POOR<br />
Final Report Prepared by Dr. Ahmen Abdel Warith Consulting Engineers in association<br />
with DCL and Norplan, for DAWASA. Dar es Salaam, June.<br />
Dharmavaran, Soumya, 2011, Courting Hazards: Where the Urban Poor Live, Processed.<br />
Dilley, Maxx, Robert S. Chen, Uwe Deichmann, Art L. Lerner-Lam, and Margaret Arnold.<br />
2005. Natural Disaster Hotspots: A Global Risk Analysis. Washington, DC: <strong>World</strong> Bank/<br />
Columbia University.<br />
Douglas, Ian, Kurshid Alam, Maryanne Maghenda, Yasmin Mcdonnell, Louise Mclean,<br />
and Jack Campbell. 2008. “Unjust Waters: Climate Change, Flooding and the Urban<br />
Poor in Africa.” Environment and Urbanization 20 (1): 187–205.<br />
Greenhill, R., and Wekiya, I. 2004. Turning off the Taps: Donor Conditionality and Water<br />
Privatization in Dar es Salaam, Tanzania. London: ActionAid.<br />
Hallegatte, Stéphane, Nicola Ranger, Sumana Bhattacharya, Murthy Bachu, Satya Priya,<br />
K. Dhore, Farhat Rafi que, P. Mathur, Nicolas Naville, Fanny Henriet, Anand Patwardhan,<br />
K. Narayanan, Subimal Ghosh, Subhankar Karmakar, Unmesh Patnaik, Abhijat<br />
Abhayankar, Sanjib Pohit, Jan Corfee-Morlot, Celine Herweijer. 2010. “Flood Risks,<br />
Climate Change Impacts and Adaptation Benefi ts in Mumbai.” OECD Environmental<br />
Working Paper 27.<br />
Harpham. 2009. “Urban Health in Developing Countries: What Do We Know and Where<br />
Do We Go?” Health & Place 15 (1): 107–116.<br />
Harpham, Trudy, Paul Garner, and Charles Surjadi. 1990. “Planning for Child Health in a<br />
Poor Urban Environment—Th e Case of Jakarta, Indonesia,” Environment and Urbanization<br />
2 (2): 80.<br />
Hay et al. 2006. “Th e Malaria Atlas Project: Developing Global Maps of Malaria Risk.”<br />
PLoS Med 3(12).<br />
Heinonen, Ulla. 2008. “Millennium Development Goals and Phnom Penh: Is the City on<br />
Track to Meet the Goals?” Water Resources Laboratory, Helsinki University of Technology,<br />
Finland.<br />
Hoornweg, Daniel, Mila Freire, Marcus J. Lee, Perinaz Bhada-Tata, Belinda Yuen, 2010.<br />
Cities and Climate Change, Responding to an Urgent Agenda. Washington, DC: <strong>World</strong><br />
Bank.<br />
Instituto Brasileiro de Geografi a e Estatística (IBGE). 2003. “National Survey of Domicile<br />
Samplings.” Ministry of Planning, Budget and Management, Federal Government of<br />
Brazil.<br />
Intergovernmental Panel on Climate Change (IPCC). 2007. IPCC Fourth Assessment<br />
Report: Climate Change 2007.<br />
International Federation of Red Cross and Red Crescent Societies (IFRC). 2010. <strong>World</strong><br />
Disasters Report: Focus on Urban Risk. Geneva: IFRC.<br />
International Strategy for Disaster Reduction (ISDR). 2009. Global Assessment<br />
Report on Disaster Risk Reduction. Geneva: UN International Strategy for Disaster<br />
Reduction.<br />
Islam, N. 2005. Dhaka Now: Contemporary Urban Development. Dhaka: Bangladesh Geographical<br />
Society.<br />
Katich, Kristina, 2011, Th e Impacts of Climate Change and Disasters on Urban Serices,<br />
Processed.<br />
Kreimer, Alcira, Margaret Arnold, and Anne Carlin, eds. Building Safer Cities: Th e Future<br />
of Disaster Risk. 2003. Washington, DC: <strong>World</strong> Bank.
VULNERABILITY OF THE URBAN POOR ■ 61<br />
Kunreuther, Howard, and Richard J. Roth. 1998. Paying the Price: Th e Status and Role of<br />
Insurance against Natural Disasters in the United States. Joseph Henry Press.<br />
Lall, Somik, and Uwe Deichmann. 2009. “Density and Disasters: Economics of<br />
Urban Hazard Risk.” Policy Research Working Paper 5161, <strong>World</strong> Bank, Washington,<br />
DC.<br />
Leon, C., V. Magaña, B. Graizbord, R. González, A. Damian, and F. Estrada. 2010. “Pobreza<br />
Urbana y Cambio Climático para La Ciudad de México.” Unpublished, Mayor’s Task<br />
Force Study, Mexico City.<br />
McMichael et al. 2006. “Climate Change and Human Health: Present and Future Risks.”<br />
Th e Lancet 367(9513): 859–869.<br />
Mercado S., K. Havemann, M. Sami, and H. Ueda. 2007. “Urban Poverty: An Urgent Public<br />
Health Issue.” Urban Health 84 (1): 7–15.<br />
Montgomery, Mark, 2009. “Urban Poverty and Health in Developing Countries.” Population<br />
Bulletin 64 (2).<br />
Montgomery et al. 2004. In Cities Transformed: Demographic Change and Its Implications<br />
in the Developing <strong>World</strong>, ed. M. Montgomery, R. Stren, B. Cohen, and H. Reed. Washington,<br />
DC: National Academies Press.<br />
Moser, Caroline, and Andrew Felton. 2007. “Intergenerational Asset Accumulation and<br />
Poverty Reduction in Guayaquil, Ecuador, 1978-2004.” In Reducing Global Poverty: Th e<br />
Case for Asset Accumulation, ed. Caroline Moser. Washington, DC: Brookings Institution<br />
Press.<br />
Moser, Caroline, and David Satterthwaite. 2010. “Towards Pro-Poor Adaptation to Climate<br />
Change in the Urban Centres of Low- and Middle-Income Countries.” In Social<br />
Dimensions of Climate Change: Equity and Vulnerability in a Warming <strong>World</strong>, ed. R.<br />
Mearns and A. Norton, 231–258. Washington, DC: <strong>World</strong> Bank.<br />
Mumme and Lybecker. 2002. “Environmental Capacity in Mexico: An Assessment.” In<br />
Capacity Building in National Environmental Policy, ed. Helmut Weidner and Martin<br />
Jänicke.<br />
Nakagawa, Masayuki, Makoto Saito, and Hisaka Yamaga. 2007. “Earthquake Risk and<br />
Housing Rents: Evidence from the Tokyo Metropolitan Area.” Regional Science and<br />
Urban Economics 37: 87–99.<br />
Olvera, L. Diaz, D. Plat, and P. Pochet. 2002. “Transportation and Access to Urban Services<br />
in Dar es Salaam.” In Transportation.<br />
Penrose, K., M.C. Castro, J. Werema, and E. Ryan. 2010. “Informal Urban Settlements and<br />
Cholera Risk in Dar es Salaam, Tanzania.” PLoS Neglected Tropical Disease 4(3).<br />
Peritore, Patrick. 1999. Th ird <strong>World</strong> Environmentalism, Case Studies from the Global South.<br />
Gainesville, Florida: University Press of Florida.<br />
Raleigh, Clionadh, and Lisa Jordan. 2010. “Climate Change and Migration: Emerging Patterns<br />
in the Developing <strong>World</strong>.” In Social Dimensions of Climate Change: Equity and<br />
Vulnerability in a Warming <strong>World</strong>.<br />
Revi. 2008. “Climate Change Risk: An Adaptation and Mitigation Agenda for Indian<br />
Cities.”Environment and Urbanization 20(1): 207-229.<br />
Romero-Lankao, Patricia. 2007. “How Do Local Governments in Mexico City Manage<br />
Global Warming?” Local Environment: Th e International Journal of Justice and Sustainability<br />
12: 519–535.<br />
Satterthwaite, David. 2007. “Th e Urban Challenge Revisited.” Environment 49 (9): 6–16.
62 ■ CLIMATE CHANGE, DISASTER RISK, AND THE URBAN POOR<br />
Simply Green. 2009. “Th e Cape Prepares for Extreme Weather and Flooding.” May 3.<br />
http://www.simplygreen.co.za/local-stories/latest/the-cape-prepares-for-extremeweather-and-fl<br />
ooding.html.<br />
Stephens, C. 1996. “Healthy Cities or Unhealthy Islands? Th e Health and Social Implications<br />
of Urban Inequality.” Environment and Urbanization.<br />
United Nations. 2010. Th e Millennium Development Goals Report 2010. United Nations:<br />
New York.<br />
UN-HABITAT. 2003a. Th e Challenge of Slums: Global Report on Human Settlements.<br />
London/Sterling, VA: Earthscan Publications Ltd.<br />
———. 2003b. “Slums of the <strong>World</strong>: Th e Face of Urban Poverty in the New Millennium?<br />
Monitoring the Millennium Development Goal, Target 11—<strong>World</strong> Wide Slum Dweller<br />
Estimation,” Working Paper.<br />
———. 2007. Enhancing Urban Security and Safety.<br />
———. 2007. Global Report on Human Settlements.<br />
———. 2008. Harmonious Cities: State of the <strong>World</strong>’s Cities 2008/9. London/Sterling, VA:<br />
Earthscan Publications Ltd.<br />
———. 2010. Cities for All, Bridging the Urban Divide: State of the <strong>World</strong>’s Cities, 2010/2011.<br />
Water and Sanitation Program. 2009. Global Experiences on Expanding Services to the<br />
Urban Poor.<br />
<strong>World</strong> Bank. 2005. Dhaka Urban Poverty Assessment. Washington DC: <strong>World</strong> Bank.<br />
———. 2009. <strong>World</strong> Development Report 2010: Development and Climate Change. Washington<br />
DC: <strong>World</strong> Bank.<br />
———. 2010a. Ethiopia Economic of Adaptation to Climate Change. <strong>World</strong> Bank: Washington,<br />
DC.<br />
———. 2010b. Pro-Poor Adaptation to Climate Change in Urban Centers: Case Studies of<br />
Vulnerability and Resilience in Kenya and Nicaragua. Washington, DC: <strong>World</strong> Bank.<br />
———. 2011a. Black Carbon and Climate Change. Washington, DC: <strong>World</strong> Bank.<br />
———. 2011b. Jakarta: Urban Challenges in a Changing Climate. Jakarta: <strong>World</strong> Bank.<br />
<strong>World</strong> Bank and Diagonal Ltd. 2011. Climate Change, Disaster Risk Management and the<br />
Urban Poor: São Paulo, processed.<br />
<strong>World</strong> Health Organization (WHO), Global Task Force on Cholera Control. 2008. Cholera<br />
Country Profi le, United Republic of Tanzania.<br />
Zurbrügg, Christian, 2002. “Urban Solid Waste Management in Low-Income Countries<br />
of Asia: How to Cope with the Garbage Crisis.” Presented at the Scientifi c Committee<br />
on Problems of the Environment (SCOPE) Urban Solid Waste Management Review<br />
Session, Durban, South Africa, November.
Building Resilience for the Urban Poor<br />
Key Messages<br />
3<br />
City governments are the drivers for addressing <strong>risk</strong>s, through the provision<br />
of public infrastructure, delivery of basic services, and mainstreaming <strong>climate</strong><strong>change</strong><br />
adaptation and <strong>disaster</strong>-<strong>risk</strong> reduction into urban planning and management<br />
practices.<br />
Stakeholders will need to balance a number of diffi cult policy tradeoffs among<br />
<strong>risk</strong> reduction, urban development, and poverty reduction in decision making.<br />
Better policies for land-use planning and management will have the biggest<br />
impact on <strong>risk</strong> reduction.<br />
Investments in <strong>risk</strong> reduction will have the greatest impact when implemented<br />
in partnership with communities.<br />
Th e challenges of improving living conditions for the urban poor through better<br />
service delivery are not new; however, the <strong>risk</strong>s from <strong>climate</strong> <strong>change</strong> and increasing<br />
exposure to natural hazards accentuate the growing urgency in proactively<br />
addressing them. Despite these existing challenges, there is much accumulated<br />
experience in eff orts to improve living conditions for the urban poor, yet many cities<br />
have not been able to achieve these goals largely due to the pace of urbanization,<br />
ineff ective policies, resource constraints, lack of political will, and weak capacity.<br />
■ 63
64 ■ CLIMATE CHANGE, DISASTER RISK, AND THE URBAN POOR<br />
Th is chapter underscores several recommended actions based on experience<br />
to help cities build resilience for those at greatest <strong>risk</strong>. Th ese recommendations<br />
are rooted in the need for strong institutions for better urban planning and management,<br />
and sustainable urban policies that consider the positive and negative<br />
outcomes of the diffi cult decisions city offi cials must make.<br />
In implementing these actions, it is city governments that are the drivers for<br />
addressing <strong>risk</strong>s, by providing public infrastructure, delivering basic services,<br />
and mainstreaming <strong>climate</strong>-<strong>change</strong> adaptation and <strong>disaster</strong>-<strong>risk</strong> reduction into<br />
urban planning and management practices. Such investments will have the biggest<br />
impact when implemented in partnership with communities that have much<br />
to contribute to the process.<br />
Th e recommended actions are grouped in fi ve main areas discussed in this<br />
chapter. Th ese include (1) assessing <strong>risk</strong> at the city and community level to<br />
inform decision making and action planning; (2) integrating <strong>climate</strong> <strong>change</strong> and<br />
<strong>disaster</strong> <strong>risk</strong> reduction policies for the poor into urban planning and management;<br />
(3) balancing policy tradeoff s among <strong>risk</strong> reduction, urban development,<br />
and poverty reduction in decision making; (4) strengthening institutional capacity<br />
to deliver basic services and reduce vulnerability to <strong>climate</strong> and <strong>disaster</strong> <strong>risk</strong>;<br />
and (5) bridging communities and local governments to work together on local<br />
solutions.<br />
Assessing Risk at the City and Community Levels<br />
to Inform Decision Making and Action Planning<br />
Th e case studies carried out as part of this report have demonstrated the importance<br />
of understanding hazards, and socioeconomic and institutional <strong>risk</strong>s, for<br />
any city as an important fi rst step to developing plans in order to adapt and<br />
reduce the <strong>risk</strong> of <strong>disaster</strong>.<br />
Assessing Risk<br />
A <strong>risk</strong> assessment can defi ne the nature of <strong>risk</strong>s, answer questions about the<br />
characteristics of potential hazards, and identify the vulnerabilities of communities<br />
and potential exposure to given hazards. Risk evaluation helps in prioritizing<br />
measures of <strong>risk</strong>, giving due consideration to the probability and impact of<br />
potential events, the cost-eff ectiveness of the measures, and resource availability.<br />
Relevant and up-to-date information can allow all stakeholders to assess <strong>risk</strong><br />
and make informed policy and investment decisions. Such information will aff ect<br />
zoning, property markets, location choices, and adaptation investments. Investing<br />
in regular data collection is necessary for monitoring <strong>change</strong>s over time and
BUILDING RESILIENCE FOR THE URBAN POOR ■ 65<br />
continually updating <strong>risk</strong>-reduction plans. All four of the cities in the Mayor’s<br />
Task Force mentioned a lack of data for assessing <strong>risk</strong>. Th is has ranged from<br />
information gaps related to the location of the urban poor, socioeconomic and<br />
housing data for the poor, subsidence maps, and data on <strong>climate</strong> hazards and<br />
measurement of <strong>risk</strong> and potential losses.<br />
Cities are approaching <strong>risk</strong> assessments in diff erent ways, with some working<br />
on them in a holistic fashion and others carrying out sector-level assessments one<br />
at a time. Tools are being developed to help cities identify <strong>risk</strong>s, initiate planning,<br />
and establish adaptation priorities. One such approach is the Urban Risk Assessment<br />
recently developed by the <strong>World</strong> Bank in partnership with Global Facility<br />
for Disaster Reduction and Recovery (GFDRR), United Nations Environmental<br />
Programme (UNEP), UN-HABITAT, and others (box 3.1). Th is is the approach<br />
used for the case studies carried out for this report. Note that in carrying out <strong>risk</strong><br />
assessments, local analysis of natural hazards is not always suffi cient for assessing<br />
<strong>risk</strong> given the ripple eff ects of network systems within cities. Impacts in one location<br />
can lead to eff ects that go way beyond the directly aff ected area. For example,<br />
a localized fl ood can shut down electricity in an entire city, stop all public transport<br />
systems, and completely paralyze economic activity.<br />
Mapping informal settlements can be a fi rst step to assessing <strong>risk</strong> for the urban<br />
poor. In a growing number of communities, the poor themselves are carrying<br />
out this work. In Cuttack, India, community-driven data gathering includes the<br />
preparation of digital maps at the city scale for city authorities with input from<br />
an NGO. 1 Th e work begins with residents mapping their communities with a<br />
GPS device, commenting on boundaries and characteristics (<strong>risk</strong> profi le, services,<br />
etc.), which help the visiting NGO team understand the settlement. Points<br />
marked with the GPS are uploaded to Google Earth and, when aggregated into a<br />
citywide map, provide the location and boundaries of all informal settlements, as<br />
well as their <strong>risk</strong> profi le.<br />
Th e process of carrying out a <strong>risk</strong> assessment can be as important as the<br />
results, particularly with regard to building coalitions among stakeholders. Th e<br />
experiences from the Dar es Salaam, Jakarta, Mexico City, and São Paulo cases<br />
point to a few lessons outlined in box 3.2.<br />
Action Planning<br />
Once a <strong>risk</strong> assessment is carried out, the critical step of identifying priorities<br />
and action planning will follow. As with assessments, workbooks and tools have<br />
been (or are being) developed to assist cities in initiating planning for adaptation<br />
and <strong>risk</strong> reduction. Most of these emphasize standard planning approaches, such<br />
as building support within government departments, building a team, conducting<br />
assessments, identifying actions, and implementing and monitoring actions.
66 ■ CLIMATE CHANGE, DISASTER RISK, AND THE URBAN POOR<br />
BOX 3.1<br />
Urban Risk Assessment<br />
The Urban Risk Assessment (URA) is a fl exible approach that facilitates improved<br />
understanding of a city’s <strong>risk</strong>s from <strong>disaster</strong>s and <strong>climate</strong> <strong>change</strong>, which has been<br />
developed by the <strong>World</strong> Bank in partnership with GFDRR, UNEP, UN-HABITAT,<br />
and others. It is a somewhat standardized cost-effective tool intended to harmonize<br />
how information is gathered and analyzed related to <strong>disaster</strong> and <strong>climate</strong> <strong>risk</strong><br />
at the city level, and to identify areas and populations that are most vulnerable.<br />
The URA is based on three main pillars: institutional, hazard impact, and<br />
socioeconomic assessment. For each pillar, there are three levels of assessment:<br />
primary, secondary, and tertiary. The URA allows for customization in how it is<br />
applied, depending on need, available resources, institutional capacity, available<br />
information, and time. Through a phased approach, where each assessment<br />
level is linked to progressively more complex and detailed tasks, city managers<br />
may select the appropriate series of components from each pillar that individually<br />
and collectively enhance the understanding of <strong>risk</strong> in a given city. The approach<br />
is structured to integrate both rapid onset events, such as fl oods or landslides,<br />
which are more typically the purview of the <strong>disaster</strong> <strong>risk</strong>- management community,<br />
and slow onset hazards, such as drought or sea level rise typically associated<br />
with a longer-term <strong>change</strong> in <strong>climate</strong> trends.<br />
c<br />
o<br />
m plexity<br />
urban management tools<br />
institutional<br />
assessment<br />
URA<br />
teritiary data<br />
requirements<br />
secondary data<br />
requirements<br />
primary/baseline<br />
data requirements<br />
hazard<br />
assessment<br />
urban adaptive capacity<br />
c<br />
o st<br />
socioeconomic<br />
assessment<br />
The urban <strong>risk</strong> assessment is ideally undertaken as a part of a cycle of<br />
assessing <strong>risk</strong>, developing and implementing <strong>risk</strong>-management plans, monitoring,<br />
and reviewing over a planning cycle. The URA has been used by the four<br />
cities of the Mayor’s Task Force.<br />
Source: Dickson, Baker, Hoornweg, and Tiwari. (2012).
BOX 3.2<br />
BUILDING RESILIENCE FOR THE URBAN POOR ■ 67<br />
Lessons Learned from Carrying out City-level Risk<br />
Assessments under the Mayor’s Task Force<br />
1. High-level support from the mayors and heads of key agencies was essential<br />
to giving priority and support to the work. Working-level focal points were key<br />
to ensuring accountability and getting the work done.<br />
2. In all of the cities, an interagency working group was set up to carry out the <strong>risk</strong><br />
assessments. This included agencies working on urban development, service<br />
provision, poverty reduction, <strong>disaster</strong> management, and <strong>climate</strong> <strong>change</strong>. In<br />
some cases, this was the fi rst time these agencies worked together, which<br />
created synergies for a more integrated and comprehensive <strong>risk</strong> assessment<br />
and began the process for adaptation planning. However, it is unclear that<br />
these interagency working groups will be sustained without a more formal<br />
working arrangement.<br />
3. In some of the cities, there was a big disconnect between knowledge at the<br />
institutional and at the community level. This was addressed by involving city<br />
offi cials in site visits to poor neighborhoods, and in two cases, involving stakeholders<br />
in the workshops. Communicating in a language that all stakeholders<br />
could understand was fundamental. In that regard, producing materials in a<br />
simple format and local language was important for communicating results.<br />
In Jakarta and Mexico City, short fi lms have been produced for broad dissemination<br />
of key messages.<br />
4. Across the four cities, accessing data, maps, and <strong>climate</strong> projections was<br />
problematic. Information is scattered across many different agencies, departments,<br />
organizations, and research institutions, with some reluctant to share<br />
data. Enormous effort went into collecting the information made available.<br />
To benefi t from and sustain this effort, setting up a permanent institutional<br />
“home” to maintain and update this interagency information in each city<br />
would be benefi cial for any future work.<br />
5. The <strong>risk</strong> assessments were perceived as a useful framework for understanding<br />
<strong>climate</strong> <strong>change</strong>, <strong>disaster</strong> <strong>risk</strong>, and impacts on residents. The multidimensional<br />
approach to assessing hazards, and socioeconomic and institutional <strong>risk</strong>s,<br />
brought together key issues in a comprehensive way. This was found, however,<br />
to be only the fi rst step. Stakeholder workshops held in all of the cities were<br />
useful in discussing key issues, but follow-up will be needed to integrate these<br />
fi ndings into planning for adaptation and <strong>risk</strong> reduction across city agencies.<br />
Source: Author.
68 ■ CLIMATE CHANGE, DISASTER RISK, AND THE URBAN POOR<br />
BOX 3.3<br />
Developing Action Plans in Vietnam, New York City,<br />
and Mexico City<br />
One of the tools developed and currently being used in three cities in Vietnam<br />
(Hanoi, Dong Hoi, and Can Tho) is the Local Resilience Action Plan (LRAP). a<br />
The LRAP is a planning document that helps a city to assess alternative options<br />
for adaptation and <strong>risk</strong> reduction, with economic assessment of the costs and<br />
benefi ts of each. It includes an inventory of planned capital investments and<br />
policy <strong>change</strong>s to address high-<strong>risk</strong> areas, gap analysis, and multistakeholder<br />
priority-setting based on comparison of alternatives in light of limited budgets<br />
and fundraising prospects. The action plan will result in a strategic set of shortterm<br />
(less than 1-year), medium-term (1- to 3-year), and long-term (more than<br />
3-year) adaptation priorities for project investment with specifi c costs, timelines,<br />
and responsible actors. In the case of Can Tho, the outcomes of the LRAP process<br />
are currently being integrated into local urban planning.<br />
Stakeholders work to establish priorities, highlighting those actions that are<br />
most critical to undertake in relation to the available funding and capacity for<br />
implementation. Other factors, such as fi nancial feasibility, political and technical<br />
complexity, social issues, and distributional and equity issues, are also considered.<br />
Once priorities are established and an action plan is developed, detailed<br />
plans for each project (ranked by priority), including objectives, cost parameters,<br />
and a plan of implementation, are prepared. When considering implementation,<br />
the city may decide to treat <strong>risk</strong>s differently in different areas of the city,<br />
with the following options: (1) eliminate or avoid; (2) transfer or share (example<br />
through insurance); (3) mitigate (through structural interventions); and (4) accept<br />
and manage the <strong>risk</strong>.<br />
New York City provides an interesting example of moving from <strong>risk</strong> assessment<br />
to action planning to implementation. In 2008 Mayor Michael Bloomberg<br />
tasked the New York City Climate Change Adaptation Task Force with developing<br />
a plan to increase the resilience of the city’s critical infrastructure. The task<br />
force comprised 40 city, state, federal, and private sector infrastructure operators<br />
and regulators with the goal of identifying <strong>climate</strong> <strong>risk</strong>s to the city’s critical<br />
infrastructure and developing strategies to mitigate these <strong>risk</strong>s.<br />
Once the <strong>risk</strong> analysis was completed, an extensive process of identifying,<br />
developing, and prioritizing actions was carried out. The task force focused<br />
on improving current buildings, amending building design and other regulatory<br />
(continued next page)
BOX 3.3 continued<br />
BUILDING RESILIENCE FOR THE URBAN POOR ■ 69<br />
codes, as well as the strategic placement of public facilities. It adopted a <strong>risk</strong>based<br />
approach to <strong>climate</strong> action, and uses Flexible Adaptation Pathways<br />
to address the anticipated <strong>risk</strong>s, compensating for the uncertainty of <strong>climate</strong><br />
impacts (NYCPCC 2010). The task force was supported by a panel of technical<br />
experts, which was also convened by the mayor.<br />
New York City is working on site-specifi c adaptation plans through a community<br />
planning process with stakeholder groups. The fi rst two case studies<br />
worked with vulnerable waterfront communities and involved local universities<br />
and nongovernmental organizations to create a process for planning neighborhood<br />
<strong>climate</strong> adaptation. Recognizing that <strong>risk</strong> and adaptation solutions will vary<br />
based on location and resources, the goal was to produce a standardized process<br />
to use in waterfront communities throughout the city.<br />
Mexico City’s experience is also notable as the fi rst city in Latin America<br />
to introduce a local <strong>climate</strong> action program (Mexico City’s Climate Action Program<br />
[MCCAP], 2008–2012, which is part of a 15-year green plan in which<br />
Mexico City is investing US$1 billion a year, approximately 9 percent of the<br />
yearly budget). The MCCAP aims to (1) reduce CO emissions by 7 million<br />
2<br />
tons in the period 2008–2012 and (2) develop a Climate Change Adaptation<br />
Program for the federal district and fully begin its implementation in 2012.<br />
In implementation, the government uses various policy instruments, including<br />
regulation, economic incentives, voluntary carbon markets, education and<br />
information campaigns, and direct resources from the city budget.<br />
The Inter-Institutional Climate Change Commission of Mexico City is in<br />
charge of coordinating and evaluating the MCCAP. This commission includes<br />
representatives from all the administrative units of the federal district. Its responsibilities<br />
are to design, encourage, and coordinate policies to mitigate the effects<br />
of <strong>climate</strong> <strong>change</strong> in Mexico City; to evaluate, approve, and disseminate related<br />
projects; to develop fi nancial strategies that generate revenue; and to coordinate<br />
actions and policies with other programs.<br />
A main challenge of the MCCAP has been institutional coordination. Multiple<br />
agencies are executing a series of actions with limited communication or information<br />
ex<strong>change</strong>. Further exacerbating the open ex<strong>change</strong> of information is that<br />
each agency has its own information platform. An important step to improving<br />
coordination would be to use a common interface, which all government agencies<br />
could use for data storage and use.<br />
a. See <strong>World</strong> Bank, (2010b).<br />
Source: Author.
70 ■ CLIMATE CHANGE, DISASTER RISK, AND THE URBAN POOR<br />
Developing comprehensive plans that incorporate <strong>climate</strong> <strong>change</strong> and <strong>disaster</strong><br />
<strong>risk</strong> reduction can be daunting, as cities already are overburdened and struggling<br />
to achieve existing goals. Th at being said, for those countries that have worked<br />
on developing plans, some lessons have been learned and guidance developed.<br />
First, assessments provide important information for establishing priorities. Second,<br />
the orientation of the tools being developed demonstrates the importance of<br />
assessing natural systems and hazard <strong>risk</strong> as well as institutional capacity and the<br />
vulnerability of settlements and subpopulations. Th ird, assessments developed by<br />
consultants are less eff ective than those developed by or in cooperation with city<br />
departments and stakeholders (Carmin 2010).<br />
Integrating Climate Change and Disaster<br />
Risk Reduction Policies for the Poor into<br />
Urban Planning and Management<br />
Ideally any adaptation or <strong>risk</strong>-reduction plan will be integrated with urban planning<br />
and management. Policies to address <strong>climate</strong> and <strong>disaster</strong> <strong>risk</strong> have links<br />
to many sectors and thus come with important synergies that are best captured<br />
through system-wide approaches. Given the <strong>risk</strong>s for the urban poor that have<br />
been highlighted in this report, integrating <strong>climate</strong> <strong>change</strong> and policies for <strong>disaster</strong><br />
<strong>risk</strong> reduction into urban planning for upgrading or preventing slums is<br />
imperative.<br />
Diverse cities have incorporated <strong>disaster</strong> and <strong>climate</strong>-<strong>change</strong> <strong>risk</strong> into their<br />
planning, with positive outcomes and important lessons. Among these are Boston,<br />
Cape Town, Ho Chi Minh City, London, Quito, Rotterdam, and Toronto<br />
(Birkman et al. 2010). At a minimum, these cities have identifi ed <strong>risk</strong>-prone<br />
areas and through urban planning discouraged new construction in these areas.<br />
Similarly, Istanbul, Ho Chi Minh City, and Cape Town called for resettlement of<br />
communities in the most <strong>risk</strong>-prone areas, in addition to improved construction<br />
and regulation of low-income and informal housing. Of the more proactive<br />
approaches, both Boston and Rotterdam encouraged new methods of construction<br />
to cope with anticipated fl ooding, elevating buildings and creating fl oating<br />
communities, respectively. Several cities, including Boston, Toronto, Halifax, and<br />
Rotterdam, encouraged the use of green infrastructure to mitigate <strong>risk</strong>. Th e plans<br />
that featured the most comprehensive urban planning to combat <strong>climate</strong> <strong>change</strong><br />
are the ones developed for London, New York, Quito, Halifax, and Toronto.<br />
Examples from developing countries with a focus on improving slums are almost<br />
nonexistent, which is not surprising given that few countries have citywide urban<br />
plans that fully address informal settlements let alone integrating policies to<br />
make them resilient.
Disaster Risk Reduction in Istanbul<br />
BUILDING RESILIENCE FOR THE URBAN POOR ■ 71<br />
Rebuilding aft er a <strong>disaster</strong> is frequently used as an opportunity to improve land<br />
use and construction quality. Following the 1999 Marmara earthquake in Turkey,<br />
the Istanbul Metropolitan Municipality prepared the Earthquake Master Plan<br />
for Istanbul in cooperation with local universities (Metropolitan Municipality of<br />
Istanbul 2003). Among many elements, the plan includes an assessment of current<br />
vulnerabilities, guidelines on the rehabilitation of existing buildings, and an<br />
outline of the urban planning issues necessary to mitigate seismic <strong>risk</strong> in Istanbul.<br />
Th e document created a Strategic Plan for Disaster Mitigation in Istanbul<br />
(SPDMI), with the primary goal of reducing seismic impacts and the secondary<br />
goal of improving environmental quality.<br />
Th e SPDMI identifi ed problems associated with planning laws in the Istanbul<br />
area that it would seek to improve. First, it identifi ed the lack of mandatory<br />
regional planning, which would prevent the cohesive development at the macro<br />
level. Second, the coverage and scale of some local plans directly contradict other<br />
laws at the metropolitan scale. Additionally, <strong>disaster</strong> <strong>risk</strong> mitigation was lacking<br />
in available plans, as well as a general tolerance of illegal construction in vulnerable<br />
areas. In relation to the built environment, the SPDMI identifi ed an abundance<br />
of bureaucratic obstacles in construction, and a lack of a coherent building<br />
code, which both encouraged illegal development and substandard construction.<br />
Estimates are that 80 percent of the buildings are occupied and potentially renovated<br />
without permits. Th e recommendations for these challenges encouraged<br />
the empowerment of metropolitan authorities and the regional seismic commission<br />
to assess <strong>disaster</strong> <strong>risk</strong>s and prepare strategic plans through a <strong>disaster</strong>-management<br />
lens.<br />
In relation to the physical footprint and structures within the city, the SPDMI<br />
categorized construction according to when the structures were built, who built<br />
them (including the permits required), and where these structures were located<br />
relative to infrastructure and natural hazards. Th e SPDMI then identifi ed priority<br />
areas for intervention using three steps. First, a location quotient was calculated<br />
for the percentage of buildings expected to be heavily damaged (BEHD) in each<br />
district. Second, data produced by the Japan International Cooperation Agency<br />
on hazard probability, refl ecting the density of each BEHD, was analyzed to calculate<br />
the standard number of units per hectare. Th ird, the SPDMI multiplied<br />
these values by the building and population densities to gain a clear idea of which<br />
areas would suff er the greatest economic or human losses due to an earthquake.<br />
Using this information, the SPDMI identifi ed the safest and most benefi -<br />
cial areas for development and retrofi tting, and laid out three levels of plans<br />
for action. At the macro level, the need to create a national strategy on the spatial<br />
basics of social and economic growth was identifi ed, mandating the use of
72 ■ CLIMATE CHANGE, DISASTER RISK, AND THE URBAN POOR<br />
regional plans. Within the regional framework, the environmental assets of the<br />
metropolitan areas were identifi ed as serving a hazard-mitigation role. In addition,<br />
the national plan identifi ed peripheral areas near Istanbul for resettling<br />
high-<strong>risk</strong>, high-density urban communities. At the mezzo and micro levels, the<br />
SPDMI identifi es municipal planning agencies that will manage urban redevelopment,<br />
with a special focus on the low-<strong>risk</strong> land readjustment areas for urban<br />
facility placement.<br />
Climate Change Adaptation in London<br />
Th e Greater London Authority released the draft London Climate Change Adaptation<br />
Strategy in 2010, with the key actions of improving management of surface<br />
water fl ooding, developing an urban greening program, and retrofi tting 1.2 million<br />
homes for more effi cient water and energy use by 2015 (Greater London Authority<br />
2010). To reduce fl ood <strong>risk</strong>s in London, the strategy calls for mapping current<br />
fl ood areas and using <strong>climate</strong> projections to understand how <strong>climate</strong> <strong>change</strong> could<br />
increase the size of fl ood-prone areas in the future. In addition, the plan aims to<br />
increase green spaces, constructing wetlands, and to use sustainable urban drainage<br />
systems in the city to mitigate fl ooding. To counteract the eff ect of urban heat<br />
islands and heat waves, the strategy encourages planting trees and creating green<br />
spaces to provide shade. Also, the vegetation will provide insulation during winter.<br />
Th e strategy also calls for all new development to use passive-cooling rather than<br />
mechanical-cooling systems. Spatial planning, using the projected fl ood maps,<br />
will determine where development should not occur, and where existing structures<br />
should be removed. Th e strategy recognizes that development pressures may<br />
necessitate the development of fl ood-prone areas; however, the Greater London<br />
Authority and London boroughs will use planning to reduce fl ood <strong>risk</strong>.<br />
Quito Climate Change Strategy<br />
In Quito, Ecuador, the city has used its ecological footprint as a tool to plan<br />
for water resources and natural-hazard <strong>risk</strong>s of the city (City of Quito 2010).<br />
Th rough population growth and decreased precipitation, the ecosystem of Quito<br />
is already suff ering from water scarcity. Th is is expected to get worse as higher<br />
temperatures begin to aff ect the mountain glaciers, which provide the city with<br />
water. Currently, the city has prepared vegetation maps, <strong>climate</strong> and forest-fi re<br />
maps, and watershed models, as well as having analyzed the socioeconomic<br />
demographics of the city. Th e city has already begun to relocate families living<br />
in high-<strong>risk</strong> areas and to integrate <strong>climate</strong> impacts into sustainable plans for<br />
land use, including slope and hillside management. Upcoming activities include<br />
analysis of vulnerability for all sectors, analysis of land use and land-use <strong>change</strong>s,
BUILDING RESILIENCE FOR THE URBAN POOR ■ 73<br />
and creation of an information system on <strong>climate</strong> <strong>change</strong> that includes a virtual<br />
platform on forest fi res’ <strong>risk</strong> management. In relation to green space, the city<br />
also plans to create ecological corridors and to explore REDD+ aff orestation as a<br />
potential adaptation mechanism with fi nancial benefi ts.<br />
Mainstreaming Climate Change in Halifax<br />
Th e Halifax Region Municipality (HRM) collaborated with the Canadian Sustainable<br />
Environment Management Offi ce and ClimAdapt, a network of regional<br />
private-sector companies with <strong>climate</strong>-adaptation expertise, to produce the<br />
Climate SMART (Sustainable Mitigation and Adaptation Risk Toolkit) series.<br />
Climate SMART includes documents aimed at mainstreaming concerns about<br />
<strong>climate</strong> <strong>change</strong> into municipal planning and decision making. Among these documents,<br />
there is a Climate Change Risk Management Strategy for HRM, as well<br />
as a Developer’s Risk Management Guide. Th ese two documents guide both the<br />
public and private sector in concerns about physical development through a <strong>risk</strong>management<br />
approach to prevent, tolerate, and share <strong>risk</strong> in the built environment.<br />
Both reports encourage the use of natural ecosystem responses to <strong>climate</strong><br />
concerns. In relation to coastal and storm-related fl ooding, the Climate Change<br />
Risk Management Strategy for HRM encourages the use of LIDAR (light detection<br />
and ranging) technology to establish precise elevation for coastal-inundation<br />
models, improved urban-design criteria for infrastructure, and urban greening<br />
(Halifax Regional Municipality 2007b).<br />
Th e city has established new precipitation return periods for use in municipal<br />
physical planning to refl ect the expected increase in storm intensity and frequency.<br />
Th is information is being used to analyze current land use, zoning, and settlement<br />
patterns. For the private sector, the Developer’s Risk Management Guide encourages<br />
four strategies to deal with the eff ects of <strong>climate</strong> <strong>change</strong> (Halifax Regional<br />
Municipality 2007a). First, the strategy calls for prevention, toleration, and sharing<br />
of loss through the use of natural systems (in the form of green belts) and<br />
proactive planning to mitigate precipitation and heat aff ects. Second, it calls for<br />
the <strong>change</strong> of land use to accommodate and possibly take advantage of expected<br />
<strong>climate</strong> <strong>change</strong>s. Th ird, the strategy calls for relocation of planned development<br />
to areas expected to be less vulnerable to <strong>climate</strong>. Finally, the plan encourages restoration<br />
and retrofi tting of developments following damage or climactic <strong>change</strong>.<br />
Toronto’s Wet Weather Flow Master Plan<br />
Much like Halifax, Toronto offi cials expect <strong>climate</strong> <strong>change</strong> to bring heat waves and<br />
intense precipitation. In recent years, Toronto has experienced a record number<br />
of days with average temperatures over 30°C, leading the city to issue 18 extreme
74 ■ CLIMATE CHANGE, DISASTER RISK, AND THE URBAN POOR<br />
heat alerts (as of 2008) (Toronto Environmental Offi ce 2008). In addition to recommending<br />
future adaptation actions, the Toronto plan listed several ongoing<br />
programs that are currently helping the city adjust to <strong>risk</strong>s and make it more<br />
sustainable. Toronto has established a 25-year Wet Weather Flow Master Plan,<br />
designed to reduce fl ooding and impacts on area streams due to severe precipitation.<br />
Th is plan encourages the use of permeable paving and rain barrels to reduce<br />
runoff . Th e city is currently studying the tree canopy and working to double the<br />
urban tree cover, including by greening surface parking lots in order to increase<br />
shade and reduce heat and runoff . In addition, the city is providing tax incentives<br />
to encourage the greening or use of refl ective paint on area roofs. Finally, Toronto<br />
is engaging local neighborhoods in the “Live Green Toronto” project. As in New<br />
York, they are using feedback from local communities to inform land-use policy<br />
and greening initiatives.<br />
Jakarta Risk Planning<br />
Jakarta’s plan for 2010–2030 calls for incorporating <strong>risk</strong> reduction into long-term<br />
spatial planning for the city. Such approaches include restoring mangrove forests,<br />
improving public facilities and mass transit, refi ning building and environmental<br />
regulations that consider hazard <strong>risk</strong>, redesigning technology and engineering in<br />
<strong>disaster</strong> areas, and improving provision of open space for anticipated increases<br />
in intense rainfall. Th e city has also established a dedicated body for <strong>disaster</strong>-<strong>risk</strong><br />
reduction in 2010, which is intended to help with planning and mainstreaming<br />
at the neighborhood level. A Kelurahan Empowerment Initiative is under way in<br />
fi ve neighborhoods to develop Local Resilience Action Plans (LRAP) with local<br />
and community leaders in Jakarta. 2<br />
Green Infrastructure and Ecological Services to Reduce Risk<br />
In several examples above, green infrastructure and ecological services are<br />
being used to mitigate fl ood and heat <strong>risk</strong>s as part of adaptation planning. Th ere<br />
is a growing recognition that natural drainage systems are the most eff ective at<br />
mitigating fl ood <strong>risk</strong>, rather than passing the <strong>risk</strong> to communities downstream.<br />
Th e United Kingdom Climate Impacts Programme has projects that aim to<br />
improve knowledge on <strong>climate</strong> impacts, including the urban-focused Adaptation<br />
Strategies for Climate Change in the Urban Environment (ASCCUE).<br />
ASCCUE explores options for <strong>climate</strong> adaptation through urban-design and<br />
strategic planning, and the potential of urban green space in fl ood and heat<br />
mitigation (Gill et al. 2007). Incorporating land cover, sustainable urban drainage<br />
techniques, and green roofs, the ASCCUE explored the potential impacts<br />
of green installations in Manchester. Th e sheeting of water over buildings and
BUILDING RESILIENCE FOR THE URBAN POOR ■ 75<br />
paved surfaces prevents the rain from entering the ground, thereby interrupting<br />
the local hydrological cycle.<br />
Th e Manchester study found that green roofs reduced the total runoff by<br />
18 millimeters for anywhere between 0.1 and 1.0 percent, depending on the<br />
building type covered. While this percentage may seem small, at the urban scale,<br />
the runoff reduction could have a signifi cant impact. Aiming to counteract the<br />
eff ects of urban heat islands, green land cover in high-density residential areas<br />
and the town center were found to maintain maximum surface temperatures at<br />
or below the 1961–1990 baseline for the next 70 years. Th is encouraging estimate<br />
demonstrates the huge impact and importance of urban greening. Finally, the<br />
Manchester study recognized that storage will be an important way to respond<br />
to extra precipitation, and explored options such as point infi ltration, swales,<br />
and retention ponds in order to use the water during droughts. Public parks and<br />
the restoration of rivers are other options being practiced in various urban sites<br />
where urban planners and water managers are recognizing that the previous<br />
practices of encroaching upon and enclosing urban water ways are exacerbating<br />
fl ash fl ooding downstream.<br />
While one of the earliest recognized successes may be Curitiba, Brazil, there<br />
are a handful of newer cases in Spain, the Philippines, Chile, and Korea. In<br />
Barcelona, the fl ash-fl ood prone Besos River was restored to a meandering lowfl<br />
ow channel within a wider fl oodway of constructed wetlands (Martin-Vide<br />
2001). Intense urbanization in the 1960s had led to the encroachment of 300,000<br />
poor residents into the original Besos fl oodplain. Planning for river restoration<br />
began in the mid-1990s in an eff ort to improve the environmental quality of the<br />
city, control fl oods, and provide a green recreation space for the impacted municipalities.<br />
Th e Marikina River in Marikina City, the Philippines, is another example;<br />
uncontrolled encroachment and the unregulated disposal of waste had created a<br />
festering waterway in the center of the city (Yu and Sajor 2008). Begun in 1993,<br />
the Save the Marikina River program operated over more than a decade, removing<br />
informal settlements, reducing dumping, and establishing a recreational park<br />
around the river for fl ood control. While complicated, the removal and relocation<br />
of informal settlements proved justifi ed, and 10 years later, the aff ected communities<br />
were satisfi ed with their safer houses and improved service provision.<br />
Currently under construction, Parque La Aguada in Santiago, Chile, restores<br />
the city’s main ecological corridor in an eff ort to revitalize an abandoned and<br />
neglected industrial area (Allard and Rojas 2010). Focused around the Zanjón<br />
de la Aguada, a seasonable stream, the fl ood park will cover 60 hectares of river<br />
bank, providing recreational areas during the dry season. As part of the Santiago<br />
Inner Ring Initiative, the Aguada Flood Park will “daylight” a 4-kilometer<br />
stretch of the stream, which is no longer able to handle the high-intensity fl ows<br />
of the rainy season. In addition, the park aims to trigger economic and social
76 ■ CLIMATE CHANGE, DISASTER RISK, AND THE URBAN POOR<br />
development for the adjacent communities. Similarly, the 2005 Cheonggyecheon<br />
Restoration Project has created a 6-kilometer public recreation space<br />
centered on a seasonal stream in the central business district in Seoul, Korea. 3<br />
During a period of rapid economic growth, the stream was transformed into<br />
a culvert to make space for transportation infrastructure. In a US$900 million<br />
eff ort to improve the environmental quality of Seoul, the metropolitan government<br />
removed concrete surfaces and elevated highways to release the historic<br />
stream and create a park and fl oodway, thereby revitalizing the adjacent neighborhoods.<br />
Balancing Policy Tradeoffs among Risk Reduction, Urban<br />
Development, and Poverty Reduction in Decision Making<br />
Policy decisions typically involve diffi cult decisions with both positive and negative<br />
outcomes that local decision makers and stakeholders must carefully weigh.<br />
Urban systems have long time scales and cannot be physically <strong>change</strong>d easily,<br />
thus decisions made now will have impacts for decades to come. Th is is due to (1)<br />
the long life span of urban infrastructure and buildings, which can be as much as<br />
one hundred years or more for high-value buildings, bridges, or water systems;<br />
and (2) the location decisions of infrastructure and buildings, which typically go<br />
well beyond their life span. For example, when railways reach their replacement<br />
time, they are almost always replaced at the same location. In the same way, new<br />
urban development is a somewhat irreversible choice, as it is economically and<br />
politically diffi cult to relocate people.<br />
Th e most instrumental policy area is land-use planning and management. As<br />
cities in developing countries grow, they oft en expand into marginal areas such as<br />
fl ood plains, water catchments, and steep hillsides. Poor urban-planning and management<br />
policies exacerbate this. At the city scale, there is a need for land-use planning<br />
to consider fl ood, seismic, and other hazard zones when determining where<br />
new development should be permitted. Effi cient transport systems can increase<br />
land supply in new areas by enabling access and mobility, thus reducing incentives<br />
to develop in vulnerable locations. Preventing building and settlements in<br />
high-<strong>risk</strong> areas can save lives and prevent destruction. A framework for regularizing<br />
land tenure, including partial or incremental solutions, can spawn investments<br />
and encourage improvements in infrastructure. Proactive policies aimed<br />
at preventing new slums, which may involve <strong>change</strong>s in the legal and regulatory<br />
framework and draw on the lessons of past experiences with sites and services<br />
projects, can help to curtail the rapid growth of new slums on vulnerable lands. In<br />
some cases, governments and municipalities would acquire land for block-level<br />
infrastructure rights of way around the peripheries of rapidly growing cities.
BUILDING RESILIENCE FOR THE URBAN POOR ■ 77<br />
Such policies are, however, controversial. Th e high demand for land and<br />
resources, and the infl uence that private land speculators and developers oft en<br />
have, can reduce the eff ectiveness of formal policy and planning practices (Birkmann<br />
et al. 2010). In megacities where land use plans do exist, they are rarely<br />
coordinated across jurisdictions or levels of government. Even within a city,<br />
responsibilities for land and associated services may be scattered among several<br />
entities, hindering coordination of land management.<br />
Policy Tradeoffs<br />
In identifying policy choices and actions that cities can consider when addressing<br />
<strong>climate</strong> <strong>change</strong>, <strong>disaster</strong> <strong>risk</strong>, and the urban poor, it is important to understand<br />
the positive co-benefi ts as well as possible negative consequences of each.<br />
From an operational perspective, governments must make these policy choices<br />
in the context of broader priorities, which include quality of life for city residents,<br />
economic competitiveness and attractiveness for investors, other environmental<br />
goals such as greenhouse gas emissions and protection of natural areas, public<br />
health, and social concerns such as equity and social capital. Key policies and<br />
actions in fi ve areas aimed at reducing <strong>risk</strong> for the urban poor are highlighted<br />
below, with the positive co-benefi ts and possible negative consequences of each<br />
summarized in table 3.1.<br />
Th e fi rst policy area involves the tradeoff s between protection for many areas<br />
against extensive <strong>risk</strong> versus protection for few areas against intensive <strong>risk</strong>. Some<br />
investments such as basic services will have more immediate welfare and economic<br />
gains, but this may mean delaying other investments such as drainage or<br />
levees that will increase resilience to large shocks in the longer term. Th ere are cobenefi<br />
ts for some policy choices, such as planning regulations for land use where<br />
the policy outcomes will have positive impacts on reducing both extensive and<br />
intensive <strong>risk</strong>.<br />
Second are the complex tradeoff s between investing in upgrading at-<strong>risk</strong><br />
informal settlements versus relocating populations to safer areas. Studies show<br />
that slum dwellers gain more from slum upgrading than from relocation (<strong>World</strong><br />
Bank 2006). It is unclear, however, whether these analyses consider natural <strong>risk</strong>s,<br />
including extreme events. In higher-<strong>risk</strong> locations, providing additional services<br />
(energy, housing, water, drainage, and sanitation) may increase exposure through<br />
attracting more inhabitants and increasing the value of the assets at <strong>risk</strong>. Institutional<br />
<strong>change</strong>s (for example, secure land tenure) may lead inhabitants to invest<br />
in their dwellings and related contents, increasing assets at <strong>risk</strong> and losses in case<br />
of <strong>disaster</strong>.<br />
In balancing these tradeoff s, a policy response is to defi ne an acceptable <strong>risk</strong><br />
level via a political process with as much local participation as possible. Below
TABLE 3.1<br />
Consequences of Risk-Reduction Policies and Actions in Urban Areas<br />
Risk<br />
reduction<br />
policy<br />
1. Protection<br />
for many areas<br />
against<br />
extensive<br />
<strong>risk</strong> (versus<br />
few areas<br />
against<br />
intensive<br />
<strong>risk</strong>)<br />
2. In situ<br />
upgrading<br />
in at-<strong>risk</strong><br />
informal<br />
settlements<br />
(versus<br />
relocation to<br />
safer areas)<br />
Actions Positive Co-benefi ts Potential negative consequences<br />
Investments in basic services<br />
such as water, sanitation,<br />
waste, drainage, and transport<br />
in poor areas<br />
Investments in early-warning<br />
systems and insurance<br />
Regulations to mitigate<br />
increases in exposure through<br />
land-use planning, zoning,<br />
and building norms<br />
Delay large, costly investments<br />
against extreme<br />
events, such as drainage,<br />
levees, embankments, urban<br />
transport, and buildings<br />
Investments in basic services<br />
in at-<strong>risk</strong> informal settlements<br />
Avoid more costly investments<br />
in dykes and drainage<br />
systems<br />
Avoid relocation to new areas<br />
(could be cost-neutral)<br />
Large quality-of-life benefi ts from improved<br />
basic services<br />
Most cost-effective, given that most <strong>risk</strong>s<br />
for urban poor are extensive<br />
Improvements in city economy from<br />
increases in productivity and competitiveness<br />
Reduction in overall <strong>risk</strong> from frequent<br />
events<br />
Reductions in local air and water pollution<br />
Large health co-benefi ts<br />
Improvements in social equity from propoor<br />
investments<br />
Similar benefi ts as listed in 1<br />
Residents may benefi t from location<br />
choice close to jobs and services<br />
Avoid new urbanization, and reduce urban<br />
sprawl and destruction of preserved<br />
areas<br />
Avoid negative social impacts of relocation<br />
programs (loss of jobs, social<br />
networks, culture)<br />
Increase in vulnerability to most extreme events<br />
Increase in population and asset <strong>risk</strong><br />
Investments may further attract people to high-<strong>risk</strong><br />
areas and increase population and assets at <strong>risk</strong><br />
Increase in vulnerability to extreme events<br />
Poor population investments made at <strong>risk</strong> of extreme<br />
weather; <strong>risk</strong> of poverty trap if <strong>disaster</strong>s are too<br />
frequent<br />
78 ■ CLIMATE CHANGE, DISASTER RISK, AND THE URBAN POOR
3. Zoning<br />
to prevent<br />
occupation<br />
of at-<strong>risk</strong><br />
areas<br />
4. Develop<br />
new, less<br />
<strong>risk</strong>y land<br />
with effi cient<br />
transport<br />
Regulations to prevent development,<br />
investments, and<br />
housing in at-<strong>risk</strong> areas<br />
Invest in urban infrastructure<br />
and basic services in new<br />
areas<br />
Invest in new transportation<br />
networks that are effi cient and<br />
affordable (train, metro, dedicated<br />
bus line, highways)<br />
Reduction in overall <strong>risk</strong> and potential<br />
losses<br />
Decrease in population and assets at <strong>risk</strong><br />
(that is, smaller likelihood of large-scale<br />
<strong>disaster</strong>s with signifi cant effects)<br />
Avoid negative health effects from<br />
occupying unsafe or polluted land<br />
Protect mainly poorest households,<br />
which generally occupy the most at-<strong>risk</strong><br />
areas<br />
Create new urban area with provision of<br />
basic services and high accessibility<br />
Increase in available land, reduction in<br />
land pressure, and general reduction in<br />
housing prices in city; development and<br />
competitiveness benefi ts<br />
Reduced pressure to urbanize at-<strong>risk</strong><br />
areas (fl ood, landslide, subsidence) in<br />
city centers; reduction in overall <strong>risk</strong> and<br />
average losses<br />
Avoid undesired development in natural<br />
areas and ecosystem losses<br />
Improve access to adequate housing and<br />
basic services; poverty reduction benefi ts<br />
Decrease in overall available land, increase in land<br />
pressure, and general increase in housing and offi cespace<br />
prices in the city<br />
Possible acceleration of urban sprawl; soil consumption<br />
and water-proofi ng; loss in natural areas and<br />
biodiversity; competition with agriculture<br />
May increase travel distances in city and commuting<br />
times<br />
Environmental concerns from additional mobility<br />
needs and energy consumption<br />
Perverse incentive of attracting illegal settlements in<br />
no-building zones<br />
Increased car use, energy consumption, local and<br />
noise pollution and congestion, particularly if based<br />
on individual-vehicle transport<br />
Environmental concerns from additional energy<br />
consumption<br />
High cost of new infrastructure (transport and other<br />
services)<br />
Accelerated urban sprawl, with higher cost to provide<br />
public services; possible higher property taxes<br />
Additional soil water-proofi ng, increased runoff, and<br />
possible increase in fl ood <strong>risk</strong>s<br />
Accelerated urban sprawl; loss in natural areas and<br />
biodiversity; competition with agriculture<br />
Risk for poor to be relocated, causing social<br />
segregation<br />
(continued next page)<br />
BUILDING RESILIENCE FOR THE URBAN POOR ■ 79
Table 3.1 continued<br />
Risk<br />
reduction<br />
policy<br />
5. Promote<br />
dense<br />
urbanization<br />
Containment policies that<br />
determine where growth can<br />
and cannot happen<br />
Source: Adapted from Bigio and Hallegatte, 2011.<br />
Actions Positive Co-benefi ts Potential negative consequences<br />
Shift to public transport, reducing noise<br />
and traffi c<br />
Lower cost of providing public services<br />
(water and sanitation, electricity, education,<br />
health)<br />
Gain in competitiveness through reduced<br />
energy expenditures and lower taxes<br />
Higher-density facilitates zoning to avoid<br />
development in at-<strong>risk</strong> areas<br />
Reduce mobility needs and energy<br />
consumption<br />
Reduced urban sprawl and protected<br />
natural areas; increased competition with<br />
agriculture<br />
Improved social equity through reducing<br />
segregation<br />
Reduced access to housing, dwelling size<br />
Reduction in available land for construction, increase<br />
in construction costs, increase in housing prices in<br />
city; possible reduction in competitiveness<br />
Potentially larger urban heat island and larger vulnerability<br />
to heat waves<br />
Possible increase in natural hazard <strong>risk</strong> if containment<br />
land-use plans do not control for additional density in<br />
fl ood-prone or landslide areas<br />
80 ■ CLIMATE CHANGE, DISASTER RISK, AND THE URBAN POOR
BUILDING RESILIENCE FOR THE URBAN POOR ■ 81<br />
such <strong>risk</strong> level, slum upgrading is considered an appropriate approach. Beyond<br />
this <strong>risk</strong> level, population relocation is preferable. Alternatively, higher levels of<br />
<strong>risk</strong> can be reduced with more costly investments that protect the site against systemic<br />
<strong>risk</strong>s, such as dykes and drainage systems, but in this case the overall costs<br />
of in situ upgrading may go beyond the costs of relocation.<br />
Th ird are zoning regulations that can be used to prevent development and<br />
housing in high-<strong>risk</strong> areas. Zoning regulations, however, also involve tradeoff s.<br />
Depending on how large the areas in a city are at <strong>risk</strong>, such regulations will<br />
reduce the overall land available, raising prices and thus making it most diffi cult<br />
for low-income residents. Another potential issue is that even if zoning regulations<br />
are in place, it is diffi cult to enforce them. As with other policy choices, it<br />
is necessary to defi ne an acceptable <strong>risk</strong> level through consultation with local<br />
participation.<br />
Th e fourth policy area is the development of new land with effi cient and aff ordable<br />
transportation and local services. Th e location of transport infrastructure, its<br />
nature (public and private), and transport pricing have enormous impacts on<br />
city structure and characteristics, particularly on housing prices and access to<br />
jobs and services. Th e concentration of poverty on marginal land in, or close to,<br />
city centers is mainly driven by proximity to jobs and services, particularly in the<br />
absence of transport systems. Investing in aff ordable transport can open up new<br />
areas on safe land and reduce land prices, improving overall housing options.<br />
Possible negative outcomes of such policies, if not well managed through urban<br />
planning, can result in urban sprawl.<br />
Fift h are policies aimed at promoting dense urbanization through containment.<br />
Such policies determine where growth can and cannot happen in a city<br />
and can reduce environmental concerns through reduced mobility needs and<br />
energy consumption for transportation, land consumption, and <strong>risk</strong> similar<br />
to zoning regulations. However, these policies also reduce the amount of<br />
available land, increasing land pressure and prices, making it more diffi cult<br />
for poor households to access housing, and increasing incentives to settle in<br />
at-<strong>risk</strong> areas.<br />
Incorporating Policy Tradeoffs and Uncertainty<br />
in Decision Making<br />
Decisions and investments in public-service provision, <strong>disaster</strong> <strong>risk</strong> reduction,<br />
and adaptation to <strong>climate</strong> <strong>change</strong> will have consequences for many decades, given<br />
the longevity of many infrastructure investments. Yet these decisions are particularly<br />
sensitive to <strong>change</strong>s in <strong>climate</strong> conditions, where there is much uncertainty.<br />
Th is makes decision making particularly complex and has invoked some new<br />
approaches to decision making.
82 ■ CLIMATE CHANGE, DISASTER RISK, AND THE URBAN POOR<br />
Climate Sensitivity and Uncertainty<br />
Most buildings are supposed to last up to one hundred years and will have to cope<br />
in 2100 with <strong>climate</strong> conditions that, according to most <strong>climate</strong> models, will be<br />
radically diff erent from current ones. When designing a building, architects and<br />
engineers thus have to be aware of and account for expected future <strong>change</strong>s. Taking<br />
the example of Paris, many <strong>climate</strong> models project that the <strong>climate</strong> conditions<br />
in 2070, in the absence of ambitious mitigation policies, will be comparable to<br />
those found today in the south of Spain. Obviously, buildings are designed differently<br />
in Paris and in the south of Spain, and this should be taken into account.<br />
Building norms applied today in France to reduce heating energy consumption in<br />
winter may even become counter-productive if they do not take into account the<br />
<strong>risk</strong> of high energy consumption from air conditioning in summer a few decades<br />
from now. Similarly, when planning for adaptation in water, adjustments must<br />
be made for <strong>change</strong>s in water trends (rainfall, runoff , etc.) (Milly et al. 2008).<br />
With more than US$500 billion invested every year in this sector, a strong case<br />
is made for incorporating the <strong>climate</strong> model to optimize strategies, policies, and<br />
effi ciency.<br />
With regard to <strong>risk</strong> management, Nicholls et al. (2007) demonstrate that, in<br />
2070, up to 140 million people and US$35,000 billion of assets could depend on<br />
fl ood protection in large port cities around the world because of the combined<br />
eff ect of population growth, urbanization, economic growth, and rise in sea level.<br />
Previous coastal-defense projects (for example, the Th ames River barrier) have,<br />
however, shown that implementing coastal protection infrastructure typically has<br />
a lead-time of 30 years or more. Also, urbanization plans are very able to infl uence<br />
fl ooding <strong>risk</strong>, but they can do so only over many decades. Th is inertia suggests<br />
that action must begin today to protect coastal cities and to manage fl ood<br />
<strong>risk</strong>s from impacts expected by mid-century, which may be aff ected by rise in sea<br />
level, extreme weather, and other manifestations of <strong>climate</strong> <strong>change</strong>.<br />
Climate <strong>change</strong> and sea-level rise are also concerns that need to be accounted<br />
for in providing basic services. Sanitation and drainage systems need to take into<br />
account how precipitation patterns will <strong>change</strong> in the future. Th e provision of<br />
drinking water should be based on sources that will remain viable in the future;<br />
thus it is important to analyze how demands from various water usages, including<br />
irrigated agriculture, will <strong>change</strong> over time, ensuring that the proposed<br />
investments are robust over the long term.<br />
A particular challenge is the dramatic increase in uncertainty of future <strong>climate</strong><br />
conditions. In the past, the <strong>climate</strong> parameters pertinent to most activities<br />
could be observed and measured, and with specifi c objectives, statistical analyses<br />
and optimization algorithms were able to produce “best” designs as a function of<br />
known <strong>climate</strong> conditions (for example, dike heights as a function of the return<br />
time of certain storm surges, or building characteristics as a function of typical
BUILDING RESILIENCE FOR THE URBAN POOR ■ 83<br />
TABLE 3.2<br />
Sectors for which Climate Change Should Be Incorporated Due to Time<br />
Scale or Sensitivity to Climate Conditions<br />
Sector Time scale (years) Sensitivity<br />
Water infrastructures (e.g., dams, reservoirs) 30–200 +++<br />
Land-use planning (e.g., in fl ood plain or coastal areas) >100 +++<br />
Coastline and fl ood defenses (e.g., dikes, sea walls) >50 +++<br />
Building and housing (e.g., insulation, windows) 30–150 ++<br />
Transportation infrastructure (e.g., port, bridges) 30–200 +<br />
Urbanism (e.g., urban density, parks) >100 +<br />
Energy production (e.g., nuclear plants) 20–70 +<br />
Source: Hallegatte (2009).<br />
Note: Sensitivity is estimated empirically. +++ = high sensitivity; ++ = medium sensitivity; + = low sensitivity.<br />
temperature levels). In the future, however, substantial <strong>climate</strong> uncertainty makes<br />
such methods more diffi cult. As an illustration of this uncertainty, there is still<br />
disagreement among <strong>climate</strong> models about whether precipitation in West Africa<br />
will increase or decrease in response to global warming. It means that while water<br />
management needs to take into account future <strong>change</strong>s in <strong>climate</strong> conditions, it is<br />
not known if this <strong>change</strong> will be an increase of a decrease in rainfall. Clearly, this<br />
uncertainty represents an important obstacle to the design of water management.<br />
More generally, <strong>climate</strong> uncertainty can be an obstacle for all investment decisions<br />
that are <strong>climate</strong> sensitive and have a long lifetime. Th is problem is particularly<br />
acute for water, land-use planning, and coastline and fl ood defenses<br />
(Hallegatte 2009).<br />
Decision-Making Tools<br />
Some of the existing decision-making tools, such as cost-benefi t and cost-eff ectiveness<br />
analysis, may not be viable with large uncertainty. Th ese methods require<br />
a quantifi ed assessment of the likelihoods of the diff erent possible outcomes,<br />
which in most cases cannot be estimated.<br />
Robust Decision Making<br />
Given this uncertainty, new tools for decision making are emerging that are<br />
based on the concept that, over the long term, the priority is to avoid irreversible<br />
choices that can lock in undesirable or even unacceptable situations. For<br />
instance, developing low-lying coastal areas with the current uncertainty on<br />
future sea-level rise is dangerous, as it can lead to a diffi cult choice between<br />
expensive protection and retreat in the future. If such a situation is considered
84 ■ CLIMATE CHANGE, DISASTER RISK, AND THE URBAN POOR<br />
undesirable or unacceptable, and while the uncertainty is so large, it is preferable<br />
to develop only the areas that are not too vulnerable in case pessimistic<br />
scenarios in the rise of sea level are confi rmed. Th is is the basic concept of<br />
robust decision making. While traditional decision making seeks to predict<br />
the future and pick the best option for that particular future, robust decision<br />
making will instead identify the choices that are robust over many alternative<br />
views of the future.<br />
To help with the prioritization and decision making, robust, multicriteria<br />
decision-making tools can be useful. Th is approach can be used to ensure that any<br />
given policy has no unacceptable consequences for stakeholders. Th e approach<br />
helps build policy mixes that are robust in most possible future scenarios. Th e<br />
application of robust decision-making strategies can be lengthy, requiring the<br />
involvement of many stakeholders, including city offi cials, multiple agencies, private<br />
developers, and community residents. Such decision making, however, can<br />
help stakeholders assess their own choices toward higher resilience and lower<br />
vulnerability.<br />
BOX 3.4<br />
Decision Making for Adaptation Planning in Chicago<br />
The City of Chicago offers an example of a how a systematic process can aid<br />
in decision making. Initially the likelihood of different types of impacts affecting<br />
the city were identifi ed and then narrowed down to issues with the highest <strong>risk</strong>.<br />
In Chicago, the focus was on extreme heat, extreme precipitation, damage to<br />
infrastructure, and degradation of ecosystems. A list of options for each issue<br />
that could be pursued was then identifi ed. The initial list of 150 adaptation activities<br />
was then narrowed down by evaluating the benefi ts and costs, as well as<br />
the time horizon and barriers that were anticipated to be encountered during<br />
implementation. Based on this analysis, activities that were expected to prevent<br />
impacts in a short time span and would not be inhibited by many barriers were<br />
classifi ed as “must do.” In contrast, those that would have benefi ts, but were<br />
likely to encounter numerous barriers or a long time horizon were classifi ed as<br />
“investigate further,” while others that were costly were labeled as “watch.” By<br />
analyzing options in this way, the City of Chicago was able to identify a bounded<br />
set of adaptation activities for each of the four focal areas (Coffee et al. 2010). In<br />
addition, they evaluated the priorities and capacities of individual departments<br />
so that implementation would be realistic (Parzen, 2009).
BUILDING RESILIENCE FOR THE URBAN POOR ■ 85<br />
One approach, which focuses on avoiding irreversible choices that can lead<br />
to large regrets, bases decisions on scenario analysis (for example, Schwartz<br />
1996). In theory this approach results in the most robust solution, that which<br />
is most insensitive to future <strong>climate</strong> conditions (Lempert et al. 2006; Lempert<br />
and Collins 2007). Th ese methods are consistent with those commonly used to<br />
manage ex<strong>change</strong>-rate <strong>risk</strong>s, energy-cost uncertainty, research and development<br />
outcomes, and many other situations that cannot be forecast with certainty. Such<br />
robust decision-making methods have already been applied in much long-term<br />
planning, including water management in California (Groves and Lempert 2007;<br />
BOX 3.5<br />
Robust Decision Making for Road Design in a<br />
Flood-Prone Area<br />
An illustration of robust decision making applies to a local government assessment<br />
of designing a road in a fl ood-prone area. The key challenge is a lack of<br />
information on the future intensity and frequency of fl ooding. In addition, basic<br />
data is unavailable on the future <strong>climate</strong> and patterns of fl ooding in the region,<br />
the volume for future traffi c, and future land-use patterns. All this uncertainty<br />
could threaten long-term performance of the road.<br />
In such a scenario, robust decision making in the choice of road design could<br />
be used by the government through sequentially doing the following:<br />
Choosing the candidate strategy or the basic “business as usual” design,<br />
as well as the performance objective of the road.<br />
Identifying all the future combinations of conditions that might cause the<br />
road to fail to meet its objective (for example, X rise in sea level, Y increase<br />
in rainfall, and Z traffi c volume will cause the road’s level of service to be<br />
unacceptable).<br />
Identifying design options that address the unacceptable possibility of suspending<br />
service on the road.<br />
Finally, selecting the design option that performs well compared to the<br />
alternatives over a wide range of futures.<br />
In this case, robust decision making has helped the government identify<br />
design options to reduce unacceptable vulnerability and understand tradeoffs<br />
among those options.<br />
Source: Lempert and Kalra (2011).
86 ■ CLIMATE CHANGE, DISASTER RISK, AND THE URBAN POOR<br />
Groves et al. 2007). For most decision makers, the novelty will be to apply these<br />
methods to <strong>climate</strong> conditions. Th is requires users of <strong>climate</strong> information to collaborate<br />
more closely with <strong>climate</strong> scientists and to adapt their decision-making<br />
methods to <strong>climate</strong> <strong>change</strong>.<br />
Strengthening Institutional Capacity to Deliver<br />
Basic Services and Reduce Vulnerability to<br />
Climate and Disaster Risk<br />
Cities have a range of institutional structures and capacity for dealing with service<br />
delivery, <strong>disaster</strong>s, and <strong>climate</strong> <strong>change</strong>. Th e institutions typically involved<br />
with the response and management of <strong>disaster</strong>s include departments of public<br />
health, security, police, fi re, and those that serve vulnerable populations like the<br />
elderly and young. Plans oft en provide a structure through which departments<br />
communicate with one another, and many cities prepare by running simulations.<br />
Th e institutional arrangements to cope with and plan for <strong>climate</strong> <strong>change</strong>, particularly<br />
adaptation, are somewhat less developed, as it is a relatively new fi eld<br />
of policy and planning. Furthermore, the institutional structures for delivering<br />
services to the urban poor have the longest history, yet in many cities they are<br />
weak. A major constraint has been capacity as local governments struggle with<br />
inadequate staffi ng, technical skills, or fi nancial resources. Th is is further complicated<br />
in many places by the lack of legal tenure, which means that governments<br />
are reluctant or unable to invest in services in informal areas.<br />
In all four of the cities studied, the institutional arrangements for urban planning,<br />
<strong>climate</strong> <strong>change</strong>, <strong>disaster</strong> <strong>risk</strong>, and poverty are fairly complex. Jakarta’s city<br />
government is highly decentralized, with 267 lurah or urban ward leaders. 4 Th e<br />
Mexico City Metropolitan Area comprises the 16 boroughs of Mexico City and<br />
34 municipalities of the State of Mexico, for a total of 50 geopolitical and administrative<br />
units that must coordinate among themselves. In the São Paulo Metropolitan<br />
Area there are 39 municipalities, while the City of São Paulo is divided<br />
into 31 administrative divisions (subprefectures) and 96 districts. Dar es Salaam<br />
probably has the simplest structure, in part refl ecting the smaller size. Th e city is<br />
managed by the Dar es Salaam City Council (DCC) and the Municipal Councils<br />
of Temeke, Kinondoni, and Ilala, which are under the Ministry of Regional<br />
Administration and Local Government. Each municipality has individual technical<br />
and administrative departments. Coordination across municipalities and<br />
with national agencies is limited.<br />
Other cities have areas that lack strong formal institutions, where informal<br />
institutions such as NGOs and CBOs play an important role in responding to the<br />
needs of the urban poor. In many cities these informal institutions address gaps in
BUILDING RESILIENCE FOR THE URBAN POOR ■ 87<br />
service delivery, and at times are the fi rst responders in <strong>disaster</strong> events. In Mombasa,<br />
local religious organizations are recognized as key players when extreme<br />
events occur and facilitate evacuation, emergency relief assistance, and provisional<br />
shelter. Th e earthquake in Haiti in 2010 saw the emergence of volunteer<br />
technology communities, who mobilized through the Global Earth Observation<br />
Catastrophe Assessment Network (GEO-CAN) to develop a comprehensive and<br />
rigorous damage analysis to assist with relief and recovery eff orts (GFDRR 2011).<br />
Learning from Successful Examples<br />
Th ere are numerous examples where progress has been made in addressing<br />
<strong>risk</strong>s for the poor through programs to upgrade slums, improvements to service<br />
delivery in slums, emergency warning systems, knowledge generation, and other<br />
initiatives. Such eff orts were implemented with strong political commitment,<br />
community participation, and institutional support.<br />
In Dar es Salaam, the local government has successfully implemented the<br />
Community Infrastructure Upgrading Program, which has targeted unplanned<br />
areas in three municipalities (<strong>World</strong> Bank 2011b). Th rough a structured process,<br />
communities have prioritized technical improvements in roads, drains, and<br />
public toilets. Th e new community infrastructure allows safe access to homes on<br />
a regular and emergency basis, and improved drainage dramatically decreases<br />
fl ooding in the aff ected areas.<br />
A relatively well-known eff ort in Pakistan, through the Orangi Pilot Project<br />
Research and Training Institute, supports local governments as well as slum<br />
dwellers in building capacity for the planning, implementation, and fi nancing of<br />
basic sanitation—at far lower costs than government-built infrastructure. Th ese<br />
eff orts have brought major benefi ts to large sections of the urban poor in more<br />
than 300 communities in Karachi.<br />
In São Paulo, the “Summer Rainfall Operation” is a city plan that brings<br />
together the Housing, Transport, Urban Infrastructure, Social Assistance, and<br />
Sub-districts Coordination Secretariats led by the Emergency Management<br />
Agency, which targets <strong>risk</strong> areas during the summer when heavy rainfall is common.<br />
When heavy rainfall approaches, the Emergency Management Agency<br />
issues an alarm to the various agencies, which respond through prevention<br />
(evacuating residents in high-<strong>risk</strong> areas), search and rescue in fl ood or landslide<br />
zones, and restoration of aff ected areas. Water and sanitation authorities repair<br />
water pipes, while social assistants verify housing conditions and if necessary<br />
direct people to temporary shelters while the Housing Secretariat arranges for<br />
“rent allowance” or allocates housing for the needy. Health authorities disseminate<br />
public information on how to avoid endemic diseases spread by water and of<br />
symptoms requiring medical attention.
88 ■ CLIMATE CHANGE, DISASTER RISK, AND THE URBAN POOR<br />
Mexico City has been proactive in initiating <strong>climate</strong>-<strong>change</strong> programs and is<br />
the fi rst in Latin America to launch a local <strong>climate</strong>-<strong>change</strong> strategy. Furthermore,<br />
the city has established the distinguished Virtual Center on Climate Change for<br />
Mexico City to contribute to increased and improved knowledge on the impact<br />
of <strong>climate</strong> <strong>change</strong> in the Metropolitan Area, as well as to the formulation and<br />
implementation of public policies.<br />
A number of institutions have developed approaches to monitor <strong>change</strong>s and<br />
disseminate information about <strong>change</strong>s in weather patterns and the natural environment<br />
as part of ongoing <strong>risk</strong> assessment. Th ese measures oft en are established<br />
through monitoring stations sponsored by national governments. Early-warning<br />
systems are critical to ensuring awareness of natural hazards and to promoting<br />
timely response, including evacuation. Several approaches have been used,<br />
involving the urban poor in the Caribbean, Africa, and Southeast Asia, such as<br />
local courses, tone alert radio, emergency alert system, presentations and briefings,<br />
and reverse 911 (Pulwarty 2007; Van Aalst, Cannon, and Burton 2008).<br />
Low-tech measures such as brochures, public service announcements, and<br />
direct contact with local residents also are important to fostering awareness and<br />
response in poor communities (National Research Council 2007). For example,<br />
heat-warning systems used to alert urban populations of extreme heat generally<br />
include a communications component that depends on public service announcements<br />
in urban areas (Health Canada 2010).<br />
Safety nets can be critical in building resilience for the urban poor, as well as in<br />
post-<strong>disaster</strong> recovery. Safety nets have traditionally focused on the chronic poor<br />
through targeted cash transfers (both conditional and unconditional), workfare<br />
programs, and in-kind transfers. In Bangladesh, under the National Disaster<br />
Management Prevention Strategy, an early-warning system triggered safety nets<br />
in response to Cyclone Sidr in 2007 (Pelham, Clay, and Braunholz 2011). Th e<br />
program began distributing cash, rice, and house-building grants even before the<br />
main impacts of the cyclone were felt.<br />
Programs can be designed to also assist at-<strong>risk</strong> households and communities<br />
to help people cope with hazards. For example, social funds, community-driven<br />
development, and slum upgrading can be designed to support adaptation and<br />
<strong>risk</strong> reduction in low-income communities by scaling up their work on actions<br />
most relevant for creating resilience, such as improving drainage, water supply,<br />
and sanitation, and setting up community-maintenance programs. Indonesia’s<br />
National Community Empowerment Program (PNPM), which operates in all<br />
urban areas of the country, fi nances investments in fl ood prevention, water retention<br />
and storage, and slope stabilization to prevent landslides as well as building<br />
emergency evacuation routes.<br />
Such programs have been instrumental in post-<strong>disaster</strong> recovery as well. In<br />
Indonesia, eff orts were rapidly mobilized following the <strong>disaster</strong>s in Aceh (2004
BUILDING RESILIENCE FOR THE URBAN POOR ■ 89<br />
tsunami), Yogyakarta, and Central Java (2006 earthquake), and most recently in<br />
Central Java (2010 Mt. Merapi eruption), via community-driven development.<br />
On the very day the government says it is safe for residents to return to their<br />
neighborhoods, trained facilitators already working in the communities are available<br />
to work with benefi ciaries in identifying needs, preparing community settlement<br />
plans, and allocating block grants. Th e key is to have programs in place<br />
before the onset of natural <strong>disaster</strong>s, with fl exible targeting, fl exible fi nancing,<br />
and fl exible implementation arrangements.<br />
At the institutional level, success translates to good leadership, good governance,<br />
and good management. Th ese elements can be built through <strong>change</strong>s in<br />
incentives to promote reform and improve performance, for example, through<br />
better accountability, fi nancial management, and coordination across agencies,<br />
with structured rewards. Other methods that have proven successful are professional<br />
certifi cation programs for municipal staff that elevate, professionalize, and<br />
promote their development.<br />
Capacity Building<br />
Several programs are available to provide advice to decision makers such as city<br />
technicians and city managers, as well as key actors in civil society, on topics<br />
related to sustainable development, <strong>climate</strong> <strong>change</strong>, <strong>disaster</strong> <strong>risk</strong>, and reduction<br />
of urban poverty. Th ese programs range in levels of engagement and development,<br />
but all have the common goal of building capacity among decision makers<br />
at the city level.<br />
Universities and research centers equally provide an important vehicle for<br />
building capacity in developing countries through training future policy makers<br />
and practitioners, and through targeted executive training programs. Accordingly,<br />
it is useful for such institutions to partner with international researchers to<br />
ensure the transfer of current knowledge, approaches, and technologies.<br />
Also, much capacity building can happen as cities learn from each other. Successful<br />
experiences include city and local government networks at the country,<br />
regional, and international level, training programs, and knowledge ex<strong>change</strong><br />
through twinning and other programs that allow cities to share knowledge and<br />
information.<br />
Bridging Communities and Local Governments to<br />
Work Together on Local Solutions<br />
Th e urban poor are clearly on the front line in addressing the impacts of <strong>climate</strong><br />
<strong>change</strong> and <strong>disaster</strong> <strong>risk</strong>. Much is already happening at the household and
90 ■ CLIMATE CHANGE, DISASTER RISK, AND THE URBAN POOR<br />
TABLE 3.3<br />
Capacity Programs Aimed at <strong>Knowledge</strong> Sharing, Education, and Training<br />
for Urban Resilience<br />
Agency/program Capacity building<br />
African Centre for Cities (ACC) Interdisciplinary research and teaching program<br />
for sustainable urbanization in Africa<br />
C-40 Establishing activity-specifi c subcommittees,<br />
which include city resilience planning and focus<br />
on unique needs of port cities<br />
International City/County Management<br />
Administration (ICMA)<br />
International Institute for Environment<br />
and Development (IIED)—capacity<br />
strengthening of least developing<br />
countries for adaptation to <strong>climate</strong><br />
<strong>change</strong> network<br />
International Strategy for Disaster<br />
Reduction (ISDR)—My City Is Getting<br />
Ready Campaign<br />
International Organization for<br />
Standardization<br />
Local governments for sustainability<br />
(ICLEI)<br />
Provides knowledge-based assistance in <strong>disaster</strong><br />
mitigation and preparedness for vulnerable communities,<br />
and recovery and restoration of basic<br />
municipal services<br />
Experts work to strengthen organizations through<br />
publications and capacity-building workshops,<br />
mostly in Africa and South Asia, and active support<br />
for Conference of the Parties (COP) negotiations<br />
Focuses on raising political commitment to <strong>disaster</strong><br />
<strong>risk</strong> reduction and <strong>climate</strong> <strong>change</strong> adaptation<br />
among local governments, including high-profi le<br />
media and public-awareness activities, and develops<br />
technical tools for capacity building<br />
Development of ISO 31000—principles and<br />
guidelines for <strong>risk</strong> management<br />
Works with cities globally to conduct <strong>climate</strong> resiliency<br />
studies and develop adaptation plans<br />
Rockefeller Foundation Asian Cities Climate Change Resilience Network<br />
(ACCRN) helps cities to develop adaptation plans<br />
with civil society (10 cities in Vietnam, Indonesia,<br />
and Thailand)<br />
United Cities and Local Governments/<br />
Metropolis<br />
<strong>World</strong> Bank Group<br />
Urbanization <strong>Knowledge</strong> Partnership<br />
(UKP) and Green Growth <strong>Knowledge</strong><br />
Platform<br />
<strong>World</strong> Bank Institute<br />
Source: Author.<br />
UCLG represents and defends interests of local<br />
governments on world stage. In area of cities<br />
and <strong>climate</strong> <strong>change</strong>, Metropolis is working on<br />
range of projects and knowledge products<br />
New platforms that include provisions for peer-topeer<br />
ex<strong>change</strong> and knowledge sharing<br />
Global capacity-building programs include:<br />
E-Learning Safe and Resilient Cities Course,<br />
Cities and Climate Change<br />
Networking<br />
Mentoring<br />
On-Demand <strong>Knowledge</strong> and Capacity Building
BUILDING RESILIENCE FOR THE URBAN POOR ■ 91<br />
community levels that local governments can draw upon (<strong>World</strong> Bank 2010a).<br />
Such actions include repairing roofs, building stronger foundations, digging<br />
trenches, clearing drainage and ditches, repairing leaks, channeling water, and<br />
planting trees. Th ese eff orts are especially important for cities that have limited<br />
capacity and resources.<br />
At the same time, much of what is needed to reduce <strong>risk</strong> in low-income urban<br />
communities depends on the availability of infrastructure that residents cannot<br />
provide themselves. Storm and surface drainage, road and path networks, links to<br />
water networks, and health-care services require specialized skills and substantial<br />
resources that communities may not have.<br />
Despite the obvious benefi ts of partnerships between local governments and<br />
communities, this does not always happen, in part due to negative perceptions<br />
particularly around policies related to informal settlements. Th ere are, however,<br />
good examples of partnerships between community organizations and local governments<br />
in working in poor urban communities on <strong>risk</strong> reduction. An important<br />
component of these partnerships is good communication.<br />
In the Philippines, a partnership between a grass-roots organization, the<br />
Philippines Homeless People’s Federation (PHPF), and local governments has<br />
worked to secure land tenure, build or improve homes, and increasingly to<br />
design and implement strategies to reduce <strong>risk</strong> (PHPF 2010). Following the devastation<br />
caused by Typhoon Frank in 2008, the local government in the city of<br />
Iloilo worked closely with PHPF in technical working groups, mapping of high<strong>risk</strong><br />
areas, and identifi cation and prioritization of communities to be given post<strong>disaster</strong><br />
assistance.<br />
In one of the oldest and largest slums in Jakarta, Kampung Melayu, residents<br />
have responded to an increase in the severity and frequency of fl ooding by developing<br />
an early-warning fl ood system. Neighborhood and village heads receive<br />
SMS messages on their mobile phones from fl ood-gate areas upriver when the<br />
water level is getting high. Th ey can then spread the news in the community by<br />
broadcasting from the minaret of the local mosque, so that residents can prepare<br />
for the coming inundation (see box 3.2).<br />
One of the more complex but impressive examples is in Quelimane City,<br />
Mozambique, where local communities have partnered with the City Council<br />
and several international organizations to work on upgrading communities<br />
particularly aff ected by cyclical fl oods (City Council of Quelimane 2006; Cities<br />
Alliance 2008; Grimard 2006–2008). Th e city and community worked together<br />
on developing an upgrading strategy that had a special focus on water and sanitation<br />
conditions. In implementing the strategy, the City Council provided an<br />
in-kind contribution of US$100,000 by providing offi ce space, equipment, a<br />
meeting room, technical and administrative staff , and vehicles. Th e community<br />
provided an in-kind contribution of US$150,000 by providing subsidized labor,
92 ■ CLIMATE CHANGE, DISASTER RISK, AND THE URBAN POOR<br />
conducting awareness campaigns, forming operational management teams, and<br />
reducing their plot size, or, in extreme cases, moving to another area because of<br />
improvement works. UN-HABITAT, the <strong>World</strong> Bank, the Danish International<br />
Development Agency (DANIDA), UNICEF, and WaterAid together contributed<br />
US$440,000 in cash and in-kind. Other in-kind contributions totaling US$30,000<br />
were secured from a state water-supply institution, and from a private-sector fi rm<br />
that made its trucks available during weekends in ex<strong>change</strong> for paying only for<br />
fuel and the driver.<br />
Community-based resources are integral to providing health services to the<br />
urban poor, which are important for prevention and environmental health interventions<br />
to ensure a safe and clean environment for residents and to prevent the<br />
outbreak of disease. For example, “preventive advocacy,” an approach through<br />
which at-<strong>risk</strong> groups promote prevention-based messages within their communities<br />
and social networks, has been eff ective in decreasing <strong>risk</strong> for communicable<br />
disease (Weibel 1988). Local opinion leaders, or informal leaders who are<br />
well-connected and well-regarded in a neighborhood, oft en are able to eff ectively<br />
diff use ideas and information more eff ectively than other interventions (Valente<br />
and Davis 1999). Local community groups and partnerships also play integral<br />
roles in monitoring and advocating for public health services.<br />
With regard to environmental health interventions, some local communities<br />
use low-tech methods of monitoring pollution in order to inform policy makers<br />
of toxic releases or establish cooperative agreements with industrial facilities<br />
(O’Rourke 2002). NGOs such as Global Community Monitor train communities,<br />
particularly those that are disempowered and situated next to polluting facilities,<br />
to understand the impacts of pollution on their health and train them to monitor<br />
and document soil and air quality. Others both work with and advocate on behalf<br />
of these communities at the local and national levels, while still others use their<br />
international position and ties to provide support through advocacy and media<br />
campaigns.<br />
Among the lessons learned from experience of partnerships between communities<br />
and local governments are that such cooperation can be facilitated through<br />
mutually recognizing the role that each group plays; improving the dialogue to<br />
dispel misunderstandings; and understanding and recognizing what is happening<br />
at the local level and forming partnerships with local organizations.<br />
For the poor, understanding what the city can and cannot provide and<br />
what its constraints are is a fi rst step. Strong community groups and detailed<br />
community-level information systems can be extremely eff ective for initiating<br />
engagement in such partnerships. For local governments, this means recognizing<br />
the contribution that the urban poor make to a city’s economy and society<br />
and involving them in discussions about needs and priorities. Local participation<br />
is crucial to ensure that the approach taken suits the needs of residents,
BOX 3.6<br />
BUILDING RESILIENCE FOR THE URBAN POOR ■ 93<br />
Locally Organized Early-Warning System in Kampung<br />
Melayu in Jakarta<br />
Kampung Melayu is one of the largest and oldest kampungs (villages) in Jakarta.<br />
It is situated along the banks of the Ciliwung River, which has been fl ooding<br />
with increasing intensity over the past 10 years, according to residents. The<br />
community is made up of a mix of formal and informal settlements. Some<br />
areas, notably those further from the riverbanks, comprise formal housing, while<br />
others, particularly the areas closer to the river, are less formal, characterized<br />
by more tenuous housing construction. Due to the increasing severity of the<br />
fl ooding, sometimes up to 4 meters of water, as often as ten times per month,<br />
people have adapted by moving to the second fl oor of their homes, leaving the<br />
bottom levels empty, and using the space for cottage industries and cooking<br />
only when it is dry. An early-warning fl ood system has been established in the<br />
(continued next page)
94 ■ CLIMATE CHANGE, DISASTER RISK, AND THE URBAN POOR<br />
BOX 3.6 continued<br />
community: the Rukun Warga and Rukun Tetangga (neighborhood and village<br />
heads) receive mobile-phone SMS messages from fl ood-gate areas upriver in<br />
Depok when the water level is getting high. They can then spread the news in<br />
the kampung, usually by broadcasting from the minaret of the local mosque,<br />
so residents can prepare for the coming inundation. This is a powerful, locally<br />
organized example of how residents in communities are connecting through<br />
their own means to more sophisticated and established water- management<br />
technology at the regional level.<br />
Source: <strong>World</strong> Bank (2011a).<br />
and in ensuring quality standards. Many of the examples of local government-<br />
community organization partnerships in Africa and Asia have been initiated by<br />
federations of slum dwellers who are engaged in initiatives to upgrade slums,<br />
secure land tenure, develop new housing that low-income households can<br />
aff ord, and improve provision of infrastructure and services.<br />
Notes<br />
1. Th is is drawn from Livengood (2001) and from fi eld visits to Cuttack by David Satterthwaite<br />
in June and October 2010.<br />
2. Th e body is called Badan Penanggulangan Bencana Daerah (BPBD) (<strong>World</strong> Bank<br />
2011a).<br />
3. http://english.sisul.or.kr/grobal/cheonggye/eng/WebContent/index.html.<br />
4. A lurah is the urban ward leader under the mayor of the city; there are more than<br />
70,000 in Indonesia.<br />
References<br />
Allard, Pablo, and Jose Rojas. 2010. Th e Aguada Flood-Park: Recovering a Post-Industrial<br />
Urban Stream in Santiago de Chile. http://www.holcimfoundation.org/Portals/1/docs/<br />
F07/WK-Grn/F07-WK-Grn-.<br />
Bigio, Anthony and Stephane Hallegatte. 2011. “Planning Policy, Synergies and Tradeoff s for<br />
Urban Risk Management, Climate Change Adaptation and Poverty Reduction,” Mimeo.<br />
Birkmann, Jörn, Matthias Garschagen, Frauke Kraas, and Nguyen Quang. 2010. “Adaptive<br />
Urban Governance: New Challenges for the Second Generation of Urban Adaptation<br />
Strategies to Climate Change.” Sustainability Science 5: 185–206.
BUILDING RESILIENCE FOR THE URBAN POOR ■ 95<br />
Carmin, JoAnn. 2010. “Variations in Urban Climate Adaptation Planning: Implications<br />
for Action.” Paper presented at the International Climate Change Adaptation Conference,<br />
Gold Coast, Australia.<br />
Carmin, JoAnn, Sabrina McCormick, Sai Balakrishnan, and Eric Chu. 2011. Institutions<br />
and Governance in a Changing Climate: Implications for Service Provision for the<br />
Urban Poor, processed.<br />
Cities Alliance. 2008. Comments on Progress Report, Improving Water and Sanitation in<br />
Quelimane City. P101077.<br />
City Council of Quelimane. 2006. Improving Water and Sanitation in Quelimane City,<br />
Mozambique.<br />
City of Quito. 2010. “Estrategia Quiteña ante el cambio climatico.” Dirreccion metropolitana<br />
ambiental. Quito, Municipio del Districto Metropolitano de Quito. http://www<br />
.quitoambiente.gov.ec.<br />
Coff ee, Joyce E., Julia Parzen, Mark Wagstaff , and Richard S. Lewis. 2010. “Preparing for a<br />
Changing Climate: Th e Chicago Climate Action Plan’s Adaptation Strategy.” Journal of<br />
Great Lakes Research 36: 115–117.<br />
Dickson, Eric, Judy Baker, and Dan Hoornweg. 2012. Urban Risk Assessments: An Approach<br />
for Understanding Disaster and Climate Risk in Cities. Washington, DC: <strong>World</strong> Bank.<br />
Gill, S.E., J.F. Handley, A.R. Ennos, and S. Pauleit. 2007. “Adapting Cities for Climate<br />
Change: Th e Role of Green Infrastructure.” Built Environment 33 (1).<br />
Global Facility for Disaster Reduction and Recovery (GFDRR). 2011. Volunteer Technology<br />
Communities: <strong>Open</strong> Development. GFDRR: Washington DC.<br />
Greater London Authority. 2010. Th e London Climate Change Adaptation Strategy, Draft<br />
Report. London: Greater London Authority. http://www.london.gov.uk/<strong>climate</strong><strong>change</strong>/<br />
strategy.<br />
Grimard, Alain. 2006–2008. Grant Progress Report, Improving Water and Sanitation in<br />
Quelimane City. P101077.<br />
Groves, D.G., and R.J. Lempert. 2007. “A New Analytic Method for Finding Policy-<br />
Relevant Scenarios.” Global Environmental Change 17: 73–85.<br />
Groves, D.G., D. Knopman, R. Lempert, S. Berry, and L. Wainfan. 2007. Presenting Uncertainty<br />
About Climate Change to Water Resource Managers—Summary of Workshops<br />
with the Inland Empire Utilities Agency. RAND: Santa Monica, CA.<br />
Halifax Regional Municipality (HRM). 2007a. Climate Change Risk Management Strategy<br />
for HRM. HRM: Halifax. http://www.halifax.ca/<strong>climate</strong>/.<br />
———. 2007b. HRM Climate Smart: Climate Change: Developer’s Risk Management Guide.<br />
HRM: Halifax. http://www.halifax.ca/<strong>climate</strong>/documents/DevelopersGuidetoRisk<br />
Managment.pdf.<br />
Hallegatte, S. 2009. “Strategies to Adapt to an Uncertain Climate Change.” Global Environmental<br />
Change 19: 240–247.<br />
Health Canada. 2010. “Communicating the Health Risks of Extreme Heat Events: Toolkit<br />
for Public Health and Emergency Management Offi cials.” Canada.<br />
Katich, Kristina. 2011. Beyond Assessment, A Review of Global Best Practices Addressing<br />
Climate Change and Disaster Management for the Urban Poor, processed.<br />
Lempert, R.J., and M.T. Collins. 2007. “Managing the Risk of Uncertain Th resholds<br />
Responses: Comparison of Robust, Optimum, and Precautionary Approaches.” Risk<br />
Analysis 27: 1009–1026.
96 ■ CLIMATE CHANGE, DISASTER RISK, AND THE URBAN POOR<br />
Lempert, R.J., D.G. Groves, S.W. Popper, and S.C. Bankes. 2006. “A General, Analytic<br />
Method for Generating Robust Strategies and Narrative Scenarios.” Management Science<br />
52 (4): 514–528.<br />
Lempert, Robert J., and Nidhi Kalra. 2011. “Managing Climate Risks in Developing Countries<br />
with Robust Decision Making.” In <strong>World</strong> Resources Report, Washington, DC:<br />
<strong>World</strong> Resources Institute.<br />
Livengood, Avery. 2011. “Enabling Participatory Planning with GIS: A Case Study of Settlement<br />
Mapping in Cuttack, India.” Environment and Urbanization 23 (2).<br />
Martin-Vide, J.P. 2001. “Restoration of an Urban River in Barcelona, Spain.” Environmental<br />
Engineering and Policy 2: 113–119.<br />
Metropolitan Municipality of Istanbul Planning and Construction Directoriat<br />
Geotechnical and Earthquake Investigation Department. 2003. Earthquake Masterplan<br />
for Istanbul. http://www.ibb.gov.tr/en-US/SubSites/IstanbulEarthquake/Pages/<br />
IstanbulEarthquakeMasterPlan.aspx.<br />
Milly, P.C.D., J. Betancourt, M. Falkenmark, R.M. Hirsch, Z.W. Kundzewicz, D.P. Lettenmaier,<br />
and R.J. Stouff er. 2008. “Climate Change: Stationarity Is Dead: Whither Water<br />
Management?” Science 319 (5863): 573.<br />
National Research Council. 2007. Tools and Methods for Estimating Populations at Risk<br />
from Natural Disasters and Complex Humanitarian Crises. Washington, DC: National<br />
Academies Press.<br />
New York City Panel on Climate Change (NYCPCC). 2010. Climate Change Adaptation<br />
in New York City: Building a Risk Management Response. Ed. C. Rosenzweig and<br />
W. Solecki. Annals of the New York Academy of Sciences, Vol. 1196. Wiley-Blackwell.<br />
Nicholls, R.J., et al. 2007. Ranking Port Cities with High Exposure and Vulnerability to Climate<br />
Change: Exposure Estimates. Environment Working Paper 1. OECD.<br />
O’Rourke, Dara. 2002. “Community-Driven Regulation: Toward an Improved Model of<br />
Environmental Regulation in Vietnam.” In Livable Cities: Urban Struggles for Livelihood<br />
and Sustainability. Ed. Peter Evans. Berkeley: University of California Press.<br />
Parzen, Julia. 2009. Lessons Learned: Creating the Chicago Climate Action Plan. Chicago:<br />
City of Chicago.<br />
Pelham, L., E. Clay, and T. Braunholz. 2011. “Natural Disasters, What Is the Role of Safety<br />
Nets?” Social Protection Discussion Paper, <strong>World</strong> Bank, Washington, D.C.<br />
Philippines Homeless People’s Federations (PHPF). 2010. “Addressing Vulnerabilities<br />
through Support Mechanisms: HPFPI’s Ground Experience in Enabling the Poor to<br />
Implement Community-rooted Interventions on Disaster Response and Risk Reduction.”<br />
Background paper prepared for the 2011 Global Assessment Report on Disaster<br />
Risk Reduction.<br />
Pulwarty, Roger. 2007. “Communicating Agroclimatological Information, Including<br />
Forecasts for Agricultural Decision.” In Guide to Agrometeorological Practices. <strong>World</strong><br />
Meterological Organization.<br />
Satterthwaite, David. 2011. How Local Governments Work with Communities in the<br />
Delivery of Basic Services, processed.<br />
Schwartz, P. 1996. Th e Art of the Long View. New York: Double Day.<br />
Shah, Fatima, and Federica Ranghieri, 2012. A Workbook for Urban Resilience in the<br />
Face of Disasters, Adapting Experiences from Vietnam’s Cities to other Cities <strong>World</strong><br />
Bank, Washington, DC.
BUILDING RESILIENCE FOR THE URBAN POOR ■ 97<br />
Toronto Environmental Offi ce. 2008. Ahead of the Storm: Preparing Toronto for Climate<br />
Change. Toronto. http://www.toronto.ca/teo/pdf/ahead_of_the_storm.pdf.<br />
Valente, Th omas W., and Rebecca L. Davis. 1999. “Accelerating the Diff usion of Innovations<br />
Using Opinion Leaders.” Annals of the American Academy of Political and Social<br />
Science 566: 55–67.<br />
Van Aalst, Maarten K., Terry Cannon, and Ian Burton. 2008. “Community Level Adaptation<br />
to Climate Change: Th e Potential Role of Participatory Community Risk Assessment.”<br />
Global Environmental Change: Human and Policy Dimensions 1(18): 165–179.<br />
Weibel, W. Wayne. 1988. Combining Ethnographic and Epidemiologic Methods in Targeted<br />
AIDS Interventions: Th e Chicago Model. Rockville, MD: National Institute on Drug<br />
Abuse.<br />
<strong>World</strong> Bank. 2006. Morocco, Poverty and Social Impact Analysis of the National Slum<br />
Upgrading Program. Washington, DC: <strong>World</strong> Bank.<br />
———. 2010a. Pro-Poor Adaptation to Climate <strong>change</strong> in Urban Centers: Case Studies of<br />
Vulnerability and Resilience in Kenya and Nicaragua. <strong>World</strong> Bank: Washington, DC.<br />
———. 2011a. Jakarta: Urban Challenges in a Changing Climate. Jakarta: <strong>World</strong> Bank.<br />
———. 2011b, Urban Poverty & Climate Change in Dar es Salaam, Tanzania; A Case Study,<br />
processed.<br />
Yu, Carlyne Z., and Edsel E. Sajor. 2008. Urban River Rehabilitation: A Case Study in<br />
Marikina City, Philippines. http://www.wepa-db.net/pdf/0810forum/paper35.pdf.
4<br />
<strong>Open</strong>ing New Finance Opportunities<br />
for Cities to Address Pro-poor<br />
Adaptation and Risk Reduction<br />
Key Messages<br />
Adaptation and <strong>risk</strong> reduction costs include physical investments, such as<br />
urban infrastructure and basic services in slum areas, as well as investments<br />
in information systems, safety nets, and capacity building.<br />
There is no common established method for estimating the costs of adaptation<br />
in a broadly comparable, standardized manner at the city level.<br />
The available <strong>climate</strong> funds are modest compared with the needs of developing<br />
countries; therefore these funds are mainly catalytic.<br />
A combination of public and private resources is needed in order to fi nance<br />
investments that contribute to building resilience for the poor.<br />
Th e analysis of the <strong>risk</strong>s for the urban poor associated with <strong>climate</strong> <strong>change</strong> and<br />
natural hazards point to signifi cant fi nancing needs for cities. Th e costs of adaptation<br />
and <strong>risk</strong> reduction include physical investments, such as urban infrastructure<br />
and basic services in slum areas, but equally important are investments in<br />
good information systems and tools for integrating <strong>climate</strong> <strong>change</strong> and <strong>disaster</strong><strong>risk</strong><br />
management into urban planning, safety nets, and capacity building to help<br />
local governments better deliver services and manage <strong>risk</strong> for their residents.<br />
■ 99
100 ■ CLIMATE CHANGE, DISASTER RISK, AND THE URBAN POOR<br />
Existing approaches to fi nancing investments that contribute to building resilience<br />
are reviewed in this chapter, with an aim to identify potential opportunities<br />
for scaling up such investments. While many of the current instruments are not<br />
explicitly designed for adaptation, <strong>risk</strong> reduction, or to be pro-poor, with some<br />
program modifi cations, resources can be directed to address the growing needs<br />
in this intersection of <strong>climate</strong> <strong>change</strong>, <strong>disaster</strong> <strong>risk</strong>, and the urban poor.<br />
Costing Adaptation and Risk Reduction<br />
When reviewing potential fi nancing needs for <strong>climate</strong> adaptation and <strong>disaster</strong><br />
<strong>risk</strong> reduction in cities, it is important to consider that not all investments are<br />
necessarily high and some can have more direct impacts on the poor than others.<br />
Large-scale city-wide infrastructure investments such as seawalls, embankments,<br />
or levees for fl ood protection, or measures to make roads, ports, and powergeneration<br />
facilities more resilient to extreme events, may be necessary in many<br />
cities over time, but they are expensive and will not improve conditions for those<br />
living with the current impacts of the more frequent less extreme events.<br />
Smaller-scale investments in drainage and improvements in basic infrastructure<br />
need not be expensive, and are catalytic in building resilience for the urban<br />
poor. Programs to upgrade slums take a neighborhood approach and, in addition<br />
to local infrastructure improvements, oft en include social programs aimed at<br />
community development. Such programs are most eff ective when coupled with<br />
policies that tackle diffi cult issues related to land.<br />
At the city level, there is as yet no common established method for estimating<br />
the costs of adaptation in a broadly comparable, standardized manner. Estimating<br />
the costs of adaptation is particularly diffi cult, for several reasons. Adaptation<br />
strategies rely on what scenario is chosen (for example, the rate of <strong>climate</strong><br />
<strong>change</strong>), the valuation approach and indirect costs, temporal variation dependent<br />
on the discount rate, and uncertainty—all dependent on a specifi c location<br />
(European Environment Agency 2007).<br />
One approach used is to assess the cost of potential damages, and then<br />
accordingly estimate costs of prevention. Th e recent study on Climate Risks and<br />
Adaptation in Asian Coastal Megacities: A Synthesis Report (<strong>World</strong> Bank 2010b)<br />
estimates that the costs from major fl ooding in Bangkok, Ho Chi Minh City, and<br />
Manila are expected to run into billions of dollars over the next few decades,<br />
putting the estimated costs of the additional damage from <strong>climate</strong> <strong>change</strong> in the<br />
range of 2 percent to 6 percent of regional gross domestic product (GDP).<br />
Another example of a subnational cost estimate is the adaptation cost<br />
curve for Florida (see fi gure 4.1), which disaggregates adaptation measures<br />
and helps in prioritization. Activities below the cost-eff ective line in light gray
Figure 4.1 Adaptation Cost Curve: Florida Test Case<br />
Cost/benefit ratio<br />
11<br />
10<br />
9<br />
8<br />
7<br />
6<br />
5<br />
4<br />
3<br />
2<br />
1<br />
0<br />
0<br />
Beach<br />
Nourishment<br />
(50 ft)<br />
Beach<br />
Nourishment<br />
(100 ft)<br />
Measures below<br />
this line have net<br />
economic benefits<br />
Note: Calculated in 2008 dollars for the moderate <strong>climate</strong> scenario<br />
Measures with net<br />
negative benefits<br />
Measures with net<br />
positive benefits<br />
0 0 0 0 0<br />
0.9 1.0<br />
0.3 0.7 0.8 1.0 1.0<br />
1.1<br />
0 0.1 0.1<br />
3.0<br />
2.6<br />
1.51.5 1.8 2.1<br />
1.3 1.5 1.5<br />
Averted loss<br />
$b<br />
1 2 3<br />
Roof cover,<br />
new<br />
Roof truss,<br />
new<br />
4 5 6 7 8 9<br />
Levee & Floodwall<br />
Sandbags<br />
<strong>Open</strong>ing<br />
protection, new Roof shape<br />
new<br />
Roof deck<br />
Temp.<br />
attachment, new floodwalls<br />
Vegetation<br />
Mgmt<br />
Elevation –<br />
new homes<br />
10 11<br />
Roof<br />
cover,<br />
retrofit<br />
Targeting<br />
hardening,<br />
dist.<br />
Roof truss,<br />
retrofit<br />
Substation<br />
Backup<br />
generators<br />
Local<br />
levees<br />
12 13 14 15 16 17 18 19<br />
Masonry,<br />
Elevation, retrofit<br />
new<br />
Replacement under –<br />
<strong>Open</strong>ing<br />
protection,<br />
grounding, trans.<br />
retrofit<br />
Targeted under –<br />
grounding, trans.<br />
Targeted<br />
Top layer <strong>risk</strong> transfer<br />
hardening,<br />
Elevation, prioritized<br />
transmission<br />
retrofit<br />
Deductibles –<br />
Replacement<br />
residential<br />
undergrounding, dist.<br />
Targeted undergrounding,<br />
Deductibles –<br />
distribution<br />
commercial<br />
Road elevation<br />
Engineering based FRT penetration<br />
3.7<br />
0.1 0.1<br />
Source: ECA Working Group (2010).<br />
MODERATE CLIMATE SCENARIO<br />
7.5<br />
6.9<br />
10.3<br />
$30bn<br />
annual<br />
expected<br />
loss<br />
OPENING NEW FINANCE OPPORTUNITIES FOR CITIES ■ 101
102 ■ CLIMATE CHANGE, DISASTER RISK, AND THE URBAN POOR<br />
are cost-eff ective. One consideration not fully refl ected in this approach is the<br />
social aspect or community linkages associated with many adaptation measures.<br />
Adaptation eff orts, such as early-warning systems, preservation and<br />
protection of vulnerable lands, and adherence to land-use plans, generally<br />
require “socialization” for eff ective implementation.<br />
A study on <strong>climate</strong> <strong>change</strong> adaptation and <strong>disaster</strong> preparedness in coastal<br />
cities of North Africa calculates estimated costs for infrastructure works related<br />
to resilience and action plans for Tunis, Tunisia, and Casablanca, Morocco<br />
(<strong>World</strong> Bank 2011). Th e economic effi ciency of investments was then captured<br />
through a benefi t/cost ratio (B/C), comparing discounted values over time to<br />
avoided damages against implementation costs. Figure 4.2 shows a comparison<br />
of B/C for diff erent investments for Tunis and Casablanca. Effi ciency is overall<br />
high in Casablanca, with early-warning systems having the highest benefi ts.<br />
Further estimating the costs of adaptation specifi cally for the urban poor<br />
is similarly diffi cult for many of the same reasons listed above. Costs for slum<br />
improvements are very location specifi c, and even within cities, the unit costs<br />
can vary substantially. However, rough estimates prepared by the UN Millennium<br />
Project (2005) put the average unit cost of slum upgrading at around<br />
US$670 per capita. Th is includes investment in land titling, access to water, sanitation<br />
and sewage treatment, social investments in education and health, and<br />
home improvements. Th is cost is comparable to estimates for a bundle of infrastructure<br />
services to Africa’s medium-size cities, US$663 per capita, and for<br />
Figure 4.2 Benefi t-Cost Ratio by Risk Category for Tunis and Casablanca<br />
14<br />
12<br />
10<br />
8<br />
6<br />
4<br />
2<br />
0<br />
Early warning<br />
system<br />
Coastal<br />
management<br />
Anti-flood<br />
parcel<br />
measures<br />
Tunis Casablanca<br />
Anti-flood<br />
collective<br />
measures*<br />
Anti-seismic<br />
measures<br />
Source: <strong>World</strong> Bank (2011).<br />
*Anti-fl ood collective measures include urban drainage and integrated water-management planning.
OPENING NEW FINANCE OPPORTUNITIES FOR CITIES ■ 103<br />
large cities, a lower cost of US$325 per capita, which refl ects the importance of<br />
density in infrastructure cost (<strong>World</strong> Bank 2010a). Using these averages along<br />
with estimated slum population, one could approximate a back-of-the-envelope<br />
cost for slum improvements for a given city.<br />
Sources of Financing for Adaptation and Risk Reduction<br />
Financing for investments that contribute to building resilience for the poor<br />
should, in theory, be covered by a combination of public and private resources.<br />
Infrastructure investments generate benefi ts for the whole city and thus should<br />
be fi nanced by public funds. Housing, home improvements, and land titling are<br />
considered private goods and thus fi nanced by benefi ciaries.<br />
Cities in developing countries currently rely on national and local tax revenues,<br />
the private sector, public-private partnerships, and loans and concessional<br />
sources through the <strong>World</strong> Bank and other multilateral development banks to<br />
TABLE 4.1<br />
Current Sources of Financing and Instruments for Climate Change,<br />
Disaster Risk, and Slum Improvements<br />
Source of fi nancing Instruments<br />
Government revenues and<br />
expenditures<br />
Multilateral development<br />
banks and donors<br />
Risk-management<br />
instruments<br />
Taxes<br />
Targeted subsidies<br />
Land-based fi nancing<br />
Investment and policy loans<br />
Grants<br />
Insurance<br />
Catastrophe bond platform<br />
(MultiCat)<br />
Partial credit and partial <strong>risk</strong><br />
guarantees<br />
Micro-insurance<br />
Carbon markets Citywide approach<br />
City-based emissions trading<br />
systems<br />
Carbon-linked bonds<br />
Private sector Individual and community savings<br />
funds<br />
Public-Private Partnerships<br />
Microfi nance<br />
Results-based fi nancing<br />
Source: Author.<br />
Pro-poor benefi ts:<br />
direct (D) or indirect (I)<br />
I<br />
D<br />
D<br />
D<br />
D<br />
I<br />
I<br />
I<br />
D<br />
I<br />
I<br />
I<br />
D<br />
D<br />
D<br />
D
104 ■ CLIMATE CHANGE, DISASTER RISK, AND THE URBAN POOR<br />
fi nance infrastructure and social needs. Existing programs provide smaller grants<br />
or technical assistance for projects and programs at the city level. In practice,<br />
such resources are vastly insuffi cient to meet the service needs of the population,<br />
particularly in slums.<br />
In countries that have carried out large eff orts to upgrade slums, most of the<br />
funding has come from central governments through transfers to local government,<br />
and from donors. A typical package is fi nanced by about 40 percent to<br />
50 percent from the central government in the form of grants or loans to subnational<br />
localities, another 40 percent from foreign loans or grants, 5 percent from<br />
localities, up to 10 percent from benefi ciaries and communities, and 3 percent<br />
from cities (<strong>World</strong> Bank, Approaches to Urban Slums, 2008). Local governments<br />
typically contribute with land.<br />
Government Revenues and Expenditures<br />
Revenues raised by governments through taxes, fees, and charges are a basic<br />
means of funding public expenditures, but do face constraints. Governments at<br />
all levels are usually reluctant or unable to increase taxes or reduce existing subsidies,<br />
both measures being politically unpopular. In lower-income settings, and<br />
where the formal economy is small, revenue raising can be diffi cult or limited. In<br />
decentralized countries, with increased functions and responsibilities for local<br />
governments, greater revenue-raising authority should be given commensurately<br />
to local governments. In the absence of such revenue authority, there would need<br />
to be signifi cant transfers from higher levels of government.<br />
Taxes, fees, and charges can be designed with specifi c policy objectives in<br />
mind and some can be designed with <strong>climate</strong>-related or pro-poor benefi ts,<br />
such as in the urban-land use, buildings, and transportation sectors. Taxes are<br />
a potentially powerful tool, especially property tax. Fees and charges are ideal<br />
for funding local services, where specifi c benefi ciaries, such as the poor, can be<br />
targeted. Fees are particularly eff ective when they recover full costs and when<br />
fees are paid according to individual or household use, as these give residents<br />
incentives for more effi cient use of resources.<br />
Land is the most important asset for generating resources in cities. Landbased<br />
instruments include betterment levies, development land sales, value<br />
capture, sale of development rights, developer exactions, and impact fees. Most<br />
of the land-based instruments generate revenues upfront, reducing the need<br />
for borrowing. Land-based revenues have been used for infrastructure projects<br />
supported by the private sector, such as the metro in São Paulo, and the<br />
installation of public infrastructure in ex<strong>change</strong> for desert land in Cairo. When<br />
such approaches are used for slum areas, they <strong>risk</strong> increasing land values to a<br />
point that becomes unaff ordable for the poor, pricing them out of the market.
OPENING NEW FINANCE OPPORTUNITIES FOR CITIES ■ 105<br />
In Bogota and Porte Alegre, approaches have been designed to ensure that the<br />
increases in land prices generated by government interventions are used to<br />
fi nance the housing program itself (Smolka2008).<br />
Multilateral Development Banks and Donors<br />
Government revenues alone cannot fund all actions related to <strong>climate</strong> and<br />
<strong>disaster</strong> <strong>risk</strong>s, particularly the new or incremental costs associated with <strong>climate</strong><br />
<strong>change</strong>. For this reason, and particularly in developing countries, loans and<br />
sources of concessional fi nance have an important role. From the city perspective,<br />
access to resources at the international level is oft en complicated, not least<br />
because of historical arrangements that primarily targeted national governments.<br />
Relevant fi nancing is available through <strong>climate</strong> <strong>change</strong>, <strong>disaster</strong> <strong>risk</strong>,<br />
and urban development.<br />
Climate Change<br />
Th ere have been proposals for substantial amounts of assistance for adaptation<br />
activities through external assistance, though these funds have been limited and<br />
are not explicitly targeted for cities. Th e available <strong>climate</strong> funds are modest compared<br />
with the needs of developing countries. Annex 1 summarizes sources of<br />
<strong>climate</strong> fi nance and their relevance in the urban context. An example of how<br />
the Clean Technology Fund’s Investment Plan for Th ailand included an urban<br />
transformation component for Bangkok is illustrated in box 4.1. More detailed<br />
information on most of the sources can be obtained from the joint UNDP/<strong>World</strong><br />
Bank Climate Finance Options website. 1 In using such resources, one can design<br />
programs with a focus on the urban poor. For example, in the case of Bangkok,<br />
in developing the bus rapid transport system, priority can be given to ensuring<br />
access and aff ordability for those living in urban slums.<br />
Th e progress achieved to date with <strong>climate</strong> fi nance demonstrates the potential<br />
catalytic role of public fi nance—its ability to leverage both <strong>climate</strong> and<br />
development fi nance for <strong>climate</strong> action. Th is includes the piloting of innovative<br />
approaches that combine resources to maximize synergies, explore new opportunities<br />
to expand the scope for market mechanisms, and strengthen capacity<br />
to facilitate access to and eff ective use of resources (<strong>World</strong> Bank 2010c). Box 4.2<br />
describes the example of Mexico’s Urban Transport Transformation Program,<br />
in which fi nancial resources from diff erent sources were combined to fund the<br />
entire program.<br />
Th e <strong>World</strong> Bank Group off ers various concessional fi nance instruments<br />
that national governments can channel for urban <strong>climate</strong> action, such as the<br />
International Development Association for low-income countries, and budget<br />
support in the form of Development Policy Loans (DPL). Recent <strong>climate</strong>
106 ■ CLIMATE CHANGE, DISASTER RISK, AND THE URBAN POOR<br />
BOX 4.1<br />
Bangkok’s GHG Emissions and the Clean<br />
Technology Fund<br />
The Clean Technology Fund Investment Plan for Thailand was approved in<br />
December 2009 and includes a signifi cant component for “urban transformation”<br />
in Bangkok due to the city’s unique position in the country. Thailand’s<br />
energy con sumption is concentrated in the Bangkok Metropolitan Region and<br />
directly contributes to the city’s GHG emissions.<br />
On average, Bangkok is less dense than other East Asian cities, and its<br />
urban form is currently locked in by its trans portation system. An analysis undertaken<br />
as part of <strong>World</strong> Bank work on the international standard for city GHG<br />
emissions found that, at 10.6 tons of carbon dioxide equivalent, Bangkok’s<br />
residents generate more GHG emis sions per capita than the global average<br />
for city dwellers. Prior to the CTF Investment Plan, the Bangkok Metropolitan<br />
Administration (BMA) had already launched its Action Plan on Global Warming<br />
Mitigation, with a target to reduce the city’s emissions by 15 percent. With the<br />
CTF, Bangkok was thus able to enhance its GHG-mitigation program based on<br />
a credible and verifi able emissions baseline. The CTF is providing $70 million<br />
for urban transformation in Bangkok, to co-fi nance the development of a bus<br />
rapid-transit system for the city. CTF support is also co-fi nancing investments<br />
in energy effi ciency for BMA facilities and public spaces, focus ing on electrical<br />
appliances and air conditioning.<br />
Source: <strong>World</strong> Bank.<br />
<strong>change</strong>-related DPLs include Mexico (with transportation policy actions in<br />
Mexico City), Indonesia (with <strong>climate</strong>-<strong>change</strong> DPLs expected), and Brazil<br />
(with a focus on standalone <strong>climate</strong>-<strong>change</strong> policy in Rio de Janeiro and São<br />
Paulo). Other multilateral development banks and bilateral development agencies<br />
have similar concessional instruments.<br />
Disaster Risk Reduction and Recovery<br />
In funding for <strong>disaster</strong> <strong>risk</strong> reduction and recovery for the urban poor, there is<br />
more experience than with <strong>climate</strong>-adaptation programs for the urban poor. Th e<br />
2010 Haiti earthquake left more than 1.5 million people homeless in a country<br />
with a 70 percent slum prevalence rate (IFRC 2010). With immense funding<br />
needs, governments and international partners pledged more than US$5 billion<br />
to rebuild Haiti soon aft er the earthquake, with many of the costs for urban
BOX 4.2<br />
OPENING NEW FINANCE OPPORTUNITIES FOR CITIES ■ 107<br />
Combining Resources to Maximize Synergies:<br />
Supporting Mexico’s Urban Low-Carbon Transformation<br />
The objective of the Mexico Urban Transport Transformation Program is to<br />
<strong>change</strong> urban transport in Mexican cities to a lower-carbon growth path by<br />
improving its quality and sus tainability and by upgrading related elements of the<br />
urban transport system. The project is ambitious in its design and scope and,<br />
if successful, will have a transformative impact on the urban transport sector in<br />
Mexico. It builds on a <strong>World</strong> Bank loan of $200 million and an additional Clean<br />
Technology Fund concessional loan of $200 million. These resources will be<br />
channeled through the Banco Nacional de Obras, which will then provide the<br />
participating municipali ties with this loan funding. Combined with funding from<br />
the National Trust for Infrastructure, this will make up to $900 million available.<br />
The private sector and the municipalities themselves are expected to<br />
contribute up to $300 million and $150 million, respectively. An estimate of the<br />
potential for carbon revenue payments could run to approximately $50 million<br />
additional funds. Urban areas that complete and propose integrated transport<br />
plans will be eligible for funds.<br />
Source: <strong>World</strong> Bank.<br />
rebuilding in Port-au-Prince. 2 Th e extremity and magnitude of the Haiti earthquake<br />
make it an outlier, with funding not always as easily accessible for post<strong>disaster</strong><br />
urban reconstruction.<br />
Urban Development and Slum Upgrading<br />
Lending for urban development is on the rise at the <strong>World</strong> Bank and other<br />
multilateral development banks, though the amounts are still very low relative<br />
to the need generated in cities by rapid urbanization. Overall lending by the<br />
<strong>World</strong> Bank during the fi scal years 2000–2009 was approximately US$15 billion<br />
(<strong>World</strong> Bank 2010d). Th e proportion of that going to slum upgrading is<br />
approximately 20 percent, or some US$2.8 billion invested during the period<br />
through some 40 projects, with most in Sub-Saharan Africa and Latin America<br />
and the Caribbean.<br />
Finally, there are fi nancing and technical assistance programs designed to provide<br />
catalytic resources for cities, which one way or another relate to building<br />
resilience for the urban poor. Some of those available through the <strong>World</strong> Bank<br />
are listed in table 4.2.
108 ■ CLIMATE CHANGE, DISASTER RISK, AND THE URBAN POOR<br />
TABLE 4.2<br />
Summary of Catalytic Financing and Technical Assistance Programs at<br />
the <strong>World</strong> Bank<br />
Financing program Brief description<br />
Citywide approach to carbon<br />
fi nance<br />
Carbon market development<br />
guarantee<br />
PPIAF Sub-National Technical<br />
Assistance (SNTA) program<br />
Gobal Facility for Disaster<br />
Reduction and Recovery (GFDRR)<br />
Track II Financing for Disaster Risk<br />
Reduction Mainstreaming<br />
Risk-Management Instruments<br />
Enhancing cities’ access to carbon fi nance, by<br />
aggregating emissions reductions from multiple<br />
sectors within a city, to overcome barriers such as<br />
high transaction costs and small volumes.<br />
A proposed guarantee instrument to facilitate<br />
forward contracts between buyers of carbon credits<br />
and cities (as sellers). Buyers will provide upfront<br />
payments for future delivery of carbon credits. The<br />
Bank will provide guarantees to buyers, underpinned<br />
by indemnity agreements with respective<br />
national governments. Provides early cash fl ow to<br />
cities given signifi cant upfront investments needed<br />
to generate carbon credits.<br />
Grants to cities improve their creditworthiness and<br />
access to market-based fi nancing, with a specifi c<br />
focus on publicly owned utilities. Complemented by<br />
technical assistance on private-sector potential in<br />
infrastructure.<br />
Financing for national <strong>disaster</strong> <strong>risk</strong> reduction and<br />
<strong>climate</strong> <strong>change</strong> adaptation programs – this is<br />
usually channeled nationally and for GFDRR priority<br />
countries, but a window will be made available for<br />
cities (tbc).<br />
Cities Alliance Catalytic Fund Grant support for projects that strengthen and<br />
promote the role of cities in poverty reduction and<br />
sustainable urban development.<br />
Global Partnership on Output-Based<br />
Aid (GPOBA) technical assistance<br />
funding<br />
Source: Author.<br />
Technical assistance activities that support the<br />
design, implementation, and evaluation of outputbased<br />
aid (OBA) projects. Sectors relevant to cities<br />
include water and sanitation, energy, and transport.<br />
Insurance and other <strong>risk</strong>-management instruments serve an important function<br />
for cities and countries when <strong>disaster</strong> does strike. Globally, private insurers do<br />
provide coverage for a wide range of <strong>risk</strong>s, but not all <strong>risk</strong>s are fully covered for<br />
various reasons: insurers may be willing to cover certain <strong>risk</strong>s, but the potential<br />
clients deem the premiums too expensive; or insurers may simply be unwilling to<br />
take on <strong>risk</strong>s that they view as being too great. Th ese instruments are generally for<br />
upper- and middle-income families, large businesses, and wealthy governments,
OPENING NEW FINANCE OPPORTUNITIES FOR CITIES ■ 109<br />
but not for the urban poor. Th e urban poor oft en do not have access to insurance<br />
products, and even if they did, the transaction costs of fi ling and verifying claims<br />
would be very high.<br />
Th e <strong>World</strong> Bank has developed a catastrophe bond issuance platform—the<br />
MultiCat Program—that allows governments to use a standard framework to<br />
buy parametric insurance on aff ordable terms. Box 4.3 describes the experience<br />
with MultiCat in Mexico. For implementation in cities, a Global MultiCat bond<br />
issue for cities would pool a large number of exposed areas or cities and <strong>risk</strong>s,<br />
consider ably reducing insurance costs through diversifi cation. Working with<br />
such a pool, identifi ed donors and cities would pay the insurance premiums.<br />
Th e unique <strong>risk</strong>-return profi le asso ciated with the pool would attract interest<br />
from a wide variety of investors. Estimates show that a three-year $250-million<br />
Global MultiCat placed in capital markets could provide $50 million in coverage<br />
against earthquakes, hurricanes, or fl oods to each member of a group of<br />
some 40 cities.<br />
BOX 4.3<br />
MultiCat Mexico<br />
Background: The Mexican government in 2006 insured its catastrophe<br />
reserve fund, the Fondo de Desastres Naturales (FONDEN), against natural<br />
<strong>disaster</strong>s with a mix of reinsur ance and a catastrophe bond. The resulting<br />
contract was linked to a parametric trigger in terms of magnitude and depth<br />
of seismicity for the three-year period 2007–09. In 2008, the Mexican government<br />
spent US$1.2 billion from the reserve fund to cover rescue and rebuilding<br />
operations after Hurricanes Stan and Wilma. In collaboration with the <strong>World</strong><br />
Bank, Mexico developed and successfully established the catastrophe bond<br />
MultiCat Mexico in 2009, with the <strong>World</strong> Bank acting as arranger.<br />
Limitations: The coverage from FONDEN is the fraction of the coverage that<br />
is taken care of by the federal govern ment. Mexican states are also supposed<br />
to support a frac tion of the post-<strong>disaster</strong> expenses; the instrument does not<br />
give these Mexican states access to reinsurance markets. In addition, the<br />
preparation of the MultiCat Mexico was possible thanks to the technical expertise<br />
existing in the Mexican Ministry of Finance. Such technical expertise would<br />
need to be developed by any participating government either before or during<br />
the preparation of a MultiCat issue.<br />
Source: <strong>World</strong> Bank.
110 ■ CLIMATE CHANGE, DISASTER RISK, AND THE URBAN POOR<br />
MDBs can also support fi nancing in cities by off ering credit enhancements to<br />
facilitate access to broader credit by governments. With a partial credit guarantee<br />
(PCG), the guarantor shares the <strong>risk</strong> of debt service default with the lenders on<br />
a predetermined basis. Th e PCG programs funded by the Global Environment<br />
Facility (GEF) for energy effi ciency investments typically provide for a 30 percent<br />
to 50 percent guarantee on loans made by participating fi nancial institutions.<br />
A partial <strong>risk</strong> guarantee insures private lenders or investors/project companies<br />
(through shareholder loans) against the <strong>risk</strong> of a government (or governmentowned<br />
entity) failing to perform its contractual obligation with respect to the<br />
private project.<br />
Th e <strong>World</strong> Bank off ers both partial credit and partial <strong>risk</strong> guarantee products.<br />
Each can be structured to meet the specifi c needs of the project investors and<br />
government and can require a counter-guarantee from the sovereign government<br />
(see, for example, the proposed carbon market development guarantee instrument<br />
in table 4.3). On the other hand, the Multilateral Investment Guarantee<br />
Agency of the <strong>World</strong> Bank Group off ers standard cross-border <strong>risk</strong> insurance<br />
without an explicit counter-guarantee from the government.<br />
Microfi nance can also be used to fi nance <strong>risk</strong> reduction and recovery by<br />
the poor. Microfi nance has been used to improve resilience through housing<br />
improvements and livelihood assets. In low-income communities in El Salvador,<br />
self-insurance includes encouraging family members to migrate to provide<br />
remittance income, and stockpiling building materials that can be either used<br />
or resold (<strong>World</strong> Watch Institute 2007). One study estimated that residents<br />
spend approximately 9 percent of their income on <strong>risk</strong>-reduction measures. At<br />
the community level, many contribute to community emergency funds or join<br />
religious institutions that traditionally off er post-<strong>disaster</strong> help.<br />
In Manizales, Colombia, the city has arranged for insurance coverage to<br />
cover the urban poor through municipal tax collection. Any city resident may<br />
purchase insurance coverage for his or her property, and once 30 percent of<br />
the insurable buildings participate, the insurance coverage is extended to taxexempted<br />
properties, including properties with a value of 25 monthly salaries<br />
or less (estimated at US$3,400) (Velasquez 2010). Despite the municipal<br />
administration collecting a handling fee of 6 percent, the insurance company<br />
has a direct contractual relationship with the individual taxpayer and bears<br />
responsibility for all the claims.<br />
Carbon Markets and Related Instruments<br />
Carbon fi nance refers to the use of the fl exible mechanisms of the Kyoto Protocol,<br />
including the Clean Development Mechanism (CDM) and Joint Implementation,<br />
as well as voluntary programs outside of the United Nations Framework
TABLE 4.3<br />
Main Instruments for Financing Climate Action in the Urban Context<br />
Adaptation fund<br />
US$300–600 million by 2012<br />
adaptation-fund.org<br />
Global Environment Facility<br />
(GEF) US$1.35 billion<br />
over 2011–14<br />
gefweb.org<br />
UNFCCC GEF-administered<br />
special funds<br />
LDCF: US$223 million<br />
SCCF: US$148 million<br />
gefweb.org<br />
Green Climate Fund<br />
Size of 11 carbon funds and<br />
facilities: US$2.5billion<br />
<strong>World</strong> Bank Carbon Partnership<br />
Facility (CPF) US$100 million<br />
Climate-specifi c additional resources under the aegis of UNFCCC<br />
A The overall goal of all adaptation projects and programs fi nanced under the fund will be to support concrete<br />
adaptation activities that reduce the adverse effects of <strong>climate</strong> <strong>change</strong> facing communities, countries,<br />
and sectors. Can be implemented at the city level. Applications through national designated authorities and<br />
implementation through accredited multilateral or national implementing entities.<br />
M<br />
(A)<br />
A<br />
M&A<br />
Largest source of grant-fi nanced mitigation resources. Strategic Pilot on Adaptation (SPA) is a funding<br />
allocation within the GEF Trust Fund to support pilot and demonstration projects that address local<br />
adaptation needs and generate global environmental benefi ts in all GEF focal areas. Cities can initiate new<br />
projects or be implementation partners with national agencies.<br />
Least Developed Countries Fund (LDCF) helps to prepare and fi nance implementation of national<br />
adaptation programs of action (NAPAs) to address the most urgent adaptation needs in the least developed<br />
countries.<br />
Special Climate Change Fund (SCCF) supports adaptation and mitigation projects in all developing<br />
countries, with a large emphasis on adaptation.<br />
First agreed to in the Copenhagen Accord at COP-15, with the stated goal of mobilizing $100 billion<br />
annually by 2020 to address the needs of developing countries. The details of this fund are still under<br />
discussion.<br />
Resources from the carbon market<br />
M Cities can access CDM funds through certifi ed emission reduction (CER).<br />
CPF can support cities in preparing CDM projects.<br />
<strong>World</strong> Bank Treasury can support in monetizing CERs.<br />
(continued next page)<br />
OPENING NEW FINANCE OPPORTUNITIES FOR CITIES ■ 111
TABLE 4.3 continued<br />
Climate investment funds<br />
US$6.4 billion <strong>climate</strong>investment<br />
funds.org/<br />
<strong>World</strong> Bank administered,<br />
implemented by MDBs<br />
Reduced Emissions from<br />
Deforestation and Forest<br />
Degradation (REDD) programs<br />
US$4 billion in pledges as Fast<br />
Start Finance following the<br />
Copenhagen Accord<br />
Examples of other <strong>climate</strong> funds<br />
and their volumes:<br />
US$10 billion<br />
US$1.6 billion<br />
US$180 million annually<br />
US$580 million<br />
US$180 million<br />
US$160 million<br />
US$135 million<br />
US$100 million<br />
Dedicated concessional funding (ODA) from the DAC community<br />
M The Clean Technology Fund (US$4.5 billion programmed for 13 investment plans) fi nances scaled-up demonstration,<br />
deployment, and transfer of low-carbon technologies. Major urban mitigation (transport and<br />
energy) investments in Bangkok and Mexico City; others are possible, provided more funds are pledged for<br />
programming.<br />
A<br />
M<br />
M&A<br />
M&A<br />
M&A<br />
M&A<br />
M&A<br />
A<br />
M&A<br />
M<br />
The Strategic Climate Fund: (1) Pilot Program for Climate Resilience (PPCR—US$1 billion programmed for<br />
nine pilot countries and two regions) helps build <strong>climate</strong> resilience in core development; (2) Forest<br />
Investment Program (FIP—US$587 million for eight pilot countries); (3) program to Scale up Renewable<br />
Energy for Low-Income Countries (SREP—US$318 million for six pilot countries). Urban upstream planning<br />
support and city-based investments are possible to integrate into national plans now being formulated in<br />
agreed pilot countries.<br />
Two major REDD funds fully or partially run by the <strong>World</strong> Bank, the Forest Carbon Partnership Facility<br />
(FCPF), and the Forest Investment Program (FIP, under the Climate Investment Funds) have already<br />
received over US$700 million in pledges for pilot programs in forested developing countries, and are<br />
currently commencing implementation. Cook-stove programs can still be integrated into country strategies<br />
and implementation plans for reducing deforestation. Their impact at the urban level is in reducing<br />
greenhouse gas and black-carbon emissions in low-income areas with corresponding health co-benefi ts.<br />
Cities can access these funds through cooperation in the national programming process:<br />
Cool Earth Partnership (Japan)<br />
Environmental Transformation Fund—International Window (UK)<br />
International Climate Initiative (Germany)<br />
Climate and Forest Initiative (Norway)<br />
International Forest Carbon Initiative (Australia)<br />
Global Climate Change Alliance (European Commission)<br />
International Climate Change Adaptation Initiative (Australia)<br />
UNDP-Spain MDG Achievement Fund<br />
112 ■ CLIMATE CHANGE, DISASTER RISK, AND THE URBAN POOR
Global Facility for Disaster<br />
Reduction and Recovery<br />
(GFDRR)<br />
International Development<br />
Association (IDA)<br />
<strong>World</strong> Bank core concessional<br />
loans for low-income countries<br />
IBRD, MDB, and bilateral core<br />
funds<br />
Trust funds and partnerships;<br />
guarantees<br />
Climate insurance products<br />
<strong>World</strong> Bank Treasury, etc.,<br />
fee-based or donor supported<br />
Examples of non-<strong>climate</strong>-specifi c support from donors and MDBs<br />
A Partnership within the UN International Strategy for Disaster Reduction (ISDR) initiative, focusing on building<br />
capacities to enhance <strong>disaster</strong> resilience and adaptive capacities in changing <strong>climate</strong>. About two-thirds of<br />
GFDRR’s assistance has primarily focused on <strong>climate</strong> <strong>change</strong> adaptation; that is more than US$27 million<br />
in nearly 90 countries worldwide. GFDRR support has leveraged an additional US$17 million of co-fi nancing<br />
from development partners and greater amounts from <strong>World</strong> Bank investments.<br />
The GFDRR Technical Assistance Fund is global, established through contributions of GFDRR partners into<br />
a multi-donor trust fund. The Callable Fund is a fund-in-readiness to be activated when <strong>disaster</strong> strikes.<br />
This multi-donor trust fund provides an innovative approach in that donors enter into an agreement with<br />
the <strong>World</strong> Bank before a natural <strong>disaster</strong> to support the Callable Fund; however, actual funds are mobilized<br />
after a natural <strong>disaster</strong> through a Call for Funds.<br />
A<br />
(M)<br />
A<br />
M<br />
M<br />
A<br />
A<br />
To be developed as part of national initiatives and with national authorities:<br />
– Development policy operations to build resilience into city budgets<br />
– Adaptation at city level<br />
– Mitigation at city level<br />
Stand-alone or in combination with <strong>climate</strong>-specifi c funds city-based adaptation and mitigation as part of<br />
national programs and with national authorities.<br />
Grant fi nancing for knowledge products, capacity building, upstream project work/pilots; partial <strong>risk</strong> guarantees<br />
to support development, adoption, and application of clean-energy technologies, including those<br />
not fully commercialized, in client countries.<br />
Risk fi nancing strategy development<br />
MultiCAT products with cities with parameter-based triggers<br />
CAT swaps for extreme fl ood <strong>risk</strong>, etc.<br />
Multicity insurance products for <strong>risk</strong> sharing and lower cost<br />
(continued next page)<br />
OPENING NEW FINANCE OPPORTUNITIES FOR CITIES ■ 113
TABLE 4.3 continued<br />
Climate bonds<br />
<strong>World</strong> Bank Treasury, etc.,<br />
fee-based or donor supported<br />
M<br />
A<br />
Bonds against city CERs or NAMAs<br />
Advice on monetizing carbon bonds<br />
Public-private partnerships <strong>World</strong> Bank Public-Private Infrastructure Advisory Facility (PPIAF) or similar schemes can provide technical<br />
assistance and match-making in planning and making operational urban NAMAs by improving an enabling<br />
environment and strategic public intervention conducive to long-term private-sector commitment.<br />
Private sector IFC and other MDB private-sector arms can provide technical assistance and fi nancial support to investors<br />
in <strong>climate</strong>-resilient infrastructure or low-carbon technologies through a combination of <strong>risk</strong> management<br />
and other concessional instruments, bringing the cost to a level attractive for long-term private investment.<br />
Source: www.<strong>climate</strong>fi nanceoptions.org.<br />
Note: A = Adaptation; M = Mitigation; UNFCCC = United Nations Framework Convention on Climate Change.<br />
114 ■ CLIMATE CHANGE, DISASTER RISK, AND THE URBAN POOR
OPENING NEW FINANCE OPPORTUNITIES FOR CITIES ■ 115<br />
Convention on Climate Change (UNFCCC). Registered projects resulting in<br />
GHG emission reductions located in develop ing countries or economies in<br />
transition obtain certifi ed emission reductions (CERs) that can be traded in the<br />
market, thereby providing a performance-based revenue stream to the project.<br />
Th e <strong>World</strong> Bank’s Carbon Partnership Facility can support cities in improving<br />
their overall market readiness, in developing emissions-trading projects, and in<br />
acquiring CERs for the market CDM methodologies cover 15 sectors, including<br />
waste, energy, and transport, which cover many typical projects in cities.<br />
For cities with limited budgets, carbon fi nance can help justify the eff ort of<br />
coordinating with various stakeholders (including their own departments) and<br />
help deal with the higher cost of choosing a lower-emission technology. Moreover,<br />
carbon-fi nance revenues can be directed for pro-poor objectives, such as<br />
investments to build resilience in poor urban areas. One illustration is the case of<br />
São Paulo, highlighted in box 4.4.<br />
Th e citywide approach to carbon fi nance is designed to help cities overcome<br />
some of the barriers to CDM projects at the city level, including small<br />
projects and high transaction costs. Typical projects in cities, except for wastemanagement<br />
projects in large cities, yield small volumes of CERs. Furthermore,<br />
repeated clearances are needed from the same city for diff erent projects—which<br />
can be time consuming and cumbersome. Clear and standardized baselines for<br />
GHG emis sions are a prerequisite for this citywide approach. Th e <strong>World</strong> Bank<br />
has piloted this approach in Amman, Jordan, and endorsement from national<br />
governments was obtained in a Decision of the Parties at COP-16 in Cancun<br />
in December 2010. Approval by the CDM Executive Board was pending at the<br />
time of writing.<br />
Other market-related instruments for carbon include city-based emissions<br />
trading systems (ETSs, see box 4.5) and carbon-linked bonds. Th e <strong>World</strong> Bank is<br />
currently working in two middle-income countries on new carbon-linked bonds<br />
that would contribute to fi nancing a program of emissions-reduction projects.<br />
Such bonds could be issued through diff erent structures in which the <strong>World</strong><br />
Bank helps to select the best fi nancial fi rms as partners and reaches out to investors<br />
interested in emissions-reduction projects. City governments with energyeffi<br />
ciency projects that could generate fl ows of measurable GHG abatement over<br />
time, potentially eligible for the CDM or for future ETSs, could obtain funding on<br />
very attractive terms through such structures. Again, these funds could be used<br />
for building resilience for the urban poor.<br />
The Private Sector<br />
Private companies—ranging from small businesses selling water through kiosks<br />
or providing road maintenance to local and international operators with solid
116 ■ CLIMATE CHANGE, DISASTER RISK, AND THE URBAN POOR<br />
BOX 4.4<br />
Landfi ll Gas-to-Energy Projects in São Paulo<br />
Through a public bidding process, the City of São Paulo gave a concession<br />
to the holding company Biogas to install thermoelectric power plants to burn<br />
biogases emitted by decaying waste from the Bandeirantes and São Joao<br />
landfi lls. This generates the equivalent of 7 percent of the electricity consumed<br />
in the city. Each facility now generates more than 175,000 MW/h, enough to<br />
supply power to 600,000 residents for 10 years. It is estimated that 11 million<br />
tons of CO -equivalent will be abated by 2012.<br />
2<br />
Both landfi lls were approved as Clean Development Mechanism (CDM).<br />
According to the concession agreement, 100 percent of the energy and<br />
50 percent of the carbon credits produced by the landfi lls belong to Biogas<br />
Co. to be traded in the market, while the City of São Paulo has the right to<br />
sell the other half of carbon credits at public auctions. In September 2007,<br />
the city held the fi rst auction, raising about US$18 million (at US$22 per ton)<br />
from the Bandeirantes landfi ll CERs generated between December 2003<br />
and December 2006. A second auction, held in September 2008, offered<br />
CERs from both landfi lls and collected more than US$19 million (at US$28<br />
per ton).<br />
In addition to mitigating <strong>climate</strong> <strong>change</strong>, São Paulo’s projects to convert<br />
landfi ll gas to energy also aim to revitalize the surrounding low-income communities.<br />
In 2009, two public plazas, Cuitegi and Mogeiro, near the Bandeirantes<br />
landfi ll, were inaugurated. Cuitegi Plaza has 2,300m² of leisure<br />
area, playgrounds, and seating. Minor road works were also completed to<br />
facilitate mobility within the local community. The Mogeiro Plaza has 6,897m²<br />
of leisure area and offers a walking path, exercise equipment, playground,<br />
seating, and community space.<br />
Source: C40 Case Study.<br />
expertise and substantial fi nancial resources—can play a key role in providing<br />
infrastructure and services in urban areas. Developing effi cient public-private<br />
partnerships (PPPs) that recognize the strengths of both the private and public<br />
sectors is an important part of the solution. An enabling policy environment and<br />
strategic investments through public funds can be designed to attract private funds.<br />
Th e experience with PPPs for improving infrastructure and services in<br />
urban slums has mainly been through components of larger projects that
BOX 4.5<br />
OPENING NEW FINANCE OPPORTUNITIES FOR CITIES ■ 117<br />
Tokyo’s Emissions Trading System<br />
Emissions trading is a market-based approach for addressing air pollution<br />
problems, also known as “cap-and-trade.” Emissions-trading schemes for<br />
greenhouse gases (GHGs) include the European Union’s ETS and the Regional<br />
Greenhouse Gas Initiative in the northeastern United States. At the city-level,<br />
however, ETSs in cities such as Chicago, Los Angeles, and Santiago de Chile<br />
have the primary objective of improving air quality, where some of the air pollutants<br />
covered also are GHGs.<br />
The world’s fi rst city-level carbon dioxide (CO ) cap-and-trade program,<br />
2<br />
with the primary objective of mitigating <strong>climate</strong> <strong>change</strong>, was launched in Tokyo<br />
in April 2010. Tokyo’s ETS covers energy-related CO , involving around 1,340<br />
2<br />
large installations including industrial factories, public facilities, educational<br />
institutions, and commercial buildings. With this ETS, the Tokyo Metropolitan<br />
Government aims to reduce CO emissions by at least 6 percent during the<br />
2<br />
fi rst compliance period (2010–2014), with the ultimate goal of a 25 percent<br />
reduction below 2000 levels by 2020.<br />
Source: <strong>World</strong> Bank.<br />
may include an entire utility (water, sewerage, electricity, transport) within<br />
a certain city or region. Municipal governments may hire a private company<br />
to extend the water and sanitation network to new parts of the city including<br />
slum communities (a service contract). Or, they may include in a concession<br />
the commitment to extend service to certain slum communities, which<br />
obliges the private company to recover the costs of service provision and initial<br />
investment from their customers, including the slum dwellers. In Port<br />
Vila, Vanuatu, a concession contract successfully extended free potable water<br />
to poor areas through cross subsidies from wealthier areas. In Manila, the<br />
concessionaires Mayniland Water Services and Manila Water Company use a<br />
variety of internal programs and partnerships with NGOs, community organizations,<br />
and small entrepreneurs to increase water distribution to slums. 3<br />
Municipalities have discovered that involving the private sector in public utilities<br />
and works is not without its problems, but as cities continue to consider<br />
public-private partnerships as ways to improve public services, service expansion<br />
to slums can be brought to the negotiating table and integrated into PPP<br />
contracts (box 4.6). 4
118 ■ CLIMATE CHANGE, DISASTER RISK, AND THE URBAN POOR<br />
BOX 4.6<br />
Getting Private Water Utilities into Slums: Metro<br />
Manila Water Concessions<br />
Metro Manila’s water authority was privatized in 1997 with the intention of solving<br />
problems of ineffi ciency and fi nancial shortfalls. Two 25-year concession<br />
contracts were signed, one with Manila Water Company (composed of Ayala<br />
and International Water) to cover the eastern zone of the city and a second<br />
with Maynilad Water Services (Benpres and Ondeo) to cover the western zone.<br />
Both concessionaires are required to expand service coverage to between 77<br />
percent and 87 percent by 2001 and between 95 percent and 98 percent by<br />
2021. To achieve this, both companies have had to devise strategies to profi tably<br />
extend water services to slums.<br />
Although the concession agreement allows for the installation of one public<br />
standpipe per 475 people in depressed areas, both companies have worked<br />
to establish other types of connections that bring water closer to people’s<br />
homes and ensure greater revenue for the companies. Manila Water has introduced<br />
group taps for two to fi ve households to share a single connection<br />
registration and water bill. The company has also introduced communitymanaged<br />
water connections in which a community association is responsible<br />
for a master meter and installs and manages a distribution network to blocks<br />
or individuals. Manila Water also permits private companies to buy water for<br />
resale through private distribution networks, which the contractor must take<br />
responsibility for maintaining.<br />
Maynilad has actively sought out partnerships with NGOs to extend individual<br />
household connections, preferred by customers in all income groups,<br />
to slums. Its Bayan Tubig (Water for the Community) program waives the<br />
land-title requirement in slums and integrates payment of the connection<br />
fee into the fi rst 6, 12, or 24 monthly water bills. NGOs, such as the Swiss<br />
chapter of Médecins San Frontières and the local LINGAP Foundation in<br />
Malabon, get communities involved to support ownership of the program<br />
through information, education, and community campaigns and assistance<br />
to the poorest families through microfi nance. Maynilad additionally will contract<br />
with community-based associations to provide billing and collection<br />
services, which further localizes value creation in household water provision.<br />
(continued next page)
BOX 4.6 continued<br />
OPENING NEW FINANCE OPPORTUNITIES FOR CITIES ■ 119<br />
The companies have enhanced their image and have decreased non-revenue<br />
water through formalizing water provision arrangements in slums where<br />
many people had been receiving water through illegal connections and public<br />
standpipes. Through their contract with the local government and their partnerships<br />
with NGOs and community associations, these two private water<br />
utilities are promoting access to safe, reliable potable water in the poorest<br />
areas in Metro Manila.<br />
Sources: Baker and McClain (2009), based on Weitz and Franceys (2002). See also Franceys<br />
and Weitz (2003).<br />
In several cities in India, capital has been mobilized for slum improvements<br />
through credit guarantees and bonds (Baker and McClain 2009). In India, the<br />
Ahmedabad Municipal Corporation issued the fi rst municipal bond in 1998<br />
without a central government guarantee for the purpose of fi nancing a citywide<br />
water and sanitation project that included many slum areas and the Slum Networking<br />
Project “Parivartan.” In 2005, municipal governments around Bangalore<br />
built on Ahmedabad’s success with a bond issue called the Greater Bangalore<br />
Water and Sanitation Pooled Facility that combined the commitments of eight<br />
city governments. In both cases, the success of the bond sales depended on the<br />
municipal governments’ having previously demonstrated a revenue surplus and<br />
received a suffi ciently high credit-rating to ensure an interest rate in line with the<br />
government’s projections of future ability to pay, among other conditions. Th e<br />
ability of municipal governments to mobilize domestic capital greatly enhances<br />
the scale at which municipal governments can engage in development. Ahmedabad’s<br />
four municipal bond issues raised $89.5 million between 1998 and 2006.<br />
Th e Greater Bangalore Facility raised over $23 million, with the assistance of a<br />
$780,000 partial credit guarantee from USAID, essentially mobilizing over $29 in<br />
domestic capital for every dollar donated (Painter 2006, 19–20).<br />
At the household level, the urban poor use microfi nance particularly for purchasing<br />
and improving houses, which oft en contribute to resilience. Housing<br />
microfi nance typically comprises small loans (from $550 to $5,000) of limited<br />
maturing (6 months to 3 years), generally without collateral (Freire, forthcoming).<br />
A number of commercial banks, fi nancial cooperatives, and NGOs specialize<br />
in microfi nance for low-income residents. Mibanco, for example, is one of the
120 ■ CLIMATE CHANGE, DISASTER RISK, AND THE URBAN POOR<br />
largest microfi nance institutions in Latin America, with 70,000 active borrowers,<br />
and Grameen Bank in Bangladesh has delivered 600,000 housing loans since it<br />
was established. In general, all of these institutions show performance rates above<br />
housing loans in the banking industry (Biswas 2003). A further application of<br />
microfi nance is the Local Development Program (PRODEL) in Nicaragua, which<br />
lends to community groups for small infrastructure projects.<br />
Initiatives at the community level focus on fi nance for housing and infrastructure,<br />
which are growing in signifi cance. Th ese funds involve savings at the<br />
community level, which are leveraged to access funds from national government<br />
donors. For example, the Jamii Bora Trust Low Cost Housing Scheme in Kenya<br />
raised funds through members’ savings, market fi nance, and donations to purchase<br />
293 acres of private land and to construct houses. Members then fi nance<br />
their housing units ($3,000) with loans from the trust at about $45 per month.<br />
Monthly fees of $7 are charged for maintenance (UN-HABITAT). Other examples<br />
exist in Cambodia, Th ailand, the Philippines, and India.<br />
Results-based Financing<br />
Results-based fi nancing (RBF) is an umbrella term for mechanisms that disburse<br />
funds only aft er pre-set results have been achieved. Disbursements are normally<br />
made on the basis of independent verifi cation of these results. Th is has the eff ect<br />
of transferring performance <strong>risk</strong> from the subsidy provider to the service provider,<br />
thus improving the likelihood that desired results are achieved. RBF is relevant<br />
at two levels: the investment level and the consumer level.<br />
At the level of the investment, RBF can be thought of as results-based viability<br />
gap funding. Such payments depend on there being suffi cient pre-fi nancing<br />
capability. Pre-agreed results must be specifi c enough to be verifi able. Th is should<br />
lead to transparent and more eff ective use of subsidy funds. Diff erent stages of<br />
delivering the desired service—such as fi nancial closure of projects, initial works,<br />
completion of works, and delivery of performance—can all be verifi ed and lead<br />
to payments.<br />
For the consumer, results-based payments focused on delivering basic services<br />
to low-income individuals are termed output-based aid (OBA). OBA is normally<br />
designed to support the upfront costs of delivering basic and reliable services to<br />
the poor. Examples include electricity and water connections. Operating costs are<br />
normally not subsidized, and are expected to be aff ordable to the consumer to<br />
ensure sustainability of the investment. Th e level of subsidies, delivered aft er the<br />
“output” has been verifi ed, is normally set based on unit costing from independent<br />
experts. Th e costs could also be set using competitive bidding. Th e objective<br />
of this costing is to determine the “effi cient” cost. Th e actual level of subsidy is<br />
then set aft er taking into account household aff ordability.
OPENING NEW FINANCE OPPORTUNITIES FOR CITIES ■ 121<br />
In low-income communities in western Jakarta, an arrangement developed<br />
through the Global Partnership on Output Based Aid (GPOBA), the city government,<br />
and the local water utility, PALYJA, subsidizes the cost of water-supply<br />
connections for almost 12,000 households in poor areas, including 2,200 in informal<br />
settlements where PALYJA had previously not been authorized to provide<br />
services (Menzies and Setiono 2010). Concessionaires are given grants for the<br />
cost of installing connections to the networks, provisional on two measureable<br />
outputs—the provision of a working household connection, and the delivery of<br />
acceptable service for three months. While the project has faced some diffi cult<br />
challenges in implementation related to water availability, and problems dealing<br />
with existing informal water suppliers, these eventually were resolved, with the<br />
help of the NGO Mercy Corps, paving the way for further expansion to other<br />
communities.<br />
Bringing It All Together<br />
Sustainable fi nancing for <strong>climate</strong> <strong>change</strong>, <strong>disaster</strong> <strong>risk</strong>, and the urban poor in cities<br />
will need to draw on all available resources, as well as maximize synergies<br />
and complementarities. An effi cient combination of resources from the instruments<br />
described above can leverage public and private sources while ensuring<br />
signifi cant co-benefi ts. Combinations of fi nancial instruments will be needed,<br />
with approaches customized to address specifi c needs, <strong>risk</strong>s, or barriers, while<br />
also reducing transaction costs.<br />
Since most international funds for addressing adaptation and mitigation are<br />
channeled through national implementing entities, cities have extensive scope<br />
to access such funds through national processes (see annex 1), but modalities<br />
for more direct access need to be considered. One approach to facilitating access<br />
would be allowing cities to access such fi nancing through a more unifi ed “window,”<br />
which would reduce overhead and administrative complexity. Such an<br />
approach could bring together many of the existing resources that are available<br />
and draw on some innovative instruments, such as green bonds for cities and<br />
results-based fi nancing for basic services. With regard to <strong>climate</strong> support alone,<br />
the <strong>World</strong> Bank off ers more than 30 potential programs, including for capacity<br />
building and technical assistance, as well as funding initiatives.<br />
To encourage cities to achieve specifi ed targets, such a program could consider<br />
a more standardized approach to benchmarking and monitoring through<br />
metrics commonly agreed upon by the international community, such as a citylevel<br />
GHG index, urban <strong>risk</strong> assessments, or Local Resilience Action Plans. By<br />
meeting specifi ed targets, cities would then be eligible for accessing such fi nancing<br />
through the designated window.
122 ■ CLIMATE CHANGE, DISASTER RISK, AND THE URBAN POOR<br />
In conclusion, this study has pointed to the many challenges for cities and residents<br />
around the world as they confront the <strong>risk</strong>s associated with <strong>climate</strong> <strong>change</strong><br />
and natural hazards. While the <strong>risk</strong>s have direct and indirect impacts for all urban<br />
residents, those at the bottom of the income distribution face the greatest challenges,<br />
oft en on a daily basis. Understanding these <strong>risk</strong>s is an important fi rst step<br />
to addressing them, as has been demonstrated in Dar es Salaam, Jakarta, Mexico<br />
City, São Paulo, and elsewhere. Th e study has pointed to broad actions that can<br />
respond to the <strong>risk</strong>s identifi ed and help to build resilience for the urban poor.<br />
Such actions will require strong commitments from local governments, along<br />
with national and international partners. In implementing such actions, benefi ts<br />
will be realized not only by the urban poor, but also by future generations.<br />
Notes<br />
1. http://www.<strong>climate</strong>fi nanceoptions.org.<br />
2. http://web.worldbank.org/WBSITE/EXTERNAL/COUNTRIES/LACEXT/EXTLACP<br />
ROJECTSRESULTS/0,,contentMDK:227 42596~pagePK:51456561~piPK:51456127~<br />
theSitePK:3177341,00.html.<br />
3. See Weitz and Franceys (2002), pp. 50–61, for further description of these public-<br />
private partnerships, and the full publication for a broader selection of examples.<br />
4. See Weitz and Franceys (2002). See Mehta (1999) for issues related to integrating service<br />
provision to the poor into commercially viable projects.<br />
References<br />
Baker and McClain. 2009. “Private Sector Initiatives in Slum Upgrading.” Urban Paper<br />
No. 8, <strong>World</strong> Bank, Washington, DC.<br />
Biswas, Smita. 2003. “Housing Is a Productive Asset—Housing Finance for Self-Employed<br />
Women in India.” Small Enterprise Development 14 (1): 49–55.<br />
Economics of Climate Adaptation (ECA) Working Group. 2010. Shaping Climate-Resilient<br />
Development: A Framework for Decision-Making.<br />
European Environment Agency. 2007. Climate Change: Th e Cost of Inaction and the Cost<br />
of Adaptation. Copenhagen.<br />
Franceys, Richard, and Almud Weitz. 2003. “Public-Private Community Partnerships in<br />
Infrastructure for the Poor.” Journal of International Development 15: 1092–94<br />
Freire, M. Forthcoming. “Financing Urban Upgrading.” In Metropolitan Government<br />
Finances in Developing Countries, ed. R. Bahl, J. Linn, and D. Wetzel. Lincoln Institute<br />
of Land Policy.<br />
Huhtala, Ari, 2010, Climate Finance for Cities, Mimeo.<br />
International Federation of Red Cross and Red Crescent Societies (IFRC). 2010. <strong>World</strong><br />
Disasters Report: Focus on Urban Risk. Geneva: IFRC.
OPENING NEW FINANCE OPPORTUNITIES FOR CITIES ■ 123<br />
Mehta, Meera. 1999. “Balancing Commercial Viability with the Needs of the Poor in<br />
the Development of Urban Water Supply and Sewerage Projects,” Project Notes 14.<br />
USAID Indo-U.S. Financial Institutions Reform and Expansion Project—Debt<br />
Market Component FIRE(D), January. http://www.niua.org/indiaurbaninfo/fi re-D/<br />
ProjectNo.14.pdf.<br />
Menzies, I., and I. Setiono. 2010. “Output-Based Aid in Indonesia: Improved Access to<br />
Water Services for Poor Households in Western Jakarta.” GPOBA Approaches Note.<br />
Washington, D.C.<br />
Painter, D. 2006, “Scaling up Slum Improvement: Engaging Slum Dwellers and the Private<br />
Sector to Finance a Better Future.” Paper presented at the <strong>World</strong> Urban Forum III,<br />
June.<br />
Smolka, Martin O., and Adriana de A. Larangeira. 2008. “Informality and Poverty in<br />
Latin American Urban Policies.” In Th e New Global Frontier: Cities, Poverty and<br />
Environment in the 21st Century, ed. George Martine, Gordon McGranahan, Mark<br />
Montgomery, and R. Castilla-Fernandez, 99–114. London: IIED/UNFPA and<br />
Earthscan Publications.<br />
Velasquez Barrero, Luz Stella. 2010. “La Gestion del Riesgo en el Contexto Ambiental<br />
Urbano Local: Un Reto Permanente y Compartido. Caso Manizales, Colombia.”<br />
Background paper prepared for the 2011 Global Assessment Report on Disaster Risk<br />
Reduction.<br />
Weitz, Almud, and Richard Franceys, eds. 2002. Beyond Boundaries: Extending Services<br />
to the Urban Poor. Asian Development Bank, August, 50–61. http://www.adb.org/<br />
documents/books/beyond_boundaries/beyond_ boundaries.pdf.<br />
<strong>World</strong> Bank. 2010a. Africa’s Infrastructure—A Time for Transformation. Washington, DC:<br />
<strong>World</strong> Bank.<br />
———. 2010b. Climate Risks and Adaptation in Asian Coastal Megacities: A Synthesis<br />
Report. Washington, DC: <strong>World</strong> Bank.<br />
———. 2010c. Making the Most of Public Finance for Climate Action—Th e <strong>World</strong> Bank<br />
Group at Work. Development, Climate, and Finance Issues Brief 3. Washington, DC:<br />
<strong>World</strong> Bank.<br />
———. 2010d. <strong>World</strong> Bank Urban Strategy. Washington, DC: <strong>World</strong> Bank.<br />
———. 2011e. Climate Change Adaptation and Natural Disaster Preparedness in the Coastal<br />
Cities of North Africa.Washington, DC: <strong>World</strong> Bank.<br />
<strong>World</strong> Watch Institute. 2007. State of the <strong>World</strong> 2007: Our Urban Future. New York:<br />
Norton.
Annex 1: Literature Review<br />
Over the past two decades, signifi cant research has been carried out on the<br />
topics of <strong>climate</strong> <strong>change</strong>, <strong>disaster</strong> <strong>risk</strong> management, urbanization, and poverty.<br />
Although analysis of the inter-linkages among all four of these areas is limited,<br />
signs suggest this may be changing. Climate <strong>change</strong> and <strong>disaster</strong> <strong>risk</strong> reduction<br />
are increasingly better linked and the impacts of <strong>climate</strong> <strong>change</strong> and <strong>disaster</strong>s on<br />
the urban poor is gaining prominence. As the frequency and intensity of <strong>disaster</strong>s<br />
related to <strong>climate</strong> <strong>change</strong> increase, the international development community<br />
and policy makers, in particular, are recognizing the importance of identifying<br />
the specifi c vulnerabilities of subgroups within the population to tailor interventions<br />
that will help groups cope.<br />
Across the world, the poor disproportionately bear the brunt of changing<br />
weather patterns and natural <strong>disaster</strong>s. Th ey lack adaptive capacity to cope with<br />
<strong>climate</strong> <strong>change</strong>. Urbanization exacerbates these problems. Cities, overburdened<br />
with rapidly expanding populations, are grappling with limited infrastructure<br />
and funds, unable to provide decent housing and basic health and welfare services<br />
to all residents. Th e urban poor end up more directly exposed to natural<br />
hazards as compared to their wealthy counterparts.<br />
Some of the essential foundation documents on the subject of <strong>climate</strong><br />
<strong>change</strong> and <strong>disaster</strong>s with some reference to urbanization and poverty (though<br />
not necessarily in conjunction with each other) include the Inter-Governmental<br />
Panel on Climate Change (IPCC) Assessment Reports, the <strong>World</strong> Bank’s <strong>World</strong><br />
Development Report 2010: Development and Climate Change, the <strong>World</strong> Watch<br />
■ 125
126 ■ CLIMATE CHANGE, DISASTER RISK, AND THE URBAN POOR<br />
Institute’s State of the <strong>World</strong>: Our Urban Future (2007) and Pro-Poor Adaptation<br />
to Climate Change in Urban Centers (Moser et al. 2010).<br />
Th e IPCC’s Fourth Assessment report is a good starting point, since it assesses<br />
recent published literature on <strong>climate</strong> <strong>change</strong>. While the IPCC report provides<br />
the most comprehensive data on <strong>climate</strong> <strong>change</strong>, the historic focus of the IPCC<br />
has been around the science of <strong>climate</strong> <strong>change</strong>. In this regard the IPCC report<br />
is an important source of established terminology and <strong>climate</strong> <strong>change</strong> defi nitions,<br />
which are followed in this study, especially for confi ning the concepts of<br />
vulnerability, exposure, sensitivity, and adaptive capacity. In its Fourth Assessment<br />
Report (IPCC 2007) Working Group II, Chapter 7, titled “Industry, Settlements<br />
and Society,” deals with issues related to industry, services, and fi nancial<br />
and social concerns that raise the vulnerability of human settlements (not only<br />
those living in cities) to <strong>climate</strong> <strong>change</strong>. Th e chapter concludes that research on<br />
vulnerabilities and adaptation potentials of human systems has lagged behind<br />
research on physical environmental systems, ecological impacts and mitigation,<br />
uncertainties dominate the subject matter of this chapter. Urbanization and poverty<br />
frequently come up in the discussion—as non-<strong>climate</strong> stresses that amplify<br />
the <strong>risk</strong>s that people face from the eff ect of <strong>climate</strong> <strong>change</strong>. Th e report warns that<br />
the poor living in informal settlements such as slums, especially in developing<br />
countries, are the most likely to be killed or harmed by extreme weather.<br />
IPCC (2007) Chapter 8, “Human Health,” also discusses the impact of <strong>climate</strong><br />
<strong>change</strong> on the health of the urban poor. With “high confi dence,” the IPCC<br />
asserts that the urban poor are at greater <strong>risk</strong> of suff ering adverse health impacts<br />
related to <strong>climate</strong> <strong>change</strong>, along with women, children, and the elderly. It also<br />
reminds readers of the Th ird Assessment Report’s (IPCC 2001) conclusion that<br />
“an increase in the frequency or intensity of heat waves will increase the <strong>risk</strong> of<br />
mortality and morbidity, principally in older age groups and among the urban<br />
poor.” Th e IPCC’s Fift h Assessment Report, due in 2011, is expected to deal more<br />
extensively with the impact of <strong>climate</strong> <strong>change</strong> on urbanization and development.<br />
It is unclear, however, to what extent the report will highlight these issues through<br />
the lens of the urban poor.<br />
Th e <strong>World</strong> Bank’s thorough <strong>World</strong> Development Report 2010: Development<br />
and Climate Change (WDR 2010) looks at development and <strong>climate</strong> <strong>change</strong><br />
from a variety of aspects, including <strong>climate</strong> <strong>change</strong> and human vulnerability. Th is<br />
includes a review of adaptation and mitigation priorities in developing countries,<br />
impacts of extreme weather, the challenge of coastal cities, and the costs<br />
of mitigation and adaptation. Th e WDR 2010 also addresses the link between<br />
<strong>climate</strong> <strong>change</strong> and urbanization, along with the associated vulnerability of the<br />
urban poor. Several issues are highlighted. Well-planned urbanization can be<br />
highly eff ective in addressing both adaptation and mitigation of <strong>climate</strong> <strong>change</strong>,<br />
but unplanned urbanization can increase the vulnerability of the urban poor.
ANNEX 1: LITERATURE REVIEW ■ 127<br />
Informal settlements are already particularly vulnerable to fl ooding, oft en due<br />
to clogged drains, land subsidence, heat waves, and increased health <strong>risk</strong>s. Th e<br />
WDR includes much more detailed analysis of <strong>climate</strong> <strong>change</strong> <strong>risk</strong>s, extreme<br />
events, <strong>climate</strong> fi nance, and related issues, but not specifi cally in the context of<br />
urban poverty.<br />
Th e <strong>World</strong> Watch Institute’s State of the <strong>World</strong>: Our Urban Future (2007)<br />
documents good practices on how cities build and manage their infrastructure<br />
and service delivery mechanisms to cope with <strong>climate</strong> <strong>change</strong>. Th e report does<br />
not focus specifi cally on the urban poor but many of its case studies on providing<br />
clean water and sanitation, transport, energy, and health narrate their<br />
stories as well.<br />
One topic receiving a lot of attention in <strong>climate</strong>-<strong>change</strong> literature relates to<br />
adaptation and its impact on poverty reduction and development. Scholars<br />
increasingly acknowledge that adaptation measures that take into account the<br />
poor can play a role in reducing poverty and make development truly sustainable.<br />
One of most frequently cited works on pro-poor adaptation in cities is by Moser<br />
et al. (2008). It examines the role of assets, including “natural, physical, social,<br />
fi nancial and human capital” (Mearns and Norton 2010), in increasing the adaptive<br />
capacity of the urban poor. Moser describes three reasons why household<br />
assets are crucial to helping poor urban dwellers adapt to <strong>climate</strong> <strong>change</strong>. For one,<br />
city authorities may not be able to provide them with infrastructure or services<br />
due to fi nancial limitations. Conversely, many city authorities may be reluctant to<br />
work with the poor, especially within informal settlements. And fi nally, improving<br />
the assets of the poor increases the likelihood that they could hold local governments<br />
accountable for providing services. Moser et al. (2008) have developed<br />
a framework to map asset vulnerability and identify interventions to address<br />
the vulnerability of the urban poor. Th ese interventions could be at three levels:<br />
household and neighbor hood; municipal or city; and regional and national. Th is<br />
framework could be useful in reducing social and urban vulnerability in adapting<br />
to <strong>climate</strong> <strong>change</strong>, but it has found few takers so far.<br />
Other prominent works relevant for this study—which are not as comprehensive<br />
as those discussed above but instead focus on more specifi c issues—include<br />
the <strong>World</strong> Bank’s Social Dimensions of Climate Change (Mearns and Norton<br />
2010) and Adapting to Climate Change in Eastern Europe and Central Asia (Fay<br />
et al. 2010), and publications by the Global Facility for Disaster Risk Reduction<br />
and Poverty (Kreimer and Arnold 2000; Kreimer et al. 2003; among others).<br />
Also relevant to this report are the Global Assessment Report on Disaster Risk<br />
Reduction (ISDR 2009), the United Nations Development Programme’s Human<br />
Development Report (2007), and Poverty and Climate Change: Reducing Vulnerability<br />
of the Poor through Adaptation (2009), a collaborative eff ort between<br />
the African Development Bank, Department for International Development,
128 ■ CLIMATE CHANGE, DISASTER RISK, AND THE URBAN POOR<br />
Organisation for Economic Co-operation and Development, United Nations,<br />
and <strong>World</strong> Bank. A compilation of papers on <strong>climate</strong> <strong>change</strong> and urban poverty<br />
is available in Adapting Cities to Climate Change (Bicknell, Dodman, and Satterthwaite,<br />
2010) published by the International Institute for Environment and<br />
Development, an organization that has done a great deal of macro-level work on<br />
the intersection of urban vulnerability and <strong>climate</strong> <strong>change</strong>. Mehrotra et al. (2010),<br />
Sanchez-Rodriguez (2009), and Juneja (2008) provide useful reviews of relevant<br />
literature on the <strong>climate</strong> <strong>risk</strong>s that cities face, adaptation, and the <strong>risk</strong> linkage<br />
between poverty and <strong>disaster</strong>s, respectively.<br />
Linking Climate Change and DRR<br />
Disaster <strong>risk</strong> reduction (DRR) and <strong>climate</strong> <strong>change</strong> adaptation have many overlapping<br />
concerns, and are interrelated issues for cities. Th e impacts of <strong>climate</strong> <strong>change</strong><br />
will include increased frequency and severity of natural <strong>disaster</strong>s, so the needs for<br />
<strong>climate</strong> <strong>change</strong> adaptation in this regard correspond with those of <strong>disaster</strong> <strong>risk</strong><br />
reduction (Prasad et al., 2008). Climate <strong>change</strong> adaptation covers a larger scope<br />
than DRR in also accounting for the eff ects of incremental, gradual <strong>change</strong>s in<br />
<strong>climate</strong>. Moser et al. (2008) also highlight the need for <strong>climate</strong> <strong>change</strong> adaptation<br />
to consider not only <strong>change</strong>s that fall under <strong>disaster</strong> <strong>risk</strong> reduction (fl ooding<br />
and other natural <strong>disaster</strong>s) but also important incremental and gradual <strong>change</strong>s,<br />
such as the rise in sea level. As noted above, some authors have noted the diff erences<br />
between <strong>climate</strong> <strong>change</strong> adaptation and DRR, but relatively little literature<br />
thoroughly acknowledges the synergies of <strong>climate</strong> <strong>change</strong> adaptation and DRR. A<br />
more careful documentation of these synergies would help maximize the effi cacy<br />
of both <strong>climate</strong> <strong>change</strong> adaptation and DRR projects for the urban poor.<br />
Climate <strong>change</strong> and <strong>disaster</strong> <strong>risk</strong> reduction are more divergent in terms of<br />
mitigation. Both <strong>climate</strong> <strong>change</strong> and DRR have developed diff ering meanings<br />
for “mitigation.” Climate <strong>change</strong> mitigation refers to reducing GHG emissions,<br />
while in DRR literature, mitigation refers to limiting the adverse impacts of natural<br />
<strong>disaster</strong>s. Other sources that discuss the diff erences and similarities between<br />
DRR and <strong>climate</strong> <strong>change</strong> include Birkmann et al. (2009), WDR (2010), and<br />
O’Brien et al. (2006).<br />
Climate Change, DRR, and Urban Poverty<br />
In existing literature, the link between <strong>climate</strong> <strong>change</strong> and urban poverty is<br />
explored less than between <strong>disaster</strong>s and urban poverty. Th is, too, is a fairly<br />
recent development. In 2000, the <strong>World</strong> Bank’s Managing Disaster Risk in
ANNEX 1: LITERATURE REVIEW ■ 129<br />
Emerging Economies (Kreimer and Arnold 2000) concluded that a major development<br />
imperative was to reduce <strong>disaster</strong>s in order to reduce poverty, since<br />
“poverty plays a big role in keeping people vulnerable to <strong>disaster</strong>s.” Following<br />
this, more documents emphasizing the link between <strong>disaster</strong> and poverty have<br />
been published (DFID’s Disaster Risk Reduction: A Development Concern, 2004;<br />
<strong>World</strong> Bank’s Hazards of Nature, Risks to Development, 2006). Yet, analytical<br />
literature on the exact links and nature of problems faced by the urban poor due<br />
to <strong>climate</strong> <strong>change</strong> and <strong>disaster</strong>s is scarce.<br />
Th ere is general consensus, however, that the poor are vulnerable because<br />
they lack basic safety and protection from physical harm. Spatial analysis techniques<br />
have revealed that the poor in urban areas tend to live in low-income<br />
settlements that are highly vulnerable to <strong>disaster</strong>s (Pillai et al. 2010; Hoff man<br />
2009; Lall and Deichmann, 2009). More crucially, the urban poor have limited<br />
access to basic services such as drinking water, sanitation, drainage, solid-waste<br />
management, transport, food and energy security, and health, among other<br />
welfare services.<br />
Service Delivery and the Urban Poor<br />
Lack of access to basic services, such as clean water, sanitation, drainage, and<br />
health services, makes the urban poor more vulnerable to <strong>climate</strong> <strong>change</strong> and<br />
natural <strong>disaster</strong>s. Most published research acknowledges that basic services<br />
should be provided to improve the living conditions of the urban poor, and that<br />
lack of access to these services increases the vulnerability of the urban poor (for<br />
example, Baker 2008). However, there is a major gap in sector-specifi c analysis of<br />
services such as water, drainage, sanitation, energy, roads, transport, and health<br />
for the poor living in cities.<br />
Of all basic services, water, sanitation, and drainage have received more attention<br />
in the context of <strong>climate</strong> <strong>change</strong> adaptation and <strong>disaster</strong>s because of their<br />
direct bearing on human health, the second most popular research subject. Inequity<br />
in access to clean drinking water, sanitation, and effi cient drainage services<br />
are reinforced in nearly all publications. For instance, State of the <strong>World</strong>: Our<br />
Urban Future (<strong>World</strong> Watch 2007) reported that the poor in most developing<br />
countries are deprived of essential water services, even where there was no water<br />
shortage per se.<br />
Most scholars attribute this to poor governance rampant in developing<br />
countries. In a study of African towns and cities, Douglas et al. (2008) found<br />
that the frequency of fl ooding had increased—not because of increased rainfall,<br />
but inadequate and clogged drainage. Parikh and Parikh (2009) found that<br />
most slums in Indore, India, were located along natural paths of water channels
130 ■ CLIMATE CHANGE, DISASTER RISK, AND THE URBAN POOR<br />
and drainages neglected by local authorities. Th e <strong>World</strong> Bank’s <strong>World</strong> Development<br />
Report 2004: Making Services Work for Poor People raised the question of<br />
accountability of providers and policy makers in water and sanitation services<br />
to the poor living in cities. Th e report concluded that patronage, “the compact<br />
between the politician and provider,” renders poor citizens powerless and providers<br />
should be made more accountable for their services to the public instead<br />
of being shielded by policy makers.<br />
Another area of research receiving attention at the <strong>World</strong> Bank and the wider<br />
research community focuses on providing solutions to water and related service<br />
delivery problems in urban areas. Danilenko et al. (2010) provide analytical and<br />
strategic guidance to the world regions for incorporating water-related adaptation<br />
to <strong>climate</strong> <strong>change</strong> in their work programs. Community-driven development<br />
interventions are also being proposed. Parkinson and Mark (2005) and Parikh<br />
(2009) found that in India, civic authorities successfully established “slum networks”<br />
with residents in many informal settlements in order to build drainage<br />
channels.<br />
Health services are another area that adaptation planners focus on. With the<br />
privatization of health care in many cities across developing countries, access<br />
to emergency and basic health care is becoming more inaccessible for the poor<br />
(Montgomery 2009). Th e IPCC (2007) warns, for example, that access to cheap,<br />
eff ective anti-malarials, insecticide-treated bed nets, and indoor spray programs<br />
will be important for future trends in malaria. Some major documents that link<br />
the vulnerability of the urban poor to poor health services include: IPCC’s Fourth<br />
Assessment Report Working Group II, Chapter 8, “Human Health” (2007); the<br />
<strong>World</strong> Health Organization’s Protecting Health from Climate Change (2009); and<br />
Kovats and Akhtar (2008).<br />
Th e rest of the basic services haven’t been examined in as much detail. Th e<br />
IPCC’s Fourth Assessment Report Working Group III, Chapter 10 (2007), is the<br />
most widely cited on solid-waste management (along with Douglas et al. 2008;<br />
Wilson 2007; Kebede and Dube 2004). On energy services, some key sources<br />
include the IPCC’s Fourth Assessment Report Working Group III, Chapter 4,<br />
2007; Fay et al. 2010; Haines et al. 2007; State of the <strong>World</strong>: Our Urban Future<br />
(<strong>World</strong> Watch Institute 2007; <strong>World</strong> Bank 2006.)<br />
Also, little literature addresses how limited access to roads aff ects the poor in<br />
the context of <strong>climate</strong> <strong>change</strong> and DRR. In terms of transport and urban poverty,<br />
the key documents include Baker et al. (2005) and the <strong>World</strong> Bank’s Cities on the<br />
Move (2002). On the subject of <strong>climate</strong> <strong>change</strong> and urban transport, the major<br />
reports include IPCC’s Fourth Assessment Report Working Group III, Chapter<br />
5 (2007); <strong>World</strong> Bank’s <strong>World</strong> Development Report 2009; and the <strong>World</strong> Business<br />
Council for Sustainable Development’s Mobility 2001 (2002) and Mobility 2030<br />
(2004). At the Urban Research Symposium in 2009, Olvera (2009) presented
ANNEX 1: LITERATURE REVIEW ■ 131<br />
research on the importance of urban transport for the poor in reducing vulnerability<br />
associated with <strong>climate</strong> <strong>change</strong>.<br />
Signifi cantly, a lot of the services literature attributes poor service delivery to<br />
neglect and poor urban governance (Global Assessment Report on Disaster Risk<br />
Reduction (ISDR 2009); Sattherthwaite et al. 2007; Lewis and Mioch 2005).<br />
Housing<br />
In most developing countries, the urban poor tend to live in low-cost housing or<br />
slum settlements located on the fringes of the city or in environmentally hazardous<br />
areas. Th e <strong>World</strong> Bank has published major documents on the topic: Climate<br />
Risks and Adaptation in Asian Coastal Mega-Cities (Pillai et al. 2010); Safer<br />
Homes, Stronger Communities (Jha 2010); Density and Disasters (Lall and Deichmann<br />
2009); Spatial Analysis of Natural Hazard and Climate Change Risks in Periurban<br />
Expansion Areas of Dakar, Senegal (Hoff man 2009); and Natural Disaster<br />
Hotspots: A Global Risk Analysis (Dilley et al. 2005). Some other commonly cited<br />
works include Moser et al. (2008); Bicknell, Dodman, and Satterthwaite (2009);<br />
UN-HABITAT’S State of the <strong>World</strong>’s Cities (2008–09); <strong>World</strong> Watch Institute’s<br />
State of the <strong>World</strong>: Our Urban Future (2007); Yusuf and Francisco (2009); Nicholls<br />
et al. (2007); Peduzzi, Dao, and Herold (2005); Pelling (2003); and Hardoy,<br />
Mitlin, and Satterthwaite (2001).<br />
Apart from location, other aspects related to housing have recently gained<br />
attention in the context of the urban poor, <strong>climate</strong> <strong>change</strong>, and DRR in developing<br />
countries: quality (Kenny 2009; Sezen et al. 2002; Ruskulis 2002; Lewis<br />
2003); access to credit markets (Moser et al. 2008); and tenure security (Moser<br />
et al. 2008; Lall et al. 2004; Wamsler 2007). Th is is signifi cant, since most of<br />
the existing research addresses developed countries (Bin et al. 2008 and 2004;<br />
Kerry Smith et al. 2006; Nakagawa, Saito, and Yamaga 2007; Greenstone and<br />
Gallagher 2008).<br />
In 2005, the <strong>World</strong> Bank’s Natural Disaster Hotspots: A Global Risk Analysis<br />
concluded that global data for assessing <strong>disaster</strong> <strong>risk</strong>s for urban areas is suffi -<br />
ciently well-developed. Indeed, social scientists have a lot of data (though most<br />
of it focuses on coastal cities) that shows that some cities are more hazard-prone<br />
than others (Pillai et al. 2010; Lall and Deichmann 2009; Bicknell, Dodman, and<br />
Satterthwaite 2009<strong>World</strong> Bank 2005). UN-HABITAT’S State of the <strong>World</strong>’s Cities<br />
(2008–09) reports a study by the Centre for Urban Studies, Bangladesh (2005)<br />
which shows that slum settlements in Dhaka are already most vulnerable during<br />
cyclones and heavy rainfall. Climate <strong>change</strong> and rising sea levels would make<br />
these areas more vulnerable to fl ooding, but they would also aff ect the city’s nonslum<br />
areas. A recent study by the <strong>World</strong> Bank (Pillai et al. 2010) is unique in that
132 ■ CLIMATE CHANGE, DISASTER RISK, AND THE URBAN POOR<br />
it examines specifi c areas inhabited by the poor within three “hotspot” cities—<br />
Ho Chi Minh City, Bangkok, and Manila.<br />
Many studies have also attempted to explain why the poor continue to live in<br />
hazard-prone areas despite knowing that they are at <strong>risk</strong>—reasons being proximity<br />
to the workplace and unaff ordable local transport networks. Th e <strong>disaster</strong>proneness<br />
of their housing is, in turn, refl ected in its low pricing and maintenance<br />
(Lall, Lundberg, and Shalizi 2008; Bin et al. 2004, 2008).<br />
It would be a mistake, however, to conclude that the poor are helpless victims,<br />
unable to fend for themselves. In her study in San Salvador, Wamsler (2006,<br />
2007) found that the slum dwellers she interviewed spent nearly 10 percent of<br />
their income on activities, like construction, related to <strong>disaster</strong> <strong>risk</strong> reduction.<br />
Wamsler concluded that vast diff erences exist in urban coping strategies that are<br />
not fully understood by the development community—which, she says, has so far<br />
focused on the rural poor. She also argues that urban coping strategies are more<br />
focused on housing construction and land issues than rural coping strategies.<br />
Th is needs to be explored further.<br />
A study that raises important questions for city planners was done by Jollands<br />
et al. (2005) in Hamilton City, New Zealand. Th e study found that the city’s infrastructure<br />
systems were not very responsive to gradual <strong>climate</strong> <strong>change</strong>, such as<br />
heat waves and drought. Th is was because the main potential vulnerability to<br />
<strong>climate</strong> <strong>change</strong> of the built environment has traditionally been associated with<br />
extreme events, such as fl oods and storms. However, as the large death toll following<br />
Europe’s 2003 heat wave demonstrated that gradual <strong>climate</strong> <strong>change</strong> can<br />
be as dangerous and life-threatening as sudden <strong>disaster</strong>s and deserves as much<br />
attention.<br />
To conclude, the linkage of housing to <strong>climate</strong> <strong>change</strong> and DRR did not<br />
receive much attention in until very recently, especially in the context of developing<br />
countries. As a result, the published research has major gaps, even on basic<br />
details such as how many poor people living in cities face environmental <strong>risk</strong>s<br />
as compared to the non-poor living in the same city or as compared to rural<br />
populations. A thorough examination of housing issues faced by the urban poor<br />
through the lens of <strong>climate</strong> <strong>change</strong> and DRR is required to gain knowledge of the<br />
specifi c challenges faced by the poor as a result of changing <strong>climate</strong> patterns and<br />
frequent extreme weather. Such an examination will also help lead to possible<br />
solutions to address the development challenges posed by <strong>climate</strong> <strong>change</strong>.<br />
Climate Change: Adaptation and Mitigation<br />
Many reports already recognize that <strong>climate</strong> <strong>change</strong> adaptation is more<br />
urgent and fair than mitigation for cities in developing countries. Th e poor
ANNEX 1: LITERATURE REVIEW ■ 133<br />
contribute least to greenhouse gas emissions but face the highest <strong>risk</strong>s since<br />
they tend to live in low-cost, hazardous areas in cities with little or no access<br />
to basic services that could make them more resilient to extreme weather and<br />
events like earthquakes and storm surges. Th us adaptation through basic services<br />
provided by the government and increasingly public-private partnerships<br />
has earned most attention in the context of the urban poor and <strong>climate</strong><br />
<strong>change</strong> (Sattherthwaite 2009).<br />
In some cases, the link between adaptation and basic services for the poor<br />
is less direct. Instead, as in the case of transport and energy, there are potential<br />
co-benefi ts for the urban poor in mitigation work in these sectors. For example,<br />
public transit mitigation projects that provide sustainable, low-carbon means of<br />
urban transport (if well planned) can signifi cantly improve access for the urban<br />
poor. Th e <strong>World</strong> Bank is currently supporting <strong>climate</strong>-friendly urban public<br />
transit projects in Mexico, Colombia, Egypt, Morocco, Philippines, Th ailand, and<br />
Vietnam (<strong>World</strong> Bank 2010c). For energy, one of the greatest challenges is getting<br />
energy services across to all urban residents. Access is defi ned as areas in the<br />
electricity grid extension, with statistics oft en found to be misleading (State of the<br />
<strong>World</strong>: Our Urban Future; <strong>World</strong> Watch Institute 2007). For instance, about onethird<br />
of Africans live in urban areas, and at least one-quarter of city dwellers on<br />
the continent do not have access to electricity. Researchers note that renewable<br />
energy sources that mitigate <strong>climate</strong> <strong>change</strong> can be used to provide energy to the<br />
urban poor. Prominent examples of this kind of work include fuel-effi cient cook<br />
stoves and solar water heaters.<br />
Th ere is a relatively large body of <strong>climate</strong> <strong>change</strong> adaptation literature related<br />
to the urban poor. Many studies have recognized that the poor, and especially<br />
the urban poor, are most vulnerable to <strong>climate</strong> <strong>change</strong> yet have limited adaptive<br />
capacity to take up adaptation. Th is literature includes Th e Cost to Developing<br />
Countries of Adapting to Climate Change (<strong>World</strong> Bank 2010a); Climate Risks<br />
and Adaptation in Asian Coastal Mega-Cities (Pillai et al. 2010); Shaping Climate<br />
Resilient Development—A Framework for Decision-making (ECA 2009); Adapting<br />
Cities to Climate Change (Bicknell, Dodman, and Satterthwaite 2009); and Social<br />
Dimensions of Climate Change (Mearns and Norton 2010).<br />
One counterpoint to this view is Pro-Poor Adaptation to Climate Change in<br />
Urban Centers (<strong>World</strong> Bank 2010b), which demonstrates that the urban poor are<br />
currently and actively adapting to <strong>change</strong>s in weather, while acknowledging that<br />
support for more substantial and long-term protective measures remains much<br />
needed.<br />
While adaptation and the urban poor are relatively well researched, mitigation<br />
and the urban poor is a topic on which less is available. Most mitigation<br />
eff orts are focused on large GHG emitters, and the urban poor are among the<br />
smallest GHG emitters. Th ere are important issues that relate to the urban poor
134 ■ CLIMATE CHANGE, DISASTER RISK, AND THE URBAN POOR<br />
in mitigation, such as how urban transport mitigation projects will impact and<br />
can benefi t the poor, as well as energy-effi cient housing. (See, for example, Our<br />
Urban Future; <strong>World</strong> Watch Institute, 2007). Low-carbon cookstoves are another<br />
area where mitigation is particularly important for the urban poor, who oft en<br />
face negative health impacts associated with using cookstoves that emit black<br />
carbon. Many projects have investigated low-carbon cookstoves that can reduce<br />
GHG emission and improve the health of users over other stoves, yet still cook<br />
effi ciently. For foundational information on mitigation, the study relies on the<br />
comprehensive work of the IPCC report on mitigation and WDR 2010.<br />
Finance<br />
Th ere are many sources of information on <strong>climate</strong> fi nance. Among the main<br />
studies are the well-known Stern Report (2007) on <strong>climate</strong> fi nance, which explicitly<br />
recognizes that <strong>climate</strong> <strong>change</strong> adaptation must reduce the vulnerability of<br />
the urban poor, and United Nations Framework Convention on Climate Change<br />
report on needed levels of <strong>climate</strong> fi nance. Th e <strong>World</strong> Bank has also done a study<br />
on combining fi nancial instruments for low-carbon development (<strong>World</strong> Bank<br />
2010c) and a major study on the economics of adaptation to <strong>climate</strong> <strong>change</strong><br />
(<strong>World</strong> Bank 2010a). Th e latter study consists of two parts: a global overview that<br />
estimates adaptation costs at US$75-100 billion per year to adapt to 20C of warming<br />
by 2050, and country case studies of the costs of adaptation detailed by sector.<br />
Two of the sectors with the highest anticipated adaptation costs are infrastructure<br />
and water, which are also key issues for the urban poor. Th e <strong>World</strong> Bank recently<br />
launched a <strong>climate</strong> fi nance website off ering a comprehensive list of <strong>climate</strong> funding<br />
sources for both adaptation and mitigation, including carbon fi nance, the<br />
Global Environment Fund, CIFs, Special Climate Change Fund, Least Developed<br />
Countries Fund, and Adaptation Fund.<br />
Gaps in Existing Literature<br />
As suggested in the review above, there are some major gaps in existing literature<br />
on <strong>climate</strong> <strong>change</strong>, DRR, and the urban poor. Th ese include the following:<br />
• Lack of detailed quantitative analysis from developing countries that disaggregates<br />
urban versus rural and poor versus non-poor.<br />
• Lack of explicit connections between <strong>climate</strong> <strong>change</strong> and DRR for the urban<br />
poor.<br />
• Limited documentation of practical examples of best practices in <strong>climate</strong><br />
<strong>change</strong> adaptation for the urban poor.
ANNEX 1: LITERATURE REVIEW ■ 135<br />
• Emphasis of most studies on natural <strong>disaster</strong>s, with less attention on gradual<br />
<strong>change</strong>s in weather induced by <strong>climate</strong> <strong>change</strong>, which have a less immediate<br />
but more drastic long-term impact on human populations.<br />
• Most analysis on <strong>climate</strong> impact assessments and cities being focused on<br />
coastal cities, neglecting inland cities where, for instance, a heat-island eff ect,<br />
cold waves, and droughts may be more pronounced.<br />
• Limited literature on housing and sector-specifi c provision of services for the<br />
urban poor in the context of <strong>climate</strong> <strong>change</strong> and DRR.<br />
• Limited current knowledge on basic services and how they can help reduce<br />
the vulnerability of the urban poor, especially in operational terms. Sample<br />
topics include how better services can be provided to the poor, given <strong>climate</strong><br />
<strong>change</strong> impacts; which sectors require priority interventions; how bottomup<br />
collaborative policy making may be blended with existing scientifi c<br />
know-how; and what fi nancing mechanisms can be drawn on.<br />
• As pointed out by the IPCC (2007), scholars’ lack of attention to the uncertainties<br />
associated with <strong>climate</strong> <strong>change</strong> and its implications for the human<br />
populations, let alone the urban poor.<br />
References<br />
African Development Bank, Asian Development Bank, U.K. Department for International<br />
Development, DGDev, BMZ, MinBuza, Organisation for Economic Co-operation and<br />
Development, United Nations Development Programme, United Nations Environment<br />
Programme, and <strong>World</strong> Bank. 2009. Poverty and Climate Change: Reducing the<br />
Vulnerability of the Poor through Adaptation.<br />
Baker, Judy. 2008. Urban Poverty: A Global View. Washington, DC: <strong>World</strong> Bank.<br />
———, R. Basu, M. Cropper, S. Lall, and A. Takeuchi. 2005. “Urban Poverty and Transport:<br />
Th e Case of Mumbai.” Policy Research Working Paper 3683, <strong>World</strong> Bank, Washington,<br />
DC.<br />
Bicknell, Jane, David Dodman, David Satterthwaite, eds. 2009. Adapting Cities to Climate<br />
Change: Understanding and Addressing the Development Challenges. London:<br />
Earthscan.<br />
Bin, O., J. Brown Kruse, and C.E. Landry. 2008. “Flood Hazards, Insurance Rates, and<br />
Amenities: Evidence from the Coastal Housing Market.” Journal of Risk and Insurance<br />
75 (1): 63–82.<br />
Bin, Okmyung, and Stephen Polasky. 2004. “Eff ects of Flood Hazards on Property Values:<br />
Evidence before and aft er Hurricane.” Land Economics 80 (4): 490–500.<br />
Birkmann, et al. 2009. Addressing the Challenge: Recommendations and Quality Criteria<br />
for Linking Disaster Risk Reduction and Adaptation to Climate Change. DKKV Publications<br />
Series 38. Bonn: German Committee for Disaster Reduction.<br />
Centre for Urban Studies, MEASURE Evaluation, and National Institute of Population<br />
Research and Training. 2006. Slums of Urban Bangladesh: Mapping and Census, 2005.<br />
Dhaka: Centre for Urban Studies.
136 ■ CLIMATE CHANGE, DISASTER RISK, AND THE URBAN POOR<br />
Danilenko, Alexander, Eric Dickson, and Michael Jacobsen. 2010. Climate Change and<br />
Urban Water Utilities: Challenges and Opportunities. Water Working Notes. Washington,<br />
DC: <strong>World</strong> Bank.<br />
DFID, 2004. Disaster Risk Reduction: A Development Concern. London.<br />
Dilley, Maxx, Robert S. Chen, Uwe Deichmann, Art L. Lerner-Lam, and Margaret Arnold.<br />
2005. Natural Disaster Hotspots: A Global Risk Analysis. Washington, DC: <strong>World</strong> Bank/<br />
Columbia University.<br />
Douglas, Ian, Kurshid Alam, Maryanne Maghenda, Yasmin Mcdonnell, Louise Mclean,<br />
and Jack Campbell. 2008. “Unjust Waters: Climate Change, Flooding and the Urban<br />
Poor in Africa.” Environment and Urbanization 20 (1): 187–205.<br />
Economics of Climate Adaptation (ECA) Working Group. 2010. Shaping Climate-Resilient<br />
Development: A Framework for Decision-Making.<br />
Fay, Marianne, Rachel Block, and Jane Ebinger, eds. 2010. Adapting to Climate Change in<br />
Eastern Europe and Central Asia. Washington DC: <strong>World</strong> Bank.<br />
Greenstone, M., and J. Gallagher. 2008. “Does Hazardous Waste Matter? Evidence from<br />
the Housing Market and the Superfund Program.” Quarterly Journal of Economics 123<br />
(3): 951–1003.<br />
Haines, et al. 2007. “Policies for Accelerating Access to Clean Energy, Improving<br />
Health, Advancing Development, and Mitigating Climate Change.” Th e Lancet 370<br />
(6): 1264–1281.<br />
Hardoy, J.G., D. Mitlin, and D. Satterthwaite. 2001. Environmental Problems in an Urbanizing<br />
<strong>World</strong>. London: Earthscan.<br />
Hoff man, Christian. 2009. “Spatial Analysis of Natural Hazard and Climate Change Risks<br />
in Per-Urban Expansion Areas of Dakar, Senegal.” Presented at the <strong>World</strong> Bank Urban<br />
Learning Week 2009.<br />
Intergovernmental Panel on Climate Change (IPCC). 2001. IPCC Th ird Assessment Report:<br />
Climate Change 2001.<br />
———. 2007. IPCC Fourth Assessment Report: Climate Change 2007.<br />
International Strategy for Disaster Reduction (ISDR). 2009. Global Assessment<br />
Report on Disaster Risk Reduction. Geneva: UN International Strategy for Disaster<br />
Reduction.<br />
Jha, Abhas, with Jennifer Duyne Barenstein, Priscilla M. Phelps, Daniel Pittet, and Stephen<br />
Sena. 2010. Safer Homes, Stronger Communities: A Handbook for Reconstructing Aft er<br />
Natural Disasters. Washington, DC: <strong>World</strong> Bank Global Facility for Disaster Reduction<br />
and Recovery (GFDRR).<br />
Jollands, N., M. Ruth, C. Bernier, and N. Golubiewski. 2005. “Climate’s Long-term Impacts<br />
on New Zealand Infrastructure—A Hamilton City Case Study.” Ecological Economics<br />
in Action. New Zealand Centre for Ecological Economics, Palmerston North, New<br />
Zealand.<br />
Juneja, Shefali. 2008. Disasters and Poverty: Th e Risk Nexus. A Review of Literature.<br />
Background Paper for the 2009 ISDR Global Assessment Report on Disaster Risk<br />
Reduction. United Nations International Strategy for Disaster Reduction Secretariat,<br />
Geneva.<br />
Kebede, B., and I. Dube. 2004. Energy Services for the Urban Poor in Africa: Issues and<br />
Policy Implications. London: Zed Books in Association with the African Energy Policy<br />
Research Network.
ANNEX 1: LITERATURE REVIEW ■ 137<br />
Kenny, Charles. 2009. “Why Do People Die in Earthquakes? Th e Costs, Benefi ts and Institutions<br />
of Disaster Risk in Developing Countries.” Policy Research Working Paper,<br />
<strong>World</strong> Bank, Washington, DC.<br />
Kerry Smith, V., Jared C. Carbone, Jaren C. Pope, Daniel G. Hallstrom, and Michael E.<br />
Darden. 2006. “Adjusting to Natural Disasters.” Journal of Risk and Uncertainty 33:<br />
37–54.<br />
Kovats, S., and R. Akhtar. 2008. “Climate, Climate Change and Human Health in Asian<br />
Cities.” Environment and Urbanization 20 (1): 165–175.<br />
Kreimer, Alcira, and Arnold, Margeret. 2000. Managing Disaster Risk in Emerging Economies.<br />
Washington, DC: <strong>World</strong> Bank.<br />
Kreimer, Alcira, et al., eds. 2003. Building Safer Cities: Th e Future of Disaster Risk. Washington,<br />
DC: <strong>World</strong> Bank.<br />
Lall, S.V., and U. Deichmann. 2009. “Density and Disasters: Economics of Urban Hazard<br />
Risk.” Policy Research Working Paper 5161, <strong>World</strong> Bank, Washington, DC.<br />
Lall, Somik, Uwe Deichmann, Mattias Lundberg, and Nazmul Chaudhury. 2004. “Tenure,<br />
Diversity, and Commitment: Community Participation for Urban Service Provision,<br />
Journal of Development Studies 40 (3): 1–26.<br />
Lall, Somik V., Mattias Lundberg, and Zmarak Shalizi. 2008. “Implications of alternate<br />
policies on welfare of slum dwellers: Evidence from Pune, India.” Journal of Urban Economics<br />
63: 56–73.<br />
Lewis, Dan, and Jaana Mioch. 2005. “Urban Vulnerability and Good Governance.” Journal<br />
of Contingencies and Crisis Management 13 (2): 50–53.<br />
Lewis, James. 2003. “Housing Construction in Earthquake-Prone Places: Perspectives,<br />
Priorities and Projections for Development.” Th e Australian Journal of Emergency<br />
Management 18 (2): 35–44.<br />
Mearns, Robin, and Andrew Norton. 2010. Social Dimensions of Climate Change: Equity<br />
and Vulnerability in a Warming <strong>World</strong>. Washington DC: <strong>World</strong> Bank.<br />
Mehrotra, S., Claudia Natenzon, Ademola Omojola, Regina Folorunsho, Joseph Gilbride,<br />
and Cynthia Rosenzweig. 2009. “Framework for City Climate Risk Assessment.” <strong>World</strong><br />
Bank Commissioned Research presented at the Fift h Urban Research Symposium,<br />
<strong>World</strong> Bank, Washington DC.<br />
Montgomery, Mark, 2009. “Urban Poverty and Health in Developing Countries.” Population<br />
Bulletin 64(2).<br />
Moser, Caroline, A. Norton, A. Stein, and S. Georgeiva. 2010. “Pro-Poor Climate Change<br />
Adaptation in the Urban Centres of Low- and Middle-Income Countries. Case Studies<br />
of Vulnerability and Resilience in Kenya and Nicaragua,” <strong>World</strong> Bank, Social Development,<br />
Report Number 54947-GLB.<br />
Nakagawa, Masayuki, Makoto Saito, and Hisaka Yamaga. 2007. “Earthquake Risk and<br />
Housing Rents: Evidence from the Tokyo Metropolitan Area.” Regional Science and<br />
Urban Economics 37: 87–99.<br />
Nicholls, R.J., C. Hanson, N. Herweijer, S. Patmore, J. Hallegatte, J. Corfee-Morlot,<br />
R. Château, and R. Muir-Wood,. 2007. Ranking Port Cities with High Exposure<br />
and Vulnerability to Climate Change: Exposure Estimates. Environment Working<br />
Paper 1. OECD.<br />
O’Brien, G., Phil O’Keefe, and, Joanne Rose, Ben Wisner. 2006. “Climate Change and<br />
Disaster Management.” Disasters 30 (1): 64–80.
138 ■ CLIMATE CHANGE, DISASTER RISK, AND THE URBAN POOR<br />
Olvera, Lourdes Diaz. 2009. Climate Change, the Permanence of Mobility, Urban Transport,<br />
and Poverty in Sub-Saharan Africa (Changements Climatiques, Permanence de la Mobilite,<br />
Transports Urbains et Pauvrete en Afrique Subsaharienne).<br />
Parikh, H., and P. Parikh. 2009. “Slum Networking–A Paradigm Shift to Transcend Poverty<br />
with Water, Environmental Sanitation and Hidden Resources.” In Water and<br />
Urban Development Paradigms, ed. Feyen, Shannon, and Neville. London: Taylor and<br />
Francis.<br />
Parkinson, J., and O. Mark. 2005. Urban Stormwater Management in Developing Countries.<br />
UK: IWA Publishing.<br />
Peduzzi, P., H. Dao, and C. Herold. 2005. “Mapping Disastrous Natural Hazards Using<br />
Global Datasets.” Natural Hazards 35 (2): 265–289.<br />
Pelling, Mark. 2003. Th e Vulnerability of Cities: Natural Disasters and Social Resilience.<br />
London: Earthscan.<br />
Prasad, Neeraj, Federica Ranghieri, Fatima Shah, Zoe Trohannis, Earl Kessler and Ravi<br />
Sinha. 2009. Climate Resilient Cities. A Primer on Reducing Vulnerabilities to Disasters.<br />
Washington, DC: <strong>World</strong> Bank.<br />
Ruskulis, Otto. 2002. “Developing Processes for Improving Disaster Mitigation of the<br />
Urban Poor.” Basin News (Building Advisory Service and Information Network) 23<br />
(June). SKAT St Gallen.<br />
Sanchez-Rodriguez, Roberto. 2009. “Learning to Adapt to Climate Change in Urban<br />
Areas: A Review of Recent Contributions.” Current Opinion in Environmental Sustainability.<br />
Satterthwaite, David. 2009. Shaping Urban Environment: Cities Matter. London: International<br />
Institute for Environment and Development.<br />
———. Saleemul Huq, Hannah Reid, Mark Pelling and Patricia Romero Lankao. 2007.<br />
Adapting to Climate Change in Urban Areas: Th e Possibilities and Constraints in Low-<br />
and Middle-Income Nations. London: International Institute for Environment and<br />
Development.<br />
Sezen, H., A. Whittaker, K. Elwood, and K. Mosalam. 2002. “Performance of Reinforced<br />
Concrete Buildings during the August 17, Kocaeli, Turkey Earthquake, and Seismic<br />
Design and Construction Practice in Turkey. Engineering Structures 25 (1): 103–114.<br />
Stern, Nicholas. 2007. Th e Economics of Climate Change: Th e Stern Review. Cambridge,<br />
UK: Cambridge University Press.<br />
United Nations Development Programme (UNDP). 2007. Human Development Report<br />
2007/2008: Fighting Climate Change: Human Solidarity in a Divided <strong>World</strong>. New York:<br />
UNDP.<br />
UN-HABITAT. 2008. Harmonious Cities: State of the <strong>World</strong>’s Cities 2008/9. London/<br />
Sterling, VA: Earthscan Publications Ltd.<br />
Wamsler, Christine. 2006. “Understanding Disasters from a Local Perspective:<br />
Insights into Improving Assistance for Social Housing and Settlement Development.”<br />
TRIALOG (Journal for Planning and Building in the Th ird <strong>World</strong>) 91(December),<br />
special issue on “Building on Disasters.”<br />
———. 2007. “Bridging the Gaps: Stakeholder-Based Strategies for Risk Reduction and<br />
Financing for the Urban Poor.” Environment and Urbanization 19 (1): 115–142.<br />
Wilson, David C. 2007. “Development Drivers for Waste Management.” Waste Management<br />
& Research 25 (3): 198–207
ANNEX 1: LITERATURE REVIEW ■ 139<br />
<strong>World</strong> Bank. 2002. Cities on the Move. Urban Transport Strategy Review. Washington,<br />
DC: <strong>World</strong> Bank. http://siteresources.worldbank.org/INTURBANTRANSPORT/<br />
Resources/cities_on_the_move.pdf accessed 13/7/2010.<br />
———. 2004. <strong>World</strong> Development Report 2004: Making Services Work for Poor People.<br />
Washington, DC: <strong>World</strong> Bank.<br />
———. 2005. Natural Disaster Hotspots: A Global Risk Analysis. Washington, DC:<br />
<strong>World</strong> Bank.<br />
———. 2006. Hazards of Nature, Risks to Development. Washington, DC: <strong>World</strong> Bank.<br />
———. 2009. <strong>World</strong> Development Report 2009: Reshaping Economic Geography. Washington,<br />
DC: <strong>World</strong> Bank.<br />
———. 2010a. Th e Cost to Developing Countries of Adapting to Climate Change. Washington,<br />
DC: <strong>World</strong> Bank.<br />
———. 2010b. Pro-Poor Adaptation to Climate Change in Urban Centers: Case Studies of<br />
Vulnerability and Resilience in Kenya and Nicaragua. Washington, DC: <strong>World</strong> Bank.<br />
———. 2010c. <strong>World</strong> Development Report 2010: Climate Change and Development. Washington,<br />
DC: <strong>World</strong> Bank.<br />
———. 2010d. Climate Risks and Adaptation in Asian Coastal Mega-Cities: A Synthesis<br />
Report. Washington, DC: <strong>World</strong> Bank.<br />
<strong>World</strong> Business Council for Sustainable Development (WBCSD). 2002. Mobility 2001:<br />
<strong>World</strong> Mobility at the End of the Twentieth Century, and Its Sustainability. WBCSD.<br />
http://www.wbcsd.org/DocRoot/EdJHZvhMSfrbALJqnQvF/english_full_report.pdf.<br />
———. 2004a. Mobility 2030: Meeting the Challenges to Sustainability. <strong>World</strong> Bank Urban<br />
Transport Transformation Project (UTTP) in Mexico. http://www.wbcsd.org/web/<br />
publications/mobility/mobility-full.pdf.<br />
<strong>World</strong> Health Organization (WHO). 2009. Protecting Health from Climate Change: Global<br />
Research Priorities. Switzerland: WHO.<br />
<strong>World</strong> Watch Institute. 2007. State of the <strong>World</strong> 2007: Our Urban Future. New York: Norton.<br />
Yusuf, A.A., and H.A. Francisco. 2009. Climate Change Vulnerability Mapping for South<br />
Asia. Singapore: EEPSEA. http://www.idrc.ca/uploads/user-S/12324196651Mapping_<br />
Report.pdf.
Annex 2: Efforts to Estimate<br />
Exposure in Cities<br />
Studies have estimated the magnitude of urban exposure to natural hazards and<br />
<strong>climate</strong> <strong>change</strong> impacts, yet none to date have integrated exposure of population<br />
and of economic assets, as well as the impacts of natural hazards and <strong>climate</strong><br />
<strong>change</strong> at the urban scale. While these approaches have their own limitations<br />
in rigorously quantifying aggregate vulnerability to <strong>climate</strong> and natural-hazard<br />
impacts given the high degree of complexity and uncertainty, they provide a useful<br />
macro-level look at <strong>risk</strong> and exposure in cities. Below is a brief discussion of<br />
fi ve studies, along with key fi ndings, that have attempted such rankings. Each<br />
approaches urban <strong>risk</strong> from a diff erent angle, covering diff erent sets of cities, different<br />
types of hazards, diff erent timeframes, and diff erent asset measurements.<br />
Th at being said, all approaches confi rm that such <strong>risk</strong> is increasing and that with<br />
the increasing manifestations of <strong>climate</strong> <strong>change</strong>, the <strong>risk</strong> will signifi cantly worsen<br />
in the coming decades.<br />
OECD Study on Ranking Port Cities with High Exposure and<br />
Vulnerability to Climate Extremes 1<br />
Th e Organization for Economic Co-operation and Development (OECD) published<br />
an index ranking 136 port cities with populations over 1 million with high<br />
exposure to 1-in-100-year, surge-induced fl oods. Th e index looks at the exposure<br />
■ 141
142 ■ CLIMATE CHANGE, DISASTER RISK, AND THE URBAN POOR<br />
of population and assets in 2005 and those predicted in 2070. Future predictions<br />
account for population growth, urbanization, ground subsidence, and climatic<br />
<strong>change</strong>s.<br />
Th e OECD study shows that across all cities, about 40 million people<br />
(0.6 percent of the global population or roughly 1 in 10 of the total port city<br />
population in the cities considered here) are exposed to a 1-in-100-year coastal<br />
fl ooding. Th e exposure, as of 2005, is concentrated in a few cities: Mumbai,<br />
Guangzhou, Shanghai, Miami, Ho Chi Minh City, Kolkata, Greater New York,<br />
Osaka-Kobe, Alexandria, and New Orleans.<br />
Th e study shows that cities in Asia overwhelmingly have the highest exposure<br />
to surge-induced fl ooding now and in the future. Of the 20 cities with the highest<br />
population exposure in 2005, half are in low- and middle-income nations in<br />
Asia. Of the total 38.5 million people currently exposed, 65 percent live in Asian<br />
cities. Table A2.1 shows the top 20 port cities with exposed populations in 2005.<br />
Th e index predicts that, in the 2070s, 17 out of the 20 cities with the highest<br />
population exposure will be in present-day low- and middle-income countries,<br />
TABLE A2.1<br />
Port Cities with Populations over 1 Million Estimated to Have<br />
Highest Increased Exposure to Surge-Induced Floods, 2005 to 2070<br />
City Country<br />
Population<br />
2005<br />
(thousands)<br />
Population<br />
exposed 2005<br />
(thousands)<br />
Population<br />
exposed 2070<br />
(thousands)<br />
Increase<br />
(percent)<br />
Quingdao China 2,817 88 1,851 2,103<br />
Luanda Angola 2,766 1 18 1,800<br />
Dhaka Bangladesh 12,430 844 11,135 1,319<br />
Mogadishu Somalia 1,320 9 115 1,278<br />
Conakry Guinea 1,425 41 496 1,210<br />
Chittagong Bangladesh 4,114 255 2,866 1,124<br />
Ningbo China 1,810 299 3,305 1,105<br />
Dar es Salaam Tanzania 2,676 36 351 975<br />
Yangon Myanmar 4,107 510 4,965 974<br />
Karachi Pakistan 11,608 49 473 965<br />
Douala Cameroon 1,761 11 101 918<br />
Lagos Nigeria 10,886 357 3,229 904<br />
Kulna Bangladesh 1,495 441 3,641 826<br />
N’ampo Rep. of Korea 1,102 22 181 823<br />
Port-au-Prince Haiti 2,129 1 8 800<br />
Source: Nicholls et al. (2008).
ANNEX 2: EFFORTS TO ESTIMATE EXPOSURE IN CITIES ■ 143<br />
and 14 out of the 20 will be in Asia (four in China and two in Bangladesh). Asia’s<br />
increasing dominance in terms of population and asset exposure is a result of<br />
increased urbanization and economic growth during the period, compared with<br />
other regions.<br />
When assets are considered across all cities, the current distribution becomes<br />
more heavily weighted toward developed countries, as the wealth of the cities<br />
becomes important. Th e total value of assets exposed in 2005 is estimated to be<br />
US$3,000 billion, corresponding to around 5 percent of global GDP in 2005 (both<br />
measured in U.S. dollars). Th e top 10 cities in this ranking are Miami, Greater<br />
New York, New Orleans, Osaka-Kobe, Tokyo, Amsterdam, Rotterdam, Nagoya,<br />
Tampa-St Petersburg, and Virginia Beach. Th ese cities contain 60 percent of the<br />
total exposure, but are from only three (wealthy) countries: the United States,<br />
Japan, and the Netherlands.<br />
Munich Re’s Study on Megacities—Megacities Mega<strong>risk</strong>s<br />
Munich Re Group’s NatCat database was used to prepare a natural hazard <strong>risk</strong><br />
index for 50 of the world’s largest (population over 2 million) and most economically<br />
important cities (city GDP as a percentage of a country’s GDP). Th e analysis<br />
covers 30 large cities in low- and middle-income nations and 20 large cities in<br />
high-income nations. Th is index, which was intended as the basis for discussion,<br />
was the fi rst international index for cities to take a multi-hazard perspective<br />
including earthquakes, windstorms, fl oods, volcanic eruption, bush fi res, and<br />
winter storms.<br />
Th e index is composed of three variables: exposure to hazards, vulnerability<br />
of the built environment, and value of exposed property. Vulnerability is<br />
based on an estimation of the vulnerability of the predominant form of residential<br />
construction to hazards; the standard of preparedness and safeguards<br />
including building regulations; urban planning in respect of specifi c hazards<br />
and fl ood protection; and building density. Th e values of exposed property are<br />
estimated using the average values per household and the GDP for commerce<br />
and industry.<br />
Th e index is most heavily infl uenced by values of exposed assets and their<br />
degree of vulnerability. Tokyo is, by far, the city at highest <strong>risk</strong>, followed by San<br />
Francisco. Of the 20 highest-<strong>risk</strong> cities in the index, 17 are in high-income countries,<br />
which is to be expected given that the index is trying to gauge the <strong>risk</strong> for<br />
insurers and thus the value of exposed assets. Th ese assets are greater in highincome<br />
countries and thus become important in understanding the potential for<br />
economic losses in a <strong>disaster</strong>.
144 ■ CLIMATE CHANGE, DISASTER RISK, AND THE URBAN POOR<br />
GFDRR—Economics of Disaster Risk Reduction<br />
In this study (Brecht, Deichmann, and Wang 2010), city-specifi c population projections<br />
to 2050 are combined with geographic patterns of hazards representative<br />
of the 1975–2007 period. Th e projected number of people exposed to tropical<br />
cyclones and earthquakes in large cities in 2050 more than doubles, rising<br />
from 310 million in 2000 to 680 million in 2050 for tropical cyclones, and from<br />
370 million to 870 million for earthquakes. Th e growing exposure continues to<br />
vary by region. By 2050, there will be 246 million city dwellers in cyclone-prone<br />
areas in South Asia, but 160 million each in the OECD and East Asian countries.<br />
Although East Asia has fewer exposed people, the urban population exposed to<br />
cyclones is expected to grow at 2.2 percent a year, similar to South Asia’s. Sub-<br />
Saharan Africa’s exposure growth at 3.5 percent is even higher due to the projected<br />
high urbanization rates, reaching 21 million urban dwellers by 2050.<br />
Exposure to earthquakes will likely remain most prominent in East Asia. It is<br />
also high in Latin America and the Caribbean, and OECD countries. Th e fastest<br />
growth in exposure is in South Asia (3.5 percent), followed by Sub-Saharan<br />
Africa, linked to rapid urbanization in these regions.<br />
Mega-Stress for Mega-Cities: A Climate Vulnerability<br />
Ranking of Major Coastal Cities in Asia<br />
Th e <strong>World</strong> Wildlife Fund (WWF) assessed the <strong>climate</strong> <strong>change</strong> vulnerabilities of<br />
11 large cities in Asia, most of them coastal (WWF 2009). WWF’s work focuses<br />
on <strong>climate</strong> vulnerability and adaptive capacity in these cities. Th e study gave<br />
each city a vulnerability score based on the combined rankings of its exposure,<br />
sensitivity, and adaptive capacity. Each is rated by a point system; for example,<br />
exposure is measured by assigning a point value for (1) frequency of tropical<br />
storms, (2) frequency of extreme weather including fl ood and drought, and (3)<br />
potential impact of a 1meter rise in sea level. Based on this point attribution,<br />
Dhaka, Jakarta, and Manila are ranked as the most exposed of the 11 cities<br />
studied. Th ese same cities are ranked highest on overall vulnerability as well.<br />
WWF’s index is unique in that it focuses specifi cally on <strong>climate</strong> <strong>change</strong> in a<br />
select number of cities predetermined to be particularly vulnerable. Th e study<br />
uses uniform measurements across the cities to make them comparable; however,<br />
the assigned units to rank vulnerability are not easily translatable in the fi nal analysis.<br />
It is not clear, for example, why Dhaka has a vulnerability of 9, while Jakarta<br />
and Manila have a vulnerability of 8 (on a 10-point scale), or what a one-point<br />
diff erence in vulnerability means. Because the study is limited to only 11 Asian<br />
cities, it is also diffi cult to imagine how these rankings could be used to compare
ANNEX 2: EFFORTS TO ESTIMATE EXPOSURE IN CITIES ■ 145<br />
vulnerability with other cities. A further point of interest in this comparison is<br />
that the ranking order of the cities is very similar for each of the three factors that<br />
are aggregated to measure vulnerability (exposure, sensitivity, adaptive capacity).<br />
Earthquake Disaster Risk Index<br />
Th e Earthquake Disaster Risk Index (EDRI) was developed by the John A. Blume<br />
Earthquake Engineering Center at Stanford University (Davidson and Shah<br />
1997). Th e index is a composite that accounts for various city characteristics<br />
across fi ve components to assess earthquake <strong>risk</strong>: hazard, exposure, vulnerability,<br />
external context, and emergency response, and recovery. Each of these factors<br />
uses several data inputs with diff ering weights. For example, the exposure<br />
component is calculated using population, per capita GDP, number of housing<br />
units, and urbanized land area. Th e overall <strong>risk</strong> formula provides a fi nal <strong>risk</strong> value<br />
between 1 and 100 for each city. In a 10-city sample, the mean <strong>risk</strong> was 40, with a<br />
range between 35 (for St. Louis) and 54 (for Tokyo).<br />
Th e index increases its robustness by requiring a number of data points for<br />
input, but some data can be diffi cult to access in some cities, such as city per capita<br />
GDP or housing vacancy rate. Additionally, while this index allows for intercity<br />
<strong>risk</strong> comparison and potential wise distribution of resources, indexed data<br />
are readily available for only 10 cities (Boston, Istanbul, Jakarta, Lima, Manila,<br />
Mexico City, San Francisco, Santiago, St. Louis, and Tokyo).<br />
Multi-Hazard City Risk Index (MHCRI)<br />
Th is is a pilot initiative under the Resilient Cities program in the <strong>World</strong> Bank’s<br />
East Asia Region. An initial methodology has been developed and piloted in<br />
three cities—Bangkok, Th ailand, in collaboration with the Bangkok Metropolitan<br />
Administration; Metro Manila, Philippines, in collaboration with the Metropolitan<br />
Manila Development Authority; and Ningbo, China, in collaboration<br />
with NMBG, Ltd. (<strong>World</strong> Bank, 2011). Th e index provides the fi rst methodology<br />
to quantify and aggregate <strong>risk</strong> across a range of 13 hydromet and seismic<br />
hazards in a standardized way in order to compare across cities as well as areas<br />
(for example, districts) within a city. It aims to provide an aggregate picture of<br />
<strong>risk</strong> to national and city policy makers and planners and guidance on areas of<br />
focus for prospective <strong>risk</strong> management. Th e index relies on a basic multiplicative<br />
<strong>risk</strong> model that draws on data related to metropolitan elements (population<br />
subclasses, building types, and infrastructure sectors); calculates hazard indices<br />
for each hazard type (based on frequency, intensity, and area aff ected); and
146 ■ CLIMATE CHANGE, DISASTER RISK, AND THE URBAN POOR<br />
assesses vulnerabilities (based on 30 parameters related to physical susceptibility,<br />
socioeconomic fragility, and institutional and regulatory resilience). While<br />
exposure to people and capital stock can be extracted from the model, the primary<br />
outputs are <strong>risk</strong> scores for the city. Risk can be assessed at the citywide or<br />
submunicipal scale, for all metropolitan elements or a specifi c one, for all hazard<br />
types or a specifi c one. Th e outputs are for two time periods—current (2010)<br />
and future (2030), where future scenarios are generated based on high and low<br />
hazards (accounting for <strong>climate</strong> <strong>change</strong>), and <strong>change</strong>s to population and builtup<br />
area based on government planning and investment documents. Th e fi nal<br />
city scores are still being fi nalized and the methodology will be further refi ned<br />
in a follow-up phase. In addition, a website is under development that will allow<br />
users to select the parameters of interest and generate <strong>risk</strong> maps accordingly; the<br />
site will also allow users to simulate policy <strong>change</strong>s and resulting implications to<br />
the <strong>risk</strong> maps.<br />
Although the results from the studies reviewed above address urban <strong>risk</strong> from<br />
diff erent angles, they all confi rm that such <strong>risk</strong> is increasing and that with growing<br />
<strong>climate</strong> <strong>change</strong> the <strong>risk</strong> will continue to increase signifi cantly in the coming<br />
decades. Th e results provide a call for action in addressing urban <strong>risk</strong>, and<br />
especially in those countries of the developing world that are the least prepared<br />
to manage the <strong>risk</strong>’s implications, including fi nancial requirements and organizational<br />
challenges (see fi gure A2.1 in the color section).<br />
Note<br />
1. Nicholls et al. (2007). Also see Hallegatte et al. (2010, 2011).<br />
References<br />
Brecht, H., U. Deichmann, and H. Gun Wang. 2010. “Predicting Future Urban Natural<br />
Hazard Exposure.” Background note for Natural Hazards, Unnatural Disasters.<br />
Davidson, Rachel, and Haresh Shah. 1997. An Urban Earthquake Disaster Risk Index.<br />
Stanford, California: Stanford University.<br />
Hallegatte, Stéphane, Nicola Ranger, Sumana Bhattacharya, Murthy Bachu, Satya Priya,<br />
K. Dhore, Farhat Rafi que, P. Mathur, Nicolas Naville, Fanny Henriet, Anand Patwardhan,<br />
K. Narayanan, Subimal Ghosh, Subhankar Karmakar, Unmesh Patnaik, Abhijat<br />
Abhayankar, Sanjib Pohit, Jan Corfee-Morlot, and Celine Herweijer. 2010. “Flood<br />
Risks, Climate Change Impacts and Adaptation Benefi ts in Mumbai.” OECD Environmental<br />
Working Paper 27.<br />
Hallegatte, S., N. Ranger, O. Mestre, P. Dumas, J. Corfee-Morlot, C. Herweijer, and R. Muir<br />
Wood. 2011. “Assessing Climate Change Impacts, Sea Level Rise and Storm Surge Risk<br />
in Port Cities: A Case Study on Copenhagen,” Climatic Change 104 (1): 113–37.
ANNEX 2: EFFORTS TO ESTIMATE EXPOSURE IN CITIES ■ 147<br />
Munich Re. 2005. Megacities—Mega<strong>risk</strong>s: Trends and Challenges for Insurance and Risk<br />
Management. Munich Reinsurance Company.<br />
Nicholls, R.J., et al. 2007. Ranking Port Cities with High Exposure and Vulnerability to Climate<br />
Change: Exposure Estimates. Environment Working Paper 1. OECD.<br />
<strong>World</strong> Bank. 2011. “Resilient Cities: Multi-Hazard City Risk Index—Methodology Report,”<br />
East Asia Infrastructure Sector Unit, <strong>World</strong> Bank, Washington, DC, September.<br />
<strong>World</strong> Wildlife Federation (WWF). 2009. Mega-Stress for Mega-Cities: A Climate Vulnerability<br />
Ranking of Major Coastal Cities in Asia. Gland, Switzerland: WWF International.
Annex 3: Learning from Project and<br />
Program Experiences: Individuals,<br />
Community, and Local Government<br />
Partnering to Manage Risk<br />
Introduction<br />
As discussed throughout this study, there are many government and community<br />
approaches to building resilient communities. Th is annex presents some<br />
approaches being carried out at a local level, ranging from community strategies,<br />
early-warning systems, and local partnerships, to more sophisticated <strong>risk</strong>transferring<br />
programs.<br />
Traditionally, vulnerable individuals and communities have managed <strong>risk</strong><br />
through ad hoc coping techniques that draw on their local knowledge of hazards<br />
and community resources. Many sources available today discuss ad hoc adaptation<br />
to illustrate the strength of social capital; however, many of these coping<br />
mechanisms also refl ect short-term strategies of individuals or communities that<br />
are accustomed to living with <strong>risk</strong> from recurrent hazards and cannot rely on<br />
government protection (Douglas et al. 2008).<br />
While ad hoc adaptation may save lives and assets in the short term, its unregulated<br />
nature creates the possibility for maladaptation. Maladaptation happens<br />
also when there is a shift in vulnerability from one social group to another, or<br />
when future generations’ vulnerability is compromised. Per the United Nations<br />
Development Programme defi nition, maladaptation is any action taken in relation<br />
to <strong>climate</strong> <strong>change</strong> that delivers short-term gains at the cost of creating longterm,<br />
higher vulnerability. 1 An example of this can be seen in the unplanned<br />
settlements of Dar es Salaam, where common fl ood-coping strategies include<br />
■ 149
150 ■ CLIMATE CHANGE, DISASTER RISK, AND THE URBAN POOR<br />
elevating pit latrines and building foundations, which increases street fl ooding<br />
(Kiunsi et al. 2009a). Maladaptation may also include planned development policies<br />
that fail to take into account the future eff ects of <strong>climate</strong> <strong>change</strong>.<br />
Th ere are many examples of good practices in addressing the backlogs in<br />
infrastructure and service provision for the urban poor in developing countries.<br />
For instance, an approach that has resulted in eff ective identifi cation<br />
and mitigation of <strong>risk</strong>s is where city or municipal governments work with the<br />
inhabitants of the informal settlements and their community organizations to<br />
ensure provision of resilient basic services. Th is approach is now evident in a<br />
wide range of cities, although with diff erences in the balance between what<br />
governments do and what households and community-based organizations do.<br />
What these have in common, though, is recognition by local government offi -<br />
cials and politicians of the areas where so much more can be achieved if local<br />
government supports the investments and capacities that community organizations<br />
can bring. Th ere is also recognition of how community investments can<br />
be integrated into municipal investments in ways that expand coverage and<br />
lower unit costs.<br />
Other examples of good practices come from local government-community<br />
organization partnerships initiated by federations of slum/shack dwellers<br />
or homeless people. Th is is perhaps surprising in that federations or other<br />
forms of collective organization formed by low-income groups generally<br />
seek to infl uence government by making demands on them, not by off ering<br />
partnerships (Mitlin 2008). But in 33 nations, women-led grassroots savings<br />
groups, and the larger slum/shack/homeless people’s federations they form,<br />
are engaged in initiatives to upgrade slums and squatter settlements, secure<br />
land tenure, develop new housing that low-income households can aff ord,<br />
and improve provision for infrastructure and basic services. Th ese federations<br />
have demonstrated a capacity to undertake citywide surveys of informal<br />
settlements that include detailed profi les of each settlement and maps. Th ey<br />
have also shown their capacity to do detailed enumerations of every household<br />
in informal settlements that can then form the information needed for<br />
upgrading and infrastructure and service provision. Th ese are both very valuable<br />
for any local government wishing to reduce vulnerability and improve<br />
conditions in informal settlements.<br />
Individual civil servants or politicians have oft en catalyzed much improved<br />
community-local government relations that led to partnerships in service provision.<br />
Yet, the continuity of such partnership in the absence of capable institutions<br />
is threatened when politicians’ terms ends or they are moved. Th ere is also<br />
the constraint on these partnerships from the many community leaders who are<br />
not representative or accountable to those they “lead” and who are enmeshed
ANNEX 3: LEARNING FROM PROJECT AND PROGRAM EXPERIENCES ■ 151<br />
in patron-client relationships with local government. Another challenge is to<br />
take a partnership that works well for a particular settlement or district to larger<br />
scale—and shift ing from projects to citywide processes. It is also diffi cult for<br />
bureaucratic, rule-bound systems and processes to meet the needs and priorities<br />
of those in informal settlements working within the informal economy (Mitlin<br />
2008). But the range of successful experiences with community-local government<br />
partnerships coming from very diff erent economic and political contexts<br />
suggests that the core principles of this approach have wide validity. 2<br />
In most urban contexts, what community organizations can negotiate<br />
from their local government is as important (if not more so) for <strong>disaster</strong> <strong>risk</strong><br />
reduction and <strong>climate</strong> <strong>change</strong> adaptation than what they can do themselves.<br />
So much <strong>risk</strong> reduction depends on the availability of infrastructure that the<br />
residents of informal settlements cannot install themselves. Most urban informal<br />
settlements are embedded in a much larger built-up area, and these need<br />
a larger system of storm and surface drains into which their own eff orts to<br />
install, improve, and maintain drainage can fi t. Th ey need road and path networks<br />
beyond their settlements to allow them to evacuate if needed. Th ey need<br />
health care services that can help in <strong>risk</strong> reduction and <strong>disaster</strong> response. Th e<br />
willingness of individuals to invest in collective actions for <strong>risk</strong> reduction in<br />
their settlement also depends on how secure they feel from eviction and their<br />
tenure (for instance, tenants are usually unwilling to invest in improving the<br />
housing they live in). But the contribution of community-level organization<br />
and action to <strong>disaster</strong> <strong>risk</strong> reduction can also be greatly enhanced where local<br />
governments and other key bodies (for instance, civil defense organizations)<br />
recognize their role and support them. 3<br />
Risk management needs to be tailored to the specifi c needs and resources of<br />
each city. Some organizations, cities, and countries are leading <strong>risk</strong> mitigation.<br />
Figure A3.1 lists programs that have innovative elements of good practice, categorized<br />
by approach to <strong>risk</strong> management.<br />
Educate—Good Practices in <strong>Knowledge</strong><br />
Sharing and Training<br />
For many cities, the fi rst step toward <strong>climate</strong> and <strong>disaster</strong> resilience is to educate<br />
and raise awareness of natural hazards, vulnerabilities, and institutional capacity.<br />
Several programs provide advice to decision makers, such as city technicians and<br />
city managers. Th ese programs range in levels of engagement and development,<br />
but all have the common goal of aiding local governments to approach the <strong>climate</strong><br />
challenge, and they recognize that <strong>risk</strong>s are not evenly distributed among
Figure A3.1 Examples of Current Good Practices, by Approach to Risk Management<br />
1.<br />
Educate<br />
ICLEI<br />
CLACC<br />
ACCRN<br />
CRCP<br />
Urban flood<br />
handbook<br />
ISO 31000<br />
2.<br />
Identify<br />
IRAPS<br />
(Vietnam)<br />
Philippines<br />
India<br />
3.<br />
Prepare<br />
Honduras<br />
Venezuela<br />
Argentina<br />
4.<br />
Mitigate<br />
Tanzania<br />
Mozambique<br />
Senegal<br />
Pakistan<br />
Bolivia<br />
India<br />
Vietnam<br />
Liberia<br />
5.<br />
Transfer<br />
El Salvador<br />
Colombia<br />
Turkey<br />
Caribbean<br />
Islands<br />
Central<br />
America<br />
6.<br />
Recover<br />
Indonesia<br />
Volunteer<br />
Technology<br />
Communities<br />
ICLEI: Local Governments for Sustainability; CLACC: Capacity Strengthening of Least Developing Countries for Adaptation to Climate Change network; ACCRN: Asian Cities<br />
Climate Change Resilience Network; CRCP: Climate Resilient Cities Primer; ISO31000: International Organization for Standardization.<br />
152 ■ CLIMATE CHANGE, DISASTER RISK, AND THE URBAN POOR
ANNEX 3: LEARNING FROM PROJECT AND PROGRAM EXPERIENCES ■ 153<br />
local populations. Several programs currently under development are mentioned<br />
below.<br />
ICLEI—Local Governments for Sustainability<br />
ICLEI USA is working with several North American cities on the Climate<br />
Resilient Communities Program. Th e adaptation program has a fi ve-milestone<br />
methodology: (1) conduct a <strong>climate</strong> resiliency study, (2) set preparedness goals,<br />
(3) develop a <strong>climate</strong> preparedness plan, (4) publish and implement the preparedness<br />
plan, and (5) monitor and reevaluate resiliencies. Th e program is<br />
in the early stages, but may expand to the global ICLEI network. A benefi t of<br />
this program is that it can build on an existing network of cities that have used<br />
ICLEI resources to work on mitigation.<br />
Capacity Strengthening of Least Developing Countries<br />
for Adaptation to Climate Change Network<br />
Th e International Institute for Environment and Development (IIED) has helped<br />
develop the Capacity Strengthening of Least Developing Countries for Adaptation<br />
to Climate Change (CLACC) network, which is composed of international<br />
experts working to strengthen organizations in least-developed countries and<br />
support their sustainable development initiatives. Th ey are currently operating<br />
in 12 African countries and three in South Asia. Th e CLACC network supports<br />
these organizations primarily through publications and capacity-building<br />
workshops, meanwhile actively participating in the Conference of Parties (COP)<br />
negotiations worldwide. Th e CLACC methodology focuses on ten lessons for<br />
decision makers: engaging in detailed consultations with citizens and community<br />
organizations; gathering information on extreme weather impacts; engaging<br />
in <strong>disaster</strong> <strong>risk</strong> management; facilitating household coping strategies; supporting<br />
sustainable livelihoods; ensuring that infrastructure is sensitive to the needs of<br />
the poor; supporting slum upgrading; building resilience across sectors (health,<br />
tenure, education, etc.); instituting appropriate building standards; and reconsidering<br />
planning and zoning regulations.<br />
Asian Cities Climate Change Resilience Network (ACCRN)<br />
Th is is a Rockefeller Foundation initiative, implemented through the Institute<br />
for Social and Environmental Transition (ISET); it focuses on aiding a network<br />
of cities to develop <strong>climate</strong> adaptation plans through engagement with civil society<br />
stakeholders. Th e primary objectives of ACCRN are to demonstrate a range<br />
of actions for urban <strong>climate</strong> adaptation, compile replicable good practices, and
154 ■ CLIMATE CHANGE, DISASTER RISK, AND THE URBAN POOR<br />
help cities implement <strong>climate</strong> resilient processes. ACCRN is currently working<br />
in ten cities: three cities in Vietnam, three in India, two in Indonesia, and two<br />
in Th ailand. Th e program is being developed through four phases that began in<br />
2008 with city scoping and selection. Phase 2, currently under way, involves city<br />
engagement and capacity building through the Shared Learning Dialogue (SLD)<br />
process. SLDs engage community actors and government agencies to explore<br />
their current and future vulnerabilities in a transparent and iterative group discussion.<br />
Th e SLD outcome focuses on creating a shared understanding of <strong>risk</strong><br />
and priorities for action. Phase 3, set to begin this year in Vietnam and India,<br />
focuses on implementing urban resilience-building projects, with partial funding<br />
from the Rockefeller Foundation. Th e fi nal ACCRN development phase focuses<br />
on program replication in other cities, countries, and sectors. Th e primary takeaway<br />
from this activity is how the SLD process engages local civil-society groups<br />
to evaluate and create solutions to anticipated <strong>climate</strong> hazards, enabling marginalized<br />
groups to participate as stakeholders.<br />
Climate Resilient Cities Primer<br />
At the <strong>World</strong> Bank, the East Asia Region has produced the Climate Resilient Cities<br />
(CRC) Primer, which is intended as a fi rst step to guiding local governments<br />
through the assessment of <strong>climate</strong> <strong>change</strong> and <strong>disaster</strong> <strong>risk</strong> impacts. Th e primer<br />
presents exercises that focus on identifying “hot spots” for hazard <strong>risk</strong> and collecting<br />
the necessary information to make informed decisions regarding <strong>climate</strong><br />
action. Next, the primer off ers examples of “sound practices” and city profi les to<br />
illustrate how other cities are enacting “no-regrets” policies. Th e CRC Primer has<br />
led to Technical Assistance (TA) programs in Vietnam, Indonesia, the Philippines,<br />
and China. Th e primary value of this exercise is that it presents the challenges<br />
of <strong>climate</strong> <strong>change</strong> and <strong>disaster</strong> in a format that local governments can use<br />
to present complex issues to their constituents.<br />
ISO 31000<br />
In November 2009 the International Organization for Standardization developed<br />
ISO 31000—a set of principles and guidelines intended to help a wide variety<br />
of organizations in managing <strong>risk</strong>. ISO 31000 defi nes <strong>risk</strong> as the “eff ect of<br />
uncertainty in objectives.” Some of the principles of ISO 31000 point toward <strong>risk</strong><br />
management becoming a value generator for the organization, an integral part of<br />
the decision-making and other organizational processes—tailored, transparent,<br />
inclusive, systematic, structured, timely, dynamic, iterative, and responsive. Th e<br />
ISO 31000 is a further step in creating a framework for designing, implementing,<br />
and maintaining an eff ective <strong>risk</strong> management program.
ANNEX 3: LEARNING FROM PROJECT AND PROGRAM EXPERIENCES ■ 155<br />
Identify—Good Practices in Risk Identifi cation<br />
As discussed in other chapters, many informal settlements in cities are at high<br />
<strong>risk</strong> from <strong>disaster</strong>s largely due to where they live, defi ciencies in providing for<br />
infrastructure and services, and the poor quality of housing. For local governments,<br />
one of the most diffi cult tasks is to gather detailed information and maps<br />
needed for identifying <strong>risk</strong>-prone areas, planning upgrading, new house developments,<br />
and infrastructure and service provision. Below are a few examples of how<br />
much <strong>disaster</strong> <strong>risk</strong> reduction is served when low-income groups can work well<br />
with local governments (and other actors) in identifying <strong>risk</strong> (IFRC 2010).<br />
Local Resilience Action Plan (LRAP)—Identifying<br />
Local Adaptation Priorities<br />
In Vietnam, the CRC activities in three cities (Dong Hoi, Can Th o, and Hanoi)<br />
included the preparation of a workbook outlining the steps local governments<br />
can undertake to complete a Local Resilience Action Plan (LRAP). An LRAP,<br />
the second step in local resilience planning, comprises four primary inputs and<br />
complementary graphic representations. Th e four inputs include (1) vulnerability<br />
assessment; (2) spatial analysis, which is an overlay of maps that identifi<br />
es geographic “hotspots” at the city level and in specifi c target areas in the city<br />
wider area; (3) inventory of planned capital investments and policy <strong>change</strong>s to<br />
address the hotspots and identifi cation of the gaps that remain; and (4) multistakeholder<br />
priority-setting process based on comparison of alternatives in light<br />
of limited budgets and abilities to raise external fi nancing. Th e LRAP identifi es<br />
short-, medium-, and long-term adaptation priorities for project investment with<br />
specifi c costs, timelines, and responsible actors. Much like the CRC exercises,<br />
the LRAP should be completed in a collaborative dialogue between local governments<br />
and stakeholders. In the case of Can Th o, recommendations from the<br />
LRAP process are currently being integrated into local urbanization planning<br />
eff orts.<br />
Philippines Partnership between Grass Roots Organizations and<br />
Local Governments for Documenting Risk<br />
Identifi cation of communities at <strong>risk</strong> and documentation of informal settlements<br />
for which there is little or no offi cial data is critical in understanding the vulnerability<br />
of urban areas (PHPF 2010). Th e Philippines Homeless People’s Federation<br />
(PHPF) is an example of how low-income community organizations can partner<br />
with local governments to address <strong>disaster</strong> <strong>risk</strong> reduction by identifying and documenting<br />
communities at <strong>risk</strong>. 4 PHPF is made up of 161 urban poor community
156 ■ CLIMATE CHANGE, DISASTER RISK, AND THE URBAN POOR<br />
associations and savings groups with more than 70,000 members from 18 cities<br />
and 15 municipalities. Federation members work closely with local governments<br />
in various initiatives to secure land tenure, build or improve homes and increase<br />
economic opportunities. PHPF works in locations impacted by <strong>disaster</strong>s, building<br />
capacity at the community level to take action to meet immediate and long-term<br />
needs. Drawing from its experience, PHPF developed initiatives for <strong>risk</strong> management<br />
as it identifi es at-<strong>risk</strong> communities in cities and municipalities. Based on<br />
this, it supports the design and implementation of <strong>risk</strong> reduction strategies.<br />
For example, PHPF in partnership with local NGOs has identifi ed and profi<br />
led at-<strong>risk</strong> communities in 12 cities and 10 municipalities located in Luzon,<br />
Visayas, and Mindanao, the three island groups in the Philippines. Communities<br />
prioritized included informal settlements located under bridges, on cliff s and<br />
other landslide-prone areas, along coastal shorelines and riverbanks, in public<br />
cemeteries, near open dumpsites, and in fl ood-prone locations.<br />
Another example of a successful partnership between local and national government,<br />
grassroots organizations, and the PHPF took place in the city of Iloilo<br />
aft er the devastation caused by Typhoon Frank in 2008. Th e city government<br />
recognized that the urban poor and their support organizations are partners<br />
in the city’s development, and provided several opportunities for them to participate<br />
in local decision making through representation in technical working<br />
groups and multi-sectoral bodies. As a result, the scale and scope of housing<br />
delivery, upgrading, post-<strong>disaster</strong> assistance, and other basic services were much<br />
increased because of the resource-sharing from the partnership.<br />
Furthermore, the federation as a member of the Resettlement and Monitoring<br />
Task Force has assisted the local government in social preparations and other<br />
resettlement-related activities. Th is includes an information-dissemination campaign<br />
among communities living in danger zones (along riverbanks and shorelines,<br />
as well as those directly aff ected by the city’s infrastructure projects) who<br />
will be transferred to government relocation sites. Th e city government, through<br />
the Iloilo City Urban Poor Aff airs Offi ce, assisted in the federation’s social mobilization,<br />
which includes mapping of high-<strong>risk</strong>/<strong>disaster</strong>-aff ected communities, and<br />
identifi cation and prioritization of communities to be given post-<strong>disaster</strong> assistance<br />
(temporary houses and material loan assistance for housing repair).<br />
Th e eff ectiveness of partnerships between local governments and grassroots<br />
organizations in scaling up <strong>disaster</strong> <strong>risk</strong> reduction in the Philippines is sustained<br />
by four factors: strong community networks (that can lobby for <strong>disaster</strong> <strong>risk</strong> reduction<br />
policies that are community-driven and supported and then help implement<br />
these); an alternative fi nancial facility (that supports community-driven action,<br />
support for insurance for low-income households and loans for reconstruction or<br />
rehabilitation and upgrading); technical support (to advise on site selection, land<br />
acquisition, housing and settlement designs, zoning based on geo-hazard maps
ANNEX 3: LEARNING FROM PROJECT AND PROGRAM EXPERIENCES ■ 157<br />
and easy-to-comply building standards); and detailed community-level information<br />
systems (including the kinds of community mapping, enumeration, and <strong>risk</strong><br />
assessment described already).<br />
India: Local Government-Community Organization Partnerships<br />
for Vulnerability Mapping and Data Gathering in Cuttack<br />
In the city of Cuttack, India, a citywide survey is currently underway. On the one<br />
hand, the city government has stated its commitment to a citywide program for<br />
informal settlements. On the other hand, federation groups are developing a GIS<br />
system that will prove particularly useful for local government. 5 Th e mapping<br />
process in Cuttack builds on more than two decades of experience in data gathering<br />
by the community organizations formed by the inhabitants of informal settlements<br />
and other districts—through a partnership between local Mahila Milan<br />
groups and the local (city or state) slum dweller federations (Appadurai 2001;<br />
Patel, D’Cruz, and Burra 2002). What makes this process in Cuttack unusual is<br />
that the community-driven data gathering includes preparing digital maps at the<br />
city scale for the city authorities. Th ese maps and the data gathered about each<br />
informal settlement are being used to negotiate the support needed for upgrading<br />
or relocation.<br />
Th e fi rst step in this mapping is to develop an initial list of informal settlements.<br />
Local governments generally have such a list but it needs checking and<br />
is oft en incomplete. Th e next step is to work with the Mahila Milan savings<br />
groups and federation members to check the list—which oft en ends up identifying<br />
many more informal settlements. In Cuttack, 77 informal settlements were<br />
found that were not on the offi cial list (Agarwal and Sangar 2005; Agarwal 2011).<br />
With a list of all informal settlements, visits can be planned to each by Mahila<br />
Milan representatives and staff from a support NGO. At this meeting with the<br />
residents and their community leaders, a profi le of the settlement is developed<br />
that includes details of who lives there, the nature of their tenure of the land,<br />
the buildings, and the extent of provision for infrastructure and services. It also<br />
includes questions about extreme weather (and its impacts on them) and other<br />
<strong>risk</strong>s they face (or faced in the past). Th en this group walks the boundaries of the<br />
settlement, marking it with a GPS device (points are marked at every turn, and<br />
when the boundary is a straight line, every 5–10 meters). As residents walk with<br />
the team doing the mapping, they comment on boundaries and characteristics,<br />
which help the visiting team understand the settlement. From this is produced a<br />
profi le of the settlement and a map of its boundaries (that can be imported into<br />
a digital map of Cuttack). Points marked in the GPS device are uploaded onto<br />
Google Earth in the offi ce computer. Using the path tool in Google Earth, the<br />
federation member connects the points to create boundaries corresponding to
158 ■ CLIMATE CHANGE, DISASTER RISK, AND THE URBAN POOR<br />
each mapped settlement. Slum profi le data collected by Mahila Milan—usually<br />
during mapping—is entered into an Excel spreadsheet and selected data can also<br />
be incorporated into the map, attached to the boundary maps.<br />
Th is process is then repeated for all informal settlements, from which comes<br />
an accurate, detailed, disaggregated database. Th is information can be then<br />
aggregated into a citywide map showing the boundaries of all informal settlements<br />
and a link to each settlement profi le in a GIS system.<br />
Th e city authorities have been supportive of this mapping, recognizing that<br />
this process can help produce the information needed to get central government<br />
funding for citywide upgrading. Th e mapping and data gathered can provide the<br />
basis for agreement between city government and the residents of informal settlements<br />
on what needs to be done.<br />
For this kind of community-driven approach to mapping and data gathering<br />
to be eff ective, it is important for local governments to see its utility to them. It<br />
also depends on a local government capacity to act on this information and for<br />
its technical staff and departments or divisions responsible for infrastructure and<br />
service provision to be able to work with the resident groups in the informal<br />
settlements.<br />
Prepare—Good Practices in Risk Reduction<br />
through Early-Warning Systems<br />
In areas where <strong>disaster</strong>s are recurrent, the establishment of early-warning systems<br />
and evacuation plans are critical to safeguarding human lives in an emergency.<br />
Th e main objective of early-warning systems is to empower individuals<br />
and communities to act in a way that reduces their probability of personal<br />
injury or damage to property and critical resources in the threat of hazards.<br />
Th e International Strategy for Disaster Reduction (ISDR) suggests four key elements<br />
of people-centered early-warning systems: <strong>risk</strong> knowledge, monitoring<br />
and warning service, dissemination and communication, and response capability<br />
(ISDR 2006).<br />
In the case of sudden events, such as tsunamis, fl ash fl oods, and landslides, the<br />
poor are frequently the last to know of impending danger, and due to a lack of<br />
security, they are frequently reticent to abandon their possessions.<br />
Honduras—Promoting Dialogue and Coordinating Responses<br />
Th ere are numerous cases in Latin America where the urban poor have benefi ted<br />
from the establishment of early-warning systems. Hurricane Mitch, which hit<br />
Honduras in 1998, is considered the second-deadliest Atlantic hurricane in history.
ANNEX 3: LEARNING FROM PROJECT AND PROGRAM EXPERIENCES ■ 159<br />
Th e many deaths caused by Hurricane Mitch prompted several municipalities in<br />
Honduras to establish an inter-municipal association, with the support of GTZ, to<br />
promote dialogue on the <strong>risk</strong>s of natural hazards and to coordinate responses. Th e<br />
association known as Mancomunidad de los Municipios del Centro de Atlantida<br />
(MAMUCA), the municipalities of La Masica, Arizona, Esparta, San Francisco,<br />
and El Porvenir worked together to identify <strong>risk</strong>s, raise awareness, prioritize<br />
reconstruction, encourage local decision making in a public forum, and engage<br />
in national <strong>risk</strong> management. Th is was set up to allow the local governments to<br />
work together in preparing for extreme events and to coordinate local response.<br />
It included support for participatory diagnoses and participation in local decision<br />
making through public meetings (cabildos abiertos) and helped improve evacuation,<br />
during rainstorms, through community-based <strong>disaster</strong> reduction. It also<br />
encouraged the formation of local emergency committees (CODELs) integrated<br />
with municipal emergency committees to practice early-warning and evacuation<br />
drills (Bollin and Mascher 2005). CODELs included representatives from healthcare<br />
services, the police, the fi re department, and the Red Cross.<br />
Honduras has not been the only one in Central America to learn from the<br />
experience with Hurricane Mitch. For instance, Cuba, despite being highly<br />
exposed to tropical storms, has repeatedly averted <strong>disaster</strong> through a highly eff ective<br />
system to educate, mobilize, and protect its citizenry. In 2005, this “culture of<br />
safety” allowed for the evacuation of 640,000 people from Havana and the path of<br />
Hurricane Wilma while the storm surge reached 1 kilometer inland (Simms and<br />
Reid 2006). Hurricane Wilma resulted in the loss of one life, a marked diff erence<br />
to the nearly 20,000 Central Americans killed by fl ooding and landslides associated<br />
with Hurricane Mitch in 1998.<br />
Argentina—From Early-Warning Systems to<br />
Improvement in Asset Security<br />
Buenos Aires is a low-lying city, and thus faces recurrent fl ooding from three<br />
rivers. While arguably less catastrophic than landslides, the repeated fl ooding<br />
of this area makes it diffi cult for the urban poor to recover between <strong>disaster</strong>s.<br />
In 2004, fi lmmakers documented fl ooding in the low-income community of<br />
El Zajon, raising awareness within both the community and the government,<br />
prompting the installation of an early-warning system (Simms and Reid 2006).<br />
Th e <strong>World</strong> Bank (2005) has supported several fl ood-prevention eff orts in<br />
Argentina under the Urban Flood Prevention and Drainage Project. In its fi rst<br />
phase, the project focused on the development of a city <strong>risk</strong> management program<br />
for Buenos Aires, which, among many things, included fl ood forecasting<br />
and early-warning systems. Now in its second phase, the project has expanded to<br />
include the six provinces located between the Rio Paraguay and the Rio Parana,
160 ■ CLIMATE CHANGE, DISASTER RISK, AND THE URBAN POOR<br />
the most fl ood-prone region in Argentina. In addition to early-warning systems,<br />
the second phase will improve the asset security of the poor by implementing a<br />
housing program for the lowest-income population (<strong>World</strong> Bank 2006a).<br />
Mitigate—Good Practices in Risk Reduction<br />
through Mitigation<br />
In addition to early response, evacuation, and sheltering, community actions may<br />
also be more proactive, engaging citizens and governments to work together to<br />
build resilience. Disaster mitigation, seen as activities that will reduce the impact<br />
of a <strong>disaster</strong> is generally linked to “good urban service delivery.” Good development<br />
is not only what governments must do but also what they allow and support<br />
at the local level. 6 Th is is especially the case where local government lacks capacity<br />
and funding for needed investments. For <strong>disaster</strong> <strong>risk</strong> reduction and <strong>climate</strong><br />
<strong>change</strong> adaption, there is a need to look at how people on the ground are taking<br />
care of their <strong>risk</strong>s, understanding <strong>risk</strong>, and developing (household and collective)<br />
mechanisms to address <strong>risk</strong>. It is very diffi cult to reduce <strong>disaster</strong> <strong>risk</strong> without<br />
strong local organizations that tailor responses to the specifi cs of each location<br />
and the needs of those most at <strong>risk</strong>. Similarly, it is diffi cult to respond eff ectively<br />
to a <strong>disaster</strong> if the response is centralized and local organizations are not strong<br />
and supported.<br />
Flood Management and Urban Planning<br />
Tanzania—<strong>Open</strong>ing up the Dialogue for Larger<br />
Government Support<br />
In Dar es Salaam, the African Urban Risk Analysis Network (AURAN) carried<br />
out three case studies related to mainstreaming <strong>disaster</strong> <strong>risk</strong> management<br />
in urban planning practices. Included among them were successes related to<br />
the local communities requesting drainage pipes from local governments and<br />
community-based organizations building drainage systems. Building upon<br />
this, the AURAN project started working on the planned and unplanned<br />
settlements of Bonde la Mpunga, where residents have organized themselves<br />
to tackle the problem of local fl ooding (Kiunsi et al. 2009b). Th e local community<br />
established a seven-member Flood Control Committee to address the<br />
fl ooding <strong>risk</strong>, but its lack of legal mandate made it diffi cult to solicit funding<br />
for local improvements. While the committee did not receive support from the<br />
higher levels of government and several of their poorly executed interventions
ANNEX 3: LEARNING FROM PROJECT AND PROGRAM EXPERIENCES ■ 161<br />
failed to solve the fl ooding problem, the committee’s correspondence with the<br />
media opened a dialogue with the municipal government concerning local<br />
fl ooding.<br />
Motivated by this dialogue and recognizing the <strong>risk</strong>s of fl ooding, the Tanzanian<br />
government requested <strong>World</strong> Bank support in urban upgrading. Th e <strong>World</strong><br />
Bank is currently fi nancing loans to the central government for implementing<br />
Community Infrastructure Upgrading Programs (CIUP) throughout Dar es<br />
Salaam (<strong>World</strong> Bank 2004a). Targeting unplanned areas in the Ilala, Temeke, and<br />
Kinondoni municipalities, communities have selected technical improvements,<br />
including roads, drains, and public toilets. CIUP is an extensive program that<br />
focuses on improving physical access, complete with the associated surface water<br />
drainage and street lighting. Th e new community infrastructure allows safe access<br />
to homes on a regular and emergency basis; roadside and select collector drains<br />
dramatically decrease street fl ooding, and the street lights provide public safety<br />
in areas that residents did not previously perceive as safe. Under the fi rst phase of<br />
CIUP, 16 sub-wards of Dar es Salaam were upgraded. Covering 453 hectares, the<br />
fi rst phase benefi ted approximately 170,000 residents. Under the second phase<br />
of CIUP, which commenced in July 2010, an additional 15 sub-wards will be<br />
upgraded. Th is phase, covering 554 hectares, will benefi t an additional 150,000<br />
people; it is scheduled for completion by the end of 2011. 7<br />
Mozambique—Joint International and Local Effort<br />
for Urban Upgrading<br />
In Quelimane City, local communities have partnered with the City Council and<br />
international organizations for urban upgrading. Quelimane City has a population<br />
of approximately 240,000 and is located in the Zambezi delta, Mozambique<br />
(City Council of Quelimane 2006; Cities Alliance 2008; Grimard 2006–2008).<br />
It suff ers from cyclical fl oods, due to the combination of a high water table and<br />
heavy rain; 80 percent of its population lives in informal housing. Quelimane<br />
City, with support from Cities Alliance, embarked on the preparation of an urban<br />
upgrading strategy that had a special focus on water and sanitation. Th e strategy<br />
also included interventions in drainage, road network, and waste management.<br />
Th e Improving Water and Sanitation in Quelimane City, Mozambique, program<br />
was designed to be the fi rst phase of an urban-upgrading program that, through<br />
demonstration eff ects, increased local capacity, and additional outside funding,<br />
could be scaled up across the city.<br />
Th is program involved organizations working in partnership: UN-HABITAT<br />
acted as the implementing agency through its local offi ces; the project was coordinated<br />
with the <strong>World</strong> Bank’s Municipal Development Project, which was<br />
already active in Quelimane; other partners included the Danish International
162 ■ CLIMATE CHANGE, DISASTER RISK, AND THE URBAN POOR<br />
Development Agency (DANIDA), UNICEF, and WaterAid. Th e City Council of<br />
Quelimane provided an in-kind contribution of US$100,000 (by providing offi ce<br />
space, equipment, a meeting room, technical and administrative staff , and vehicles).<br />
Th e residential community provided an in-kind contribution of $150,000<br />
(through subsidized manpower, awareness campaigns, operational management<br />
teams, and reduced plot size or, in extreme cases, moving to another area because<br />
of improvement works). UN-HABITAT, the <strong>World</strong> Bank, DANIDA, UNICEF,<br />
and WaterAid together contributed $440,000 in cash and in kind. Other in-kind<br />
contributions totaling $30,000 were secured from a state water supply institution,<br />
and from a private-sector fi rm that made its trucks available during weekends<br />
in ex<strong>change</strong> for paying for only fuel and the driver. Th is novel and complicated<br />
institutional mix presented some challenges of coordination, including between<br />
Quelimane institutions themselves—particularly the City Council and community<br />
committees. Coordination could not be taken for granted, and it was necessary<br />
to establish rules and mechanisms for dialog between them. 8<br />
Senegal—Combining Efforts between Community Organizations,<br />
NGOs, and Local and National Government Agencies in Saint Louis<br />
An example from the city of Saint Louis, Senegal, shows how fl ooding can<br />
be addressed through the combined and coordinated eff orts of communityorganizations,<br />
NGOs, and local and national government agencies. Saint Louis<br />
is Senegal’s former national capital, with 180,000 inhabitants in 2002. Th e city<br />
is constructed around water, on three islands cut off from each other by the<br />
branches of the Senegal River, its tributaries, and the Atlantic Ocean. Some areas<br />
of the city are less than 2.5 meters above mean sea level. Th e city has experienced<br />
recurrent fl ooding since 1990, from the rains and from peak fl ows in the Senegal<br />
River. Th e rising river level is the product of many factors, including the silting<br />
up of the river bed; the disposal of household waste into the river; the reduced<br />
area available to fl oodwater irrigation (as unplanned urbanization means these<br />
areas are now occupied by housing); and a shallow water table that rises to the<br />
surface when the river swells and drains poorly during the winter season. Flooding<br />
generally aff ects areas inhabited by the lowest-income groups. Many are rural<br />
migrants who occupy sites not intended for residential use.<br />
Stagnant rainwater in the fl ooded areas—less than 10 percent of the population<br />
live in homes with sewer connections—combined with a lack of clean<br />
water, inadequate drainage, and wastewater and solid-waste management—only<br />
30 percent of households have a regular solid-waste collection service—brings<br />
serious health impacts. To these are added the proliferation of disease vectors,<br />
such as fl ies and mosquitoes. Poor hygiene and high levels of overcrowding<br />
compound the <strong>risk</strong>s.
ANNEX 3: LEARNING FROM PROJECT AND PROGRAM EXPERIENCES ■ 163<br />
Th e strategy of the Senegalese NGO Enda-Tiers Monde in response to fl ooding<br />
in Saint Louis has been based not on building infrastructure (for instance, some<br />
areas are protected by dykes), but on strengthening local governance. Stakeholders<br />
have been brought together to discuss the problems they face and ex<strong>change</strong><br />
views to fi nding solutions to problems that are beyond their individual skills or<br />
capacities. An action plan has been developed and implemented by all stakeholders,<br />
managed by a steering committee, which includes information, education,<br />
and communication, raising the awareness of the local people. Plays, exhibitions,<br />
media broadcasts, teatime “chats,” interviews, photographic exhibitions, and<br />
open-air conferences have been used for this. Local civil-society organizations<br />
(including women’s groups, youth associations, dahiras—religious groups) all<br />
organize in the fl ood-prone neighborhoods to mitigate the eff ects of fl ooding<br />
through. Mitigation includes (1) digging paths to evacuate stagnant water, (2)<br />
regularly maintaining drainage channels, (3) disinfecting stagnant water, in association<br />
with the National Hygiene Department, or (4) placing sandbags to help<br />
inhabitants get about within the neighborhood itself.<br />
Th e authorities also use local labor for some drainage works, and women’s<br />
groups are involved in awareness raising in order to combat diarrhea and to prevent<br />
malaria and other diseases. NGOs work closely with the state’s decentralized<br />
structures (health and sanitation departments, fi re brigade, etc.) to raise awareness<br />
and <strong>change</strong> the population’s behavior (Khady 2007; ISDR 2009).<br />
Water Supply and Sanitation<br />
Pakistan—Local Government-Civil Society Partnerships to<br />
Provide Sanitation and Drainage in Karachi<br />
Th ere are programs that focus on social asset-building to improve water and<br />
sanitation services, making communities more resilient to <strong>disaster</strong> impacts.<br />
Th e Orangi Pilot Project Research and Training Institute (OPP-RTI) of Pakistan<br />
supports slum dwellers and local governments in planning, implementing,<br />
and fi nancing basic sanitation (ISDR 2009). For the residents of informal settlements,<br />
OPP-RTI helps them to reduce to cost of household sanitary latrines or<br />
neighborhood sewers through design modifi cation and the elimination of outside<br />
contractors. For governments, OPP-RTI supports them to plan and fi nance<br />
transport and treatment of the sewage from neighborhood collector sewers.<br />
Approximately 300 communities have fi nanced, managed, and constructed their<br />
own internal sanitation systems, allowing government agencies to eff ectively<br />
channel their resources to larger external infrastructure. Th is illustrates a particularly<br />
important aspect for local government programs—how the design and
164 ■ CLIMATE CHANGE, DISASTER RISK, AND THE URBAN POOR<br />
implementation of piped water, sewers, and drains within informal settlements,<br />
which is diffi cult and expensive for government agencies, can be done far quicker<br />
and cheaper by supporting residents to manage it and fi nance it themselves.<br />
Th ese activities have brought major benefi ts to large sections of the urban poor<br />
in Karachi.<br />
Wastewater Management and Energy<br />
Bolivia—Urban Adaptation and Climate Mitigation in Santa Cruz<br />
In addressing <strong>climate</strong> <strong>change</strong>, there can be overlap between mitigation and adaptation.<br />
For the urban poor, proper wastewater management is critical to reduce<br />
contamination and the health problems exacerbated by density. Two <strong>World</strong> Bank<br />
projects respond to the urgent sanitation challenges in Santa Cruz de la Sierra—a<br />
city of 1.3 million people in Bolivia, growing at 6 percent each year. Sanitation<br />
services are provided by 10 cooperatives—some of which have been recognized<br />
as among the best in Latin America—but which give an overall level of sewerage<br />
coverage of only 32 percent. Th is means a high <strong>risk</strong> of infi ltration into the city’s<br />
main aquifer, which would result in irreversible damage to the city’s water supply.<br />
Increased coverage of Santa Cruz’s sewerage system will also result in avoided<br />
costs of developing an entirely new water supply source for the city.<br />
Th e fi rst project—Bolivia Urban Infrastructure—aimed to improve the access<br />
to basic services by the urban poor in Bolivia’s major cities, through targeted<br />
infrastructure investments and the provision of technical assistance to municipalities<br />
in planning, expanding, and sustaining urban services. Part of this project<br />
involves the expansion of sewerage coverage in the poor areas of Santa Cruz, by<br />
increasing the capacity of four wastewater treatment plants. Th ese plants use a<br />
lagoon treatment system, which uses anaerobic bacteria to break down organic<br />
matter. Unfortunately, this process produces methane—a powerful greenhouse<br />
gas that contributes to <strong>climate</strong> <strong>change</strong>.<br />
Th e second project—Urban Wastewater Methane Gas Capture—involves covering<br />
all four large anaerobic treatment lagoons with high-density polyethylene<br />
“geomembrane” sheeting, supported by a system of fl oats and tubes. Th ose tubes<br />
are perforated and are used to capture gas from the lagoons—estimated at more<br />
than 44,000 tons of CO 2 per year—which is then transported, via interconnecting<br />
pipes, to a fl are. Th e polyethylene covering also raises the temperature of the<br />
lagoon, thus optimizing anaerobic digestion, and increasing the throughput of<br />
the treatment plant.<br />
Th is latter project will be funded by an emission-reduction purchase of<br />
$2.09 million by the Community Development Carbon Fund (CDCF) and the
ANNEX 3: LEARNING FROM PROJECT AND PROGRAM EXPERIENCES ■ 165<br />
Bio Carbon Fund. Th e CDCF allows industrialized countries to “purchase”<br />
emissions reductions from developing countries. Th at principle is adopted<br />
from the Clean Development Mechanism of the Kyoto Protocol, which developed<br />
a framework for emissions-reductions purchases until 2012; the CDCF<br />
extends that principle beyond 2012. In addition, the CDCF aims to ensure<br />
that communities are empowered to play an active role in the delivery of services<br />
that help improve their livelihoods and reduce poverty—by identifying,<br />
implementing, and monitoring those services. Th e local cooperative SAGUA-<br />
PAC will receive the proceeds from this purchase, and will be responsible for<br />
implementing the project, which is estimated to cost $1.48 million to install,<br />
and $24,000 a year to operate and maintain.<br />
Th e project to capture methane leverages the <strong>World</strong> Bank’s considerable experience<br />
in fi nancing projects to capture and fl are methane gas from landfi ll sites,<br />
and in dealing with the certifi cation of emissions reductions under the Clean<br />
Development Mechanism. It is hoped that the Bolivian government will be able<br />
to pursue similar projects elsewhere, using the knowledge and skills it will have<br />
accrued in Santa Cruz (<strong>World</strong> Bank 2006b, 2007).<br />
Water Supply and Energy Effi ciency<br />
India—Generating Carbon Revenue while Improving Access to<br />
Basic Services<br />
Improving basic services for the urban poor can result in co-benefi ts for <strong>climate</strong><br />
mitigation and adaptation. In the case of Karnataka, India, emission reductions<br />
were achieved while increasing access to water. Karnataka is a state in southern<br />
India, with an urban population of approximately 18 million people. 9 Th at<br />
population has grown by 29 percent over the last decade, and continues to<br />
grow—creating an urgent need to improve urban services. Ninety-four percent<br />
of Karnataka’s urban population has some access to water supply, but this access<br />
is usually less than four hours a day. Th e poor service is due mostly to ineffi cient<br />
production and distribution of water, which create high costs and results in absolute<br />
shortages.<br />
Th e government of Karnataka is already engaging in substantial eff orts to<br />
improve its urban water supply, through investment programs, institutional and<br />
fi nancial reforms, and an improved water tariff framework that emphasizes cost<br />
recovery. Indeed, the government has foreseen great room for improvement by<br />
tackling ineffi cient energy use, given that electricity represents more than half<br />
the operation cost of Karnataka’s water supply. Not only does this mean higher<br />
operational costs, it also means unnecessary greenhouse gas (GHG) emissions,
166 ■ CLIMATE CHANGE, DISASTER RISK, AND THE URBAN POOR<br />
since the municipal water pumps are powered by fossil-fuel electricity from the<br />
national grid.<br />
Th e Karnataka Municipal Water Energy Effi ciency Project represents an eff ort<br />
to reduce emissions and operational costs. Th e project addresses key ineffi ciencies<br />
in the current system: ineffi cient and outdated pumping systems, improperly<br />
sized pumping systems, poor maintenance, operation at suboptimal loads, and<br />
high frictional losses through redundant pumps, pipes, and valves. Th e system<br />
is being improved by installing new and more effi cient pumps; properly sizing<br />
pumps and components; improving electrical effi ciency (for example, through<br />
power factors correction and standby transformers); better metering and monitoring;<br />
and reducing water leakage in the main pipes into the cities. Th is project is<br />
being implemented in six cities: Belgaum, Gulbarga, Hubli/Dharwad, Mangalore,<br />
Bellary, and Mysore. Total energy savings are estimated at more than 16 million<br />
KWh. Total emissions reductions are estimated at more than 13,000 tons of CO 2 .<br />
Capital investments will be made by a local actor—the Karnataka Urban Infrastructure<br />
Development and Finance Corporation (KUIDFC)—and the resulting<br />
emissions reductions will be purchased by the Community Development Carbon<br />
Fund (CDCF), of which the <strong>World</strong> Bank is a trustee. Th e capital investment<br />
cost of the project is estimated to be US$4.5 million. Th e CDCF is expected to<br />
purchase approximately 60,000 emissions reduction (ER) units from the project<br />
(the fi nal number is to be confi rmed aft er negotiation of an Emission Reduction<br />
Purchase Agreement). Depending on the certifi ed emissions reductions price,<br />
the gross revenue will amount to between US$600,000 and US$900,000, which<br />
will be shared among participating municipalities.<br />
Neighborhood Upgrading<br />
Vietnam—Engaging the Community in Resilient Urban Upgrading<br />
Since 2004, the <strong>World</strong> Bank has loaned Vietnam more than US$375 million to<br />
support its National Urban Upgrading Programs (VUUP), and there is currently<br />
a proposal for an additional US$395 million to expand activities to the Mekong<br />
Delta Region. 10 Th e programs aim to improve the eff ectiveness, accessibility, and<br />
sustainability of urban services through priority investments in urban upgrading,<br />
environmental improvement, and institutional strengthening at the urban<br />
level (<strong>World</strong> Bank 2004b). Vietnam is one of the most hazard-prone areas in Asia,<br />
due to its tropical monsoon location and topography. Typhoons and fl ooding are<br />
the most frequent hazards faced in Vietnam, where populations and economic<br />
activities are concentrated along the coastline and in low-lying deltas. In lowincome<br />
urban areas, such as the Tan Hoa-Lo Gom Canal area of Ho Chi Minh,
ANNEX 3: LEARNING FROM PROJECT AND PROGRAM EXPERIENCES ■ 167<br />
heavy rains typically inundate homes with a mix of sewage and storm water up to<br />
a meter deep. Th e VUUP focuses on engaging local communities in the critical<br />
stages of preparation, design, and implementation while seeking to improve the<br />
living conditions of all residents, regardless of their registration status. Using a<br />
multi-sector approach, the project aims to provide or rehabilitate infrastructure<br />
and housing in low-income areas through capacity building in the local government<br />
and through partnerships with communities.<br />
Th e fi rst major investment, of US$222 million, supports upgrading lowincome<br />
communities in four cities: Can Th o, Hai Phong, Nam Dinh, and Ho<br />
Chi Minh, including the Tan Hoa-Lo Gom Canal area. Th e project seeks, among<br />
other things, to conduct an integrated upgrading of basic infrastructure at the<br />
neighborhood level, such as drainage, waste-water collection, electricity and<br />
lighting, street-access improvements, and water supply, as well as the provision of<br />
social services, such as schools, pre-schools, and health centers in targeted lowincome<br />
communities.<br />
Th e lessons learned in this fi rst stage of VUUP activities informed similar<br />
projects in the area of Da Nang, the fourth-largest urban area in Vietnam (<strong>World</strong><br />
Bank 2008b). Among the lessons carried over, the need for active community<br />
participation, minimization of relocation and resettlement, and the design of<br />
infrastructure to an appropriate technical standard that is still aff ordable to the<br />
communities. Th e second phase of the project supports the upgrading of tertiary<br />
infrastructure, the development of three resettlement sites, microfi nance for<br />
housing improvement, and improved drainage systems.<br />
Th e current pipeline proposal to expand the VUUP to the Mekong Delta region<br />
would focus on the provinces of Can Th o, My Th o, Kien Giang, Tra Vinh, Dong<br />
Th ap, and Ca Mau (<strong>World</strong> Bank 2010). Th e expected measureable outcomes of<br />
the project include improved environmental conditions, improved quality of life,<br />
increased access to fi nancing for housing improvements, greater tenure security,<br />
and improved capacity at the national level to manage urban systems.<br />
Job Creation<br />
Liberia—Reducing Vulnerability to Natural Disasters while<br />
Creating Job Opportunities for the Poor<br />
In 2006, Mercy Corps initiated their Cash-for-Work program in Liberia to promote<br />
drainage maintenance. Prior to the initiation of this program, heavy rains<br />
would frequently trigger fl ooding in both urban and rural areas. Cleaning the<br />
drains was not a government priority, and the drainage systems had not been<br />
properly maintained for decades due to lack of funds and civil war. Th e one-year
168 ■ CLIMATE CHANGE, DISASTER RISK, AND THE URBAN POOR<br />
program was launched in fi ve counties, generating more than 17,800 days of<br />
employment and greatly improving both drainage and the availability of clean<br />
water (ISDR 2009). Since 2008, the <strong>World</strong> Bank has supported the Cash for<br />
Work Temporary Employment Project (CfWTEP) in Liberia, through the Liberia<br />
Agency for Community Empowerment (LACE). Funding in the form of a<br />
US$3 million grant was made available through the Food Price Crisis Response<br />
Trust Fund, to provide income support to vulnerable households. Over the<br />
course of two years (October 2008–2010) approximately 17,000 workers have<br />
been employed to clear drains, sweep streets, repair culverts, and perform other<br />
public maintenance (Zampaglione 2008).<br />
Transfer—Recent Practices in Risk Defl ection<br />
In the developing world, <strong>disaster</strong>s can suddenly wipe out decades of development<br />
gains. Relief, recovery, and reconstruction can be extremely taxing on available<br />
resources for both governments and individuals, despite the leveraging of international<br />
aid. In some cases, individuals and governments may spread the cost of<br />
<strong>risk</strong> or damages across a population or time by establishing individual insurance<br />
or catastrophic <strong>risk</strong> pools.<br />
El Salvador—Self and Community-based Insurance<br />
In the <strong>World</strong> Watch Institute’s State of Our <strong>World</strong> 2007, Christine Wamsler outlines<br />
how self-insurance is much more prevalent than formal insurance in the<br />
slums of El Salvador, as most residents are employed in the informal sector and<br />
therefore illegible for the national social-security system. Self-insurance coping<br />
strategies in El Salvador include having many children, encouraging family members<br />
to migrate to the United States to provide remittance income, and stockpiling<br />
building materials that can be used or resold. Wamsler estimates that in<br />
addition to free help or materials, households spend an average of 9.2 percent of<br />
their income on <strong>risk</strong> reduction. In a more communal context, some Salvadorans<br />
choose to contribute to community emergency funds or join religious institutions<br />
that traditionally off er post-<strong>disaster</strong> help. Th ere are, however, cases where slum<br />
dwellers employed in the informal sector obtain certifi cates of employment from<br />
entrepreneurs that allow them to pay into the national social-security system.<br />
Colombia—Innovation in Risk Management<br />
In contrast to the preceding scenario, Manizales, Colombia, has arranged for<br />
insurance coverage to be extended to the urban poor through municipal tax
ANNEX 3: LEARNING FROM PROJECT AND PROGRAM EXPERIENCES ■ 169<br />
collection. Any city resident may purchase insurance for their property, and<br />
aft er 30 percent of the insurable buildings participate, the insurance coverage<br />
is extended to tax-exempted properties, including properties with cadastral<br />
value of 25 monthly salaries or less (estimated at US$3,400). Despite the<br />
municipal administration collecting a handling fee of 6 percent, the insurance<br />
company has a direct contractual relationship with the individual taxpayer<br />
and bears responsibility for the all claims (Fay, Ghesquiere, Solo 2003).<br />
Many of the cities with the strongest programs for reducing <strong>disaster</strong> <strong>risk</strong>s<br />
come from Latin America. Th e city of Manizales provides an example of a city<br />
government committed to partnering with the community for <strong>disaster</strong> <strong>risk</strong><br />
reduction. Th is included involving the population in each district in <strong>risk</strong> mapping<br />
and responses, as well as discussions that brought together all key local<br />
stakeholders. Th e <strong>risk</strong> mapping of each district identifi ed <strong>risk</strong> zones and settlements<br />
particularly at <strong>risk</strong> from landslides. Th e city government then worked with<br />
the inhabitants to relocate them to safer sites and convert the land at <strong>risk</strong> into<br />
neighborhood parks with measures to stabilize the slopes (Velasquez 1998). A<br />
hundred and twelve women were trained as “guardians of the slopes” to create<br />
and maintain slope stabilization in their neighborhood and to report on problems.<br />
Environmental observatories have been created in each of the 11 comunas<br />
into which the city is divided to support public engagement and implementation<br />
of the city’s environmental plan. Th e comunas monitor progress on environmental<br />
conditions, with progress summarized and displayed publicly in a simple set<br />
of indicators—the environmental traffi c lights (semaforos ambientales) (Velasquez<br />
Barrero 2010). Th e city also introduced collective voluntary insurance to<br />
allow low-income groups to insure their buildings; the city government has an<br />
agreement with an insurance company and allows any city resident to purchase<br />
insurance through municipal taxes (Velasquez 1998).<br />
Turkey—Liquidity for Post-Disaster Relief and Reconstruction<br />
At the national level, countries have the opportunity to participate in public insurance,<br />
such as catastrophic <strong>risk</strong> fi nancing. Established before <strong>disaster</strong> impacts, catastrophic<br />
<strong>risk</strong> fi nancing can provide governments with immediate liquidity for<br />
post-<strong>disaster</strong> relief and reconstruction. Th e <strong>World</strong> Bank and the Global Facility<br />
for Disaster Risk Reduction (GFDRR) have been helping governments participate<br />
in catastrophic <strong>risk</strong> fi nancing as part of larger <strong>disaster</strong> <strong>risk</strong> management (Cummins<br />
and Mahul 2008). Th e <strong>World</strong> Bank Independent Evaluation Group cites the<br />
Turkish Catastrophic Insurance Pool (TCIP) as a successful project, which has<br />
tripled the insurance penetration for earthquake coverage in Turkey. Established<br />
following the 2000 Marmara earthquake, the TCIP has an annual premium of<br />
US$20, despite covering up to $1 billion in damages in a <strong>disaster</strong> (IEG 2006).
170 ■ CLIMATE CHANGE, DISASTER RISK, AND THE URBAN POOR<br />
Caribbean Islands—Multi-country Partnership for Risk Financing<br />
For small countries for which a natural <strong>disaster</strong> could cause damage signifi cantly<br />
larger than their national economy, there is the option of sovereign <strong>risk</strong> fi nancing.<br />
Th e Caribbean Catastrophe Risk Insurance Facility (CCRIF), the fi rst multicountry<br />
<strong>risk</strong> pool in the world, is a regional insurance fund designed to mitigate<br />
the fi nancial impact of hurricanes or earthquakes by providing immediate liquidity.<br />
Th ere are 16 member nations: Anguilla, Antigua & Barbuda, Bahamas, Barbados,<br />
Belize, Bermuda, Cayman Islands, Dominica, Grenada, Haiti, Jamaica,<br />
St. Kitts & Nevis, St. Lucia, St. Vincent & the Grenadines, Trinidad & Tobago,<br />
and the Turks & Caicos Islands. During its fi rst season of operation, the 2007<br />
hurricane season, one earthquakes triggered payouts for two countries, and the<br />
Facility was able to make funds available within two weeks of the event (<strong>World</strong><br />
Bank 2008a).<br />
Central America—Securing Flexible Funding for<br />
Disaster-induced Emergency<br />
Recently, the International Bank for Reconstruction and Development (IBRD)<br />
has off ered Catastrophe Risk Deferred Drawdown Option, or CAT DDO, as<br />
a new product to middle-income country governments with <strong>disaster</strong> <strong>risk</strong>management<br />
programs in place. Countries can access the funds if they declare a<br />
<strong>disaster</strong>-induced state of emergency. Th e maximum amount available is US$500<br />
million, or 0.25 percent of a country’s gross domestic product, whichever is<br />
smaller. Loan pricing is in line with standard IBRD terms, which include a 0.25<br />
percentage point front-end fee. Th e funds may be drawn down over a threeyear<br />
period, which may be renewed up to four times for a total of 15 years.<br />
Th ere are currently CAT DDOs under development in the Central American<br />
countries of Panama, El Salvador, and Costa Rica. 11<br />
Recover—Good Practices in Building-Back-Better<br />
Aft er a <strong>disaster</strong> in which there is widespread destruction of housing and infrastructure,<br />
government agencies are oft en keen to rebuild. Large programs to<br />
reconstruct houses aft er <strong>disaster</strong>s mirror many of the limitations of public housing<br />
programs, including a refusal to rebuild on the sites preferred by those they<br />
are built for (post-<strong>disaster</strong> where the survivors previously lived or close by) and<br />
the use of distant sites far from survivors’ livelihoods. Residents may be frustrated<br />
by inappropriate designs and unfamiliar building materials. Costs are oft en high,<br />
as those with the greatest incentive to manage costs (that is, local residents) are
ANNEX 3: LEARNING FROM PROJECT AND PROGRAM EXPERIENCES ■ 171<br />
not included in decision making; for the same reason, there are frequent concerns<br />
with the quality of building materials and construction. 12<br />
An alternative approach to reconstruction is “owner-driven development.”<br />
Here, external agencies work with owners to support them in rebuilding their<br />
housing, drawing on the successful experiences with upgrading. Th is helps<br />
speed up responsive household-led reconstruction through providing additional<br />
resources (cash or building materials) and in some cases technical assistance<br />
(in part to improve the ability of houses to build in resilience to local hazards).<br />
Costs are kept down as local skilled building workers are used and families help<br />
with unskilled labor and, where possible, the use of recovered materials. Yet this<br />
approach may also only serve property owners and live tenants unprotected<br />
(Lyons 2008; Lyons and Schilderman 2010).<br />
A third approach to reconstruction is for local governments and external<br />
agencies to engage community organizations in identifying strategies to support<br />
construction and physical improvements. Here, there are very good possibilities<br />
for “building-back-better” to remove or greatly reduce <strong>disaster</strong> <strong>risk</strong>. A superfi cial<br />
community process will not successfully manage the reconstruction in a way that<br />
prevents the benefi ts from being secured by a few. Locally managed inclusive and<br />
representative groups have to be able to manage both fi nances and construction<br />
if they are to be successful in addressing their members’ shelter needs. Th ey need<br />
to be able to understand the regulatory context and identify the required amendments,<br />
and to negotiate with politicians and offi cials. Here, it is also possible for<br />
all those aff ected to be part of the building-back-better. For instance, in Mandaue,<br />
which was destroyed by a fi re, the inhabitants were organized (and supported by<br />
the Homeless People’s Federation of the Philippines) and they re-blocked their<br />
settlement and provided for long-term tenants as well as owners (Rayos and<br />
Christopher 2010).<br />
Indonesia—Channeling Reconstruction through<br />
Community-based Institutions<br />
Somewhat hidden from the world by the ongoing fl urry of Aceh tsunami<br />
recovery, the 2006 Java earthquake, with a magnitude of 6.3 on the Richter<br />
scale, was nevertheless an enormously destructive event. Over 350,000 residential<br />
units were lost and 5,760 persons were killed, most from the collapse of<br />
non-engineered masonry structures. Using lessons learned from the tsunami<br />
experience and resources from the Community-based Settlements Rehabilitation<br />
and Reconstruction project in Aceh supported by the <strong>World</strong> Bank, the<br />
Indonesian government was able to response quickly and effi ciently. Facilitators<br />
were recruited and villages elected boards of trustees, which later were instrumental<br />
in organizing community meetings and supervising implementation.
172 ■ CLIMATE CHANGE, DISASTER RISK, AND THE URBAN POOR<br />
Key activities included (1) identifying benefi ciaries and prioritizing the most<br />
vulnerable and poorest; (2) establishing community housing groups of 10 to<br />
15 families, and deciding on a coordinator, secretary, and treasurer for each<br />
group to be accountable for the use of grants; (3) developing detailed plans to<br />
use the construction grants for each group, and preparing group grant applications;<br />
(4) opening group bank accounts; and (5) approving plans, disbursement<br />
in tranches, and group procurement, construction, and bookkeeping. Training<br />
was provided to community members and local workers, as earthquakeresistant<br />
construction required consistent construction techniques. Later, the<br />
community developed plans to rebuild community infrastructure and facilities,<br />
with a particular focus on <strong>disaster</strong> resilience. Communities conducted selfsurveys,<br />
prepared thematic maps, analyzed needs and <strong>disaster</strong> <strong>risk</strong>s, reached<br />
consensus on priority programs, and established procedures for operations and<br />
maintenance. Grants for infrastructure were also disbursed in tranches through<br />
local banks as work progressed. 13<br />
An adequate understanding of rules and a sense of ownership by the community<br />
were essential to ensuring good targeting and plans, accountability,<br />
and social control of implementation. Th e involvement of women increased<br />
accountability and enhanced the appropriateness of technical solutions. Th e<br />
role of facilitators is crucial, as they ensure eff ective communication and adaptability<br />
of the program to local situations, as well as compliance with program<br />
principles. In all, 6,480 core houses were funded under UPP, and the multidonor<br />
Java Reconstruction Fund funded another 15,153 units using, among<br />
other sources, a loan from the <strong>World</strong> Bank (P103457). Th is approach to reconstruction<br />
became the model for the much larger government-fi nanced rehabilitation<br />
and reconstruction program, under which about 200,000 houses<br />
were rebuilt in Java. 14<br />
Volunteer Technology Communities<br />
In 2010 the <strong>disaster</strong> <strong>risk</strong>-management communities saw the rise of the “humanitarian<br />
technologist”: Regular technicians all over the world motivated to collaborate<br />
in post-<strong>disaster</strong> information gathering (GFDRR 2011). Volunteer<br />
Technology Communities (VTC) uses fl attened, decentralized structures of<br />
decision-making and confl ict and confl ict-resolution mechanisms that were<br />
adapted from online communities like Wikipedia and open-source soft ware<br />
development projects. For instance, aft er the Haiti earthquake the <strong>World</strong> Bank<br />
facilitated the mobilization of hundreds of volunteers through the Global Earth<br />
Observation—Catastrophe Assessment Network (GEO—CAN), which developed<br />
a comprehensive and rigorous damage analysis (GFDRR, 2011). Other
ANNEX 3: LEARNING FROM PROJECT AND PROGRAM EXPERIENCES ■ 173<br />
promising examples of VTCs include Random Hacks of Kindness (RHoK)—a<br />
partnership among Google, Microsoft , Yahoo, NASA, and the <strong>World</strong> Bank—and<br />
Crisis Commons, an international network of professionals drawn together by<br />
emergencies like the earthquakes in Chile and Haiti, the oil spill in Louisiana,<br />
and the fl ooding in Pakistan.<br />
Lessons Learned and Recommendations<br />
As <strong>climate</strong> <strong>change</strong> and <strong>disaster</strong> are expected to exacerbate existing inequalities,<br />
the most important takeaway from this review is that city managers should not<br />
view <strong>climate</strong> or <strong>disaster</strong> impacts as independent actions, but rather as impetus to<br />
improve the overall living conditions of the poor. Perceived vulnerability, widely<br />
considered the primary driver in adaptation planning, refl ects the inability of<br />
communities or individuals to react to the external forces on their well-being<br />
(Satterthwaite et al. 2007). To be proactive rather than reactive, governance<br />
practices should aim at providing the basic services, safeguards, and education<br />
to the urban poor, supporting their adaptive capacity (Adger et al. 2003). Backlogs<br />
in providing infrastructure and services in cities in low- and middle-income<br />
nations can be addressed through partnerships between local governments and<br />
community organizations. Th is section has given many examples of partnerships<br />
between community organizations formed by the residents of informal settlements<br />
and local governments in providing services. Th is meant a choice by these<br />
community organizations to work with government and a choice by government<br />
offi cials and agencies to stop seeing the residents of informal settlements as problems<br />
but start seeing their residents’ organizations as contributors to good solutions<br />
to local and citywide problems.<br />
A growing number of cities around the world have produced <strong>climate</strong> strategies<br />
that focus on mitigation techniques, since adaptation policies are harder<br />
to isolate, falling across agency and jurisdictional lines (Roberts 2008). Several<br />
cities, however, that do focus on adaptation, and take vulnerability into<br />
account, include New York (NYCPCC 2010), London (City of London 2008),<br />
Cape Town (City of Cape Town 2006), and Durban (Katich 2009). While much<br />
of this annex has highlighted interesting actions on the ground, these are a few<br />
of the cities using <strong>climate</strong> adaptation and <strong>disaster</strong> <strong>risk</strong> to reassess government<br />
activities—and gaining new perspective in relation to how planning can aff ect<br />
the urban poor. For cities that aim to alleviate <strong>climate</strong> and <strong>disaster</strong> <strong>risk</strong>s for the<br />
urban poor, the good practices outlined here suggest that improving resilience<br />
requires cities to improve services and allow <strong>risk</strong> to inform future investments<br />
and development.
TABLE A3.1<br />
Matrix of Recent Practice Cases<br />
Activity Country/ region Area of action Good practice<br />
Information, knowledge sharing, education and training<br />
Climate Resilient Communities Program United States Planning, assessment Builds off an existing global mitigation network<br />
Capacity Strengthening of Least Developing<br />
Countries for Adaptation<br />
to Climate Change (CLACC) Program<br />
Asian Cities Climate Change Resilience<br />
Network (ACCRN)<br />
Africa and South<br />
Asia<br />
Planning, assessment<br />
Asia Planning, assessment<br />
Climate Resilient Cities (CRC) Primer East Asia Planning, assessment<br />
ISO 31000 <strong>World</strong> Framework, standards<br />
Risk identifi cation<br />
Local Resilience Action Plan (LRAPs) Vietnam Planning, assessment<br />
Philippines Homeless People’s<br />
Federation<br />
Philippines Planning, assessment,<br />
data collection<br />
Network of international experts working to strengthen organizations<br />
in least-developed countries and support their sustainable<br />
development initiatives<br />
Shared Learning Dialogue (SLD) engages community actors and<br />
government agencies to explore their current and future vulnerabilities<br />
in a transparent and iterative group discussion. The SLD<br />
outcome focuses on creating a shared understanding of <strong>risk</strong> and<br />
priorities for action.<br />
Guidance for local governments for identifying “hot spots”<br />
Seeks to provide a universally recognized set of standards for<br />
organizational <strong>risk</strong> management<br />
Guiding local governments through the assessment of <strong>climate</strong><br />
<strong>change</strong> and <strong>disaster</strong> <strong>risk</strong> impacts and presenting the challenges of<br />
<strong>climate</strong> <strong>change</strong> and <strong>disaster</strong> in a format that local governments can<br />
use to present complex issues to their constituents<br />
Identifi cation of at-<strong>risk</strong> communities and help provide documentation<br />
on informal settlements for which there is little or no offi cial data<br />
Vulnerability mapping in Cuttack India Data collection Community-driven data collection and mapping using GIS systems<br />
174 ■ CLIMATE CHANGE, DISASTER RISK, AND THE URBAN POOR
Risk reduction: preparedness<br />
Mancomunidad de los Municipios del<br />
Centro de Atlantida (MAMUCA)<br />
Caracas and Buenos Aires earlywarning<br />
systems<br />
Argentina Urban Flood Prevention and<br />
Drainage Project<br />
Risk reduction: mitigation<br />
Community Infrastructure Upgrading<br />
Programs (CIUP)<br />
Improving water and sanitation in<br />
Quelimane City, Mozambique<br />
Local government strengthening in<br />
Senegal<br />
Orangi Pilot Project Research and<br />
Training Institute (OPP-RTI) of Pakistan<br />
Bolivia Urban Infrastructure Project<br />
and Urban Wastewater Methane Gas<br />
Capture Project<br />
Honduras Early-warning<br />
systems<br />
Venezuela Early-warning<br />
systems<br />
Argentina Early-warning,<br />
forecasting, housing<br />
programs<br />
Tanzania Community engagement<br />
in <strong>disaster</strong> <strong>risk</strong><br />
reduction (DRR)<br />
Mozambique Water, sanitation,<br />
transport<br />
Senegal Local governance,<br />
fl ood management<br />
Municipalities working together to identify <strong>risk</strong>s, raise awareness,<br />
prioritize reconstruction, encourage local decision making in a public<br />
forum, and engage in national <strong>risk</strong> management; establishment<br />
of local emergency committees (CODELs) to practice early-warning<br />
and evacuation drills<br />
Establishment of early-warning systems to alert the poor living in<br />
landslide- and fl ood-prone areas<br />
Development of a city <strong>risk</strong>-management program for Buenos Aires;<br />
second phase will improve the asset security of poor<br />
CIUP is an extensive program that focuses on improving physical<br />
access, as prioritized by the communities themselves.<br />
Creating partnerships with a broad range of stakeholders to improve<br />
water, sanitation, and road networks<br />
Preparing community-driven action plans to mitigate the effects of<br />
fl ooding<br />
Pakistan Water, sanitation Reduce the cost of household sanitary latrines or neighborhood<br />
sewers through design modifi cation and the elimination of outside<br />
contractors<br />
Bolivia Sanitation Expansion of sewerage coverage in poor areas of Santa Cruz, by<br />
increasing the capacity of four wastewater-treatment plants, and<br />
collecting methane for CDM purposes<br />
(continued next page)<br />
ANNEX 3: LEARNING FROM PROJECT AND PROGRAM EXPERIENCES ■ 175
TABLE A3.1 continued<br />
Activity Country/ region Area of action Good practice<br />
Karnataka Municipal Water Energy Effi<br />
ciency Project<br />
Vietnam National Urban Upgrading<br />
Programs (VUUP)<br />
Cash-for-work programs Cash for<br />
Work Temporary Employment Project<br />
Risk transfer<br />
India Energy, water Addresses key ineffi ciencies in the current system: ineffi cient and<br />
outdated pumping systems, improperly sized pumping systems,<br />
poor maintenance, operation at suboptimal loads, and high frictional<br />
losses through redundant pumps, pipes, and valves<br />
Vietnam Transportation,<br />
<strong>disaster</strong> <strong>risk</strong>, sanitation,<br />
water<br />
Liberia Job creation, sanitation,<br />
water<br />
Focuses on engaging local communities in the critical stages of<br />
preparation, design, and implementation while seeking to improve<br />
the living conditions of all residents<br />
Reducing poverty through job creation to maintain water and<br />
sanitation infrastructure<br />
Self and community-based insurance El Salvador Insurance Creation of community emergency funds<br />
Manizales insurance for the urban poor Colombia Insurance After 30 percent of the insurable buildings participate, insurance<br />
coverage is extended to tax-exempted properties.<br />
Turkish Catastrophic Insurance Pool<br />
(TCIP)<br />
Caribbean Catastrophe Risk Insurance<br />
Facility (CCRIF); Turkish Catastrophic<br />
Insurance Pool (TCIP)<br />
Catastrophe Risk Deferred Drawdown<br />
Option (CAT DDO)<br />
Recover<br />
Turkey Catastrophe <strong>risk</strong> Prior to a <strong>disaster</strong>, governments can secure a line of credit for<br />
immediate liquidity that can be used for post-<strong>disaster</strong> relief and<br />
reconstruction.<br />
Caribbean<br />
Islands; Turkey<br />
Catastrophe <strong>risk</strong> Provide governments with immediate liquidity for post-<strong>disaster</strong> relief<br />
and reconstruction<br />
Central America Catastrophe <strong>risk</strong> Countries can access the funds if they declare a <strong>disaster</strong>-induced<br />
state of emergency.<br />
Java Reconstruction Fund Indonesia Reconstruction Community-based resettlement and reconstruction in Java<br />
Volunteer Technology Communities<br />
(VTCs)<br />
<strong>World</strong> Post-<strong>disaster</strong> assessments<br />
Communities of software developers, engineers, and technology<br />
enthusiasts who are using innovative methods and tools to help<br />
save lives in the aftermath of natural <strong>disaster</strong>s.<br />
176 ■ CLIMATE CHANGE, DISASTER RISK, AND THE URBAN POOR
Notes<br />
ANNEX 3: LEARNING FROM PROJECT AND PROGRAM EXPERIENCES ■ 177<br />
1. http://www.undp.org/<strong>climate</strong><strong>change</strong>/adapt/defi nitions.html#15<br />
2. Th is approach has also been shown eff ective in <strong>disaster</strong> <strong>risk</strong> reduction and in post<strong>disaster</strong><br />
response, as discussed in later sections of this paper.<br />
3. Th is draws on ISDR, 2011 Global Assessment Report on Disaster Risk Reduction.<br />
4. Th is is drawn from Rayos and Christopher (2010) and PHPF (2010).<br />
5. Th is is drawn from Livengood (2011) and from fi eld visits to Cuttack by David Satterthwaite<br />
in June and October 2010.<br />
6. Th is paragraph draws on Archer and Boonyabancha (2010).<br />
7. Personal communication with Barjor Mehta, 2010.<br />
8. Unfortunately an application to the European Union for €1.5 million of funding was<br />
not successful, and so it remains uncertain whether the second, scaled-up phase of the<br />
program will be pursued.<br />
9. <strong>World</strong> Bank (2009) and personal communication with Da Zhu (2009).<br />
10. Th is includes the 2004 Vietnam Urban Upgrading Project and the 2008 Da Nang Priority<br />
Infrastructure Investment Project.<br />
11. <strong>World</strong> Bank. Background note: Catastrophe Risk Deferred Drawdown Option (DDO),<br />
or CAT DDO. http://go.worldbank.org/G41ZXJZO30.<br />
12. Th is section draws heavily on Archer and Boonyabancha (2010).<br />
13. Communication with Sri Probo Sudarmo, <strong>World</strong> Bank, Indonesia.<br />
14. Communication with Sri Probo Sudarmo, <strong>World</strong> Bank, Indonesia.<br />
References<br />
Adger, N., S. Huq, K. Brown, D. Conway, and M. Hulme. 2003. “Adaptation to Climate<br />
Change in the Developing <strong>World</strong>.” Progress in Development Studies 3 (3): 179–195.<br />
Agarwal, Siddarth. 2011. “Health and Inequality in Urban Populations in India.” Environment<br />
and Urbanization 23 (1).<br />
———, and K. Sangar. 2005. “Need for Dedicated Focus on Urban Health Within National<br />
Rural Health Mission.” Indian Journal of Public Health 49 (3): 141–151.<br />
Appadurai, Arjun. 2001. “Deep Democracy: Urban Governmentality and the Horizon of<br />
Politics.” Environment and Urbanization 13 (2): 23–43.<br />
Archer, Diane, and Somsook Boonyabancha. 2010. “Seeing a Disaster as an Opportunity:<br />
Harnessing the Energy of Disaster Survivors for Change.” Background paper prepared<br />
for the 2011 Global Assessment Report on Disaster Risk Reduction. Forthcoming in<br />
Environment and Urbanization 23 (2).<br />
Bollin, C., and F. Mascher. 2005. “’Honduras: Community Based Disaster Risk Management<br />
and Inter-Municipal Cooperation,’ A Review of Experience Gathered by the Special<br />
Inter-Municipal Cooperation.” MAMUCA. Eschborn: Deutsche Gesellschaft für<br />
Technische Zusammenarbeit.<br />
Cities Alliance. 2008. Comments on Progress Report, Improving Water and Sanitation in<br />
Quelimane City. P101077.<br />
City Council of Quelimane. 2006. Improving Water and Sanitation in Quelimane City,<br />
Mozambique.
178 ■ CLIMATE CHANGE, DISASTER RISK, AND THE URBAN POOR<br />
City of London. 2008. Th e London Climate Change Adaptation Strategy. London: Mayor<br />
of London.<br />
City of Cape Town. 2006. Framework for Adaptation to Climate Change in the City of Cape<br />
Town (FAC4T). City of Cape Town, Environment Resource Management. Cape Town:<br />
University of Cape Town.<br />
Cummins, J.D., and Olivier Mahul. 2008. Catastrophic Risk Financing in Developing Countries:<br />
Principles for Public Intervention. Washington, DC: <strong>World</strong> Bank.<br />
Diagne, Khady. 2007. “Governance and Natural Disasters: Addressing Flooding in Saint<br />
Louis, Senegal.” Environment and Urbanization 19 (2): 552–562.<br />
Douglas, Ian, Kurshid Alam, Maryanne Maghenda, Yasmin Mcdonnell, Louise Mclean,<br />
and Jack Campbell. 2008. “Unjust Waters: Climate Change, Flooding and the Urban<br />
Poor in Africa.” Environment and Urbanization 20 (1): 187–205.<br />
Fay, Marianne, Francis Ghesquiere, and Tova Solo. 2003. “Natural Disasters and the Urban<br />
Poor.” En Breve No. 32 (October), <strong>World</strong> Bank, Washington, DC.<br />
Global Facility for Disaster Reduction and Recovery (GFDRR). 2011. Volunteer Technology<br />
Communities: <strong>Open</strong> Development. GFDRR: Washington DC.<br />
Greater London Authority. 2010. Th e London Climate Change Adaptation Strategy, Draft<br />
Report. London: Greater London Authority. http://www.london.gov.uk/<strong>climate</strong><strong>change</strong>/<br />
strategy.<br />
Grimard, Alain. 2006–2008. Grant Progress Report, Improving Water and Sanitation in<br />
Quelimane City. P101077.<br />
Independent Evaluation Group (IEG). 2006. Hazards of Nature, Risks to Development: An<br />
IEG Evaluation of <strong>World</strong> Bank Assistance for Natural Disasters. Washington, DC: <strong>World</strong><br />
Bank Independent Evaluation Group. http://www.worldbank.org/ieg/natural<strong>disaster</strong>s/<br />
docs/natural_<strong>disaster</strong>s_evaluation.pdf.<br />
International Federation of Red Cross and Red Crescent Societies (IFRC). 2010. <strong>World</strong><br />
Disasters Report: Focus on Urban Risk. Geneva: IFRC.<br />
ISDR. 2006. “ISDR Secretariat Biennial Workplan: 2006–2007.” Geneva: UN International<br />
Strategy for Disaster Reduction Secretariat.<br />
———. 2009. Global Assessment Report on Disaster Risk Reduction. Geneva: UN International<br />
Strategy for Disaster Reduction. http://www.preventionweb.net/english/hyogo/<br />
gar/report/index.php?id=9413.<br />
Katich, K. 2009. “Urban Climate Resilience: A Global Assessment of City Adaptation<br />
Plans.” Master’s thesis, Massachusetts Institute of Technology. http://dspace.mit.edu/<br />
handle/1721.1/49698.<br />
Kiunsi, Robert B., John Lupala, Manoris Meshack, and Robert Kiunsi. 2009a. “Building<br />
Disaster-Resilient Communities: Dar es Salaam, Tanzania.” In Disaster Risk Reduction:<br />
Cases from Urban Africa, ed. Pelling and Wisner, 127-146. London: Earthscan.<br />
———. 2009b. Mainstreaming Disaster Risk Reduction in Urban Planning Practice in<br />
Tanzania: AURAN Phase II Project Final Report. African Urban Risk Analysis Network.<br />
http://www.preventionweb.net/files/13524_TANZANIAFINALREPORT27OCT09<br />
Mainstrea.pdf.<br />
Livengood, Avery. 2011. “Enabling Participatory Planning with GIS: A Case Study of Settlement<br />
Mapping in Cuttack, India.” Environment and Urbanization 23 (2).<br />
Lyons, Michal. 2008. “Building Back Better: Th e Large Scale Impact of Small Scale<br />
Approaches to Reconstruction.” <strong>World</strong> Development 37 (2): 385–398.
ANNEX 3: LEARNING FROM PROJECT AND PROGRAM EXPERIENCES ■ 179<br />
———, and Th eo Schilderman, eds. 2010. Building Back Better: Delivering People-centred<br />
Housing Reconstruction at Scale. Practical Action Publishing, Rugby.<br />
Mitlin, Diana. 2008. “With and Beyond the State: Co-production as a Route to Political<br />
Infl uence, Power and Transformation for Grassroots Organizations.” Environment and<br />
Urbanization 20 (2): 339–360.<br />
New York City Panel on Climate Change (NYCPCC). 2010. Climate Change Adaptation<br />
in New York City: Building a Risk Management Response. Ed. C. Rosenzweig and<br />
W. Solecki. Annals of the New York Academy of Sciences, Vol. 1196. Wiley-Blackwell.<br />
http://www.nyas.org/Publications/Annals/Detail.aspx?cid=ab9d0f9f-1cb1-4f21-b0c8-<br />
7607daa5dfcc<br />
Patel, Sheela, Celine D’Cruz, and Sundar Burra. 2002. “Beyond Evictions in a Global City:<br />
People-Managed Resettlement in Mumbai.” Environment and Urbanization 14 (1):<br />
166–171.<br />
Philippines Homeless People’s Federations (PHPF). 2010. “Addressing Vulnerabilities<br />
through Support Mechanisms: HPFPI’s Ground Experience in Enabling the Poor to<br />
Implement Community-rooted Interventions on Disaster Response and Risk Reduction.”<br />
Background paper prepared for the 2011 Global Assessment Report on Disaster<br />
Risk Reduction.<br />
Rayos, Co, and Jason Christopher. 2010. “Community-driven Disaster Intervention: Th e<br />
Experience of the Homeless Peoples Federation Philippines.” IIED/ACHR/SDI Working<br />
Paper, London, International Institute for Environment and Development.<br />
Roberts, D. 2008. “Th inking Globally, Acting Locally: Institutionalizing Climate Change<br />
at the Local Level.” Environment and Urbanization 20 (2): 521–537.<br />
Satterthwaite, David. 2011. How Local Governments Can Work with Communities in the<br />
Delivery of Basic Services, processed.<br />
Satterthwaite, D., S. Huq, M. Pelling, H. Reid, and P. Romero-Lankao. 2007. Building Climate<br />
Change Resilience in Urban Areas and Among Urban Populations in Low- and<br />
Middle-Income Nations. Building for Climate Change Resilience, Center for Sustainable<br />
Urban Development.<br />
Simms, Andrew, and Hannah Reid. 2006. Up in Smoke? Latin America and the Caribbean:<br />
Th e Th reat from Climate Change to the Environment and Human Development: Th ird<br />
Report from the Working Group on Climate Change and Development. London: Oxfam.<br />
Velasquez, Luz Stella. 1998. “Agenda 21: A Form of Joint Environmental Management in<br />
Manizales, Colombia.” Environment and Urbanization 10 (2): 9–36.<br />
Velasquez Barrero, Luz Stella. 2010. “La Gestion del Riesgo en el Contexto Ambiental<br />
Urbano Local: Un Reto Permanente y Compartido. Caso Manizales, Colombia.”<br />
Background paper prepared for the 2011 Global Assessment Report on Disaster Risk<br />
Reduction.<br />
<strong>World</strong> Bank. 2004a. “Local Government Support Project.” Project Appraisal Document<br />
P070736, <strong>World</strong> Bank, Washington, DC.<br />
———. 2004b. “Vietnam Urban Upgrading Project.” Project Appraisal Document<br />
P070197, <strong>World</strong> Bank, Washington, DC.<br />
———. 2005. “Argentina Urban Flood Prevention and Drainage Project—Adaptable Program<br />
Loan.” Project Appraisal Document P088220, <strong>World</strong> Bank, Washington, DC.<br />
———. 2006a. “Argentina Urban Flood Prevention and Drainage Project—Adaptable Program<br />
Loan 2.” Project Appraisal Document P093491, <strong>World</strong> Bank, Washington, DC.
180 ■ CLIMATE CHANGE, DISASTER RISK, AND THE URBAN POOR<br />
———. 2006b, “Bolivia Urban Infrastructure Project.” Project Information Document:<br />
Appraisal Stage P083979, <strong>World</strong> Bank, Washington, DC.<br />
———. 2007. “Bolivia Urban Wastewater Methane Gas Capture Project.” Project Information<br />
Document: Appraisal Stage P104092, <strong>World</strong> Bank, Washington, DC.<br />
———. 2008a. Th e Caribbean Catastrophe Risk Insurance Initiative: A Review of CCRIF’s<br />
Operation<br />
Aft er Its First Season. Washington, DC: <strong>World</strong> Bank.<br />
———. 2008b. “Da Nang Priority Infrastructure Investment Project.” Project Appraisal<br />
Document, <strong>World</strong> Bank, Washington, DC.<br />
———. 2009. “Karnataka Municipal Water Energy Effi ciency Project.” Carbon Finance<br />
Assessment Memorandum P100352, <strong>World</strong> Bank, Washington, DC.<br />
———. 2010. “National Vietnam Urban Upgrading Program—Mekong Delta Region.”<br />
Project Information Document: Concept Stage, <strong>World</strong> Bank, Washington, DC.<br />
<strong>World</strong> Watch Institute. 2007. State of the <strong>World</strong> 2007: Our Urban Future. New York:<br />
Norton.<br />
Zampaglione, Giuseppe. 2008. “Liberia Cash for Work Temporary Employment Project.”<br />
Powerpoint Presentation, <strong>World</strong> Bank. http://www.google.com/url?sa=t&source=<br />
web&cd=9&ved=0CEAQFjAI&url=http%3A%2F%2Fsiteresources.worldbank.org%<br />
2FSOCIALPROTECTION%2FResources%2F280558-1138289492561%2F2158434-<br />
1228317850075%2F5637583-1228319671628%2FPW_Zampaglione_Liberia<br />
.pdf&ei=EGFgTM2mNcH48AaFz_TBDQ&usg=AFQjCNFEWT5-R4n4un<br />
DnS5GYoF0z_Ygy9w
Annex 4: Dar es Salaam Case Study<br />
Overview and Key Findings<br />
More than 70 percent of Dar es Salaam’s 5 million residents live in informal,<br />
unplanned settlements that lack adequate infrastructure and services, and over<br />
half of them survive on roughly a dollar per day. With a population growth rate<br />
■ 181
182 ■ CLIMATE CHANGE, DISASTER RISK, AND THE URBAN POOR<br />
of about 8 percent per year, Dar es Salaam is one of the fastest-growing cities in<br />
Sub-Saharan Africa. City and municipal authorities face signifi cant challenges<br />
with respect to providing new or even maintaining existing infrastructure and<br />
services.<br />
Th e summary of this case study presents the fi rst comprehensive overview of<br />
the intersection between <strong>climate</strong> <strong>change</strong>, <strong>disaster</strong> <strong>risk</strong>, and the urban poor in Dar<br />
es Salaam. It seeks to understand (1) what are the key aspects of the vulnerability<br />
of the urban poor in the city; (2) how <strong>climate</strong> <strong>change</strong> increases this vulnerability;<br />
and (3) which policies and programs can be developed that reduce the vulnerability<br />
of the poor, taking both current and expected future <strong>climate</strong> <strong>change</strong> into<br />
account.<br />
Th e case study is a joint work among the <strong>World</strong> Bank, the Institute of Resource<br />
Assessment of the University of Dar es Salaam, Ardhi University, the Tanzania<br />
Meteorological Agency (TMA), International START Secretariat, and the Dar es<br />
Salaam City Council.<br />
Th e approach used in this case study is based on the Urban Risk Assessment<br />
(URA) framework. Accordingly, it includes an assessment of the hazards, socioeconomic<br />
vulnerabilities, and institutional aspects related to <strong>climate</strong> <strong>change</strong> and<br />
<strong>disaster</strong>s in Dar es Salaam.<br />
First, the case study reviews available published information on Dar es<br />
Salaam’s demographics, access to infrastructure and basic services, and climatic<br />
trends and projections. Second, it conducts a household-level socioeconomic<br />
survey on populations living in fl ood-<strong>risk</strong> areas. Th e survey is<br />
complemented by on-site observations and inspection of surroundings, as<br />
well as focus-group discussions with residents. Th ird, the study interviews relevant<br />
institutional representatives. Finally, a fl ood-modeling exercise is conducted,<br />
which maps the potential <strong>change</strong>s in rainfall regime and sea-level rise<br />
and models fl ooding impacts in those highly vulnerable areas covered in the<br />
socioeconomic surveys.<br />
Key Findings of the Study<br />
• Rapid unplanned urbanization in Dar es Salaam has led to fl ood <strong>risk</strong> in many<br />
informal settlements, with a wide range of associated health and other problems<br />
for residents (see fi gure A4.6 in the color section).<br />
• Disaster <strong>risk</strong> management has not been addressed and needs to be integrated<br />
in all aspects of urban planning in Dar es Salaam.<br />
• Th e ecological and hydrological role of wetlands is not well understood or<br />
incorporated in urban development planning.<br />
• Th e sustainability of infrastructure development initiatives and their maintenance<br />
is poor.
ANNEX 4: DAR ES SALAAM CASE STUDY ■ 183<br />
• Coordination among local stakeholders is needed.<br />
• Industries need to be relocated away from residential areas and will require<br />
access to a waste-stabilization pond.<br />
• Awareness-raising programs are needed at the community level for improved<br />
sanitation practices.<br />
The Government of Dar es Salaam at Work<br />
Despite the number of challenges that Dar es Salaam is facing, the government<br />
has been supporting key initiatives in areas such as coastal management, slum<br />
upgrading, and greenhouse gas mitigation. For instance, the Kinondoni Integrated<br />
Coastal Area Management Project (KICAMP) formulated a comprehensive<br />
plan on the management of land and water resources in coastal areas. Th is<br />
project resulted in banning the excavation of sands in critical areas to prevent<br />
further beach erosion along the coastal area. Households are being made aware<br />
of the value of mangroves and are involved in their protection; combined with<br />
heavy protection from KICAMP, this has led to increases in mangroves. Th e<br />
government has also invested recently in sea walls on highly susceptible areas<br />
to sea-level rise, storm surges, and coastal erosion such as Kunduchi beach and<br />
Bahari beach.<br />
Another example of the government at work is the Community Infrastructural<br />
Upgrading Program (CIUP), which improves physical infrastructure such
184 ■ CLIMATE CHANGE, DISASTER RISK, AND THE URBAN POOR<br />
as storm-water drainage networks and strengthens the capacity of communities<br />
to better help themselves, especially those living in unplanned settlements.<br />
On the mitigation side, the Dar es Salaam City Council has shown great leadership<br />
by closing the Mtoni solid-waste dumpsite and, in collaboration with a<br />
private company, created mechanisms for tapping and fl aring the gases produced<br />
at the dump and recovering costs through clean development.<br />
Key Constraints<br />
Key constraints in dealing eff ectively with <strong>climate</strong> <strong>change</strong>, <strong>disaster</strong> <strong>risk</strong>, and the<br />
urban poor include:<br />
DATA—Th e lack of high-resolution digital maps is a limitation for comprehensive<br />
<strong>risk</strong> assessment.<br />
INFORMATION SYSTEMS—Signifi cant increase in revenue generation is<br />
needed to ensure both increased service coverage and quality of services, particularly<br />
taking into account the additional resilience needed to reduce the <strong>risk</strong> posed<br />
by <strong>climate</strong> <strong>change</strong> for the city. Priorities in meeting the challenges include improving<br />
information systems (databases) and updating valuation rolls; optimizing the<br />
potential of property tax and simplifying the development levy; and developing<br />
vigilant collection strategies and more enhanced law-enforcement capacity.<br />
LIMITED CAPACITY—Limited capacity hinders progress in dealing with <strong>climate</strong><br />
<strong>change</strong>, natural <strong>disaster</strong>s, and urban poverty reduction. For instance, at the<br />
community level, it is important to build capacity on the link between unsanitary<br />
waste-disposal practices, stagnant water, unclean drinking water, and disease. At<br />
the same time, environmental committees and community-based organizations<br />
need to be trained about organized waste collection and its link to reduced vector/insect<br />
breeding and disease.<br />
At the local level, research capacity needs to be built to better understand the<br />
likely impacts of <strong>climate</strong> <strong>change</strong> in the long term for the poor of Dar es Salaam. In<br />
the city planning departments, it is important to build a common understanding<br />
of the long-term sectoral impacts of <strong>climate</strong> <strong>change</strong> for Dar es Salaam.<br />
At the national level, the capacity of the Tanzania Meteorological Agency<br />
needs to be improved in weather and <strong>climate</strong> monitoring, including in more<br />
accurately predicting severe weather and extreme climatic events, and in analyzing<br />
and interpreting data. Improvements are also needed in disseminating alerts<br />
and early warnings.<br />
Finally, links need to be forged and enhanced between <strong>climate</strong> experts and<br />
journalists to ensure eff ective dissemination of information on <strong>climate</strong> <strong>change</strong>.<br />
Main Information Gaps Identifi ed<br />
Th is case study has been a fi rst step in taking stock of what has already been<br />
done in terms of comprehensive <strong>risk</strong> assessment of informal settlements in Dar
ANNEX 4: DAR ES SALAAM CASE STUDY ■ 185<br />
es Salaam. An important fi nding is that laws related to Urban/Town Planning and<br />
Settlement need to be reviewed to ensure they deal adequately with vulnerability<br />
and <strong>risk</strong>. It is also important to determine how existing environmental and propoor<br />
policies and laws can be better enforced.<br />
Th e case study recommends conducting an in-depth analysis of cost-eff ective<br />
adaptation in light of changing socioeconomic and climatic trends in the city.<br />
Furthermore, sectoral case studies with an emphasis on the urban poor should be<br />
conducted in order to examine future needs, for a 20- to 30-year timeframe, on<br />
drainage, water supply, waste management, housing, and health planning, among<br />
others. Such case studies should involve teams of local institutions as well relevant<br />
international institutions with advanced technical expertise.<br />
Looking Forward<br />
Th e case study suggests that the best starting point for reducing vulnerability to<br />
<strong>climate</strong> <strong>change</strong> in the future is to reduce present vulnerability, such as by reducing<br />
threats to health by improving city drainage and environmental sanitation.<br />
Th e case study also captures key areas for further collaborative work moving<br />
forward:<br />
• Support for public agencies to improve waste collection, drainage, water, and<br />
sanitation programs. Although all municipal agencies are required to comply<br />
with and implement the National Environmental Policy and the National<br />
Environmental Act, oft en they lack the funding needed to meet the responsibilities<br />
entailed, or the supervision capabilities to counter actions that contravene<br />
city laws and bylaws.<br />
• Integrate <strong>disaster</strong> <strong>risk</strong> management in urban planning. Guidelines for <strong>disaster</strong><br />
<strong>risk</strong> reduction should be mainstreamed in the preparation of schemes for general<br />
planning, detailed planning, detailed urban renewal, and regularization.<br />
• Support public health programs. Cost-eff ective mass-treatment programs<br />
need to be implemented for Neglected Tropical Diseases (NTDs) and more<br />
eff orts also need to be put into integrated approaches to control malaria,<br />
rather than relying solely on the distribution of nets treated with insecticide.<br />
Improvements to drainage systems and their regular maintenance will go a<br />
long way toward reducing fl ooding and consequent ponding and stagnation<br />
of water, thereby reducing breeding sites.<br />
• Support Clean Development Mechanism (CDM) activities. Dar es Salaam<br />
should seek further CDM support in expanding and scaling up the City<br />
Council’s existing plans to manage solid waste.<br />
• Support existing successful urban upgrading programs. Th ese have great<br />
potential, as they involve communities in identifying problems and solutions
186 ■ CLIMATE CHANGE, DISASTER RISK, AND THE URBAN POOR<br />
and cover a wide array of physical and institutional measures to improve<br />
urban areas.<br />
• Encourage a long-term planning horizon. Adaptation planning for Dar es<br />
Salaam’s poor residents should address their present urgent needs and those<br />
to come, given expected future impacts of <strong>climate</strong> <strong>change</strong>.<br />
Case Study Summary<br />
City Profi le<br />
Dar es Salaam is located in the eastern part of the Tanzanian mainland at<br />
6 o 51’S latitude and 39 o 18’E longitude (see figure A4.1, color section). With<br />
an area of 1,350 square kilometers (km 2 ), it occupies 0.19 percent of the<br />
Tanzanian mainland, stretching about 100 km between the Mpiji River to<br />
the north and beyond the Mzinga River in the south. The Indian Ocean borders<br />
it to the east. The beach and shoreline comprise sand dunes and tidal<br />
swamps. Coastal plains composed of limestone extend 10 km to the west of<br />
the city, 2 to 8 km to the north, and 5 to 8 km to the south. Inland, alluvial<br />
plains comprise a series of steep-sided U-shaped valleys. The upland plateau<br />
comprises the dissected Pugu Hills, 100 m to 200 m in altitude. Dominated<br />
by limestones, sandy clays, coarse sands, and mixed alluvial deposits,<br />
the soils of the Dar es Salaam region are not particularly fertile (Dongus,<br />
2000). The city is divided into three ecological zones, namely the upland<br />
zone consisting of hilly areas to the west and north of the city, the middle<br />
plateau, and the lowlands, which include the Msimbazi Valley, Jangwani,<br />
Mtoni, Africana, and Ununio areas.<br />
Built Environment and Basic Service Provision<br />
An estimated 70 percent of Dar es Salaam’s population lives in poor, unplanned<br />
settlements (<strong>World</strong> Bank 2002). Residents are usually too poor to pay for services<br />
or infrastructure and authorities too resource-constrained to maintain these;<br />
thus, health and environmental conditions are generally extremely poor. About<br />
half the residents of Dar es Salaam’s informal settlements live on an average<br />
income of US$1 per day and in constrained circumstances. Many are migrants<br />
from other parts of Tanzania in search of better opportunities.<br />
Access to clean water and sanitation are major problems for Dar es Salaam’s<br />
poor, and contribute to widespread illness, including cholera, malaria, lymphatic<br />
fi lariasis, and diarrhea, particularly during fl oods, which could be more severe or<br />
frequent in the future due to <strong>climate</strong> <strong>change</strong>.<br />
Up to about 75 percent of the residents of Dar es Salaam’s informal housing<br />
settlements are unemployed or under-employed (<strong>World</strong> Bank 2002), with the
TABLE A4.1<br />
Dar es Salaam Profi le<br />
ANNEX 4: DAR ES SALAAM CASE STUDY ■ 187<br />
Total city population in 2002 2.5 million<br />
Estimated 5 million in 2020<br />
Population growth (% annual) 4.39 (city mayor’s statistics, 2006)<br />
8 (<strong>World</strong> Bank 2002)<br />
Land area (km2 ) 1,590<br />
Population density (per hectare) 1,500<br />
Country’s per capita GDP (US$) 1,300 (2007)<br />
Date of last Urban Master Plan 2010<br />
main source of income for the latter group being through informal activities<br />
and micro-enterprise. Employment in Dar es Salaam as a whole declined from<br />
64 percent to 42 percent between 1992 and 2000, and self-employment rose from<br />
29 percent to 43 percent. Poverty for those in self-employment rose from 29 percent<br />
to 38 percent over the same period (<strong>World</strong> Bank 2002).<br />
Th e city’s road network totals about 1,950 km, of which 1,120 km (less than<br />
60 percent) is paved, and is inadequate to satisfy its population density, spatial<br />
expansion, and transportation needs. Dar es Salaam hosts about 52 percent of<br />
Tanzania’s vehicles, and has a traffi c density growth rate of over 6.3 percent per<br />
year (JICA 1995; Kanyama et al. 2004).<br />
Th e city’s planning agencies have been unable to keep pace with the rapid<br />
expansion of the city, largely fueled by migrant growth. Most of the city’s<br />
population lives in unplanned settlements—many in abject poverty—which<br />
are characterized by substandard infrastructure and lack of basic municipal<br />
and other services. Th ese communities face transportation constraints, insecure<br />
housing, problems accessing clean water, unhygienic sanitation, and lack<br />
of awareness on hygienic sanitary practices. Climatic factors, such as heavy<br />
rainfall, work in conjunction with this situation to impose additional hardship<br />
and increase disease.<br />
Pillar 1—Institutional Assessment<br />
Agencies in Disaster Risk Management and Climate Change Adaptation<br />
Dar es Salaam is managed by the Dar es Salaam City Council and the Municipal<br />
Councils of Temeke, Kinondoni, and Ilala. Th e three municipal authorities are<br />
under the Ministry of Regional Administration and local government. Each has<br />
individual sets of technical and administrative departments.
188 ■ CLIMATE CHANGE, DISASTER RISK, AND THE URBAN POOR<br />
Th e Dar es Salaam City Council (DCC) has a coordinating role and attends to<br />
issues that cut across all three municipalities. Its functions are to:<br />
• Coordinate the functions of the three municipal authorities regarding infrastructure.<br />
• Prepare a coherent citywide framework for enhancing sustainable development.<br />
• Promote cooperation between the City Council and the three municipal or<br />
local authorities.<br />
• Deal with all matters where there is interdependency among the city’s local<br />
authorities.<br />
• Support and facilitate the overall functioning and performance of the local<br />
authorities.<br />
• Maintain peace, provide security and emergency, fi re, and rescue services,<br />
ambulance and police.<br />
• Promote major functions relating to protocol and ceremonies.<br />
Th e municipal councils are responsible for providing basic social services,<br />
which include primary education and partly secondary education (especially<br />
where the community is involved), primary health care, waste management<br />
and cleanliness, district roads, water supply, and monitoring of trade and<br />
development, especially informal sector development and management, cooperatives,<br />
agriculture and livestock development, forestry, fi sheries, recreational<br />
parks, and urban planning.<br />
Th e Tanzania Meteorological Agency (TMA) issues fl ood warnings for Dar es<br />
Salaam. It provides warnings and advisories on extreme rainfall and fl ooding based<br />
on daily weather monitoring. Cloud evolution is monitored through observations<br />
and by using satellite pictures. Th e evolution and pathway of tropical cyclones along<br />
the Western Indian Ocean are also monitored on a real-time basis. Warnings and<br />
advisories are disseminated to the public as needed, through various stakeholders<br />
such as the mass media and the <strong>disaster</strong>-management department at the prime<br />
minister’s offi ce. Flood warnings and advisories are given up to a day in advance<br />
(24-hour forecast) or at seasonal timescales (up to two months in advance).<br />
Relevant Policies and Legislation<br />
• At national level: National Human Settlements Development policy (2000),<br />
National Environmental Policy (1997), Ratifi cation of the UN Framework<br />
Convention on Climate Change (UNFCCC) (1996).<br />
• At local level: Th e Sustainable Dar es Salaam Project and the Strategic Urban<br />
Development Plan (SUDP) started in 1992, Community Infrastructural<br />
Upgrading Programme (CIUP) started in 2001, and African Urban Risk<br />
Analysis Network (AURAN) Project Phases I and II started in 2004.
ANNEX 4: DAR ES SALAAM CASE STUDY ■ 189<br />
Ongoing Programs in Disaster Risk Management and Climate Change<br />
• Rehabilitation of storm water drainage and sewerage system: City authorities<br />
undertook improvements in the city center. However, a new wave of investment<br />
has led to construction of new structures in former empty spaces,<br />
including the construction of multiple-use buildings that have increased<br />
demands for water supply and enlarged high-capacity sewage pipes. Th e tonnage<br />
of solid and liquid waste generated has increased, demanding effi cient<br />
solid- and liquid-waste management and monitoring services. On occasion,<br />
wide and deep storm water drains are appropriated by private homeowners,<br />
fenced in as part of their property, and sealed up, which causes waste back-up<br />
among poorer neighbors. Laws need to be better enforced and drainage line<br />
capacity reassessed. It is important that when this occurs, planners consider<br />
the fact that capacity needs are likely to <strong>change</strong> over the lifetime of the drainage<br />
system; the system needs to plan for changing rainfall regimes over the<br />
planning horizon, for example, up to 2050.<br />
• Property formalization in Dar es Salaam: Th e government is implementing<br />
a project to identify all properties in informal settlements in Dar es Salaam<br />
and at the same time issuing land/property licenses or right of occupancy<br />
to curb further densifi cation of those areas and to improve security of tenure,<br />
which could be used as collateral for economic empowerment (URT<br />
2004 in: Kyessi and Kyessi 2007). Th is formalization process will be a<br />
foundation for the regularization of the slums that will ultimately allow<br />
provision of infrastructure including drainage channels for storm water,<br />
piped water supply, refuse collection using municipal and private vehicles,<br />
sanitation (pit and septic tank emptying services), secure tenure (loans),<br />
improved housing conditions, and reduced overcrowding in unplanned<br />
settlements.<br />
• National Adaptation Programme of Action (NAPA): Tanzania is party to the UN<br />
Framework Convention on Climate Change (UNFCCC) and the Kyoto Protocol<br />
and has prepared a National Adaptation Programme of Action (NAPA<br />
2007). Th e capacity for investing in adaptation activities (protecting vulnerable<br />
populations, infrastructure, and economies) is still low due to fi nancial<br />
constraints (NAPA 2007). However, NAPA will help in integrating adaptation<br />
issues in the development process, guiding development to address urgent and<br />
immediate needs for adapting to adverse impacts of <strong>climate</strong> <strong>change</strong>. Among<br />
other objectives, NAPA aims at improving public awareness on the impacts of<br />
<strong>climate</strong> <strong>change</strong> and on potential adaptation measures that can be adopted. In<br />
Dar es Salaam, activities have included planting trees along the beach, roadsides,<br />
near houses, and in open spaces.<br />
• Management of coastal areas: Dar es Salaam is a coastal city and <strong>climate</strong> <strong>change</strong><br />
is expected to exacerbate vulnerability of poor coastal communities through
190 ■ CLIMATE CHANGE, DISASTER RISK, AND THE URBAN POOR<br />
sea-level rise, possibly more intense coastal storms, and increased rainfall<br />
variability. Coastal management projects involve beach conservation, including<br />
conservation of mangroves and coral reefs, as well as Marine Park protection.<br />
Poverty alleviation, such as facilitation of seaweed farming, is also oft en<br />
included. Some of the city’s coastal management projects are noted below.<br />
In particular, the Kinondoni Integrated Coastal Area Management Project<br />
(KICAMP) aims to formulate a comprehensive plan focused on the use of<br />
land and water resources in coastal areas. Th e project has banned the excavation<br />
of sands in Kunduchi-Mtongani as a way to prevent further beach erosion<br />
along the coastal area. Households are being made aware of the value of mangroves<br />
and involved in their protection, and, combined with heavy protection<br />
from KICAMP, this has led to an increase in mangroves. Other civil-society<br />
organizations involved in conservation, awareness raising, and environmental<br />
management included Roots and Shoots, <strong>World</strong> Vision, URASU (Uchoraji na<br />
Ramani na Sanaa Shirikishi Dhidi ya Ukimwi), and the International Organization<br />
on Migration, which helped to form environmental management<br />
societies in schools, markets, and dispensaries. Schools had already planted<br />
trees and botanical gardens in their compounds. Msasani Bonde la Mpunga<br />
is also involved in coastal conservation through a partnership with the <strong>World</strong><br />
Wildlife Fund (WWF), the Wildlife Society for Nature Conservation, the private<br />
sector (running tourist hotels and sea boats), the International Union for<br />
Conservation of Nature (IUCN), and Tanzania Marine Park authorities.<br />
• Sustainable coastal communities and ecosystems: Th is USAID-funded project<br />
(implemented by Rhode Island and Hawaii-Hilo universities) builds adaptive<br />
capacity and resilience among vulnerable coastal communities. Th e program<br />
has introduced “raft culture” techniques, where seaweed is grown in deeper<br />
water where it is less vulnerable to fl uctuations in temperature and salinity,<br />
enabling benefi ciaries to earn a living throughout the year.<br />
• Construction of adaptive structures in Dar es Salaam: A comprehensive beach<br />
conservation program has been designed that includes the following components:<br />
(1) sea walls have been constructed along the front of the Aga Khan<br />
Hospital to prevent further erosion of Sea View Road; (2) sea walls and groins<br />
have been constructed along some beaches, which benefi ts hotels by reducing<br />
beach erosion and property damage from waves, and also helps fi shing community<br />
settlements that live near the sea; and (3) land reclamation is taking<br />
place along coastal areas, for example, by covering quarry pits with soil and<br />
trees and building houses on these reclaimed areas. Th e Kunduchi-Salasala<br />
quarry area is an example.<br />
• Other: Th e country has strengthened multilateral relations at the international<br />
level in order to enhance the ability to cope with <strong>climate</strong> <strong>change</strong> and variability<br />
for sustainable livelihoods. For example, Tanzania and the Kingdom of
ANNEX 4: DAR ES SALAAM CASE STUDY ■ 191<br />
Norway have agreed to partner to combat adverse impacts of <strong>climate</strong> <strong>change</strong>.<br />
Under this program, Tanzanian scholars are trained on <strong>climate</strong> <strong>change</strong> issues<br />
(planning and forecasting), and, as short courses on <strong>climate</strong> <strong>change</strong> tend to be<br />
publicized through newspapers and on television, awareness is raised among<br />
the public on <strong>climate</strong> <strong>change</strong> impacts, adaptation measures, and mitigation.<br />
Leading Agencies<br />
Currently, there is not a leading agency coordinating the <strong>disaster</strong> <strong>risk</strong> management<br />
activities at the local level. Th ere is a lack of coordination horizontally<br />
among departments and vertically with national policies.<br />
Pro-Poor Services and Infrastructure Local Expenditure<br />
Dar es Salaam’s municipal agencies provide infrastructure and socioeconomic<br />
services such as health, water, education, solid-waste management, cooperative<br />
and community development, roads, development of natural resources,<br />
trade and agriculture and livestock, and information and communication<br />
technology development. Despite eff orts to improve social services for city<br />
dwellers, increased migration and unemployment have made services poor<br />
and unaff ordable. Rapid urbanization in Dar es Salaam is resulting in growing<br />
numbers of the population living in unplanned, densely settled squatter<br />
areas with little or no access to social services. Despite purported improvements<br />
in fi scal position and revenue collection, improved record-keeping,<br />
and enhanced accountability, the Dar es Salaam City Council (including its<br />
municipalities) still faces considerable challenges in spending on pro-poor<br />
services and on improving infrastructure in unplanned and underserved areas.<br />
Signifi cant increase in revenue generation is needed to ensure both increased<br />
service coverage and quality of services, particularly taking into account the<br />
additional resilience needed to reduce the <strong>risk</strong> posed by <strong>climate</strong> <strong>change</strong> for<br />
the city. Priorities in meeting the challenges include improving information<br />
systems (databases) and updating valuation rolls; optimizing the potential<br />
of property tax and simplifying the development levy; and developing vigilant<br />
collection strategies and more enhanced law enforcement capacity (City<br />
Council, undated Brief DSM V2: 6).<br />
Pillar 2—Hazards Assessment<br />
Past Natural Disasters<br />
Dar es Salaam is already highly vulnerable to climatic variability, which is<br />
expected to increase as <strong>climate</strong> continues to <strong>change</strong>. Th e aspect of most frequent<br />
concern to Dar es Salaam currently is heavy rainfall. In combination with poor<br />
drainage, illegal construction, and other infrastructure problems, heavy rainfall
192 ■ CLIMATE CHANGE, DISASTER RISK, AND THE URBAN POOR<br />
TABLE A4.2<br />
Natural Hazards<br />
Earthquake N<br />
Wind storm N<br />
River fl ow N 2010<br />
Floods, inundations, and waterlogs Y<br />
Tsunami N<br />
Drought Y 2006<br />
Volcano N<br />
Landslide Y<br />
Storm surge N<br />
Extreme temperature Y<br />
Yes /No Date of last major event<br />
results in fl ooding that causes major losses and disruptions. For the multitudes<br />
of the city’s population living in informal settlements, poor sanitation contributes<br />
to an additional threat: disease. Diseases commonly occurring in these congested,<br />
unsanitary settlements during fl oods include malaria, cholera, dysentery,<br />
and diarrhea. Some other factors that contribute to fl ooding in these settlements<br />
include fl at topography, lack of storm-water drainage, blockage of natural drainage<br />
systems, building in hazardous areas, and unregulated housing and infrastructure<br />
development. Livelihood activities are also adversely aff ected by both<br />
heavy rainfall and drought.<br />
Main Climate Hazards<br />
Temperature trends over the past four to fi ve decades show signifi cant increase.<br />
Temperature is projected to increase.<br />
As Figure A4.3 shows, mean annual rainfall has declined in Dar es Salaam<br />
over the past fi ve decades (as recorded at the Dar es Salaam Airport station).<br />
Figure A4.4 shows mean and absolute 24-hour maximum rainfall for the<br />
period 1971–2009. Mean 24-hour maximum rainfall ranges from over 50 mm in<br />
April–May to 10 mm for July–August. Th e absolute 24-hour maximum rainfall<br />
for the time period studied was recorded within the past decade.<br />
Both rainfall amount and intensity are concerns from the point of view of<br />
fl ooding in Dar es Salaam. Intensity has been increasing in the last 15 years,<br />
where rainfall intensity has been well above the 38 years’ recorded history. Th is<br />
trend is expected to continue with <strong>climate</strong> <strong>change</strong>.<br />
An important projected aspect of <strong>climate</strong> <strong>change</strong> is an increase in climatic<br />
variability, which would result in more frequent and severe fl oods and droughts<br />
in the city. Given that the city’s poor are unable to cope adequately with current<br />
variability, their situation is likely to worsen in the future, unless steps are taken
1800<br />
1600<br />
1400<br />
1200<br />
1000<br />
800<br />
600<br />
400<br />
200<br />
0<br />
Source: Tanzania Meteorological Agency (2010).<br />
ANNEX 4: DAR ES SALAAM CASE STUDY ■ 193<br />
Figure A4.2 Trend of Mean Maximum Temperature Anomalies during<br />
Warm est Months (December–February) at Dar es Salaam<br />
International Airport<br />
Mean annual rainfall (mm)<br />
2.0<br />
1.5<br />
1.0<br />
1.5<br />
0.0<br />
–0.5<br />
–1.0<br />
–1.5<br />
1962<br />
1964<br />
1966<br />
1968<br />
1970<br />
1972<br />
1974<br />
1976<br />
1978<br />
1980<br />
1982<br />
Source: Tanzania Meteorological Agency (2010).<br />
Y-warm = 0.031× –0.512<br />
R 2 = 0.406<br />
DJF ano Linear (DJF ano)<br />
Figure A4.3 Timeseries of Mean Annual Rainfall in Dar es Salaam<br />
1961<br />
1964<br />
1967<br />
1970<br />
1973<br />
1976<br />
1979<br />
1982<br />
1985<br />
1988<br />
1991<br />
1994<br />
1997<br />
2000<br />
2003<br />
2006<br />
2009<br />
Years<br />
Annual Linear trend<br />
1984<br />
1986<br />
1988<br />
1990<br />
1992<br />
1994<br />
1996<br />
1998<br />
2000<br />
2002<br />
2004<br />
2006<br />
2008<br />
to ensure that urban development and poverty reduction specifi cally take into<br />
account the prospect of changing climatic conditions. Infrastructure development<br />
and urban planning, municipal services, and poverty reduction (including safety<br />
nets and health services) need not only to better integrate <strong>disaster</strong> <strong>risk</strong> management,<br />
but also to consider that the trends are changing.
194 ■ CLIMATE CHANGE, DISASTER RISK, AND THE URBAN POOR<br />
TABLE A4.3<br />
Effects and Losses<br />
Hazard Effects Losses<br />
Floods Drainage channels are blocked by<br />
refuse throughout the year as well<br />
as by structures that hinder the fl ow<br />
of wastewater, causing houses to<br />
be fl ooded by unhygienic, sewagebased<br />
wastewater in houses. Major<br />
effects are water-borne diseases.<br />
Drought Diseases: malnutrition, trachoma,<br />
dysentery, cholera, and diarrhea<br />
TABLE A4.4<br />
Signifi cant Floods in Dar es Salaam, 1983–2006<br />
Year Months<br />
Not available<br />
The drought of 2006 damaged<br />
agricultural production, necessitated<br />
electricity cuts (and thus drops in<br />
industrial production), and cut GDP<br />
growth by 1% (ClimateWorks Foundation<br />
et al. 2009)<br />
Long-term mean (mm)<br />
Monthly rainfall<br />
Actual (mm) % of long-term mean<br />
1983 May 197.8 405.6 205<br />
1989 Dec. 117.8 175.6 149<br />
1995 May 197.8 374.2 189<br />
1997 Oct.<br />
69.3<br />
250.8<br />
361<br />
Nov.<br />
125.9<br />
152<br />
121<br />
Dec.<br />
117.8<br />
231<br />
196<br />
1998 Jan.<br />
76.3<br />
107.3<br />
141<br />
Feb.<br />
54.9<br />
123.7<br />
225<br />
Mar.<br />
138.1<br />
155.2<br />
112<br />
Apr.<br />
254.2<br />
319.9<br />
126<br />
2002 Apr. 254.2 569.4 224<br />
2006 Nov.<br />
125.9<br />
240.9<br />
191<br />
Dec.<br />
117.8<br />
230.4<br />
196<br />
Source: Tanzania Meteorological Agency (2010).<br />
Projections of Future Climate<br />
A summary of <strong>climate</strong> baseline data and severity of dry periods for March–<br />
May (MAM) and October–December (OND) are presented in the case study.<br />
Under the Special Report on Emissions Scenarios (SRES) A2 emissions scenarios,<br />
and data representing 14 of the Global Circulation Models used to<br />
simulate the 20th century and future global <strong>climate</strong>, by mid-century, the<br />
coarser-resolution global <strong>climate</strong> models project that this site will become<br />
warmer, with more frequent heat waves. Th ey disagree on whether this site
ANNEX 4: DAR ES SALAAM CASE STUDY ■ 195<br />
Figure A4.4 Mean and Absolute 24 Hours Maximum Rainfall for<br />
Dar es Salaam<br />
Rainfall (mm/day)<br />
160<br />
150<br />
1991<br />
140<br />
130<br />
120<br />
2005<br />
1995<br />
110<br />
100 1996<br />
1995<br />
1999<br />
90<br />
80<br />
70<br />
1996<br />
2003<br />
2005<br />
60<br />
50<br />
1976 1977<br />
40<br />
30<br />
20<br />
10<br />
0<br />
1987<br />
Jan Feb Mar Apr May Jun Jul Aug Sep Oct Nov Dec<br />
Months<br />
Mean 24 hours max Absolute 24 hours max<br />
will become wetter or drier. By 2100, mean annual temperature for Tanzania is<br />
expected to increase by 1.7°C over the northern coast, including areas around<br />
Dar es Salaam. Rainfall intensity is expected to increase. Runoff (precipitation<br />
minus evapo-transpiration), a measure of water availability, is projected<br />
to increase. Th e maximum amount of rain that falls in any fi ve-day period<br />
(a surrogate for an extreme storm) is expected to increase. Th e maximum<br />
period between rainy days is expected to increase.<br />
Kebede and Nicholls (2010) have analyzed Dar es Salaam’s vulnerability<br />
to sea-level rise. Th ey estimate that at present 8 percent of the city currently<br />
lies in a low-elevation zone below the 10 m contour line, inhabited by<br />
over 143,000 people, with associated economic assets estimated (in 2005) at<br />
US$168 million.<br />
Magnitude, Distribution, and Probability of Potential Losses<br />
Although future rainfall patterns are uncertain, variability is likely to increase<br />
and intensifi cation of heavy rainfall is expected. Th us fl ooding may become<br />
increasingly severe, particularly taken together with socioeconomic projections,<br />
unless adaptation measures are implemented. Increases in mean<br />
temperature, combined with fewer rainy days per year, could also prolong<br />
the length of dry seasons or intensify droughts. Recent extreme <strong>climate</strong> (for<br />
example, the droughts of 2006 and 2008–2009, and the fl oods of 2009–2010)<br />
severely impacted sectors such as transport, energy, and health, with adverse<br />
socioeconomic implications. Projected <strong>change</strong>s in <strong>climate</strong> will have signifi cant
196 ■ CLIMATE CHANGE, DISASTER RISK, AND THE URBAN POOR<br />
impacts on Tanzania’s rain-fed agriculture and food production, and could<br />
thus impact urban agriculture in Dar es Salaam, a means of livelihood and<br />
subsistence for the city’s poor. Warming will shorten the growing season and,<br />
together with reduced rainfall, reduce water availability. Coastal degradation<br />
and salt-water intrusion are major problems for Dar es Salaam’s coastal areas<br />
today, and under projected <strong>climate</strong> <strong>change</strong> and possible sea-level rise, coastal<br />
ecosystems would be highly threatened, aff ecting the livelihoods and ecosystems<br />
of coastal communities. Residents of coastal wetlands that have incurred<br />
salt-water intrusion (such as Suna, Mtoni Azimio, and Msasani Bonde la<br />
Mpunga) informed the study team that they frequently need to repair their<br />
houses as salt-water intrusion is corroding the foundations and cement bricks<br />
are being eaten away.<br />
Pillar 3—Socioeconomic Assessment<br />
Location and Exposure of the Urban Poor<br />
An estimated 70 percent of Dar es Salaam’s population lives in poor, unplanned<br />
settlements. Life expectancy in Dar es Salaam’s informal settlements is low,<br />
Figure A4.5 Exposed Population in Dar es Salaam in 2005, 2030, 2050, and<br />
2070 to a 1-in-100-Year Flood under the A1B Mid-range Sea-Level Rise<br />
Scenario, No Adaptation<br />
Population exposed (thousands)<br />
250<br />
200<br />
150<br />
100<br />
50<br />
0<br />
Source: Kebele and Nicholls (2010).<br />
2005 2030<br />
Time (years)<br />
2050 2070<br />
Ilala Temeke Kinondoni Total (dares Salaam)
ANNEX 4: DAR ES SALAAM CASE STUDY ■ 197<br />
between 44 and 46 years, and infant mortality is high at about 97 deaths per 1,000<br />
live births.<br />
Residents are usually too poor to pay for services or infrastructure and<br />
authorities too resource-constrained to maintain these; thus, health and environmental<br />
conditions are generally extremely poor. Tanzania’s policy toward<br />
informal settlements in Dar es Salaam has varied over past decades. In the<br />
1960s, slum clearance was the main approach; slum sites were cleared and<br />
buildings with high construction standards were erected on cleared sites<br />
(implemented through the National Housing Corporation). Th is proved<br />
unsustainable, however, and was abandoned by the end of the 1960s due to<br />
high economic and social costs, and having contributed little to the net housing<br />
stock. In the 1970s and 1980s, the government’s approach <strong>change</strong>d, and<br />
projects to upgrade squatter areas and to provide services (supported by the<br />
<strong>World</strong> Bank) formed the national strategy for managing the growth of informal<br />
settlements. Aft er <strong>World</strong> Bank funding for these projects ceased, however,<br />
the government of Tanzania was unable to continue fi nancing them, and<br />
subsequent years saw the growth and emergence of new unplanned settlements<br />
as well as deterioration of previously installed infrastructure, due to<br />
lack of maintenance.<br />
Reference<br />
<strong>World</strong> Bank. 2011. Urban Poverty & Climate Change in Dar es Salaam, Tanzania; A Case<br />
Study, processed.
Overview and Key Findings<br />
Annex 5: Jakarta Case Study<br />
Th is case study presents the fi rst comprehensive overview of the intersection<br />
between <strong>climate</strong> <strong>change</strong>, <strong>disaster</strong> <strong>risk</strong>, and the urban poor in Jakarta. It<br />
discusses city progress in taking stock of policies and programs, both within<br />
■ 199
200 ■ CLIMATE CHANGE, DISASTER RISK, AND THE URBAN POOR<br />
the Provincial Government (Pemprov) of the Special Capital District (DKI)<br />
of Jakarta and with partners. And it discusses progress in understanding the<br />
principal hazards in the city and where they are located, as well as some understanding<br />
of undocumented citizens in Jakarta and how they are coping with<br />
the <strong>change</strong>s they experience on a day-to-day basis. As part of this eff ort, there<br />
is a longer document assessing <strong>risk</strong> and a short fi lm that provide the basis for<br />
moving toward a comprehensive <strong>climate</strong> action plan for the city. Th e Bahasa<br />
version of the report will be a useful awareness-raising tool to build capacity<br />
among government agencies and other stakeholders on how <strong>climate</strong> <strong>change</strong><br />
and natural <strong>disaster</strong>s are and will aff ect Jakarta.<br />
Th e <strong>World</strong> Bank, in close consultation with the Pemprov DKI and other stakeholders<br />
and partners, has prepared a case study of Jakarta. Key DKI government<br />
agencies, such as the departments responsible for the environment (Badan Pengelola<br />
Linkungan Hidup Daerah, BPLHD), planning (Badan Perencanaan Pembangunan<br />
Daerah, BAPPEDA), and spatial planning (Biro Tata Ruang) discussed<br />
existing city strategies and policies related to <strong>climate</strong> <strong>change</strong>. Pemprov DKI also<br />
hosted a stakeholder consultation workshop in December 2010, to review and<br />
strengthen the fi ndings of this case study through conversations with diff erent<br />
city offi cials and NGOs.<br />
Th e approach used in this case study is based on the Urban Risk Assessment<br />
(URA) framework. Accordingly, it includes an assessment of the hazards, socioeconomic<br />
vulnerabilities, and institutional aspects related to <strong>climate</strong> <strong>change</strong> and<br />
<strong>disaster</strong>s in Jakarta. With a focus on the urban poor, this study considers how<br />
poor communities are aff ected by <strong>climate</strong> <strong>change</strong> and natural hazards, examines<br />
approaches that have been taken to address these challenges, and identifi es priorities<br />
and options for further action in Jakarta. Th is study draws on other reports<br />
and resources on <strong>disaster</strong>s and <strong>climate</strong> <strong>change</strong> in Jakarta, as well as on interviews<br />
and discussions with government offi cials, local NGOs, and community leaders.<br />
Key Findings of the Study<br />
• Strong and sustained growth in Jakarta’s population and economy have resulted<br />
in a vast increase in the urbanized area, and concomitant <strong>change</strong> in land use.<br />
• Jakarta’s rapid growth and urbanization have given rise to large-scale infrastructure<br />
problems that are mostly well documented and understood by the<br />
DKI government and the public.<br />
• Jakarta is now highly vulnerable to the impacts of <strong>climate</strong> <strong>change</strong>. Th e greatest<br />
<strong>climate</strong>- and <strong>disaster</strong>-related <strong>risk</strong> facing Jakarta is fl ooding, which imposes<br />
very high human and economic costs on the city.<br />
• Jakarta’s poor are productive and integral members of the city’s economy, and<br />
are also the most vulnerable to fl ood-related <strong>risk</strong>s.
ANNEX 5: JAKARTA CASE STUDY ■ 201<br />
• Th e urban poor have important roles to play in addressing Jakarta’s vulnerability<br />
to <strong>climate</strong> <strong>change</strong> and <strong>disaster</strong>s.<br />
• Th e government of DKI Jakarta has started acting on <strong>climate</strong> <strong>change</strong>, but<br />
much remains to be done to mainstream <strong>climate</strong> <strong>change</strong> across all sectors for<br />
the long term.<br />
The Government of Jakarta at Work<br />
DKI is making a concerted eff ort to develop its <strong>climate</strong> <strong>change</strong> strategy and to<br />
think more broadly and inclusively about diff erent levels of capacity building and<br />
interventions. At the kelurahan level, government offi cials are starting to take<br />
active roles in understanding how <strong>climate</strong> <strong>change</strong> is aff ecting them and what<br />
steps they can prioritize in their own actions and local budgets. Th is is occurring<br />
mainly through capacity-building programs of NGOs. Th e government is also<br />
learning how to articulate these issues in terms of spatial interventions. Initially,<br />
the main focus of DKI on <strong>climate</strong> <strong>change</strong> was about reducing greenhouse gas<br />
emissions. Th e government is now thinking more broadly about adaptation measures<br />
like urban greening that address both <strong>climate</strong> <strong>change</strong> aspects.<br />
Areas for Improvement<br />
Currently the approach of integrating projects and programs that increase resilience,<br />
improve spatial planning, and decrease poverty in one systematized application<br />
is new for the DKI government. Both conceptually and in terms of policy<br />
creation and social services, the real links between <strong>climate</strong> <strong>change</strong> vulnerability<br />
and resilience and the urban poor remain weak. Th e location and required resettlement<br />
of the extremely poor communities is a delicate and complicated issue for<br />
DKI to manage, but one that is seeing increasing urgency and pressure. Ideas for<br />
the development of good <strong>climate</strong> <strong>change</strong> projects, ideally those that incorporate<br />
mitigation and adaptation, are slow to emerge from inside the DKI government.<br />
Key Constraints<br />
Key constraints in dealing eff ectively with <strong>climate</strong> <strong>change</strong>, <strong>disaster</strong> <strong>risk</strong>, and the<br />
urban poor include:<br />
DATA—Poor availability and sharing of data for decision-making, from existing<br />
studies and new data, is one of the biggest challenges. From the experience<br />
of working through the MTF study with DKI Jakarta, data was either extremely<br />
scarce, inconsistent, or simply very diffi cult to access as some agencies were reluctant<br />
to release information. Partners of DKI, like other multi- and bilateral organizations,<br />
as well as NGOs and private-sector consultants, create their own data<br />
sets, but much of this information is not shared or coordinated.<br />
INFRASTRUCTURE AND INVESTMENTS—Th e macro-infrastructure<br />
upgrades that will be required for Jakarta to be considered <strong>climate</strong> resilient are
202 ■ CLIMATE CHANGE, DISASTER RISK, AND THE URBAN POOR<br />
certainly massive and long term. Th ese upgrades include a huge dike and poldersystem<br />
called the Jakarta Coastal Sea Defense coupled with land reclamation and<br />
improved pumping capacity. Th is is still in the design stages. Th e Jatiluruh reservoir<br />
just outside of Jakarta’s boundaries is the source of much of Jakarta’s water.<br />
Plans have been under development for some time to expand the capacity of the<br />
pipes to increase water supply to Jakarta, and therefore ease the causes of subsidence,<br />
but the plans are not yet under way.<br />
COMMUNICATION AND COMMUNITY ENGAGEMENT—Th e shorterterm<br />
micro-level capacity-building exercises and community-led actions are<br />
uneven, with some communities better organized than others. Framing the<br />
future of Jakarta using the terms “resilience” and “<strong>climate</strong> <strong>change</strong>” are new<br />
for the government and communities. Th ere is a signifi cant learning curve in<br />
terms of thoroughly understanding, then communicating, how <strong>climate</strong> <strong>change</strong><br />
aff ects Jakarta.
ANNEX 5: JAKARTA CASE STUDY ■ 203<br />
Main Information Gaps Identifi ed<br />
In general there is a lack of data. Some of the data available (such as land tenure)<br />
may not have been scrutinized and analyzed through the fresh lens of <strong>climate</strong><br />
<strong>change</strong>. Updated data gaps include: maps of poverty in the city; subsidence<br />
maps and images; socioeconomic and housing data on the very poor; good<br />
qualitative defi nitions of slums and urban settlements; information on land tenure;<br />
up-to-date census data; census data on the very poor; immigration and<br />
emigration rates; plans for resettlement of vulnerable areas; fi nancing and longterm<br />
plans for sea-wall construction; and concrete action plans for working to<br />
halt subsidence.<br />
Looking Forward<br />
A few basic principles can guide the way forward for addressing <strong>climate</strong> <strong>change</strong>,<br />
<strong>disaster</strong> <strong>risk</strong>, and urban poverty in Jakarta.<br />
• Climate <strong>change</strong> adaptation should be not so much an additional challenge<br />
to be layered onto existing policies and planning priorities, but rather an
204 ■ CLIMATE CHANGE, DISASTER RISK, AND THE URBAN POOR<br />
opportunity for the DKI government and key partners to gather their focus<br />
and priorities for the future.<br />
• Given limited resources, the initial focus should be on addressing existing<br />
shortfalls in infrastructure investment and basic services, particularly in<br />
drainage, piped water, housing, and transportation.<br />
• Policies and investments should be based on improved information, including<br />
quantitative data and an understanding of community actions and adaptive<br />
capacities.<br />
• Enhanced collaboration—with the administrations of neighboring provinces,<br />
as well as with the local communities as active participants and partners—is<br />
crucial to the success of long-term action.<br />
• Capacity building should be emphasized at every level. Th e shorter-term<br />
micro-level capacity building and community-led actions are uneven,<br />
some communities being better organized than others. Framing the future<br />
of Jakarta using the terms “resilience” and “<strong>climate</strong> <strong>change</strong>” are new for<br />
the government and communities. Th ere is a signifi cant learning curve in<br />
terms of fi rst thoroughly understanding, and then communicating, how<br />
<strong>climate</strong> <strong>change</strong> aff ects Jakarta.<br />
Case Study Summary<br />
City Profi le<br />
Jakarta is located on the north coast of the island of Java in the Indonesian<br />
archipelago in Southeast Asia. It is the country’s largest city and its political<br />
and economic hub. Th e city’s built environment is characterized by numerous<br />
skyscrapers, concentrated in the central business district but also built<br />
ad hoc throughout the city, especially in the past 20 years. Th e rest of Jakarta<br />
generally comprises low-lying, densely populated neighborhoods, which are<br />
highly diverse in terms of income levels and uses, and many of these neighborhoods<br />
are home to varied informal economic activities. Th e population<br />
of Jakarta is considered wealthy relative to neighboring provinces and other<br />
islands, and indeed its GDP per capita is more than four times the national<br />
average.<br />
Jakarta is located in a deltaic plain crisscrossed by 13 natural rivers and more<br />
than 1,400 km of man-made waterways. About 40 percent of the city, mainly the<br />
area farthest north near the Java Sea, is below sea level. Jakarta is prone to fl ooding<br />
from water draining through the city from the hills in the south, and also<br />
from coastal tidal fl ooding.
TABLE A5.1<br />
Jakarta Profi le<br />
ANNEX 5: JAKARTA CASE STUDY ■ 205<br />
Total city population in 2010 9.6 million<br />
Population growth (% annual) 2.60<br />
Land area (km2 ) 651<br />
Population density (per km2 ) 14,465<br />
Country’s per capita GDP (US$) 2,329<br />
% of country’s population 4<br />
Total number of households 2,325,973<br />
GDP (US$) 10,222<br />
% of country’s GDP 20<br />
Total budget (US$) 3.1 billion<br />
Date of last Urban Master Plan 2010<br />
Th e successful provision and management of services by the provincial<br />
government is lagging in most sectors. In spite of a booming economy, much<br />
private-sector property development, Jakarta’s spatial planning and infrastructure,<br />
as well as service provision—transportation, green space, aff ordable<br />
housing, clean water, health care, and education—have not kept pace<br />
with demand.<br />
Traffi c congestion is a major problem facing the city, with only incremental<br />
eff orts to relieve congestion through the development of public transportation,<br />
most prominently, the TransJakarta Busway. Th e increasing number of vehicles<br />
on the streets of Jakarta is outpacing the development of new roads. Total gridlock<br />
in the city is projected to occur as early as 2016 under the transportation<br />
Business As Usual scenario.<br />
Lack of piped water is driving large multi-use developments and small residential<br />
communities alike to drill wells to access groundwater. Th is extraction of<br />
groundwater is causing areas of Jakarta to sink rapidly, particularly in the north<br />
of the city. Along with sea-level rise, land subsidence is one of the greatest challenges<br />
facing Jakarta.<br />
Th e provision of housing for the poor and lower-middle classes continues<br />
to be inadequate relative to demand. With consistent in-migration of people<br />
into the city, estimated at 250,000 annually, housing is in constant demand, but<br />
costs are escalating. Skyrocketing land prices and rampant private-sector development<br />
that is under-regulated has resulted in a booming real-estate market<br />
that excludes the poor. Large informal settlements have grown over many years<br />
along waterways, natural rivers, and reservoirs, contributing to the pollution<br />
and clogging of these areas.
206 ■ CLIMATE CHANGE, DISASTER RISK, AND THE URBAN POOR<br />
Th ere is currently no citywide solid-waste management plan for Jakarta.<br />
Waste collection in the city is largely contracted out to private companies, with<br />
wealthier areas paying more, and consequently receiving better and more consistent<br />
service. In many areas, waste is collected and picked over by a highly effi cient<br />
but informal waste picker and recycling community.<br />
Pillar 1—Institutional Assessment<br />
Agencies in Disaster Risk Management and Climate Change Adaptation<br />
Th e key agencies in Jakarta responsible for coordinated eff orts on <strong>climate</strong><br />
<strong>change</strong> adaptation and <strong>disaster</strong> <strong>risk</strong> management are Kantor Asisten Pembangunan<br />
dan Lingkungan Hidup (Asbang), Assistant to Secretary for Development<br />
and Environment Offi ce; Badan Pengelola Linkungan Hidup Daerah<br />
(BPLHD), the environmental agency; Badan Perencanaan Pembangunan<br />
Daerah (BAPPEDA), the planning and development agency; Badan Penanggulangan<br />
Bencana Daerah (BPBD), the provincial <strong>disaster</strong> management<br />
agency; Satuan Tugas Koordinasi dan Pelaksana (SATKORLAK), the national<br />
<strong>disaster</strong> <strong>risk</strong> management board; and Biro Tata Ruang, the bureau of spatial<br />
planning.<br />
• Assistant to Secretary for Development and Environment Offi ce as a point<br />
of coordination for development and environment. Under this offi ce, there<br />
are two bureaus that are Spatial Plan (Tata Ruang) and Infrastructure (Sarana<br />
dan Prasarana). Biro Tata Ruang is responsible for coordinating the<br />
development and management of short-, medium-, and long-term spatial<br />
plans for the city. Within the plans are specifi c laws and articles articulating<br />
the incorporation of <strong>climate</strong> <strong>change</strong> adaptation and mitigation, as well as the<br />
need for <strong>disaster</strong> <strong>risk</strong> management. Biro Prasarana dan Sarana is responsible<br />
for monitoring the city development. However, the implementation and enforcement<br />
of these laws and articles is through BAPPEDA and the Department<br />
of Public Works.<br />
• BPLHD is the environmental agency and the key governmental contact<br />
for many of the NGOs and other organizations working at the community<br />
level. Th ey are involved in programs to abate greenhouse gas emissions in<br />
Jakarta, including overseeing the development of a greenhouse gas emissions<br />
baseline, to be completed in 2011. BLPHD also manages community-level<br />
adaptation initiatives and studies in partnership with NGOs and<br />
donor organizations.<br />
• BAPPEDA is the development and management body for Jakarta. It manages<br />
large infrastructure projects such as sea-wall construction in north Jakarta,<br />
as well as the building of fl oodgates along the rivers and major infrastructure<br />
projects like the East and West Flood Canals. Th e agency manages, fi nances,
ANNEX 5: JAKARTA CASE STUDY ■ 207<br />
and monitors the fl ood infrastructure carried out by Dinas Pekerjaan Umum<br />
(DPU), the public-works agency.<br />
• BPBD was established as the citywide agency for <strong>disaster</strong> <strong>risk</strong> management<br />
only at the end of 2010. Until then, <strong>disaster</strong> response was handled<br />
by SATKORLAK, which is a national association based largely in the fi re<br />
department and acted as more of a committee since it was not anchored in<br />
a particular agency or formalized into government structure. Th e formal<br />
empowerment and role of BPBD has yet to be fully developed, integrated,<br />
and made widely public.<br />
Relevant Policies and Legislation<br />
Climate <strong>change</strong> is integrated to a limited extent in the medium- and long-term city<br />
spatial plans, but they relate for the most part to areas of the city experiencing the<br />
greatest harm from fl ooding or other problems. Th e offi cial language in the plans<br />
acknowledges the need for strategies related to <strong>climate</strong> <strong>change</strong> as well as plans for<br />
<strong>disaster</strong> mitigation and response, but does not go into specifi c detail.<br />
Adaptation plans to cope with extreme weather and sea-level rise are piecemeal<br />
within the plans and agencies. More generally, the governor of Jakarta has<br />
made public commitments in the international arena to reducing the city’s greenhouse<br />
gas emissions.<br />
Th e plans and policies of BPBD are not yet known, although a citywide<br />
strategy for <strong>disaster</strong> prevention and response will most likely be developed and<br />
managed by this agency. Th e National Action Plan for Disaster Risk Reduction<br />
(NAP-DRR) lists actions for Jakarta specifi cally, but the actions have been<br />
developed by diff erent sectors and ministries. Th e budget numbers included<br />
are the requests by the implementing party and have not been allocated or<br />
approved.<br />
Ongoing Programs in Disaster Risk Management and Climate Change<br />
An important step taken by the DKI government was to establish the provincial<br />
<strong>disaster</strong> <strong>risk</strong> management agency, BPBD. Currently, there is no comprehensive<br />
program of <strong>disaster</strong> <strong>risk</strong> management or response plan for the city of Jakarta.<br />
Th ere are large-scale infrastructure projects, such as the Jakarta Coastal Defense<br />
that protects coastal neighborhoods from tidal surges, and the East and West<br />
Flood Canals. Th e Jakarta Coastal Defense has been presented to the Jakarta<br />
government as a feasibility study. Th e East and West Flood Canals are the largest<br />
and most ambitious projects for Jakarta in terms of fl ood management, but<br />
the intricate and smaller secondary and tertiary systems are still under-managed<br />
and inadequate.<br />
Many of the alert systems work at the community level and are largely selforganized.<br />
Th ese are generally warnings from upstream fl oodgates that water is
208 ■ CLIMATE CHANGE, DISASTER RISK, AND THE URBAN POOR<br />
getting high; the warnings are sent via SMS text message to neighborhood heads<br />
so they can warn their communities. It is unknown how many of these small and<br />
informal networks are actually in place. It appears that they evolved out of local<br />
necessity. Many of the resources for the smaller, community-level projects and<br />
programs come from local and international NGOs. Small government agencies<br />
at the neighborhood level (RT and RW) are allocated budgets for some infrastructural<br />
interventions, but they are not consistent across the city and in many<br />
cases kelurahan-level budgets are not entirely spent every fi scal year due in part<br />
to complicated and lengthy approval mechanisms by the provincial government,<br />
or a lack of capacity at the local level to carry out physical interventions. Th is is a<br />
national trend and not specifi c to Jakarta.<br />
Policy Shortcomings<br />
Formalization, publication, and awareness-raising are still sorely lacking in<br />
the areas of <strong>climate</strong> <strong>change</strong> and <strong>disaster</strong> <strong>risk</strong> management in Jakarta, both<br />
inside many government agencies and in the public realm. In many ways the<br />
Jakarta government is only beginning to comprehensively measure and understand<br />
the city’s key vulnerabilities—as well as its strengths and resources—to<br />
become <strong>climate</strong>-resilient and to anticipate potential <strong>disaster</strong>s. Th ere is also<br />
a lack of coordination between the agencies described above, and very little<br />
enforcement of well-meaning laws to create a safer and more secure built environment.<br />
BNPB (Badan Nasional Penanggulangan Bencana) was developed as<br />
the national coordinating and monitoring agency in 2008, with an operating<br />
budget for <strong>disaster</strong> response of about IDR 4 trillion (US$464 million). However,<br />
more is currently needed for upgrades and implementation as reported<br />
in the National Action Plan for Disaster Risk Reduction (NAP-DRR). (See<br />
complete case study for list of items submitted for fi nancing by various agencies<br />
for Jakarta.)<br />
Lead Agency for Disaster Risk Management<br />
Until recently, a national ad hoc agency (SATKORLAK) anchored in the fi re<br />
department and was responsible for <strong>disaster</strong> response, but was doing little<br />
anticipatory planning. Jakarta did not have a dedicated working group or<br />
agency. At the end of 2010, BPBD was established for the province of Jakarta.<br />
As it is a new agency, the role it will play in developing <strong>disaster</strong> mitigation<br />
plans or allocating funding for the city’s kota or kelurahan remains unclear.<br />
Mainstreaming Risk Reduction<br />
In order to mainstream <strong>risk</strong> reduction, the government is incorporating those<br />
activities and projects into the long-term spatial plans, the most recent of
ANNEX 5: JAKARTA CASE STUDY ■ 209<br />
which is Jakarta’s plan for 2010–2030. NGOs and other donor organizations<br />
are playing important roles currently to aid communities and communitylevel<br />
governments to educate and prepare individual citizens, families, and<br />
community leaders to prepare for damaging events such as fl oods from<br />
extreme rainfall or from rises in tides. However, these actions are piecemeal<br />
across the city and it is mostly poor communities that are targeted by these<br />
organizations.<br />
Expenditure on Pro-Poor Programs and Climate Adaptation<br />
Th e 2011 city budget for Jakarta is slightly more than US$3 billion. Indonesia<br />
has a countrywide program to alleviate poverty (Program Nasional<br />
Pemberdayaan Masyarakat (PNPM)—Mandiri or the National Program for<br />
Community Empowerment 1 ) that has had success in other urban areas, but<br />
has not adequately reached extremely poor parts of Jakarta. Many of the<br />
activities to reduce poverty are disbursed throughout various services and<br />
departments, such as community empowerment, health, family planning,<br />
and social services.<br />
Table A5.2 shows the most relevant spending on <strong>climate</strong> <strong>change</strong> adaptation—<br />
larger-scale initiatives related to infrastructure.<br />
Pillar 2—Hazards Assessment<br />
Past Natural Disasters<br />
Th e largest fl oods in Jakarta’s history took place in 2002 and 2007. Jakarta’s fl oods<br />
are notorious, and the resulting stalling of traffi c, lost productivity, and property<br />
TABLE A5.2<br />
Infrastructure Investments per Year DKI<br />
Annual budget, 2009 Annual budget, 2010<br />
Flood control<br />
East fl ood canal $93,132,994 $60,350,180<br />
Drainage and river dredging $10,803,427 $11,424,314<br />
Dam, polder, and catchment<br />
area development<br />
Pollution containment<br />
$620,887 $40,605,985<br />
<strong>Open</strong> green space development<br />
Climate <strong>change</strong> adaptation<br />
$15,909,599 $77,238,296<br />
Sea wall $2,235,192 $5,587,980
210 ■ CLIMATE CHANGE, DISASTER RISK, AND THE URBAN POOR<br />
TABLE A5.3<br />
Institutional Mapping of Disaster Risk Management Functions<br />
Risk assessment<br />
DNPI<br />
Climate <strong>change</strong><br />
technical studies<br />
and coordination of<br />
mitigation activities<br />
BPBD<br />
Disaster <strong>risk</strong><br />
management and<br />
reduction plans,<br />
management, and<br />
training<br />
BAPPENAS<br />
Inter-agency<br />
coordination for<br />
infrastructure plans<br />
P2B<br />
Risk mapping for<br />
earthquakes<br />
Technical<br />
(planning,<br />
management,<br />
maintenance)<br />
BNPD<br />
National <strong>disaster</strong><br />
<strong>risk</strong> reduction plans<br />
and policies and<br />
NAP-DRR (2010)<br />
BPBD<br />
Local <strong>disaster</strong><br />
management<br />
and response<br />
plan for Jakarta<br />
(to come)<br />
BAPPEDA<br />
Infrastructure<br />
and planning<br />
projects;<br />
maintenance<br />
with PU and<br />
other agencies<br />
Risk reduction<br />
early warning<br />
and response Public awareness<br />
RT and RW<br />
Localized earlywarning<br />
systems<br />
for fl oods via SMS<br />
DKI Department of<br />
Public Works (PU)<br />
Coordination of<br />
early-warning<br />
system with other<br />
provinces (water<br />
management)<br />
SATKORLAK<br />
Emergency response<br />
BPLHD<br />
Climate <strong>change</strong><br />
events and<br />
programs like<br />
car-free days<br />
DNPI<br />
Conferences and<br />
publications<br />
BIRO TATA RUANG<br />
Publication of<br />
20-year spatial plan<br />
available to public<br />
damage costs the city more than US$400 million per year. By 2002, more than a<br />
quarter of Jakarta’s area was aff ected. Th e most disastrous fl ood to date, in February<br />
2007, cost 57 lives, displaced more than 422,300 people, and destroyed<br />
1,500 homes, damaging countless others. Total losses to property and infrastructure<br />
were estimated at US$695 million. 2 However, fl ooding of that magnitude is<br />
relatively infrequent and is not necessarily the principal issue for Jakarta; fl ooding<br />
occurs regularly throughout the year, stalling traffi c, damaging houses, and<br />
gravely attenuating the fl ow of business at all levels of society. Even with just a<br />
moderate amount of rain, vehicular mobility in the city is critically impaired,<br />
oft en for hours.<br />
Th e NAP-DRR cites parts of Jakarta as vulnerable to three hazards. However,<br />
for DKI Jakarta, the analysis does not go beyond the level of the kota, so it is hard<br />
to know how the <strong>risk</strong> aff ects diff erent areas of the municipalities and their diverse<br />
populations.
Table A5.4<br />
Natural Hazards<br />
ANNEX 5: JAKARTA CASE STUDY ■ 211<br />
Yes/No Date of last major event<br />
Earthquake Y September 2009 and periodic<br />
Wind storm N<br />
River fl ow Y Regularly, extreme during rainy season<br />
Floods, inundations, and waterlogs Y October 2010<br />
Tsunami N<br />
Drought N<br />
Volcano N<br />
Landslide N<br />
Storm surge Y January 2008 and recurring<br />
Extreme temperature Y Increasing on a yearly basis<br />
TABLE A5.5<br />
Jakarta’s Kota in National Ranking of Kabupaten or Regencies at High<br />
Risk for Various Disasters<br />
Earthquake<br />
(out of 151 listed)<br />
Drought<br />
(out of 182 listed)<br />
Flood<br />
(out of 174 listed)<br />
80 West Jakarta 8 North Jakarta 2 North Jakarta<br />
95 North Jakarta 9 East Jakarta 3 West Jakarta<br />
122 East Jakarta 10 Central Jakarta<br />
137 South Jakarta 11 West Jakarta<br />
37 South Jakarta<br />
Main Climate Hazards<br />
Th e main hazards for Jakarta relate to water management and fl ood control.<br />
Extreme weather causes overloading of the existing drainage system, while sealevel<br />
rise coupled with land subsidence is making Jakarta increasingly vulnerable<br />
to tidal fl oods due to its coastal location (fi gure A5.4). Jakarta has also experienced<br />
earthquakes (although minor, but as recently as 2009) and should be prepared<br />
for other unprecedented geological events and tsunamis.<br />
Areas at High Risk of Disasters and Climate Impacts<br />
Given the sea-level rise and subsidence that have been modeled for North Jakarta,<br />
some industrial and residential areas and ports will be submerged in the next 100<br />
years. Most of Jakarta’s remaining industries are located in the north, as are its<br />
historic and active ports, which are key for Java’s fi shing economy. Th e airport
212 ■ CLIMATE CHANGE, DISASTER RISK, AND THE URBAN POOR<br />
TABLE A5.6<br />
Main Climate Hazards<br />
Hazard Effects Losses<br />
Earthquake Until now small, with very little<br />
physical damage.<br />
River fl ow Disruption of business, damage to<br />
property, power outages,<br />
groundwater pollution, and<br />
distribution of solid waste through<br />
high and fast water fl ow.<br />
Floods,<br />
inundations<br />
Depending on severity can affect<br />
traffi c circulation, business activity,<br />
damage to property, power outages,<br />
displacement, and spread of disease.<br />
Storm surge Locally known as rob, extreme tidal<br />
fl oods from the sea have become<br />
more serious in the past few years<br />
in the coastal areas of the city.<br />
Sea water intrusion into aquifers.<br />
Extreme<br />
temperature<br />
As a result of both urbanization and<br />
loss of green space, increases in<br />
ground temperature and resulting<br />
instances of dengue.<br />
Until now, no great material or life<br />
loss from earthquakes.<br />
Property damage, business damage,<br />
tainting of ground water, loss<br />
of life, and spread of disease and<br />
refuse.<br />
Loss of property and businesses,<br />
spread of illness and loss of life,<br />
and loss of access to clean water.<br />
Seawater intrusion into drinking<br />
water, damage to property including<br />
boats, and halt of industry and<br />
mobility.<br />
Loss of life due to dengue, usually<br />
within very poor communities.<br />
and other major roads, as well as Kota Tua, the 17th century remnants of the fi rst<br />
Dutch settlement, will also be aff ected (fi gure A5.5).<br />
Other Sources of Information on Potential Impacts of Disasters<br />
• Jakarta Coastal Defense Strategy (JCDS): Recommendation and study by an international<br />
consortium to build a 60 km sea defense along the coast to prevent<br />
damage from both land subsidence and sea-level rise. Th e consortium is funded<br />
by the city of Rotterdam and is still only at the stage of a feasibility study. 3<br />
• Jakarta Urgent Flood Mitigation Project (JUFMP): A study and dredging plan<br />
by the <strong>World</strong> Bank and DKI Jakarta, which included the “Jakarta Flood Hazard<br />
Mapping Framework,” which does not include cost analysis but provides<br />
the infrastructure framework required. Th e complete fi nancial study is available<br />
at DKI and the <strong>World</strong> Bank. 4<br />
• Th e Jakarta Building Control and Monitoring Offi ce (Penataan dan Pengawasan<br />
Bangunan: P2B): Th e offi ce is developing a <strong>risk</strong> map for Jakarta within<br />
micro-zones of 150 m 2 each, which analyzes buildings and soil conditions<br />
within each. Th is initiative relates specifi cally to earthquakes and building<br />
quality. Th e map is not yet complete. 5
Pillar 3—Socioeconomic Assessment<br />
ANNEX 5: JAKARTA CASE STUDY ■ 213<br />
All of Jakarta is considered at high <strong>risk</strong> to <strong>disaster</strong>, since very few areas of the<br />
city are immune to recurrent fl oods. However, the most vulnerable areas of the<br />
city are along the coast, since they are susceptible to the eff ects not only of tidal<br />
fl ooding from the sea, but also of fl oods from the rivers and canals that are discharged<br />
into the Jakarta Bay (see fi gure A5.3 in the color section). Th ese communities<br />
in the northern areas are also experiencing the greatest land subsidence.<br />
Th e poorest people in Jakarta are generally those squatting on empty land along<br />
riverbanks and canals. It is estimated that they comprise about 3.5 percent of the<br />
urban population.<br />
Location of the Urban Poor<br />
Th e level of exposure of very poor communities in Jakarta to both <strong>climate</strong> and<br />
natural hazards is extremely high. Th is is due in part to many of the poorest<br />
communities have settled illegally in areas close to sources of water: along major<br />
drainage and water management areas and along the coast. Th is renders them<br />
vulnerable to fl ooding from increased rain, as well as extreme hydrological events<br />
and tidal anomalies and fl oods from the sea.<br />
Characteristics of Informal Settlements<br />
Th e poorest communities in Jakarta live in self-constructed settlements,<br />
usually on land without formal legal title, and working in informal jobs. In<br />
some instances, illegal and undocumented land leasing and landlord-tenant<br />
contracting is practiced. Jakarta has a long history of these informal settlements.<br />
In many of these areas, some individuals and families have lived in<br />
what could be considered as “slums” for decades, so well-established social<br />
networks and cultural identities of place in Jakarta run extremely deep. While<br />
the numbers for Jakarta may be slightly lower, and remain hard to accurately<br />
measure, up to 68 percent of Indonesians across the country make their living<br />
through informal means (ILO 2010). In most areas of Jakarta, the residents<br />
of informal settlements work as maids, janitors, security guards, and parking<br />
attendants, and also run small local businesses such as food stalls and small<br />
retail kiosks. In coastal settlements, the fi shermen are key to providing larger<br />
companies with supplies of fi sh to sell across the city.<br />
Examples of Good Practice<br />
Jakarta has yet to develop a comprehensive plan to address extreme poverty in<br />
the city, especially in terms of involuntary relocation, housing provision, and<br />
economic development of very poor communities. Indonesia has policies to alleviate<br />
poverty like conditional cash transfers and other mechanisms, but many
214 ■ CLIMATE CHANGE, DISASTER RISK, AND THE URBAN POOR<br />
TABLE A5.7<br />
Social Assessment<br />
City population below poverty line (%) 3.60<br />
Social inequality (Gini index) in 2002 (UN Habitat) 0.32<br />
Unemployment (% of total labor force) 11.05<br />
Areal size of informal settlements as a<br />
percent of city area<br />
Unknown<br />
City population living in slums (%) 5<br />
Human Development Index (2009) 77.36<br />
Predominant housing material For the very poor, assorted salvaged<br />
materials; for self-builders, concrete<br />
blocks and brick.<br />
of these policies do not reach the poorest, particularly those in informal settlements.<br />
Many of the very poor subsist on jobs and small businesses that are part<br />
of Jakarta’s vast informal economy. Integrating <strong>climate</strong> <strong>change</strong> adaptation and<br />
education into plans for social services and community awareness is new for the<br />
Jakarta government. It has only been in 2011 that DKI Jakarta has been engaging<br />
with local NGOs and other organizations and funders to develop and understand<br />
community resilience specifi cally toward <strong>risk</strong> management related to <strong>climate</strong><br />
<strong>change</strong>. PNPM (Program Nasional Pemberdayaan Masyarakat) is a 10-year<br />
government program to reduce poverty funded in part by the <strong>World</strong> Bank,<br />
a program that will incorporate <strong>disaster</strong> <strong>risk</strong> reduction activities into their established<br />
community empowerment and capacity building; the addition US$15 million,<br />
funded over 5 years, is through a grant from the Global Facility for Disaster<br />
Reduction and Recovery, starting in 2011. However, only one or two of Jakarta’s<br />
kelurahan may be eligible for this program.<br />
Constraints and Opportunities<br />
Very little quantifi ed, centralized information is available about the most vulnerable<br />
communities in Jakarta, the urban poor and informal settlements. However,<br />
the highly visible <strong>climate</strong>-vulnerable locations of these communities allow for<br />
easy identifi cation of specifi c locations for interventions in spatial planning and<br />
social programming (like in North Jakarta and along many of the rivers). Th e creation<br />
and organization of data about the urban poor in Jakarta, and specifi cally<br />
about their livelihoods and economic contribution to Jakarta, is key. Another<br />
asset in terms of community information dissemination and preparedness is the<br />
already-fairly decentralized local government structures of the RW and RT, with<br />
budget and administrative allocation down to a minute level in the city. With this
ANNEX 5: JAKARTA CASE STUDY ■ 215<br />
strong system already in place, it is relatively simple to scale up or replicate good<br />
community-level programs across the city.<br />
GHG Emissions Inventory<br />
A GHG emissions inventory for Jakarta is currently under development in partnership<br />
with BPLHD, DNPI, and the NGO group Swisscontact.<br />
Notes<br />
1. For more information, see www.pnpm-mandiri.org.<br />
2. Why Are Th ere Floods In Jakarta? Flood Control by the Government of the Province of<br />
Jakarta, PT Mirah Sakethi, 2010.<br />
3. http://www.beritajakarta.com/2008/en/newsview.aspx?idwil=0&id=17983.<br />
4. http://web.worldbank.org/external/projects/main?pagePK=64283627&piPK=73230&<br />
theSitePK=40941&menuPK=228424&Projectid=P111034.<br />
5. http://www.thejakartaglobe.com/opinion/editorial-mapping-out-path-to-a-quakeready-jakarta/432586.<br />
Reference<br />
<strong>World</strong> Bank. 2011. Jakarta: Urban Challenges in a Changing Climate. Jakarta: <strong>World</strong> Bank.
Annex 6: Mexico City Case Study<br />
Overview and Key Findings<br />
Th e Mexico City case study under the Mayor’s Task Force brings together new and<br />
existing knowledge for dealing with <strong>climate</strong> <strong>change</strong>, <strong>disaster</strong> <strong>risk</strong>, and the urban<br />
poor. Results from this case study are contributing to the defi nition of the Mexico<br />
City Climate Change Adaptation Program to be implemented in 2012. Th e objectives<br />
of the Mexico City case study were to (1) establish the historic pattern and<br />
trends of hydro meteorological events in the Metropolitan Area of Mexico City<br />
(MAMC) and assess its spatial distribution and socioeconomic impacts; (2) model<br />
<strong>climate</strong> <strong>change</strong> impacts in the MAMC; (3) develop indicators of <strong>risk</strong> and vulnerability;<br />
and (4) present institutional and policy recommendations to respond to<br />
the challenges posed by <strong>climate</strong> <strong>change</strong>, natural <strong>disaster</strong>s, and urban poverty.<br />
Th e case study was prepared in collaboration between the <strong>World</strong> Bank and the<br />
government of Mexico City. As part of this eff ort, a complete document in Spanish,<br />
“Pobreza Urbana y Cambio Climático para la Ciudad de Mexico,” and a short<br />
fi lm are available for wider dissemination.<br />
Th e approach used in this case study is based on the Urban Risk Assessment<br />
(URA) framework. Accordingly, it includes an assessment of the hazards, socioeconomic<br />
vulnerabilities, and institutional aspects related to <strong>climate</strong> <strong>change</strong><br />
and <strong>disaster</strong>s in Mexico City. Th is case study provides valuable geo-referenced<br />
information regarding location of increased <strong>risk</strong> to landslides as a result of<br />
extreme rain, and identifi es areas where increased heat-island eff ect is expected.<br />
■ 217
218 ■ CLIMATE CHANGE, DISASTER RISK, AND THE URBAN POOR<br />
Institutionally, this case study has served to identify shortcomings in the current<br />
operational framework for <strong>climate</strong> <strong>change</strong> and <strong>disaster</strong> <strong>risk</strong> management,<br />
respectively.<br />
Key Findings of the Study<br />
In dealing with <strong>climate</strong> <strong>change</strong>, <strong>disaster</strong> <strong>risk</strong>, and the urban poor, the key challenge<br />
for Mexico City is to defi ne actions that will facilitate the streamlining of<br />
adaptation measures within a context of limited institutional coordination and<br />
cooperation across the 50 geopolitical and administrative units that make up the<br />
Metropolitan Area.<br />
The Vulnerability of the Poor to Climate Change and Natural Hazards<br />
Vulnerable groups in terms of population include about 7 million people (or<br />
42 percent of population of the Mexico City Metropolitan Area) and about 1.5<br />
million dwellings (see fi gure A6.5 in the color section). Most of the vulnerable<br />
population in high-<strong>risk</strong> zones lives in locations with slopes over 15 degrees<br />
(about 1 million people). Th is places them at <strong>risk</strong> of landslides as a result of<br />
extreme precipitation. Th e total population that lives in high-<strong>risk</strong> zones represents<br />
about 40 percent of the vulnerable population.<br />
The Government of Mexico City at Work<br />
Th e government of Mexico City has taken an active role in initiating <strong>climate</strong><br />
<strong>change</strong> programs and the city is the fi rst in Latin America to launch a local <strong>climate</strong><br />
<strong>change</strong> strategy. Th e Mexico City Climate Action Program (MCCAP) consists<br />
of two complementary objectives: mitigation and adaptation.<br />
Furthermore, the government has established the distinguished Virtual Center<br />
on Climate Change for Mexico City (CVCCCM). Th e CVCCCM contributes<br />
to increased and improved knowledge on the impact of <strong>climate</strong> <strong>change</strong> in the<br />
metropolitan area, and contributes the formulation and implementation of public<br />
policies. Th e CVCCCM operates in partnership with the Institute of Science and<br />
Technology of the Federal District and in conjunction with the Centre for Atmospheric<br />
Sciences of the National Autonomous University of Mexico (UNAM).<br />
Mexico City has shown signifi cant leadership in bringing together the <strong>climate</strong><br />
<strong>change</strong> and <strong>disaster</strong> <strong>risk</strong> agendas, and has established the Inter-institutional Climate<br />
Change Commission of Mexico City, which is in charge of coordinating<br />
and evaluating the Mexico City Climate Change Action Program. Although it is<br />
premature to confi rm or refute whether the measures proposed in this program<br />
will be mainstreamed into urban management practices, the wide participation<br />
and the higher-level commitment suggest solid fi rst steps.
ANNEX 6: MEXICO CITY CASE STUDY ■ 219<br />
Key Constraints<br />
Key constraints in dealing eff ectively with <strong>climate</strong> <strong>change</strong>, <strong>disaster</strong> <strong>risk</strong>, and the<br />
urban poor include:<br />
INSTITUTIONAL COORDINATION—Despite signifi cant progress in establishing<br />
an interinstitutional commission, the main challenge continues to be<br />
coordination and cooperation. Even though the program is designed to cut<br />
across institutional boundaries, limited ownership by the participants might hinder<br />
its success.<br />
COMMON DATA PLATFORMS—Currently multiple agencies are taking<br />
actions but with limited communication or information ex<strong>change</strong> among<br />
concerned agencies. Furthermore, each agency has its own information platform,<br />
which hinders data sharing. Th is signals a strong need to develop a<br />
single common interface that all government agencies can use for data storage<br />
and use.<br />
LIMITED BUDGET ALLOCATION—Although the execution of the<br />
MCCAP has an estimated cost of approximately US$5 billion, most of<br />
which is budgeted for mitigation, there has been limited transfer of money.<br />
The only instrument that could specifically provide resources for the action<br />
plan is the Environmental Public Fund, while the remaining identified<br />
actions would have to be financed through each respective agency’s annual<br />
budgets.<br />
Looking Forward<br />
A few basic principles can guide the way forward for addressing <strong>climate</strong> <strong>change</strong>,<br />
<strong>disaster</strong> <strong>risk</strong>, and urban poverty in Mexico:<br />
• Th e consolidation of an institutional framework able to drive the medium-<br />
and long-term challenges posed by <strong>climate</strong> <strong>change</strong> and natural <strong>disaster</strong>s is instrumental<br />
for protecting the most vulnerable. Th is framework must specify<br />
clearly each agency’s role while fostering synergies and collaboration.<br />
• A common language (for example, technical terms and concepts), as well as<br />
a common strategic direction for assessing challenges and progress toward<br />
adaptation and resilience, is critical for mainstreaming this agenda in metropolitan<br />
governance.<br />
• Th e strategies for <strong>climate</strong> action plans should explicitly include reducing and<br />
mitigating the impacts of meteorological events to the most vulnerable.<br />
• Community-based social prevention is an important component of <strong>disaster</strong><br />
prevention<br />
• Further work is necessary to unlock barriers in the development of the earlywarning<br />
system.
220 ■ CLIMATE CHANGE, DISASTER RISK, AND THE URBAN POOR<br />
Case Study Summary<br />
City Profi le<br />
Figure A6.1 Administrative Map of Mexico City Metropolitan Area<br />
MEXICO<br />
Federal district<br />
Cities of the state of Mexico<br />
Cities of the state of Hidalgo<br />
State borders<br />
HIDALGO<br />
DISTRITO<br />
FEDERAL<br />
MORELOS<br />
HIDALGO<br />
Th e Mexico City Metropolitan Area (MCMA) is one of the largest urban agglomerations<br />
in the world. Located in a closed basin of 9,600 km 2 , the MCMA spreads<br />
over a surface of 4,250 km 2 at 2,240 meters above sea level. Th e MCMA has a<br />
metropolitan population estimated at 21.2 million, concentrates 18 percent of<br />
the country’s population, and generates 35 percent of Mexico’s gross domestic<br />
product on a surface equivalent to less than 0.3 percent of the national territory.<br />
Approximately 8.8 million people, or 42 percent of the metropolitan population,<br />
live in the city proper (Mexico City or the Federal District). Th e MCMA<br />
comprises the 16 boroughs of Mexico City and 34 municipalities of the State of<br />
Mexico, for a total of 50 geopolitical and administrative units that must coordinate<br />
among themselves in terms of urban planning, public services, and overall<br />
city management.<br />
Th e MCMA has been growing constantly since the 1930s both physically and<br />
demographically. Th e pace of geographic and population growth, however, has<br />
been distinct. Physical and demographic growth reached its peak in the 1960s,<br />
TLAXCALA<br />
PUEBLA
ANNEX 6: MEXICO CITY CASE STUDY ■ 221<br />
and until the 1990s the physical expansion (urban sprawl) formed a continuous<br />
urbanized area with gross population density decreasing over time, and spatially<br />
increasing with distance from the historical city center. Since 1990 growth has<br />
been characterized by leapfrog expansion, and urban spatial continuity was<br />
broken. Current land use now bears limited contiguity to previously urbanized<br />
areas. For example, in 2000 the neighboring municipalities located in the State of<br />
Mexico represented 52 percent of the population and grew at an annual rate of<br />
2.4 percent on average, while the 16 boroughs of Mexico City had a population<br />
growth rate of 0.3 percent annually.<br />
Th e MCMA is characterized by seismic <strong>risk</strong> and with no natural drainage for<br />
runoff from the surrounding mountains; it is also vulnerable to fl ooding, particularly<br />
in the western part. Th e metropolitan area is aff ected by severe storms,<br />
heat waves, and droughts. Th e size of the population in the MCMA complicates<br />
the possible impacts of these events, as the infrastructure and public services<br />
are stretched thin. As a national economic engine, Mexico City’s geophysical<br />
characteristics and presence of <strong>risk</strong> of multiple natural hazards underscores the<br />
need for the city to implement activities and programs that will increase its<br />
physical and social resilience. To take a recent example, the economic impact<br />
of the 2009 A (H1N1) infl uenza epidemic amounted to 0.4 percent of GDP<br />
(40 billion pesos).<br />
Figure A6.2 Urban Expansion of Mexico City Metropolitan<br />
Areas, 1950–2005<br />
Legend<br />
1950<br />
1960<br />
1970<br />
1980<br />
1990<br />
2000<br />
2005
222 ■ CLIMATE CHANGE, DISASTER RISK, AND THE URBAN POOR<br />
TABLE A6.1<br />
Mexico City Profi le<br />
Total city population in 2010 federal district<br />
8.8 million (INEGI 2010)<br />
Total metropolitan area population in 2010<br />
21.2 million<br />
Population growth (% annual) 3.05 (CONAPO 2010)<br />
Land area, federal district (km2 )<br />
Land area, metropolitan area (km2 1,485<br />
)<br />
4,250<br />
Population density (per km2 ) 5,958<br />
Country’s per capita GDP (US$) 9,243 (2010 estimate)<br />
Country’s population (federal district) (%) 7.87<br />
Total number of households 2,388,534 (INEGI 2010)<br />
Dwelling density (per hectare) 23.9 (SEDESEOL)<br />
Avg. household income US$ (2008) 53,295<br />
GDP per capita US$ (2008) 14,382<br />
Country’s GDP (%) 21.8<br />
Total budget (US$) 11.7 billion<br />
Date of last Urban Master Plan n/a<br />
The Built Environment and Basic Service Provision<br />
Mexico City was the fi rst city in Latin America to introduce a strategy for local<br />
<strong>climate</strong> action that has been designed to reduce overall greenhouse gas emissions<br />
by 7 million metric tons from its inception by Mayor Marcelo Ebrard in<br />
2008–2012. Th e <strong>climate</strong> action program is part of a 15-year plan in which<br />
Mexico City is investing US$1 billion a year (approximately 9 percent of the<br />
yearly budget). Th e Green Plan (Plan Verde) has seven pillars: (1) land conservation,<br />
(2) public spaces, (3) air pollution, (4) waste management and recycling,<br />
(5) water supply and sanitation, (6) transportation, and (7) mobility.<br />
Mexico City has the largest metro system in Latin America, which currently<br />
comprises 200 km of subway lines. It is currently being expanded with a twelft h<br />
metro line stretching 25 km, due to be fi nished in 2012—with an investment of<br />
US$2 billion. Th e Metro, which does not extend outside the limits of the Federal<br />
District, is complemented by a suburban rail system and an extensive network<br />
of bus routes. Mexico City’s fi rst Bus Rapid Transit line, the Metrobus system,<br />
began operation in June 2005. Th e city has begun construction of a third line for<br />
Metrobus that will run from the city’s northwest to the central-south, extending<br />
over 16 km with 31 stations.<br />
Water access is a complex problem for Mexico City, which has a supply network<br />
of some 13,000 km of primary and secondary pipelines. Beyond issues of<br />
expanding coverage and continuity of water services, the city rests on heavily<br />
saturated clay that has been collapsing and causing areas of the city to sink<br />
and subsequently endure more frequent fl ooding due to over-extraction of<br />
groundwater. Forecasts to 2015 estimate that rates of water consumption will<br />
increase by 20 percent compared to 2000 levels, with urban demand reaching
ANNEX 6: MEXICO CITY CASE STUDY ■ 223<br />
62 m 3 per second. Mexico City’s <strong>climate</strong> action program therefore includes<br />
measures to invest in water infrastructure, for example, the rehabilitation of the<br />
city’s sewerage system as part of a program of hydraulic works.<br />
Regarding land conservation, 59 percent of the total land area of Mexico City<br />
is designated a conservation area, with the city’s remaining forested areas located<br />
in the southern boroughs. Th ese areas are under threat from illegal development,<br />
logging, and fi res, which impact regional rain patterns. At present the city’s generation<br />
of garbage is increasing at a rate of 5 percent a year and the current insuffi<br />
cient rates of its collection have created “clandestine” fi elds. Bordo Poniente,<br />
one of the world’s largest landfi ll sites, receives 12,500 tons of waste every day. In<br />
response, Mexico City has initiated a recycling program and is encouraging its<br />
citizens to separate trash.<br />
Pillar 1—Institutional Assessment<br />
Given the institutional and political complexities of the Mexico City Metropolitan<br />
Area, the Mexico City Climate Action Program (MCCAP) 2008–2012<br />
requires a high level of coordination among multiple agencies and civil society.<br />
Th e MCCAP was developed as part of both the Green Plan and the Environmental<br />
Agenda of Mexico City. Th e Green Plan extends to 15 years, laying out<br />
strategies and actions of sustainable development for Mexico City. Th e Environmental<br />
Agenda of Mexico City is a 5-year plan that defi nes the city’s environmental<br />
policy. At the same time, both the Green Plan and the Environmental Agenda<br />
are part of one of the pillars of Mexico City’s Development Program.<br />
Th e main objectives of the MCCAP are twofold: (1) reduce carbon dioxide<br />
emissions by 7 million tons (or equivalent) in the period 2008–2012 and (2)<br />
develop a Climate Change Adaptation Program for the Federal District and<br />
begin its implementation by 2012. To achieve these objectives, the government<br />
uses various policy instruments, including direct investment from Mexico City,<br />
regulation, economic incentives, voluntary carbon markets, and education and<br />
information campaigns.<br />
Th e Inter-institutional Climate Change Commission of Mexico City is in<br />
charge of coordinating and evaluating the MCCAP. Th is commission includes<br />
representatives from all the administrative units of the Federal District. In addition,<br />
three deputies from the district’s Legislative Assembly are invited to attend<br />
each session. Among its specifi c responsibilities are to design, encourage, and<br />
coordinate policies to mitigate <strong>climate</strong> <strong>change</strong> eff ects in Mexico City; to evaluate,<br />
approve, and disseminate related projects; to develop fi nancial strategies that generate<br />
revenue; and to coordinate actions and policies with other programs linked<br />
to the MCCAP. To facilitate coordination and provide support to the MCCAP,<br />
the Legislative Assembly of Mexico City is working on a proposal for a <strong>climate</strong><br />
<strong>change</strong> law (not yet entered into force as of March 2011).
224 ■ CLIMATE CHANGE, DISASTER RISK, AND THE URBAN POOR<br />
Although the execution of the MCCAP has an estimated cost of approximately<br />
US$5 billion, most of which is budgeted for mitigation, there has been little transfer<br />
of money. Th e only instrument that could specifi cally provide resources for<br />
the MCCAP is the Environmental Public Fund, while the remaining identifi ed<br />
actions would have to be fi nanced through each agency’s annual budgets.<br />
Th e main challenge of the MCCAP is the lack of institutional coordination and<br />
cooperation. Even though the program was designed to cut across institutional<br />
boundaries, there is lack of ownership and it is mostly considered a program of<br />
the secretary of environment. Currently multiple agencies are taking actions but<br />
with limited communication or information ex<strong>change</strong> among concerned agencies.<br />
Further exacerbating the open ex<strong>change</strong> of data is that each agency has its<br />
own information platform. Th is signals a strong need to develop a single common<br />
interface that all government agencies can use for data storage and use.<br />
Climate Change Adaptation and Disaster Response<br />
Th e MCCAP’s program of adaptation consists of short- and long-term actions<br />
that aim to reduce <strong>risk</strong>s to the population and economy of Mexico City by taking<br />
the potential impacts of <strong>climate</strong> <strong>change</strong> into account. Th e lines of action regarding<br />
adaptation are: (1) identifying key threats and performing a vulnerability<br />
analysis, (2) mainstreaming adaptation to enhance existing capabilities in Mexico<br />
City’s government, and (3) implementing adaptation.<br />
Th ere are multiple agencies involved in responding to extreme hydro-meteorological<br />
events, including: Th e Water System of Mexico City, the Civil Protection<br />
Agency, the Public Safety Agency, the Health Department, the Social Development<br />
Agency, the Social Assistance Institute, and the Urban Development and<br />
Housing Agency. Th eir main tasks follow.<br />
TABLE A6.2<br />
Institutional Responsibilities Relating to Climate and Disasters<br />
Institution Headed by/level Major function<br />
Water<br />
system of<br />
Mexico City<br />
Civil<br />
Protection<br />
Agency<br />
Secretary of<br />
environment<br />
Secretary of<br />
interior<br />
Responsible for public services related to water supply,<br />
drainage, sewerage, and water treatment. They also<br />
coordinate and operate the “Storm Unit” during highprecipitation<br />
emergencies in 90 previously identifi ed<br />
high-<strong>risk</strong> locations, with the participation of the Civil<br />
Protection Agency, the Public Safety Agency, and the<br />
Fire Department.<br />
Responsible for coordinating prevention and response<br />
to natural <strong>disaster</strong>s, mainly fl oods and earthquakes,<br />
using a “Risk Atlas” that has more than 100 maps depicting<br />
multiple hazards. In terms of fl ooding, they have<br />
(continued next page)
TABLE A6.2 continued<br />
ANNEX 6: MEXICO CITY CASE STUDY ■ 225<br />
Institution Headed by/level Major function<br />
Public Safety<br />
Agency<br />
Health<br />
Department<br />
Social<br />
Development<br />
Agency<br />
Social Assistance<br />
Institute<br />
Urban<br />
Development<br />
and Housing<br />
Agency<br />
Operates in<br />
coordination with<br />
the water system<br />
of Mexico City and<br />
the Civil Protection<br />
Agency<br />
In emergencies,<br />
coordinates with<br />
the Civil Protection<br />
Agency<br />
identifi ed critical locations based on past events, but<br />
these are not necessarily the same maps used by the<br />
Water System of Mexico City. Importantly, this agency<br />
has focused mainly on prevention, response, and capacity<br />
building for seismic <strong>disaster</strong>s. They defi ned and<br />
are implementing the Crisis and Immediate Response<br />
Action Plan.<br />
Intervenes when natural <strong>disaster</strong>s occur.<br />
Responsible for periodic monitoring of epidemic prevention<br />
and response (including AH1N1 and dengue).<br />
In addition to medical attention, it organizes vaccination<br />
campaigns.<br />
Provides support and responds to emergencies related<br />
to heat and cold waves and fl oods. In addition to<br />
operating public dining locations, the agency establishes<br />
shelters with food and provides psychological<br />
assistance.<br />
Responsible for general social assistance (including<br />
psychological support) for the Federal District, but also<br />
during emergencies. Through one of its programs, it<br />
operates a hotline to support homeless people. It also<br />
supports families affected by <strong>disaster</strong>s and operates<br />
11 centers for social assistance.<br />
Responsible for medium- and long-term prevention of<br />
<strong>disaster</strong>s through urban planning. It is involved in issues<br />
related to irregular terrains in high-<strong>risk</strong> locations. It<br />
has plans to develop an information system for Mexico<br />
City that will include geographic and urban development<br />
indicators.<br />
Ongoing Programs and Projects Related to Disaster Risk Management or<br />
Climate Change Adaptation<br />
Programs for <strong>climate</strong> <strong>change</strong> adaptation focus on early-warning systems and<br />
medium-term response:<br />
• Programs on early-warning systems and upstream prevention include the implementation<br />
of a hydro-meteorological monitoring and forecasting system<br />
for Mexico Valley, an epidemiological monitoring system, and a remote identifi<br />
cation and monitoring system for fi res. In addition, initiatives are in place
226 ■ CLIMATE CHANGE, DISASTER RISK, AND THE URBAN POOR<br />
for management of hillside <strong>risk</strong>, the protection of native vegetation to reduce<br />
erosion, and the establishment of processes to help vulnerable populations.<br />
• Regarding medium-term response, Mexico City is running projects on<br />
water and land conservation, land management for agricultural rural areas,<br />
reforestation with more resilient species, and green roofi ng in urban areas.<br />
Table A6.3 shows the goals and key results of the main projects to adapt to<br />
<strong>climate</strong> <strong>change</strong> in the context of the Climate Action Program for Mexico City.<br />
• For emergency response in case of landslides or fl ooding, the most relevant<br />
agencies are the Department of Civil Protection, Fire and Health, complemented<br />
by Brigades of the Ministry of Social Development, to provide shelter,<br />
hot food, and psychological help to those aff ected, as well as the Ministry of<br />
Public Security to control access and prevent vandalism. As a permanent activity,<br />
there are homeless shelters and soup kitchens and attention to patients<br />
with severe respiratory or dehydration.<br />
TABLE A6.3<br />
Status of Main Projects to Adapt to Climate Change<br />
Program/responsible<br />
agency Goals Results<br />
Urban Hillsides<br />
Program—Environmental<br />
Agency<br />
Dengue Monitoring—<br />
Health Department<br />
Monitoring and prevention<br />
of health effects due<br />
to extreme weather—<br />
Health Department<br />
Epidemiological and<br />
health monitoring of<br />
<strong>climate</strong> <strong>change</strong>—Health<br />
Department<br />
Support to vulnerable<br />
populations during winter<br />
season—Social<br />
Assistance Institute<br />
Risk Atlas of Mexico<br />
City—Civil Protection<br />
Agency<br />
By 2012, identify 33<br />
hillsides and develop and<br />
disseminate their management<br />
programs<br />
Determine mortality rate<br />
due to dengue<br />
Avoid mortality and<br />
mitigate <strong>risk</strong>s and health<br />
effects of exposure to<br />
extreme temperatures<br />
Monitor chlorine in water,<br />
water supply systems,<br />
sanitary monitoring of food<br />
production and distribution,<br />
among others<br />
Provide support and social<br />
assistance to vulnerable<br />
people<br />
Develop an integrated<br />
information system shared<br />
by all administrative units<br />
As of 2009, nine hillsides identifi ed<br />
and seven programs developed<br />
Annual studies made to identify<br />
the presence of the virus, <strong>risk</strong>y<br />
areas mapped, and household<br />
surveys made<br />
Information campaigns conducted,<br />
serum kits distributed,<br />
and chlorine in water closely<br />
monitored<br />
In 2010, over 36,000 water<br />
samples and 125 food samples<br />
taken for analysis. Over 1,900<br />
visits to establishments to evaluate<br />
sanitary conditions<br />
In 2010, over 200,000 warm<br />
dinners and 15,000 blankets distributed.<br />
Also, over 6,000 medical<br />
consultations provided, among<br />
other services<br />
Efforts ongoing<br />
(continued next page)
TABLE A6.3 continued<br />
Preventive program for<br />
hydro-meteorological<br />
<strong>risk</strong>s—Civil Protection<br />
Agency<br />
Storm Unit Program—<br />
Water System of<br />
Mexico City<br />
Reduction of extreme<br />
precipitation impacts in<br />
“El Arenal”—Government<br />
Secretariat<br />
Sustainable housing in<br />
the Federal District—<br />
Housing Institute of the<br />
Federal District<br />
ANNEX 6: MEXICO CITY CASE STUDY ■ 227<br />
Program/responsible<br />
agency Goals Results<br />
Source: Leon et al. (2010).<br />
Shortcomings in Current Disaster Risk Management or Climate Change<br />
Adaptation Management<br />
Disaster <strong>risk</strong> in Mexico City is handled in a reactive manner with limited preventative<br />
measures in place. Implementation of the early-warning system, envisioned<br />
as one of the priority adaptation measures included in the MCCAP, has<br />
been delayed due to administrative issues. In addition, there is an evident need<br />
to improve the sharing of information among the relevant government agencies,<br />
taking as an example the Risk Atlas (elaborated by the secretary of civil protection),<br />
to which not all agencies have access.<br />
Leading Activities to Coordinate Agency Risk Management<br />
Th e secretary of civil protection is in charge of <strong>risk</strong> management in Mexico City,<br />
although many other agencies are also involved.<br />
Pillar 2—Hazards Assessment<br />
Prevention, mitigation, and<br />
response to emergencies<br />
due to hydro-meteorological<br />
events<br />
Response to negative effects<br />
of precipitation during<br />
the rainy season<br />
Mitigate negative impact<br />
of extreme precipitation in<br />
14 areas<br />
Incorporate green<br />
technologies into new<br />
housing<br />
260 informational reports disseminated,<br />
often daily during the week<br />
Between 2008 and 2010, over<br />
6,000 cases were attended and<br />
resolved<br />
Food, drinks, blankets, and cleaning<br />
products distributed. Equipment<br />
installed to speed up the<br />
drainage, and sewers cleaned<br />
Solar water heaters, energy<br />
effi ciency lamps, and water treatment<br />
by re-utilization, among<br />
others, incorporated in over 5,000<br />
new dwellings<br />
Natural Disaster History<br />
Th e Mexico Valley is exposed to increases in extreme temperatures, which with<br />
expanding urbanization has contributed to a signifi cant heat-island eff ect for<br />
Mexico City. Projections reveal that the mean temperature is expected to increase<br />
by 2–3°C toward the end of the 21st century, and extreme precipitation is also<br />
expected to increase. Characteristically rising temperatures are accompanied by
228 ■ CLIMATE CHANGE, DISASTER RISK, AND THE URBAN POOR<br />
TABLE A6.4<br />
Natural Hazards<br />
Yes /No Date of last major event<br />
Earthquake Y 1985<br />
Wind storm Y 2010<br />
River fl ow N<br />
Floods, inundations, and waterlogs Y 2010<br />
Tsunami N<br />
Drought Y 2011<br />
Volcano N<br />
Landslide Y<br />
Storm surge N<br />
Extreme temperature Y<br />
an increase in extreme rain, consequently placing Mexico City at heightened <strong>risk</strong><br />
of fl ooding and landslides, particularly in the western part of the city.<br />
Current Trends and Projections<br />
Temperature—Th e temperature in the Mexico Valley refl ects its geography,<br />
where warmer temperatures are concentrated in the lower elevations and cooler<br />
temperatures in the elevated areas. Nevertheless, with time, the temperature in<br />
the Mexico Valley has <strong>change</strong>d due to urbanization, constituting one of the clearest<br />
examples of a heat-island eff ect in the world. Th e highest values are observed<br />
in the northeast, where the average maximum reaches 30°C. Th e area with main<br />
maximum temperatures over 24°C increased considerably between 2000 and<br />
2007, and the minimum temperature increased by 2°C and 3°C in the north and<br />
northeast, respectively, in the same period. While temperature increase in the<br />
western part of Mexico City has been lower, the frequency and duration of heat<br />
waves in the area are increasing. For example, the number of heat waves of three<br />
or more days with 30°C or higher increased from 2 in 1877–1887 to 16 in 1991–<br />
2000 in the west of the Federal District (Jáuregui 2000). Simulation exercises<br />
for temperature in January show that temperature in the northeast, which is<br />
the region that has grown fastest, increased 2°C. Although this temperature rise<br />
may in part be the eff ect of urbanization, some atmospheric conditions may also<br />
have had an impact, and this order of magnitude is in line with those expected<br />
this century by models simulating global warming.<br />
To further understand temperature increases associated with urbanization,<br />
an analysis was undertaken of temperature trends in areas with rapid urbanization<br />
against those in regions that are close to highly vegetated areas. For Mexico<br />
City, the trend in the minimum temperature in regions with rapid urbanization<br />
between 1963 and 2000 is an increase of about 0.7°C per decade, while for regions<br />
close to vegetated areas the associated increase was about 0.1°C per decade.
ANNEX 6: MEXICO CITY CASE STUDY ■ 229<br />
Another way to evaluate the eff ects of extreme events is to analyze the 90th<br />
percentile of the maximum temperature using a projection from the Earth Simulator.<br />
For 2015–2039, the northeast region will have temperatures around 30°C<br />
for at least 10 percent of the year, as shown in fi gure A6.3.<br />
Precipitation—Precipitation projections for Mexico City seem to be consistent<br />
with the general projection made by the Intergovernmental Panel on Climate<br />
Change (IPCC) in 2007, which states that precipitation will increase in regions with<br />
high precipitation and decrease in regions with low precipitation. Particularly, the<br />
intensity and quantity of extreme precipitation is expected to increase in the west<br />
of the city, and decrease in the east. In the Mexico Valley the highest precipitation<br />
occurs between mid-May and early October, with the western region receiving the<br />
most precipitation in August. On average, annual precipitation is between 700 and<br />
900 mm (±30 percent). Th e highest intensity usually occurs during the aft ernoon<br />
and early evening. Th e western region presents upward trends for daily precipitation<br />
and episodes over 20 mm/hour over the past 100 years. During September<br />
and October, more than 30 mm/hour of rain may occur, which, based on a review<br />
of landslides, is the critical threshold for landslides of saturated land. Projected<br />
increases in extreme precipitation in terms of the intensity and duration are shown<br />
in fi gure A6.4. In the west of Mexico City, these increases constitute a signifi cant<br />
hazard for vulnerable populations located on hillsides. Additionally, projected<br />
increases in extreme precipitation add to the <strong>risk</strong> of fl ooding in the west of Mexico<br />
City and the southern areas of the Federal District.<br />
Water Runoff—Climate <strong>change</strong> projections indicate that with increasing<br />
temperature, evapotranspiration increases at the expense of infi ltration and runoff .<br />
For many urban areas, including the MCMA, <strong>change</strong>s in land use also aff ect this<br />
ratio, whereby as urbanization increases, less water is naturally absorbed into the<br />
ground and more runoff occurs. Assuming 100 mm of rainfall and using information<br />
about land and vegetation types, the approximate amount of water runoff was<br />
calculated for Mexico Valley. 1 Th e fi ndings show a noticeable increase in runoff in<br />
Figure A6.3 90th Percentile of Maximum Temperature, in Celsius, in<br />
1979–2003 (left) and 2015–2039 (right)<br />
22 – 23<br />
23 – 24<br />
24 – 25<br />
25 – 26<br />
26 – 27<br />
27 – 28<br />
28 – 30<br />
Source: Leon et al. (2010).
230 ■ CLIMATE CHANGE, DISASTER RISK, AND THE URBAN POOR<br />
Figure A6.4 95th Percentile of Precipitation (mm/day) in 1979–2003 (left)<br />
and 2015–39 (right)<br />
14–15<br />
16–17<br />
18–20<br />
21–22<br />
23–25<br />
26–28<br />
29–30<br />
Source: Leon et al. (2010).<br />
2000 when compared with 1980. Th e increased precipitation and resulting runoff<br />
increases fl ood <strong>risk</strong> in the city, particularly given the existing drainage system.<br />
Pillar 3—Socioeconomic Assessment<br />
Location of the Urban Poor<br />
Vulnerable groups were identifi ed and mapped in terms of population and housing<br />
characteristics by doing a cluster analysis with data from the 2000 offi cial<br />
census. 2 In terms of population, vulnerable groups include areas with high concentration<br />
of people over 18 years without secondary education, people that<br />
moved in the past 5 years, and people with low income. As shown in table A6.5,<br />
this group includes about 7 million people (or 42 percent of the population of the<br />
Mexico City Metropolitan Area) and about 1.5 million dwellings.<br />
In terms of housing, vulnerable groups are concentrated in areas characterized<br />
by use of precarious construction materials in walls and ceilings, those without<br />
access to basic services, and where formal property ownership and rights are limited.<br />
Th is group includes about 5 million people (or 30 percent of the population)<br />
and about 1 million dwellings. Th e location of these groups is shown by<br />
fi gure A6.5, in the color section. Th e most vulnerable in terms of both population<br />
and housing represent about 27 percent of the population and are located in the<br />
peripheral area of the MCMA, mostly to the north and east. 3<br />
Exposure of the Urban Poor<br />
Th e information on vulnerable groups was overlaid with information on<br />
extreme precipitation and temperature, and locations with steep slopes.<br />
Maps similar to fi gure A6.5 were created to observe the location of these<br />
groups with respect to high-<strong>risk</strong> zones: current and future extreme precipitation<br />
and vulnerable housing; vulnerable population and housing located
Housing<br />
ANNEX 6: MEXICO CITY CASE STUDY ■ 231<br />
TABLE A6.5<br />
Vulnerability Matrix in Terms of Population and Housing<br />
Population<br />
Low vulnerability High vulnerability<br />
Low vulnerability 2,609 PSUs*<br />
514 PSUs<br />
9,516,901 people<br />
2,639,058 people<br />
2,329,416 dwellings<br />
584,547 dwellings<br />
54.8% of population<br />
15.2% of population<br />
High vulnerability 164 PSUs<br />
1,354 PSUs<br />
577,583 people<br />
4,635,298 people<br />
128,831 dwellings<br />
964,144 dwellings<br />
*Primary sampling units.<br />
Source: Leon et al. (2010).<br />
3.3% of population<br />
26.7% of population<br />
TABLE A6.6<br />
Social Assessment<br />
City population below poverty line (%) 59.4<br />
Social inequality (Gini index) in 2002 (UN Habitat) 0.43 (2008) CIA factbook<br />
Unemployment (% of total labor force) 6.3<br />
Areal size of informal settlements as a percent n/a<br />
of city area<br />
City population living in slums (%) 22<br />
Children completing primary and secondary<br />
57.4 (Mexico City)<br />
education: survival rate<br />
Human Development Index (2009) 75<br />
Predominant housing material For the very poor, assorted salvaged<br />
materials; for self-builders, concrete<br />
blocks and brick<br />
in zones with high <strong>risk</strong> of extreme precipitation; vulnerable population and<br />
housing located in zones with slopes over 15 degrees; vulnerable population<br />
and housing located in zones with <strong>risk</strong> of heat waves; and vulnerable population<br />
and housing located in zones with <strong>risk</strong> of extreme precipitation and<br />
slopes over 15 degrees.<br />
Figure A7.4, in the color section, shows the distribution of population and<br />
housing for each event. Most of the vulnerable population in high-<strong>risk</strong> zones<br />
lives in locations with slopes over 15 degrees (about 1 million people). Th e<br />
total population that lives in high-<strong>risk</strong> zones represents about 40 percent of<br />
the vulnerable population and about 41 percent of the vulnerable dwellings.<br />
Importantly, about 60 percent of the vulnerable population and dwellings are<br />
not located in high-<strong>risk</strong> zones.
232 ■ CLIMATE CHANGE, DISASTER RISK, AND THE URBAN POOR<br />
TABLE A6.7<br />
Distribution of Vulnerable Groups Located in High-Risk Zones<br />
Event PSUs 1 % Population % Housing %<br />
I. Extreme precipitation 48 3.55 179,019 3.86 38,909 4.06<br />
II. Slopes over 15 degrees 288 21.27 1,004,586 21.67 208,546 21.63<br />
III. Heat waves 117 8.64 367,450 7.93 76,771 7.96<br />
I + II 59 4.36 251,118 5.42 53,455 5.54<br />
I + III 1 0.07 39 0.00 10 0<br />
II + III 23 1.70 62,449 1.35 13,175 1.37<br />
I + II + III 0 0.00 0 0.00 0 0.00<br />
Vulnerable in high-<strong>risk</strong> zones 536 39.59 1,864,661 40.23 390,866 40.54<br />
Total vulnerable 1354 100 4,635,298 100 964,144 100<br />
Source: Leon et al. (2010).<br />
1 PSU refer to primary sampling units defi ned in the context of the 2000 census.<br />
Economic Costs of Climate Change—Another important aspect of the<br />
socioeconomic assessment was the analysis of the economic costs of <strong>climate</strong><br />
<strong>change</strong> in terms of GDP for the Federal District. Th is analysis incorporated<br />
four scenarios. Th e base scenario, named A2, does not include <strong>climate</strong> <strong>change</strong><br />
impacts and assumes 1.99 percent of annual GDP growth, 1.81 percent of<br />
annual GDP per capita growth, and 18 percent of population growth for 2100.<br />
Th e other three scenarios correspond to diff erent goals on reduction of greenhouse<br />
gas emissions considered in international negotiations (that is, 550, 450,<br />
and 350 parts per million, or ppm). Th e analysis incorporated three discount<br />
rates (0 percent, 1 percent, and 4 percent); however, based on the literature on<br />
the costs of <strong>climate</strong> <strong>change</strong>, the authors recommend using 0 percent to draw<br />
conclusions. Table A6.8 shows costs for each scenario in terms of GDP reduction<br />
and additional number of poor people by 2100 for the Federal District,<br />
using a 0 percent discount rate. Shown is the average value, as well as the 95<br />
percent confi dence interval in parentheses.<br />
Under the status quo scenario (A2), it is expected that the GDP will be reduced<br />
19 times on average. Th ese results are not too diff erent from those under the 550<br />
ppm scenario. However, if the 350 ppm scenario is realized, the benefi ts could<br />
reach 32 times the current GDP (in terms of avoided losses). Also under the A2<br />
scenario, the number of poor is projected to increase to over 1 million (or about<br />
10 percent of population in 2100), although the average increase is expected to<br />
be 450,000. Th e analysis also pointed out that economic losses are not distributed<br />
equally among administrative units. Th ose that will lose the most are those<br />
that are currently worse off . In other terms, if the temperature increases by 2°C,<br />
Mexico City could lose up to 7 percent of its GDP and get 150,000 additional<br />
poor annually.
TABLE A6.8<br />
Costs in Terms of GDP and Additional Poor<br />
Scenario<br />
Notes<br />
ANNEX 6: MEXICO CITY CASE STUDY ■ 233<br />
1. Runoff calculation was undertaken using the curve number method, developed by the<br />
USDA Natural Resources Conservation Service.<br />
2. Th e census data are coded, for all variables, in primary sampling units (PSUs) or territorial<br />
units, called by the Mexican offi cial census institution basic geo-statistic areas<br />
(AGEBs, Areas Geoestadísticas Básicas).<br />
3. In addition to those living in low-income neighborhoods, Mexico City also has a sizable<br />
homeless population, which is particularly vulnerable to extreme events. Importantly,<br />
this segment of the population is not accounted for in the city’s calculations of<br />
urban poverty, as such information relates to those who possess a dwelling.<br />
Reference<br />
GDP reduction by 2100,<br />
no. of times<br />
Additional number<br />
of poor people by 2100,<br />
in thousands<br />
A2 19.10 (5.22, 45.79) 441 (98,1281)<br />
550 ppm 17.35 (4.52, 43.04) 392 (81,1176)<br />
450 ppm 10.77 (3.15, 24.38) 213 (51,560)<br />
350 ppm 6.50 (2.03, 13.70) 104 (26,249)<br />
Source: Leon et al. (2010).<br />
Leon, C., V. Magaña, B. Graizbord, R. González, A. Damian, and F. Estrada. 2010. “Pobreza<br />
Urbana y Cambio Climático para La Ciudad de México.” Unpublished, Mayor’s Task<br />
Force Study, Mexico City.
Annex 7: São Paulo Case Study<br />
Overview and Key Findings<br />
In São Paulo, the largest city in Latin America, almost 11.5 million people live<br />
in 1.5 km 2 . More than 40 percent of the population lives in peripheral areas that<br />
concentrate a vast proportion of the city’s poor and socially vulnerable citizens.<br />
São Paulo is already experiencing some consequences of a changing <strong>climate</strong>:<br />
more frequent heavy rains, higher temperatures, and decreased air humidity. An<br />
estimated 900,000 houses in the peripheral areas are considered at <strong>risk</strong>—some<br />
located in slopes and fl oodable areas—and will be the most aff ected by <strong>climate</strong><br />
<strong>change</strong>.<br />
In this context, this case study presents the fi rst comprehensive revision<br />
of policies and programs at the intersection of <strong>climate</strong> <strong>change</strong>, <strong>disaster</strong> <strong>risk</strong>,<br />
and the urban poor in São Paulo. Th e case study has been prepared by the<br />
<strong>World</strong> Bank, in close consultation with the São Paulo Housing Secretariat<br />
and the Green and Environment Secretariat. Th ese two secretariats have<br />
contributed with their expertise in working with slums and informal settlements,<br />
as well as working in <strong>disaster</strong> <strong>risk</strong> management and <strong>climate</strong> <strong>change</strong><br />
adaptation.<br />
Th e approach used in this case study is based on the Urban Risk Assessment<br />
(URA) framework. Accordingly, it includes an assessment of the hazards, socioeconomic<br />
vulnerabilities, and institutional aspects related to <strong>climate</strong> <strong>change</strong> and<br />
<strong>disaster</strong> <strong>risk</strong> management in São Paulo. Extensive data collection and stakeholder<br />
■ 235
236 ■ CLIMATE CHANGE, DISASTER RISK, AND THE URBAN POOR<br />
consultation was carried out as part of this study. In particular, two highly vulnerable<br />
communities in São Paulo were consulted and analyzed more in depth.<br />
With a focus on the urban poor, this study considers how poor communities<br />
are aff ected by <strong>climate</strong> <strong>change</strong> and natural hazards, examines approaches that<br />
have been taken to address these challenges, and identifi es priorities and options<br />
for further action in São Paulo. Th is study draws on other existing reports and<br />
resources on <strong>disaster</strong> <strong>risk</strong> management and <strong>climate</strong> <strong>change</strong>, as well as on interviews<br />
and discussions with key stakeholders.<br />
Key Findings of the Study<br />
Independent studies predict that in the absence of signifi cant policy <strong>change</strong>s, by<br />
the end of the century urban occupation in São Paulo will be twice the current<br />
one and 11 percent of the future occupied areas could be located in areas at <strong>risk</strong><br />
for landslide. Th is will increase the <strong>risk</strong>s of fl oods and landslides, impacting disproportionally<br />
the poorest.<br />
Although this scenario will occur only in the absence of signifi cant <strong>change</strong>s<br />
in the spatial distribution and socioeconomic characteristics of the city, it does<br />
highlight the importance of dealing with <strong>climate</strong> <strong>change</strong> and <strong>disaster</strong> <strong>risk</strong> with a<br />
focus on the urban poor.<br />
Th e Mayor’s Task Force in the city of São Paulo found that:<br />
• Th e vulnerable groups who occupy areas at <strong>risk</strong> will have diffi culty coping<br />
with unpredictable and extreme weather. Slum dwellers (currently more<br />
than 890,000 households) lack the resources necessary to adapt rapidly to the<br />
changing circumstances.<br />
• Slums face the most hazardous conditions; more than 5 percent of slum areas<br />
are highly or very highly exposed to landslides and are highly prone to be<br />
aff ected by destructive events in the next 12 months.<br />
• While the location of certain settlements in areas of fl ood plain or wetlands<br />
does not necessarily indicate fl ood hazards, it is an indirect estimate of areas<br />
potentially more exposed to such events. Th e incidence of precarious and<br />
informal settlements in these areas shows how intensive their occupation<br />
has been. About 20 percent of the slums and informal urbanized centers are<br />
located in fl ood plains. About 13 percent of the allotments and informal settlements<br />
are located in fl ood plains and fl ood hazard areas.<br />
• In the slums, virtually all families live in poverty or extreme poverty. In addition,<br />
a great number of the basic services that the people depend upon suff er negative<br />
impacts with the severe weather. For instance, the public transportation<br />
system in São Paulo is not fully equipped to handle fl oods and overfl ows.<br />
• Th e sanitation system has some defi cits (6 percent of houses do not have<br />
proper sewage collection and 25 percent of the effl uent is not treated).
ANNEX 7: SÃO PAULO CASE STUDY ■ 237<br />
• Energy service is irregular and the systems suff er with the storms, which lead<br />
to electricity shortage in houses and streets, creating an unsafe feeling among<br />
the inhabitants.<br />
The Government of São Paulo at Work<br />
Th e city of São Paulo has been a pioneer in monitoring greenhouse gases at the<br />
city level. As part of the C40 group, São Paulo has committed to prepare a GHG<br />
emissions inventory, adopt a future reduction target on GHG emissions, create a<br />
local action plan in a participatory process, implement <strong>climate</strong> policies and measures,<br />
and monitor and verify results.<br />
In 2005 São Paulo launched its fi rst inventory. Furthermore, in 2007, the City<br />
Assembly passed a law that required new houses and buildings assembled with<br />
more than four bathrooms to adopt a solar-panel heating system. In 2009 the<br />
City Assembly approved the City Climate Law to ensure the city´s contribution<br />
to stabilizing GHG in the atmosphere in accordance with UNFCCC principles.<br />
Th e City Climate Law set a reduction target of 30 percent in GHG emissions<br />
against the baseline 2005 emission levels. Additional targets should be defi ned<br />
each two years. Th e law establishes a number of commitments for the city to follow<br />
by sector. From 2005 to 2010, the city already has cut its emissions by 20 percent,<br />
largely due to implementing biogas power plants on two large landfi lls.<br />
A Special Fund for the Environment and Sustainable Development was created<br />
in 2001 with the purpose of fi nancially supporting projects that aim to<br />
improve the sustainable use of natural resources; control, monitor, protect, and<br />
recuperate the environment; and initiate environmental education. Currently, the<br />
fund does not have budget revenue from the municipal government of São Paulo,<br />
instead its revenue coming from various resources (R$8 million) that are directed<br />
to 15 projects from NGOs chosen through tenders; and Carbon Credits Auctions<br />
(R$33 million + 37 million), the amount originated from CDM projects implemented<br />
at the Bandeirantes Landfi ll and São João Landfi ll. Th e fund has been<br />
used to support the creation of a database on GHG emissions, publication of an<br />
inventory of anthropic emissions every fi ve years, and actions for <strong>climate</strong> <strong>change</strong><br />
mitigation, including incentives for the private sector and research institutions.<br />
Areas for Improvement<br />
Some of the recommended areas for work out of the Mayor’s Task Force include:<br />
• Housing—Increase the regularization and improvement of slums and irregular<br />
allotments and relocate families from <strong>risk</strong>y areas.<br />
• Health—Increase the number of people served in health services and increase<br />
its qualities.<br />
• Transportation—Increase the coverage of bus, trains, and subway routes,<br />
improve bus stops and terminals, renovate electric bus system and cars, enable<br />
public transport, decrease traffi c rates, and increase traffi c safety.
238 ■ CLIMATE CHANGE, DISASTER RISK, AND THE URBAN POOR<br />
• Education—Improve public system, decrease evasion rates, especially for the<br />
medium (or secondary) education; increase the number of public nurseries<br />
(insuffi cient to meet the growing demand).<br />
• Water supply—Increase the water quality and protect water basins.<br />
• Sewage—Increase system coverage and avoid illegal disposal of sewage into<br />
water courses.<br />
• Waste management—Increase inspection of illegal dumping places, decrease<br />
waste generation, and increase recycling.<br />
• Cleaning—Improve cleaning coverage for culverts and streets.<br />
• Drainage—Clean and dredge the river bottoms, clean and increase the existing<br />
drainage underground channels, and build more “pools” (“piscinões”)<br />
around the city.<br />
• Looking forward—Mainstream <strong>climate</strong> <strong>change</strong>, <strong>climate</strong> variability, and <strong>disaster</strong><br />
<strong>risk</strong> reduction in planning land use. Th is should strengthen the municipality’s<br />
own medium-term planning, enabling them to prepare for (among other<br />
things) the hosting of Global Expo in 2020.<br />
Looking Forward<br />
Overall, this study highlights some of the challenges a metropolis like São Paulo<br />
is facing regarding present and future <strong>climate</strong> <strong>change</strong> and <strong>disaster</strong> <strong>risk</strong> scenarios,<br />
especially when dealing with an ever-increasing socially vulnerable population.<br />
Th e document also shares the lessons already learned by the city when addressing<br />
this subject. In the short and medium term in addressing <strong>climate</strong> <strong>change</strong>, <strong>disaster</strong><br />
<strong>risk</strong> and urban poverty, key areas for reform include:<br />
• Coordinate and integrate information databases among the diff erent city secretariats.<br />
As of now the city faces a multiplicity of information produced and<br />
used by diff erent agencies. Th e unifi cation of information could lead to shared<br />
programs.<br />
• Extend public disclosure of information and public participation in the design<br />
and implementation of <strong>climate</strong> projects to ensure stakeholders are involved.<br />
• Incorporate <strong>climate</strong> <strong>change</strong> policies into city administration in order to guarantee<br />
continuity.<br />
• Enhance mapping capacity to better inform resilience in decision making.<br />
• Improve inequality in adaptive capacity across the city through capacitybuilding<br />
programs for stakeholders, practitioners, city managers, and decision<br />
makers. Structured learning resources and the ex<strong>change</strong> of experiences<br />
with other cities can be applied to increase the understanding of the linkages<br />
between <strong>climate</strong> <strong>change</strong> and <strong>disaster</strong> <strong>risk</strong> management and the urban poor in<br />
diff erent levels.
Case Study Summary<br />
City Profi le<br />
Figure A7.1 Administrative Map of São Paulo<br />
ANNEX 7: SÃO PAULO CASE STUDY ■ 239<br />
São Paulo State and City of São Paulo<br />
20'00'S 20'00'S<br />
22'200'S 22'00'S<br />
24'400'S<br />
51'400'W 49'200'W 47'00'W 44'400'W<br />
Legend<br />
City of São Paulo<br />
São Paulo state<br />
Municipalities<br />
51'400'W 49'200'W 47'00'W 44'400'W<br />
Geographical cordinate system<br />
UTM south American 1969<br />
Brazil<br />
scale<br />
N<br />
N<br />
24'00'S
240 ■ CLIMATE CHANGE, DISASTER RISK, AND THE URBAN POOR<br />
Th e population growth rate in São Paulo is decreasing (in 2010 it was only<br />
0.76 percent compared to 1.16 percent in 1990). Th e diff erence between the<br />
numbers of people in the city between day and night could reach 2 million<br />
people. Nevertheless, the population rate in the periphery is increasing (growing<br />
from 4.9 million to 5.5 million from 1991 to 2000), representing 30 percent<br />
TABLE A7.1<br />
São Paulo Profi le<br />
Total city population in 2010 11.25 million (IBGE census 2010)<br />
Population growth (% annual) 0.75 (SEADE 2000/2010)<br />
Land area (km2 ) 1,523 (IBGE census 2010)<br />
Population density (per km2 ) 7,388<br />
Country’s per capita GDP (US$) 10,960 (Brazil central bank and IBGE 2010)<br />
Country’s population (%) 5.89 (IBGE Census 2010)<br />
Total number of households 3,576,864 (IBGE Census 2010)<br />
Dwelling density (SEHAB/HABISP)<br />
Slums (%) 1.6<br />
Irregular lots (%) 6.32<br />
Average household income (US$) 891.37 (IBGE Census 2008)<br />
Country’s GDP (%) 11.7 (IBGE Census 2008)<br />
Total budget (US$) 3.1 billion (city hall budget 2010)<br />
Date of last Urban Master Plan 2002<br />
Note: IBGE: Instituto Brasileiro de Geografi a e Estatística; SEHAB: Sao Paulo Municipal Housing Secretariat;<br />
SEADE: State Data Analysis System Sao Paulo; HABISP: Information and Prioritizing Intervention System<br />
Figure A7.2 Growth Rates for City of São Paulo, 1950–2010<br />
Percent<br />
6<br />
5<br />
4<br />
3<br />
2<br />
1<br />
0<br />
Source: HABISP.<br />
5.48<br />
4.91<br />
1950/1960 1960/1970<br />
3.67<br />
1.16<br />
1970/1980 1980/1991<br />
0.88 0.76<br />
1991/2000 2000/2010
ANNEX 7: SÃO PAULO CASE STUDY ■ 241<br />
Figure A7.3 São Paulo City Social Vulnerability Index, IPVS<br />
Source: HABISP.<br />
R1- No vulnerablility<br />
R2- Very low vulnerablility<br />
R3- Low vulnerability<br />
R4- Medium vulnerability<br />
R5- High vulnerability<br />
R6- Very high vulnerability<br />
of the urban expansion. Th e periphery concentrates the majority of the poorer<br />
inhabitants (the average household income is half the average for the city and<br />
the per capita household income is up to three times lower than the city rate).<br />
Life expectancy in São Paulo is 71 years. Th e mortality rate is 6.53 for each<br />
thousand and the child mortality rate is 15.83 for each thousand. Th e city has<br />
4.89 percent illiteracy among youth above 15 years old. Almost 47 percent of
242 ■ CLIMATE CHANGE, DISASTER RISK, AND THE URBAN POOR<br />
the population above 25 has less than eight years of formal education (primary<br />
education lasts nine years and secondary, three additional years). Th e population<br />
is mainly made up of people ages 25 to 59.<br />
São Paulo is located in the Atlantic Plateau, with hills between 718 and 720<br />
m above sea level. Th ere is no registered seismic activity in São Paulo. Regional<br />
hills climb from large fl oodplains through fl uvial terraces into interfl uvial<br />
areas. Figures A7.4 and A7.9, in the color section, shows the city´s declivity<br />
and main rivers.<br />
Built Environment and Basic Services<br />
Adequate water supply is provided to 98.6 percent of the houses in the city (almost<br />
65 m 3 per inhabitant/year), though the increase in the number of consumers,<br />
scarcity of new water resources, and decrease in basin water quality increases<br />
concerns about future water supply. 1<br />
Sewage collection is reported at 87.2 percent (2006). From all the domestic<br />
sewage collected, 81 percent receives proper treatment. However, slums and<br />
irregular housing lots typically have improper sanitation conditions and sewage<br />
is thrown directly into streams and rivers. Almost 48 percent of the inhabitants of<br />
the city’s water basin wetlands live in slums and irregular settlements.<br />
Solid waste is collected for 96.5 percent of the houses. In spite of that, there are<br />
irregularities in site collection and inspection (more than 300 clandestine dumps),<br />
and the city suff ers from improper waste-disposal clogging and polluting culverts<br />
and waterways: 2.6 percent of waste is deposited in containers and removed by a<br />
City Hall contractor; 0.64 percent is discarded in the land or in waterways; and<br />
another 0.16 percent is burned in yards or empty lands. City Hall data shows that, in<br />
2010, the total amount of waste generated daily by the city was 17,000 tons—10,000<br />
tons come from residential collection and almost 100 percent of the collected waste<br />
went to regulated landfi lls. Less than 1 percent of this waste was recycled. 2<br />
Th ere is enough energy supply to meet city demands (99.99 percent of the<br />
houses possess energy), according to AES Eletropaulo Metropolitana S.A. (an<br />
energy utility). It is not unusual for the city to have localized blackouts, especially<br />
during heavy rains. Electricity theft is common in poor regions of the city.<br />
Th e industrial, residential, and commercial sectors are more or less equal in their<br />
energy consumption (17 percent of the national consumption is equivalent to<br />
35.3 million megawatt/hours).<br />
Th e city’s traffi c is extremely heavy, with more than 7 million vehicles. Th e<br />
subway system (managed by the state) is connected to the rail system (also<br />
managed by the state), through a CPTM (Train Management Agency). An average<br />
of 2.1 million passengers a day are transported through 89 stations, 260.8 km,<br />
and 63.5 km of subway tracks. Approximately 15,000 buses circulate through<br />
1,335 routes and 28 terminals. Every three years it is estimated that the number<br />
of bus trips increases by 1 million (CPTM, Metro and SPTrans 2010). Th e design
ANNEX 7: SÃO PAULO CASE STUDY ■ 243<br />
Figure A7.5 Greenhouse Gas Emissions from Electric Energy Use by Sector<br />
in São Paulo<br />
11%<br />
Source: São Paulo GHG´s inventory.<br />
11%<br />
Industrial<br />
Residential<br />
28%<br />
Figure A7.6 Transport Use in São Paulo<br />
29%<br />
Subway<br />
Walking<br />
0.60%<br />
29%<br />
Source: Research Origin and Destination 2007.<br />
Train<br />
2.40%<br />
Bicycle<br />
Commercial<br />
Others<br />
9%<br />
Buses<br />
Others<br />
29%<br />
2%<br />
Cars<br />
28%
244 ■ CLIMATE CHANGE, DISASTER RISK, AND THE URBAN POOR<br />
and number of routes is considered insuffi cient to adequately serve the entire<br />
population. Th e situation is even worse for the poor, since a great number of<br />
them live in the periphery areas and work in more centralized neighborhoods<br />
where the job opportunities and wages are better. As a result, they spend hours in<br />
public transport commuting.<br />
In 2005, the city had 34 city parks (15 million m 3 ), which increased substantially<br />
in 2008 to 48 parks (24 million m 3 ) and 17 linear parks. 3 Th e SVMA plans<br />
for 100 parks by 2012 (50 million m 3 ), 20 linear parks, and 5 natural parks. São<br />
Paulo had, in 2009, only 21 percent of its original forest coverage. 4<br />
Th e “Agenda 2012” program was enacted into law in 2008 and prescribes the<br />
transparency of actions and priorities managed by the city. Each region of the city<br />
has its targets, which range among health, education, traffi c, water quality, sewage<br />
piping, quality of parks, leisure areas, safety, and transportation. 5<br />
Pillar 1—Institutional Assessment<br />
Agencies in Disaster Risk Management and Climate Change Adaptation<br />
Th e Emergency Management Agency acts on the federal, state, and municipal<br />
levels. Its goal is to plan actions to prevent and minimize eff ects of <strong>disaster</strong>s,<br />
either natural or human caused, assist people aff ected by them, and rehabilitate<br />
or recover the places destroyed by those events. In the city this responsibility<br />
rests with the City Public Safety Secretariat, through the City Emergency<br />
Management Agency (COMDEC). Nonetheless, its personnel are allocated to the<br />
31 decentralized units or “subdistricts.”<br />
Th e City Emergency Management Agency acts on prevention and recovery,<br />
assistance and aid, and on search and rescue, and is assisted by the Firefi ghter<br />
Department. At the communities located in areas of <strong>risk</strong>, there should be a<br />
Local Emergency Management Group, or NUDEC. Th ey should be made up<br />
of volunteers trained by the National Emergency Management Agency to help<br />
during emergencies and <strong>risk</strong>y situations.<br />
Th e Emergency Management Center (CGE) is responsible for observing meteorological<br />
data (there are 180 monitoring stations) and for informing COMDEC.<br />
Th en COMDEC alerts the subdistricts, which monitor the volume of rainfall<br />
using pluviometers installed at 31 points in the city.<br />
Th e Summer Rainfall Operation is a city plan that brings together the Housing,<br />
Transport, Urban Infrastructure, Social Assistance, and Subdistricts Coordination<br />
Secretariats, led by the Emergency Management Agency, and targets<br />
<strong>disaster</strong>s that occur during the summer (when heavy rainfall is common). Whenever<br />
necessary or from November through April, the city organizes initiatives to<br />
prevent <strong>disaster</strong>s or to assist in emergencies, recovering the area aft er the fl ood or<br />
landslide and providing shelter for those in need.
ANNEX 7: SÃO PAULO CASE STUDY ■ 245<br />
When a heavy rainfall approaches, CGE issues an alarm to COMDEC, as well<br />
as to the traffi c authorities (CET), the Health Secretariat (SMS), Green and Environment<br />
Secretariat (SVMA), and Housing Secretariat (SEHAB). Each subdistrict<br />
must then activate the process using the Emergency Management Agency<br />
agents allocated to the region, following a standard operational procedure. Th e<br />
initiatives include prevention (evacuating houses in at-<strong>risk</strong> areas), search and rescue<br />
of people in fl oods or landslides, and restoration of aff ected areas.<br />
Aft er the fl ood or landslide, the fi refi ghters rescue possible victims. Water<br />
and sanitation authorities fi x broken water pipes and energy agents check the<br />
electricity posts. Social assistants verify housing conditions and, if necessary, direct<br />
people to temporary shelters while SEHAB arranges for “rent allowance” or allocate<br />
housing for the needy. Th e City Health Secretariat, through its Health Vigilance<br />
Coordination (COVISA), trains its environmental agents to inform—both before<br />
and aft er the heavy rains—the vulnerable communities about endemic diseases<br />
spread by water (such as leptospirosis), their symptoms, and the need for medical<br />
treatment. Th e basic health units (UBS) receive folders and posters to distribute to<br />
the population on how to avoid leptospirosis and the proper treatment. COVISA<br />
also alerts each region of the city about its specifi c <strong>risk</strong> of leptospirosis, aiming to<br />
prepare the health professionals for the emergence and spread of the disease.<br />
Examples of Disaster-Related Program or Relevant Decrees<br />
Th e Summer Rainfall Operation is an existing plan from the city that brings<br />
together the Housing, Transport, Urban Infrastructure, Social Assistance, and Subdistricts<br />
Coordination Secretariats, led by the Emergency Management Agency.<br />
Decree 47.534/2006 reorganizes the city system of the Emergency Management<br />
Agency. Th ere are other laws at administrative levels that regulate the<br />
Emergency Management Agency and the operation procedures. 6<br />
Th ere is no information on the maintenance and testing of the procedures.<br />
From an ordinary citizen’s point of view, those alarms are neither timely nor<br />
effi cient, since they require constant monitoring through the CGE´s website. In<br />
at-<strong>risk</strong> areas, this is even less likely to occur, since the rate of viewing the Internet<br />
in general in the city in 2003 was 25 percent. Th ere is no data available on<br />
expenditures on <strong>disaster</strong> <strong>risk</strong> management or adaptation programs.<br />
Shortcomings in Disaster Risk Management and Climate Change Adaptation<br />
Management<br />
Th e interviews and research indicate that the Emergency Management Agency<br />
has a shortage of agents in the at-<strong>risk</strong> communities, for distributing and teaching<br />
the use of the plastic pluviometers (PET) and water-level rulers. CGE also<br />
needs resources to train emergency management local agents about informing<br />
the population of the <strong>risk</strong>s of heavy rain. Th e Health Secretariat has a shortage
246 ■ CLIMATE CHANGE, DISASTER RISK, AND THE URBAN POOR<br />
of medical personnel and adequate facilities to assist citizens with lepstospirosis<br />
or <strong>climate</strong>-related diseases. A direct and effi cient channel with the community in<br />
at-<strong>risk</strong> areas must be created to alert people in emergencies. Th e same needs to<br />
be done for the general population. Overall, prevention measures in at-<strong>risk</strong> communities<br />
should be strengthened.<br />
Estimated Levels of Spending on Pro-Poor Services and Infrastructure<br />
Th e City Emergency Management Agency works on <strong>disaster</strong> management activities.<br />
Interviewees noted that the agency lacks resources to carry out its projects,<br />
develop new initiatives, train and support communities based on units or<br />
groups, properly service the population in emergencies, and develop means of<br />
preventive maintenance.<br />
At the beginning of 2011, the mayor of São Paulo and the governor of São<br />
Paulo jointly launched a US$5 million initiative to fi ght fl oods in the city. It<br />
included cleaning the Tietê River; acquisition of pumps to move water from<br />
the Pinheiros River to the Billings water reservoir; a system of underground<br />
channels to dredge the Tietê River; and the creation of the Varzeas Tietê River<br />
Linear Park (with plans to remove 5,000 families that should not be living at<br />
the edges of the river).<br />
Pillar 2—Hazards Assessment<br />
Past Natural Disasters<br />
Th ere is no publicly available systematization of <strong>climate</strong> hazards or measurement<br />
of potential impacts and losses. Th is is a substantial gap in information that the<br />
city needs to address.<br />
A prominent city newspaper provides information on recent rainfall events:<br />
• November 2009–March2010. Heavy rainfall accounted for 78 deaths and<br />
20.000 homeless. Jardim Romano (a poor neighborhood) was fl ooded for<br />
more than two months.<br />
• October 2009. Tietê and Pinheiros´s rivers overfl owed and there were 86<br />
fl ooding points in the city.<br />
• February 2008. In the neighborhood of Mooca in the east of the city, the water<br />
height reached 2 meters. Firefi ghters were called 53 times to rescue stranded<br />
people. Train passengers were trapped in the railway cars for more than six<br />
hours (due to lack of power caused by the rain).<br />
• November 2006. Th e city experienced 230 fl ooding points (doubling the<br />
number for the same month the previous year).<br />
• May 2004. Th e heaviest rainfall in years (140 mm in a single day) caused<br />
120 fl ooding points in the city; small rivers fl ooded. One person disappeared<br />
in a fl ooded area.
ANNEX 7: SÃO PAULO CASE STUDY ■ 247<br />
TABLE A7.2<br />
Institutional Mapping of Disaster Risk Management Functions<br />
Risk assessment<br />
Technical (planning,<br />
management,<br />
maintenance)<br />
Civil defense Civil defense<br />
Agents and NUDECs<br />
TABLE A7.3<br />
Natural Hazards<br />
Risk reduction<br />
Early-warning<br />
and response<br />
CGE<br />
18 meteorological<br />
stations<br />
Yes/No<br />
Public<br />
awareness<br />
CGE<br />
Website<br />
Date of last<br />
major event<br />
Earthquake N N/A<br />
Wind storm N N/A<br />
River fl ow Y 2009<br />
Floods, inundations, and waterlogs Y 2011<br />
Tsunami N N/A<br />
Drought N N/A<br />
Volcano N N/A<br />
Landslide Y 2011<br />
Storm surge Y 2010<br />
Extreme temperature N/A N/A<br />
TABLE A7.4<br />
Hazards, Effects, and Losses<br />
Hazards Effects Losses<br />
Heavy rainfall—more than<br />
30 mm/day<br />
Extreme heavy rain—more<br />
than 100 mm/day<br />
Landslides<br />
Floods<br />
Stream overfl ow<br />
River overfl ow<br />
Leptospirosis and watertransmitted<br />
diseases<br />
Landslides<br />
Floods<br />
Stream overfl ow<br />
River overfl ow<br />
Leptospirosis and watertransmitted<br />
diseases<br />
Air dryness Health problems (mainly<br />
respiratory)<br />
Source: Institute of Research and Technology 2009.<br />
Lives<br />
Houses and material, resident<br />
property, cars<br />
Health conditions<br />
Lives<br />
Houses and material, resident<br />
property, cars Health conditions<br />
Health conditions
248 ■ CLIMATE CHANGE, DISASTER RISK, AND THE URBAN POOR<br />
Main Climate Hazards<br />
According to the Institute of Research and Technology (Instituto Nacional de<br />
Pesquisas Espaciais, or INPE 2009), São Paulo is composed of a variety of surfaces<br />
with diff erent temperatures, forming a mosaic of urban <strong>climate</strong>. Th ere are<br />
heat islands, thermal inversion areas, pollution bubbles, and local diff erences in<br />
the wind patterns. Th erefore, it is impossible to plan a single initiative or defi ne<br />
Figure A7.7 Days with Intense Rainfall per Decade<br />
140<br />
120<br />
100<br />
80<br />
60<br />
40<br />
20<br />
0<br />
Decade<br />
1930<br />
Decade<br />
1940<br />
Decade<br />
1950<br />
Decade<br />
1960<br />
Decade<br />
1970<br />
Decade<br />
1980<br />
Decade<br />
1990<br />
Decade<br />
2000<br />
30 mm/day 50 mm/day 100 mm/day 100 mm2/days<br />
Source: IAG/USP, Analysis by INPE 2010.<br />
Figure A7.8 Number of Flooding Points Registered by CGE in São Paulo<br />
per Year, 2004–2011<br />
1600<br />
1400<br />
1200<br />
1000<br />
800<br />
600<br />
400<br />
200<br />
0<br />
2004<br />
2005 2006 2007 2008 2009 2010 2011<br />
Source: CGE and Mauricio Maia blog, 2011, http://alagamentos.topical.com.br/pontos.
ANNEX 7: SÃO PAULO CASE STUDY ■ 249<br />
a precise quantity of rain or degree of heat that could cause tragedies. Each area<br />
has its specifi c soil, drainage, occupation, and permeability conditions and, as a<br />
result, a diff erent threshold to be met.<br />
Th at said, INPE produced table A7.5, which shows the amount of heavy rainfall<br />
in São Paulo per decade, from 1933 to 2000, indicating an increase in the<br />
number of days of heavy rainfall—with more than 100 mm of precipitation in<br />
just one or two days.<br />
INPE confi rms that rainfall above 10 mm per day is considered heavy, but is<br />
not potentially dangerous. More than 30 mm per day of rainfall can cause serious<br />
fl oods, and more than 50 mm can be even <strong>risk</strong>ier for the city (before the 1950s,<br />
rainfall above to 50 mm per day was nonexistent, but currently this occurs two to<br />
fi ve times every year).<br />
Summary of Climate Projections from the Regional Eta-CPTEC (Centro de<br />
Previsão de Tempo e Estudos Climáticos) Model for São Paulo<br />
For INPE, the main <strong>climate</strong> <strong>risk</strong> scenarios for São Paulo are:<br />
• Floods—Th is <strong>risk</strong> scenario is characterized by the overfl ow of river water onto<br />
the adjacent lowlands, when the plains along the main watercourses of the<br />
Alto Tietê Basin become fl ooded. Despite investments to increase fl ow capacity<br />
of the main waterways, fl oods continue to occur due to urban growth and<br />
the natural dynamics of fl oods and existing interventions in waterways.<br />
• Heavy fl oods—Rugged conditions allow for heavy fl oods, that is, high water<br />
volume and speed. Flooding of this nature may destroy buildings and other<br />
urban infrastructure, cause other material damage, and endanger the lives of<br />
residents living near rivers.<br />
• Flash fl oods, with high potential for drag—Public policies for channeling<br />
streams and constructing roads in valleys cause fl ash fl ooding along the streets,<br />
where surface water concentrates (which also occurs in suburban areas, without<br />
paving). Th is process is characterized by the power of accumulated surface<br />
water and the high destructive power of drag. Th ese conditions expose<br />
people and housing to high <strong>risk</strong>. Th e greatest probability of loss of life is found<br />
in the periphery regions, and loss of goods in consolidated central neighborhoods.<br />
Rainwater runoff concentrated along watercourses or on public roads is<br />
responsible for most deaths in fl oods, when people are dragged by the water.<br />
• Occasional fl ooding—Occasional fl ooding (accumulations of shallow water<br />
that rarely penetrate the interior of the buildings and aff ect most public<br />
roads) occur widely in various parts of the city, primarily because of defi -<br />
ciencies in the drainage system. Occasional fl oods are temporary inconveniences<br />
for pedestrians and vehicles.<br />
• Trash thrown into water courses—Some 6,000 households throw waste<br />
directly into waterways in the metropolitan region of São Paulo. Th e garbage
TABLE A7.5<br />
Climate Projection for Metropolitan São Paulo<br />
Present<br />
observed<br />
Present<br />
simulated 2030–2040 Conf. 2050–2060 Conf. 2080–2090 Conf.<br />
Temperature High High High<br />
Warm nights High High High<br />
Cold nights High High High<br />
Warm days High High High<br />
Cold days Average High High<br />
Heat waves Unobserved Average Average High<br />
Total rain High High High<br />
Intense precipitation Average Average High<br />
Precipitation > 95th Average Average High<br />
Precipitation days > 10 mm Average Average High<br />
Precipitation days > 20 mm Average Average Average<br />
Consecutives dry days Average Average High<br />
Increase Decrease Source: INPE/CEPTEC.<br />
250 ■ CLIMATE CHANGE, DISASTER RISK, AND THE URBAN POOR
ANNEX 7: SÃO PAULO CASE STUDY ■ 251<br />
contributes to siltation and clogging of these waterways, and can be carried<br />
by runoff , captured by the river, and taken to lower slopes, where the waste is<br />
deposited. Th e detention reservoirs of Tietê River are located in these lower<br />
slopes and can be damaged by the debris.<br />
• Landslides on slopes—Th e slope regions are generally subject to informal<br />
settlements and prone to landslides, which can cause serious accidents and<br />
deaths of residents.<br />
• More severe rainfall—Th ere is a clear correlation between more severe rainfall<br />
(greater than 100 mm) and more rugged terrains. Th e <strong>climate</strong> analysis<br />
by INPE indicates that severe rainfall will occur more in areas of the city<br />
that are at <strong>risk</strong> of landslides and fl ooding, increasing the vulnerability of the<br />
inhabitants.<br />
Exposure to Hazards<br />
Th e Technological Research Institute (Instituto de Pesquisas Tecnológicas,<br />
or IPT) was commissioned by the city to map the geotechnical hazardous<br />
areas in São Paulo in order to identify sector vulnerabilities to landslides and<br />
stream washouts in areas of precarious urban settlements. In this study, a<br />
hazardous area is defi ned as one likely to be hit by natural or human-induced<br />
conditions that cause adverse eff ects. People living in such zones are exposed<br />
to physical harm and are prone to material losses. Typically, in Brazilian cities,<br />
these areas correspond to low-income housing units (precarious informal<br />
settlements).<br />
Th e factors found essential for analyzing hazards include the type of process<br />
expected, the likelihood of the process occurring, the vulnerability of the urban<br />
settlements, and the potential for damage.<br />
Th e analysis included morphological and morphometric features of the terrain;<br />
geological materials and profi le of the alteration; geological structures; evidence<br />
of geological movements; ground coverage; and conditions associated with<br />
wastewater, rainwater, and subsurface water. As a result, a hazard zone for landslides<br />
and stream washouts has been defi ned for vulnerable urban settlements.<br />
Th e methodology used to map the zone included the following activities:<br />
• Oblique low-height helicopter aerial photography.<br />
• Field work to examine the features and limits of hazardous terrains in previously<br />
identifi ed hazards zones.<br />
• Assessment of the likelihood of destructive processes.<br />
• Assessment of potential consequences due to dwelling vulnerability.<br />
• Estimate of hazard level per sector.<br />
• Recommendations for hazard-control initiatives.<br />
• Data input into a geo-referenced database, integrated with the Housing Secretariat’s<br />
(SEHAB) HABISP System.
252 ■ CLIMATE CHANGE, DISASTER RISK, AND THE URBAN POOR<br />
Table A7.6<br />
Incidence of Hazardous Areas in Informal Settlements in São Paulo<br />
Urbanized centers Settlements/allotments Slums<br />
Landslide <strong>risk</strong> (%) (IPT 2010) 10.43 3.90 14.79<br />
Washout <strong>risk</strong> (%) (IPT 2010) 2.44 0.68 5.38<br />
Source: HABISP–SEHAB; IPT 2010.<br />
Displayed below are the hazardous areas mapped in the informal, vulnerable<br />
settlements. Slums have the highest rate of landslides and washouts. About<br />
20 percent of the land where slums are settled is subject to geotechnical hazards.<br />
Slums in São Paulo represent roughly 76,000 households exposed to hazards.<br />
Th ere are 407 highly hazardous areas located in 26 subdistricts.<br />
Figure A7.9, in the color section, shows geotechnical hazard areas overlapping<br />
data on steepness. As expected, critical areas are closely associated with high<br />
steepness. Such areas are more likely in the peripheral zone of the city (northern,<br />
eastern, and southern suburbs). Th e most critical areas are precisely where the<br />
most precarious settlements are located. Lack of access to a formal land market by<br />
the poorest families generates the conditions for these combined factors of social<br />
and environmental vulnerability.<br />
In addition to identifying hazardous areas, the IPT also ranked them in four<br />
levels of criticality. A qualitative hazard analysis has been made on the data<br />
obtained from fi eld observation, integrating the analysis parameters into a hazard<br />
assessment record card, with the support of aerial imagery. Th e degrees of hazard<br />
are displayed in table A7.7.<br />
A cross analysis of hazardous areas ranked by their critical level and informal<br />
settlements, as shown in table A7.8, concludes that slums face the most<br />
hazardous conditions. In total, more than 5 percent of slum areas are highly or<br />
very highly exposed; these areas are highly vulnerable to destructive events in<br />
the next 12 months.<br />
Th is conclusion stresses the urgency of taking preventative measures. Furthermore,<br />
such hazards can be leveraged by prospective <strong>climate</strong> conditions, potentially<br />
increasing the degree of hazard level in areas currently ranked as low or<br />
medium <strong>risk</strong>.<br />
It is worth stressing that IPT’s map does not take into account fl oods and<br />
water logging. While fl oods are not as lethal as mudslides and landslides, they<br />
represent the most frequent hazards to which the population is exposed. Th ese<br />
events result in great material damage and may have secondary eff ects on health<br />
by increasing the likelihood of spreading waterborne diseases such as leptospirosis.<br />
People living near streams or rivers—especially children and the elderly,
TABLE A7.7<br />
Degrees of Landslide Hazard<br />
ANNEX 7: SÃO PAULO CASE STUDY ■ 253<br />
Class of hazard Description of hazard<br />
R1—low Potentially low degree of geological and geotechnical predisposing<br />
factors (steepness, type of terrain, etc.) and of intervention<br />
in the sector for developing landslides and washouts. There<br />
is no evidence of instability in slopes and drainage banks. It is<br />
the least critical condition. If the status remains un<strong>change</strong>d, no<br />
destructive events are expected over one year.<br />
R2—medium Potentially medium degree of geological and geotechnical predisposing<br />
factors (steepness, type of terrain, etc.) and of<br />
intervention in the sector for developing landslides and washouts.<br />
There is some evidence of instability (yet incipient) in<br />
slopes and drainage banks. If the status remains un<strong>change</strong>d,<br />
there is little probability of destructive events during long, strong<br />
episodes of rain over one year.<br />
R3—high Potentially high degree of geological and geotechnical predisposing<br />
factors (steepness, type of terrain, etc.) and of intervention<br />
in the sector for developing landslides and washouts.<br />
There is signifi cant evidence of instability (ground cracks, sag of<br />
embankments, etc.). If the status remains un<strong>change</strong>d, destructive<br />
events may be expected during long, strong episodes of<br />
rain over one year.<br />
R4—very high Potentially very high degree of geological and geotechnical<br />
predisposing factors (steepness, type of terrain, etc.) and of intervention<br />
in the sector for developing landslides and washouts.<br />
There is strong evidence of instability, supported by numerous<br />
accounts of hazardous conditions (ground cracks, sag of embankments,<br />
, walls cracking in houses or retaining walls, tilted<br />
trees or poles, slide scars, erosion features, dwellings built near<br />
stream banks, etc.). It is the most critical condition. If the status<br />
remains un<strong>change</strong>d, destructive events are highly probable during<br />
long, strong episodes of rain over one year.<br />
TABLE A7.8<br />
Cross-Referencing Data: Areas Ranked by Their Critical Level and Types<br />
of Settlements in São Paulo<br />
Low hazard<br />
Medium<br />
hazard High hazard<br />
Very high<br />
hazard<br />
Slums (%) 2.92 11.90 4.11 1.40<br />
Settlements/allotments (%) 0.65 2.93 0.97 0.43<br />
Urbanized centers (%) 4.59 7.62 0.56 0.09<br />
Source: HABISP–SEHAB; IPT 2010.
254 ■ CLIMATE CHANGE, DISASTER RISK, AND THE URBAN POOR<br />
TABLE A7.9<br />
Social Assessment<br />
City population below poverty line (%) 5.6 in 2000. Atlas DH<br />
Social inequality (Gini index) in 2002 (UN-Habitat) 0.543 metropolitan area (PNAD<br />
2006)<br />
Unemployment (%) 12.3 in 2009 (SEADE)<br />
Areal size of informal settlements (% of city area) 7.92 in 2010 (HABISP)<br />
City population living in slums (%) 0.48<br />
Households without registered legal titles (%) 7.9<br />
Children completing primary and secondary education: Abandon rate for primary, 1.3;<br />
survival rate (%)<br />
and for secondary, 5.4<br />
Human Development Index (2009) 0.841 in 2000 (IBGE)<br />
Predominant housing material Brick<br />
who are the most vulnerable—are also exposed to direct <strong>risk</strong>s such as drowning<br />
and physical injury in highly destructive landslides.<br />
Pillar 3—Socioeconomic Assessment<br />
Population Exposure to Hazards<br />
Th e most signifi cant <strong>climate</strong> hazards for São Paulo are fl oods and<br />
landslides. Flooding points have not been fully mapped by the city, only<br />
fl oodable points on streets; these are related to traffi c problems, as shown<br />
in fi gure A7.10.<br />
When dealing with landslides, the city commissioned IPT to map and<br />
rank the critical spots. A qualitative hazard analysis has been made on the<br />
data obtained from fi eld observation, integrating the analysis parameters into<br />
a hazard-assessment report card, with the support of aerial imagery.<br />
A map overlapping social vulnerability (mapped through the IPVS index) and<br />
<strong>climate</strong> vulnerability (using IPT and INPE data) was produced.<br />
Th e following layers were included in the database to produce the map:<br />
• Informal/precarious settlements in São Paulo (2010): Obtained from HABISP-<br />
SEHAB (Housing Secretariat) containing the offi cial demarcation of each<br />
settlement organized by slums, urbanized slums, and informal settlements.<br />
Information about the quantity of houses, infrastructure, and average income<br />
level available.<br />
• Geotechnical <strong>risk</strong> areas (2010): Obtained from HABISP-SEHAB, a study<br />
from the Technological Research Institute (IPT) from the state of São Paulo,<br />
the data consists of the areas mapped by the IPT using in-place verifi cation,
Figure A7.10 Main Flooding Points of Streets<br />
Source: SVMA, Environmental Atlas, 2000.<br />
ANNEX 7: SÃO PAULO CASE STUDY ■ 255<br />
City of São Paulo<br />
Drainage<br />
2000<br />
City limits<br />
Metropolitan region<br />
State of São Paulo<br />
Flood plains<br />
Crystalline complex<br />
Tertiary sediment<br />
Hydrography, dams and coastal<br />
Lakes, reservoirs<br />
Overflow points, 1990<br />
Overflow points, 2000<br />
Main road system
256 ■ CLIMATE CHANGE, DISASTER RISK, AND THE URBAN POOR<br />
which presents geotechnical <strong>risk</strong> for landslides and undermining among water<br />
streams. Th e areas were characterized by four degrees of hazard level, varying<br />
from low <strong>risk</strong> to very high <strong>risk</strong>.<br />
• Geotechnical chart (1999): Th is chart was elaborated in analogical format and<br />
contains the main geomorphologic areas of the city (see fi gure A7.9 in the<br />
color section). Th e Planning Secretariat digitalized the map and the data could<br />
be integrated in the geo-referenced dataset.<br />
• Index of social vulnerability (IPVS), per the census (2000). São Paulo State was<br />
divided into six groups of social vulnerability. Based on multivariate statistical<br />
analysis, the IPVS uses the data from the last population census, conducted in<br />
2000. Th e calculation of the IPVS uses two types of information: demographic<br />
characteristics and socioeconomic condition of the families;<br />
• Declivity map: Based on the topographic chart of the city developed by<br />
EMPLASA (Empresa Paulista de Planejamento Metropolitano), the declivity<br />
map is a raster dataset containing classes of declivity for each pixel. Th is dataset<br />
reveals the topography of the city, indicating those areas with high declivity<br />
and thus more inclined to landslides (see fi gure A7.4 in the color section).<br />
• Transportation infrastructure and public infrastructure: Th is data contains<br />
the localization of the public infrastructure of the city, such as schools<br />
and health clinics. Obtained from the HABISP-SEHAB and SEMPLA (São<br />
Paulo Secretaria Municipal de Planejamento), this dataset was used to infer<br />
the existence of public infrastructure under geotechnical <strong>risk</strong> as well as analyze<br />
the proximity of this equipment to the vulnerable areas.<br />
• HAND model: Th is dataset, produced by the National Spatial Research Institute,<br />
supports the work on Brazilian megacities and <strong>climate</strong>-<strong>change</strong> vulnerabilities.<br />
Th e data was calculated from the topographic chart of the city using<br />
spatial analysis. Based on a raster representation obtained from the declivity<br />
map, the dataset informs those areas with highest vulnerability to landslides<br />
and fl oods.<br />
• Water reservoir locations (piscinões, or big pools): Th is data, collected from<br />
SEMPLA, corresponds to the locations of the 16 water reservoirs constructed<br />
in the city to control fl oods.<br />
• Hydrograph and drainage system: Th is system corresponds to the watercourses<br />
of the city and the natural drainage system.<br />
• Flooding: Th is layer—mapped by the Traffi c Engineering Company (CET),<br />
which is responsible for traffi c control in the city—contains the points where<br />
fl oods occurred.<br />
Th e analytical approach used for the mapping task was based on spatial<br />
analysis techniques in the Geographical Information System (GIS). All the layers<br />
were compiled in an integrated geo-referenced database. Th e calculations
ANNEX 7: SÃO PAULO CASE STUDY ■ 257<br />
were based on overlays applied over the reference layers of informal settlements,<br />
slums, and urbanized slums. It was then possible to calculate the relative<br />
incidence in terms of area of geotechnical <strong>risk</strong> of fl ooding. It was also possible<br />
to calculate the relative incidence of the Social Vulnerability Index in each of<br />
the reference layers.<br />
Calculating both incidences, social vulnerability and geotechnical <strong>risk</strong>, led to<br />
comparisons between all the informal, precarious settlements in the city. Th e<br />
results of the geographical analysis operation were tabulated and organized by<br />
themes of vulnerability and hazards. Th e most vulnerable settlements were those<br />
that present the higher percentage of areas within highest geotechnical <strong>risk</strong> and<br />
social vulnerability. Finally, thematic maps were generated showing the layers<br />
included in the database, allowing visualization of the critical areas all over<br />
the city.<br />
Location of the Urban Poor<br />
Most precarious settlements are located in more peripheral areas of the city. Such<br />
areas concentrate environmentally vulnerable situations and are the most poorly<br />
served by basic services and urban infrastructure. Th e analysis indicates that<br />
there is a strong overlap between the locations of high-<strong>risk</strong> areas and the informal<br />
settlements throughout the city. Shown in fi gure A7.11 is the location of precarious<br />
housing (slums, irregular lots, and urbanized slums).<br />
Slum Characteristics<br />
Th e distribution of the census in the city by groups of social vulnerability clearly<br />
discloses the socioeconomic macro-segregation pattern that places the central<br />
area. In particular, the distribution shows the southwest quarter of the city as the<br />
region with the lowest levels of social vulnerability, as opposed to the peripheral<br />
zone, where the highest levels of social vulnerability are recorded. Th ese more<br />
critical situations can be found in the southern, northern, and eastern periphery<br />
of the city. Not by accident, most of São Paulo’s precarious settlements are set up<br />
in these peripheral areas.<br />
According to the city, in 2010 approximately 890,000 precarious dwellings<br />
were in the city. Over 85 percent of these households are located in slums<br />
and irregular settlements, spread across all regions of the city. Displayed in<br />
table A7.10 is the distribution of households per type and location in the large<br />
administrative regions of the city.<br />
Slums record the highest proportion of children and youth up to 19 years old<br />
(41.7 percent), which is consistent with the presence of younger heads for households<br />
and a greater number of children. As for household income, most families<br />
earn less than three times the minimum wage. 7 Although many of the heads of
258 ■ CLIMATE CHANGE, DISASTER RISK, AND THE URBAN POOR<br />
Figure A7.11 Spatial Distribution of Precarious Settlements in City<br />
Source: HABISP 2010.<br />
Legend<br />
Rivers<br />
Informal settlements<br />
Slums<br />
Wellsprings<br />
Preservation areas<br />
household are employed in the formal labor market, low levels of education hinder<br />
access to better work opportunities. About two-thirds of the heads of household<br />
have not completed primary education (SEADE Foundation 2008).<br />
Th ese areas still lack access to urban infrastructure and services supply, as<br />
shown in table A7.11. Th ere are signifi cant defi cits in public lighting, paving,
ANNEX 7: SÃO PAULO CASE STUDY ■ 259<br />
TABLE A7.10<br />
Houses by Type of Precarious Settlements and Administrative Regions of<br />
City Housing Secretariat<br />
Wellsprings1 North1 South1 Southeast1 East1 Center1 Diffuse2 Total<br />
Slum1<br />
Informal<br />
settlement<br />
54,886 65,696 117,793 64,980 67,072 10,724 0 381,151<br />
(1)<br />
Urbanized<br />
100,031 60,769 44,953 22,739 154,552 0 0 383,044<br />
center (1)<br />
Tenement<br />
(cortiços)<br />
11,193 1,973 1,051 2,640 262 0 24,522<br />
(2) (3)<br />
Irregular<br />
housing<br />
complex<br />
11,086 69,303 80,389<br />
(1) 669 7,403 4,657 2,533 3,056 1,659 0 20,702<br />
Total 166,779 141,996 169,376 91,303 227,320 23,731 69,303 889,808<br />
Source: (1) HABISP, February 2010; (2) obtained from SEADE Foundation survey; (3) the total amount of<br />
tenement houses is an estimation by the SEADE Foundation.<br />
TABLE A7.11<br />
Access to Urban Services and Infrastructure in Precarious Settlements in<br />
São Paulo<br />
Urban Infrastructure Waste Collection Sanitation<br />
Access<br />
to public<br />
lighting Paving<br />
Walkways<br />
and<br />
culverts<br />
Door-todoor<br />
collection<br />
Curb<br />
container<br />
collection Other<br />
No<br />
access<br />
With<br />
access<br />
Households<br />
in slums (%)<br />
Households<br />
in residence<br />
68.30 67.10 55.70 64.90 20.70 14.40 52.30 47.70<br />
centers (%)<br />
Households<br />
in allotments<br />
86.30 91.10 80.80 67.90 13.50 18.60 8.20 91.80<br />
(%) 92.30 81.50 81.20 91.50 3.40 5.10 20.20 79.80<br />
Total (%) 81.90 75.70 70.40 79.50 11.10 9.50 33.30 66.70<br />
Source: Fundação Seade; Secretaria Municipal de Habitação, SEHAB; Pesquisa Socioeconômica em<br />
Favelas e Loteamentos no Município de São Paulo, 2007.<br />
and urban drainage in slums, urbanized centers, and allotments. Waste disposal<br />
and collection are not available to all households, oft en because collecting<br />
vehicles have no space to circulate. Th e most critical problem, however,<br />
concerns the sanitation network. Th e severity of this situation is mostly evident<br />
within the slums, where more than half of the households have no access
260 ■ CLIMATE CHANGE, DISASTER RISK, AND THE URBAN POOR<br />
TABLE A7.12<br />
Number of Precarious Inhabitants per Level of Poverty<br />
Poverty<br />
Indigent Poor<br />
Families in slums (%) 31.90 66.60 98.50<br />
Families in residence centers (%) 33.60 66.40 100.00<br />
Families in settlements (%) 26.10 53.30 79.40<br />
Total (%) 28.90 59.40 88.30<br />
Source: SEADE Foundation; SEHAB/HABISP (São Paulo City Housing Information System) São Paulo<br />
Slum and Allotments Socioeconomic Research, 2007.<br />
to sewerage facilities, thus greatly exacerbating environmental problems and<br />
exposing inhabitants to disease and health hazards.<br />
A poverty ranking based on the <strong>World</strong> Bank’s poverty threshold criteria<br />
reveals the gravity of the situation for the families living in those settlements, as<br />
shown in table A7.12. 8 In the slums and urbanized centers, virtually all families<br />
live in poverty or extreme poverty. Th ere is a slight improvement in housing settlements<br />
with regard to this indicator; yet about 80 percent of the families in that<br />
setting live in poverty or extreme poverty. Th is fi nding reinforces the importance<br />
of public services supply and policies for those whose ability to fulfi ll basic needs<br />
is extremely low, exposing them to even more critical levels of social vulnerability.<br />
Th e situations of social vulnerability disclosed by the data are oft en associated<br />
with exposure to geotechnical and fl ooding resulting from occupying land<br />
unsuitable for housing. Moreover, in most cases the dwellings are self-built over<br />
long periods. Th us, low technical quality of dwellings associated with occupying<br />
areas unsuitable for housing brings about hazards, oft en involving imminent <strong>risk</strong>.<br />
Characteristic of these areas are steep slopes and unstable land and fl ood zones<br />
during rainfall periods.<br />
Climate Smart Practices<br />
Th e Várzeas do Tietê Park, a project of the state government, in partnership with<br />
São Paulo, will be 75 km, the largest linear park in the world. Th ere are about<br />
7,000 households that will have to be removed. Th e resettlement will be done<br />
in the same region, with the construction of new housing units in a partnership<br />
between the City Housing Secretariat (SEHAB), Housing and Urban Development<br />
Agency (CDHU), and Metropolitan Housing Company of São Paulo<br />
(COHAB). Th e park will cover São Paulo and seven other cities, benefi ting an<br />
estimated 2 million people. In addition to the 7,000 households removed in São<br />
Paulo, 2,000 more will be removed in other cities. Th e Várzeas do Tietê Park will<br />
have a total area of approximately 10,000 hectares, with signifi cant environmental
ANNEX 7: SÃO PAULO CASE STUDY ■ 261<br />
gains, because it is considered essential for preserving the river and sanitizing<br />
the areas that aff ect the margins. Th e project should be completed in 2016. Th e<br />
project will restore and preserve the environmental function of wetlands, provide<br />
fl ood control, and create options for leisure, tourism, and culture. In the<br />
project, Via Parque will be built, a track with a 23 km extension with car and<br />
bike paths and a lot of space for walking. Th e Tietê River, including its tributaries,<br />
lakes, and ponds, will be restored, as well as riparian and native vegetation.<br />
Special areas for leisure, courts, arenas, cafeterias, and administrative spaces<br />
will also be built.<br />
Key Lessons in Addressing Poverty in a Climate-Smart Way<br />
Th e study points to recommended actions, which are listed below:<br />
• Allocate personnel from the Emergency Management Agency to each vulnerable<br />
community, working as the Local Emergency Management Group,<br />
or NUDEC. Th e personnel should be made up of volunteers, trained by the<br />
National Emergency Management Agency, to help in emergencies and <strong>risk</strong>y<br />
situations. Th is would allow preparation for emergencies and quicker and<br />
more eff ective response. Th e same would apply to health agents.<br />
• Extend mapping and systematization of the city’s entire fl ooding areas—<br />
including all housing regions—and use this data to prioritize initiatives.<br />
• Improve measures to enable public transportation and the use of cleaner fuels.<br />
• Implement an emergency transport plan for heavy rainfall, using buses with<br />
bi-articulated engines and special corridors for those vehicles to transit.<br />
• Implement an effi cient alert system for the entire population when there is<br />
heavy rainfall, with all government entities working rapidly with a direct<br />
channel of communication to the communities in the areas impacted by the<br />
heavy rain.<br />
• Extend studies to analyze and enable <strong>change</strong> in the city’s growth pattern and<br />
land-use patterns to concentrate housing and job opportunities in specifi<br />
ed regions. Providing adequate facilities, such as hospitals, schools, places<br />
for leisure and sports, and other facilities, would avoid long daily commutes<br />
and decrease the traffi c and greenhouse gas emissions (such as São Francisco<br />
Global, described in “Opportunities”). Another approach is to promote the<br />
occupation of other degraded places downtown (such as Nova Luz), which<br />
already have infrastructure but which are undervalued and contain dilapidated<br />
buildings.<br />
• Promote an integrated policy to manage waste issues in the city. Not only<br />
should the policy take care of public cleaning, but also deal with waste reduction,<br />
inform the population about sustainable consumption, and enable recycling.
262 ■ CLIMATE CHANGE, DISASTER RISK, AND THE URBAN POOR<br />
• Extend measures for supervision and adequate disposal of waste, as well as<br />
improve the periods between cleanings of streets and culverts.<br />
• Extend enforcement of the Municipal Climate Law obligating buildings with<br />
high concentrations or circulation of people (such as malls, large residential<br />
condos, or commercial buildings) to install recycling centers.<br />
• Extend procedures related to environmental inspection, and epidemiological<br />
and entomological control in selected locations, aiming at the quick<br />
discovery of biological eff ects caused by <strong>climate</strong> <strong>change</strong> and potential treatments.<br />
• Extend initiatives to restore all permanent conservation areas, especially those<br />
located in fl oodplains, in order to avoid or minimize <strong>risk</strong>s caused by extreme<br />
<strong>climate</strong>.<br />
• Extend the law that obligates new corporate projects to maintain a permeable<br />
area in order to absorb water.<br />
• Extend energy-effi ciency measures throughout the city.<br />
• Find funding for public projects and NGO <strong>climate</strong> safety activities.<br />
• Extend awareness of the Municipal Climate Law to public agents, that is, the<br />
law must become part of the daily routine of planning and executing policies<br />
in all related government agencies.<br />
• Integrate and extend <strong>climate</strong> <strong>change</strong> policy, bringing together several organizations<br />
and public players. Th e Climate Change Economy Committee begins<br />
this movement, but its role needs to be reinforced.<br />
• Promote increased citizen participation and planning on <strong>climate</strong> initiatives,<br />
including organized demands for new policies. In order to do that, society<br />
needs to be informed about the issue and their role in it.<br />
• Th e <strong>climate</strong> policies must be incorporated into the city’s management. Th e<br />
policies should be implemented regardless of <strong>change</strong>s in mayors in a new election<br />
or a <strong>change</strong> of secretary in the middle of the term.<br />
Constraints Identifi ed by the Consulted Communities<br />
• Lack of an effi cient public transport system, which would improve accessibility<br />
to other parts of the city and reduce walking distances.<br />
• Lack of quality and coverage of piped water and a sewer system, which currently<br />
could rupture during heavy rainfall and infi ltrate houses and reach rivers<br />
and streams.<br />
• Lack of means to prevent electricity theft through makeshift connections,<br />
resulting in a high cost of energy and posing a <strong>risk</strong> during heavy rain.<br />
• Lack of channeled streams, which could prevent the death of people who may<br />
fall during heavy rains.<br />
• Lack of retaining walls on hillsides at <strong>risk</strong>.
ANNEX 7: SÃO PAULO CASE STUDY ■ 263<br />
• Lack of quality of garbage collection and inspection of illegal dumps.<br />
• Lack of adequate cleaning of streams and culverts.<br />
Opportunities<br />
Th e City Housing Secretariat—SEHAB—provides the Housing Information<br />
System—HABISP:<br />
Th is information provides a comprehensive overview and update of planning<br />
and environmental conditions in the settlements of the city. Th e information<br />
allows people to defi ne priorities for intervention, as well as assist<br />
in developing city policies and integrated plans with other agencies. Th ese<br />
include: SABESP, São Paulo State Sanitation Utility; SVMA, City Green and<br />
Environment Secretariat; SME, City Education Secretariat; CDHU, Housing<br />
and Urban Development Agency; and Caixa Econômica Federal (the Federal<br />
Bank). Th e HABISP information system is a tool that is easy to use, as well as<br />
being interactive and readily accessible via the Internet (www.habisp.inf.br).<br />
HABISP promotes increased citizen participation—it provides an opportunity<br />
for data disclosure and is an important resource for the population, providing<br />
information about policies and plans under development.<br />
Opportunities to promote adaptation strategies:<br />
Existence of a comprehensive legal framework: Th e legal framework for<br />
the city to deal with the impact of <strong>climate</strong> <strong>change</strong> already exists. Th e Municipal<br />
Climate Law sets the foundation for the necessary measures related to energy,<br />
transport, land use, health, construction, and waste management to be performed<br />
by the city, other government entities, and private players. A reduction target was<br />
established and public disclosure of the results is expected. Nevertheless, future<br />
regulation is needed on some issues, such as payment for environmental services<br />
and subnational cooperation.<br />
Mapping of areas where landslides occur: Th e areas at <strong>risk</strong> for landslides<br />
are already identifi ed and geo-referenced by the municipality, allowing the prioritization<br />
of prevention. Th e same is needed for all fl ooding areas beyond<br />
the locations already mapped. Th is data would be most useful if shared among<br />
secretaries for planning. If strong preventive projects are implemented, the <strong>risk</strong>s<br />
will be lower and less will need to be spent on emergency action.<br />
Existence of the beginning of a unifi ed approach to <strong>climate</strong> issues and policies:<br />
Th e EcoEconomy and Climate Committee were created to unite the city<br />
entities around the subject, and also bring together state and national players, citizen<br />
organizations, and government agencies. Th e 2009 Decree 50.866/2009 inaugurated<br />
the committee’s works. Th e forum aims to propose, stimulate, and follow<br />
the adoption of plans, programs, and actions that help satisfy the city policy. It<br />
also intends to support actions to mitigate greenhouse gas emissions, promote
264 ■ CLIMATE CHANGE, DISASTER RISK, AND THE URBAN POOR<br />
adaptation strategies, create seminars and campaigns, and promote the adoption<br />
of social and environmental criteria in the city’s purchases of products and services.<br />
Members of the committee can help in identifying technology trends linked<br />
to <strong>climate</strong> <strong>change</strong> and off er feedback on eventual amendments to the Municipal<br />
Climate Law. Th e structure exists and meetings take place regularly; there is still<br />
need to strengthen community capacity to propose and implement projects.<br />
São Francisco Global Urban Plan, by SEHAB: Th e plan creates guidelines<br />
to integrate the 50,000 inhabitants of the third-largest slum on the east side of<br />
São Paulo into the formal city, by extending social housing, the construction<br />
of a hospital, school, community center, and services center, which will also<br />
serve as a commercial center and income generator. It also includes extending<br />
the transport system and improving roadways. With paved streets and nearby<br />
trees, the ease of access to public transportation, town inhabitants will use a<br />
car less in everyday tasks. Th e objective is that the town will stop being a<br />
“bedroom city” and will provide the products and services essential for everyday<br />
day living in central city locations. Plans for new housing will maximize<br />
the conservation of the remaining green areas and water springs in the new<br />
town. Together with SVMA, a park will be created, at an old dump, measuring<br />
367,000 thousand m 2 .<br />
Ecofrota Program: At the beginning of 2011 the city initiated a program<br />
that provides for the use of 20 percent biodiesel in public transport throughout<br />
the city. Th e initiative aims to reduce the emissions of particulate matter<br />
by 22 percent, carbon monoxide by 13 percent, and hydrocarbons by 10 percent,<br />
and reaches the annual goal of reducing fossil fuels by 15 percent, as provided<br />
in the Municipal Climate Law. Th is states that the entire public transportation<br />
system in the city should operate on renewable fuels by 2018. Th e project will<br />
identify any public transport fueled with cleaner fuels, including biodiesel, ethanol,<br />
hybrid, and electric.<br />
City hall to renew the transport fl eet: SP Trans has been renewing its bus<br />
fl eet, which services the city, substituting the old vehicles with more advanced<br />
modern models. Of the 15,000 buses in the city, 9,684 (65 percent) have already<br />
been replaced, lowering the average age of the vehicles in use to four and a half<br />
years. In addition, just by adding larger buses between 2006 and 2010, the fl eet<br />
capacity increased 21 percent and the number of transported passengers grew<br />
by 11 percent.<br />
Solar systems to heat the water: Th e City Assembly approved Law 14459/07<br />
requiring that from that date forward all new residential or commercial buildings<br />
should be prepared to use a solar-based system to heat the water used by its<br />
inhabitants. Th e new houses and buildings assembled with more than four bathrooms<br />
must adopt a solar-panel heating system. Some commercial buildings, such<br />
as private clubs, gyms, hotels and motels, schools, hospitals, clinics, and industrial
ANNEX 7: SÃO PAULO CASE STUDY ■ 265<br />
laundromats also must install the solar panels. Th e system should meet at least<br />
40 percent of the annual energy needs of the toilet water and water for pools that<br />
the building may require.<br />
Sustainable Building Project: Developed by PMSP/SEHAB, this project<br />
has been initiated in a part of Heliópolis, a large slum in the southeast of the city<br />
with almost 130,000 residents. Over the last few years this area has been undergoing<br />
urbanization and improvement: houses are now made mainly of bricks<br />
instead of scarce wood.<br />
Carbon credits: Carbon credits are being used to develop social and environmental<br />
projects in areas near the plants, such as linear parks, public squares,<br />
eco-points installation, and a center being built to hold wild animals and to<br />
house birds. For example, the Bamburral slum (570 families living next to the<br />
Bandeirante waste site) is the fi rst slum to be urbanized with funds from carbon<br />
credits. Th e community urbanization provides infrastructure, stream channeling,<br />
and construction of four clusters of houses that will receive 260 families that live<br />
in at-<strong>risk</strong> areas. Th e construction of a deck over the creek is also planned in<br />
order to facilitate the movement of residents, as well as a linear park with areas<br />
for sports and leisure.<br />
Linear parks: Th e Várzeas do Tietê Park, at 75 km, will be the largest linear<br />
park in the world. Th ere are about 7,000 households that will have to be removed.<br />
Th e resettlement will be done in the same region, with the construction of new<br />
housing units in a partnership between the City Housing Secretariat (SEHAB),<br />
Housing and Urban Development Agency (CDHU), and Metropolitan Housing<br />
Company of São Paulo (COHAB). Várzeas do Tietê Park will have signifi cant<br />
environmental gains, because it is considered essential for preserving the river<br />
and the sanitation of the areas that aff ect the margins, restoring and conserving<br />
the environmental function of wetlands, and providing fl ood control. Riparian<br />
and native vegetation will also be restored.<br />
Operation Clean Stream: Th is operation is a joint initiative with the state<br />
government of São Paulo to recover and treat streams throughout the city. Th e<br />
fi rst phase was initiated in 2007 and ended in 2009. More than 800,000 people<br />
benefi ted from cleaning 42 streams and piping 500 liters per second of sewage.<br />
Th e program deals with the remediation of the water and improvement of the<br />
sanitation in informal homes, benefi ting 1,637 inhabitants. Th e program will<br />
continue with the cleanup of 40 more streams up to 2012. During operations,<br />
the city is responsible for maintaining stream margins and layers, and removing<br />
houses that may prevent the passage of the sanitation piping system.<br />
Headwaters Program, by SEHAB: Th e program aims to service all vulnerable<br />
settlements located in protection areas such as Guarapiranga and Billings<br />
dams in order to restore drinkable water quality. Th e program partners<br />
among the three parts of the government and focuses on using the sub-basin
266 ■ CLIMATE CHANGE, DISASTER RISK, AND THE URBAN POOR<br />
as an integrated planning unit of government initiatives. Th e city’s master plan<br />
allows the construction of new vertical housing projects for 4,000 people at the<br />
margins of the drinking water reservoirs of Guarapiranga and Billings (the<br />
fi rst supplies water to 1.2 million inhabitants, and the second to 3.8 million). Billings<br />
currently has 12 km 2 of its water mirror occupied by informal settlements<br />
and receives 400 tons of waste every day. Guarapiranga has 1.3 million illegal<br />
residents in its margins.<br />
Social Partnership Program: Th e City Housing, Social Welfare and Social<br />
Development of Public Policies in São Paulo has the objective of providing<br />
access for low-income people to the formal rental allowance market. Th ey are<br />
subsidized by the fi xed monthly amount of $300.00, with no adjustments for<br />
30 months. Eligibility into the program requires income of 1 to 3 minimum<br />
wages, enabling access by vulnerable groups, including: the homeless in special<br />
social protection networks; families from areas expropriated by São Paulo,<br />
displaced due to fl oods or fi res; and residents in at-<strong>risk</strong> areas. Th e social<br />
work is based on a development program that systematically monitors eligible<br />
families, providing social and economic development initiatives to restore<br />
social rights, especially decent housing.<br />
Urban Carbon Footprint<br />
According to a 2005 study, 9 the city’s main source of emission comes from energy<br />
use, especially from transport (11,986 tons of carbon dioxide equivalent CO 2 e).<br />
Solid-waste disposal is the second-most important source (2,696 tons of<br />
CO 2 e). Liquid effl uents (7 tons of CO 2 e), Land Use Change and Forestry (51 tons<br />
of CO 2 e ), and agricultural activities (1 ton of CO 2 e ) are not relevant sources in<br />
terms of city emissions.<br />
In terms of energy, the use of fossil fuels in transport is the most critical<br />
issue for the city, since the fl eet is made up of more than 7 million vehicles<br />
(growing each year) and the traffi c is heavy (the average peak in traffi c varies<br />
between 80 and 111 km in 2010, and the medium speed rate was of 16 km per<br />
hour in 2008). 10<br />
Although most recent models of cars are “fl ex”—using both ethanol and gasoline—most<br />
private and public fl eets run on fossil fuel, especially gasoline and<br />
diesel (52 percent of the fossil fuel emissions come from gasoline, 45 percent<br />
from diesel, and 3 percent from natural gas). Th e law prescribed reducing the<br />
city´s greenhouse gas emissions by 30 percent, compared with 2005 emissions.<br />
Additional targets should be defi ned every two years.<br />
Initiatives such as the use of more energy-effi cient street and traffi c lighting<br />
and the establishment of infrastructure and incentives to promote the use of lowcarbon<br />
vehicles are being off ered, but specialists agree that the city needs to face
ANNEX 7: SÃO PAULO CASE STUDY ■ 267<br />
the problem of planning land use in order to promote shorter commutes between<br />
home and work.<br />
Notes<br />
1. IBGE Census 2000 and City Hall website 2006.<br />
2. City Hall website 2006.<br />
3. Linear park is an area around an important reservoir or drinking water basin, where a<br />
structure is implemented to protect the environment and at the same time provide the<br />
nearby population with leisure or sports activities.<br />
4. City Hall site/environment section.<br />
5. http://www.agenda2012.com.br/oprograma.<br />
6. http://www.prefeitura.sp.gov.br/cidade/secretarias/seguranca_urbana/defesa_civil/<br />
legislacao/pops__2009/index.php?p=7929.<br />
7. Th e minimum wage established by 2011 is around US$325.00 per month.<br />
8. As the threshold for indigency and poverty, the value of R$280.40 (updated in<br />
September 2007) was used, based on the POF (Family Budget Study) undertaken<br />
by IBGE in 1987. Indigents are considered those with total family income per capita<br />
below R$140.20 and, poverty stricken, those who earn up to R$280.40.<br />
9. São Paulo´s GHG´s inventory, http://ww2.prefeitura.sp.gov.br/arquivos/secretarias/<br />
meio_ambiente/Sintesedoinventario.pdf.<br />
10. São Paulo´s GHG´s inventory, http://ww2.prefeitura.sp.gov.br/arquivos/secretarias/<br />
meio_ambiente/Sintesedoinventario.pdf<br />
Reference<br />
<strong>World</strong> Bank and Diagonal Ltd. 2011. Climate Change, Disaster Risk Management and the<br />
Urban Poor: São Paulo, processed.
Figure A1.1 Population and Megacities in Low-Elevation Coastal Zone (LECZ) Threatened by Sea-Level Rise<br />
and Storm Surges<br />
Source: United Nations (2008), as reported in the <strong>World</strong> Development Report 2010, <strong>World</strong> Bank.<br />
COLOR SECTION ■ 269
Figure A2.1 Exposure in Large Cities to Cyclones and Earthquakes Rises from 680 Million in 2000 to 1.5 Billion<br />
Population both hazards:<br />
add 2050<br />
2000<br />
Population with cyclones:<br />
add 2050<br />
2000<br />
Population with earthquakes:<br />
add 2050<br />
2000<br />
Other population:<br />
add 2050<br />
2000<br />
International boundaries<br />
270 ■ COLOR SECTION
Figure A4.1 Administrative Map of Dar es Salaam<br />
Kinondoni district<br />
Bunde la Mpung<br />
Tandale-Mkundugo Tandale-Mtago<br />
Ubungo-Kisiwani<br />
Guna<br />
Ubungo-Kibanga Makuti A Kiango<br />
Mandela Baghdad<br />
Msiratazi Bundeni<br />
Mlewajuni<br />
Mapipa<br />
Ilala District<br />
Terneke Kizinga<br />
Terneke Mbuyuni<br />
Figure A5.3 Impact of Sea-level Rise on North Jakarta with<br />
Business as Usual<br />
Blue = inundation due to sea<br />
level rise at 1cm/yr<br />
(ITB 2007)<br />
COLOR SECTION ■ 271<br />
4 0 4 0<br />
Temeke District
272 ■ COLOR SECTION<br />
Figure A4.6 Map of Flood Hazard Zone Overlaid on Urban Poor<br />
Settlements, Dar es Salaam<br />
Morogora road<br />
Legend<br />
Main road<br />
Highly flooded area<br />
Source: Ardhi University (2010).<br />
Bagamoyo road<br />
Moderately flooded area<br />
Non flooded area<br />
Unplanned settlement<br />
Pugu road<br />
Kilwa road<br />
Scale 1:350,000<br />
N
Figure A5.1 Administrative Map of Jakarta<br />
JULY 2000<br />
INDONESIA<br />
THIRD JABOTABEK<br />
URBAN DEVELOPMENT<br />
PROJECT (JUDP III)<br />
I<br />
II<br />
III<br />
IV<br />
V<br />
NATURAL FEATURES:<br />
FISH PONDS<br />
FLOOD-PRONE AREAS<br />
IRRIGATED RICE FIELDS<br />
UPLAND CONSERVATION ZONES<br />
OTHER AGRICULTURE<br />
PHYSICAL ZONES:<br />
LOW LYING COASTAL: FLOODING, SALINE<br />
GROUNDWATER, UNSUITABLE FOR<br />
URBAN DEVELOPMENT<br />
LOW LYING PLAINS: FLOODING, MARGINAL<br />
URBAN DEVELOPMENT<br />
HIGHLANDS: GOOD DRAINAGE, SUITABLE<br />
FOR URBAN DEVELOPMENT<br />
STEEP SLOPING<br />
MOUNTAINS<br />
WATER SUPPLY AND SEWERAGE:<br />
SERIOUSLY POLLUTED<br />
RIVERS AND CANALS<br />
DRAINAGE OUTFALLS<br />
HIGHLY POLLUTED WATER<br />
SELECTED TOWNS AND<br />
BUILT-UP AREAS<br />
KABUPATEN (REGENCY)<br />
HEADQUARTERS<br />
KOTA ADMINISTRASI<br />
(ADMINISTRATIVE CITY) OR<br />
KOTAMADYA (CITY) BOUNDARIES<br />
KABUPATEN BOUNDARIES<br />
D.K.I. JAKARTA BOUNDARY<br />
JABOTABEK BOUNDARY<br />
0 5 10 15<br />
KILOMETERS<br />
20 25<br />
The boundaries, colors, denominations and any other information<br />
shown on this map do not imply, on the part of The <strong>World</strong> Bank<br />
Group, any judgment on the legal status of any territory, or any<br />
endorsement or acceptance of such boundaries.<br />
600'<br />
630'<br />
Ciujung R.<br />
Cidurian R.<br />
Ciberang R.<br />
Cibeureum R.<br />
Kronjo<br />
Kresek<br />
Balaraja<br />
Tigakarsa<br />
10630'<br />
Lontar<br />
Jasinga<br />
Kali Mauk R.<br />
Cimanceuri R.<br />
Cipayacun R.<br />
Mauk<br />
II<br />
Teluk<br />
Naga Kosambi<br />
Rajeg Seratan<br />
Pasar<br />
Kemis<br />
Cikupa<br />
IV<br />
V<br />
10630'<br />
Cipekayon<br />
I<br />
R.<br />
Curug<br />
Cibungbulang<br />
TANGERANG<br />
Legok<br />
Parung<br />
Panjang<br />
Cidangdeur R.<br />
III<br />
Cisadane<br />
Cisadane R.<br />
Leuwiliang<br />
J a v a S e a<br />
Mookevan<br />
Serpong<br />
Parung<br />
Kali Angke R.<br />
Ciempea<br />
Cisadane<br />
R.<br />
JAKARTA<br />
Pasanggrahan<br />
R.<br />
Kali<br />
Ciputat R.<br />
Kali<br />
DEPOK<br />
Cibinong<br />
IV<br />
Semplak<br />
V<br />
Banjir Canal<br />
Kali<br />
Ciliwung R.<br />
BOGOR<br />
Sunter R.<br />
Ciphang<br />
Kali<br />
III<br />
Gikeas<br />
Pulo<br />
Gadung<br />
Cakung R.<br />
Kali<br />
Cileungsi<br />
Gileungsi<br />
Citeureup<br />
Kali<br />
10700'<br />
Ketapang R.<br />
Bekasi R.<br />
Bantar<br />
Gebang<br />
10700'<br />
Tanum<br />
Jaya<br />
BEKASI<br />
Kali<br />
V<br />
II<br />
Siluman<br />
R.<br />
I<br />
Babelan Tambelang<br />
Setu<br />
Muara Gembong<br />
Tambun<br />
Cikarang R.<br />
Cibarusa<br />
Jonggol<br />
Cipamungkis R.<br />
R.<br />
Cibea<br />
Cikarang<br />
IV<br />
Cabang Bungin<br />
Cikarang<br />
Lemah<br />
Abang<br />
III<br />
Cigentis<br />
R.<br />
Cipammgkis<br />
Citarum<br />
R.<br />
Citarum<br />
R.<br />
600'<br />
630'<br />
Jatiluhur<br />
Res.<br />
IBRD 30971<br />
COLOR SECTION ■ 273
274 ■ COLOR SECTION<br />
Figure A5.4 Population Exposure to Hazards, Jakarta<br />
W E<br />
0 1,25 2,5 5 7,5<br />
N<br />
S<br />
Legend:<br />
Elevation (m) :<br />
40<br />
DKI Jakarta Province, 2000<br />
km<br />
10<br />
Legend:<br />
Population Density<br />
(Person/Ha):<br />
< 150<br />
150–300<br />
300–450<br />
450–600<br />
>600<br />
River<br />
Coastline<br />
Provincial Boundary<br />
Municipality Boundary<br />
Subdistrict Boundary<br />
Urban Village Boundary<br />
Figure A5.5 Slum Areas, Flooding and Unregistered Land, Jakarta<br />
Source: BPS, 2009/2010
Legend<br />
Not vulnerable pop and housing - blue<br />
vulnerable population - green<br />
vulnerable housing - yellow<br />
vulnerable pop and housing - red<br />
COLOR SECTION ■ 275<br />
Figure A6.5 Vulnerable Areas in Terms of Population and Housing,<br />
Mexico City<br />
Figure A7.4 São Paulo´s Topography and Main Waterways<br />
Source: PMSP—São Paulo Environmental Atlas.<br />
Legend<br />
Slope levels<br />
0–5%<br />
5–25%<br />
25–60%<br />
>60%
276 ■ COLOR SECTION<br />
Figure A7.9 Geotechnical Hazard Areas, São Paulo<br />
Legend<br />
Slope<br />
Geotechnical Risk Areas<br />
0–05%<br />
05–25%<br />
25–60%<br />
> 60%
Boxes, fi gures, notes, and tables are indicated by b, f, n, and t following the page number.<br />
A<br />
absentee landlords, 29–30<br />
ACCRN (Asian Cities Climate Change<br />
Resilience Network), 153–54<br />
Aceh (Indonesia), reconstruction in, 171–72<br />
action planning, 65, 68–69b, 68–70<br />
Action Plan on Global Warming<br />
Mitigation, 106b<br />
Adaptation Fund, 134<br />
Adaptation Strategies for Climate<br />
Change in the Urban Environment<br />
(ASCCUE), 74–75<br />
adaptation to <strong>climate</strong> <strong>change</strong>. See also<br />
mitigation of <strong>climate</strong> <strong>change</strong><br />
costing of, 100–103<br />
<strong>disaster</strong> response and, 224–25<br />
<strong>disaster</strong> <strong>risk</strong> management and, 187–91,<br />
244–46<br />
lessons learned from, 173<br />
literature review on, 132–34<br />
planning for, 186<br />
poverty reduction and, 127<br />
Adapting Cities to Climate Change<br />
(Bicknell et al.), 128, 133<br />
Adapting to Climate Change in<br />
Eastern Europe and Central Asia<br />
(Fay et al.), 127<br />
AES Eletropaulo Metropolitana S.A.<br />
(energy utility), 242<br />
Africa. See also specifi c countries and regions<br />
community organization partnerships<br />
in, 94<br />
Index<br />
cyclone exposure in, 144<br />
forced evictions in, 52<br />
malaria in, 49<br />
precipitation in, 83<br />
slums in, 28<br />
urban populations in, 12<br />
African Development Bank, 127–28<br />
African Urban Risk Analysis Network<br />
(AURAN), 160–61, 188<br />
Aga Khan Hospital (Dar es Salaam), 190<br />
“Agenda 2012” program (São Paulo), 244<br />
agriculture, urban, 53<br />
Aguada Flood Park (Santiago), 75–76<br />
Ahmedabad (India), bonds in, 119<br />
air conditioning, 48<br />
air pollution, indoor, 47<br />
Aishaman slum (Ghana), 32<br />
Akhtar, R., 130<br />
Alaho settlement (Accra), 41<br />
Alexandria (Egypt), fl oods in, 142<br />
Alliance for Clean Cook Stoves, 48<br />
Amman (Jordan), carbon fi nance in, 115<br />
Amsterdam (Netherlands), fl oods in, 143<br />
Anguilla, <strong>risk</strong> fi nancing in, 170<br />
Antigua & Barbuda, <strong>risk</strong> fi nancing in, 170<br />
Architectural Institute of Japan, 40<br />
Arctic, warming of, 48<br />
Ardhi University, 182<br />
Argentina, early-warning systems in, 159–60<br />
ASCCUE (Adaptation Strategies for<br />
Climate Change in the Urban<br />
Environment), 74–75<br />
■ 277
278 ■ INDEX<br />
Asia. See also specifi c countries and regions<br />
coastal cities in, 144–45<br />
community organization partnerships<br />
in, 94<br />
cyclone exposure in, 144<br />
earthquakes in, 19<br />
fl ood exposure in, 142–43<br />
forced evictions in, 52<br />
landslides in, 19<br />
urban populations in, 12, 15<br />
Asian Cities Climate Change Resilience<br />
Network (ACCRN), 153–54<br />
AURAN (African Urban Risk Analysis<br />
Network), 160–61, 188<br />
B<br />
Badan Nasional Penanggulangan Bencana<br />
(BNPB, Indonesian monitoring<br />
agency), 208<br />
Badan Penanggulangan Bencana Daerah<br />
(BPBD, Indonesian <strong>disaster</strong><br />
management agency), 206–7, 208<br />
Badan Pengelola Linkungan Hidup Daerah<br />
(BPLHD, Indonesian environmental<br />
agency), 206, 215<br />
Badan Perencanaan Pembangunan Daerah<br />
(BAPPEDA, Indonesian planning<br />
agency), 206–7<br />
Bahamas, <strong>risk</strong> fi nancing in, 170<br />
Baker, Judy, 130<br />
Banco Nacional de Obras, 107b<br />
Bandeirantes Landfi ll (São Paulo), 116b, 237<br />
Bandra-Kurla Complex (Mumbai), 52b<br />
Bangalore (India), bonds in, 119<br />
Bangkok (Th ailand)<br />
clean technology fund for, 105, 106b<br />
fl ooding costs in, 100<br />
as “hotspot” city, 132<br />
Multi-Hazard City Risk Index for, 145<br />
Bangkok Metropolitan Administration<br />
(BMA), 106b<br />
Bangladesh<br />
early-warning system in, 88<br />
housing loans in, 120<br />
slums in, 37b<br />
BAPPEDA (Badan Perencanaan<br />
Pembangunan Daerah, Indonesian<br />
planning agency), 206–7<br />
Barbados, <strong>risk</strong> fi nancing in, 170<br />
Barcelona (Spain), fl ood management in, 75<br />
barrios, 38b<br />
basic health units (UBS), 245<br />
basic services. See service delivery<br />
Bayan Tubig (Water for the Community)<br />
program, 118b<br />
Bay of Bengal, cyclones in, 17<br />
B/Cs (benefi t/cost ratios), 102, 102f<br />
bed nets, 130<br />
BEHD (buildings expected to be heavily<br />
damaged), 71<br />
Belgaum (India), water effi ciency project<br />
in, 166<br />
Belize, <strong>risk</strong> fi nancing in, 170<br />
Bellary (India), water effi ciency project in, 166<br />
benefi t/cost ratios (B/Cs), 102, 102f<br />
Bermuda, <strong>risk</strong> fi nancing in, 170<br />
Bicknell, Jane, 131<br />
Billings dam (São Paulo), 265–66<br />
Bio Carbon Fund, 165<br />
Biogas (company), 116b<br />
biomass, burning of, 47<br />
Birkmann, Jörn, 128<br />
black carbon, 48, 58n10<br />
Bloomberg, Michael, 68b<br />
BMA (Bangkok Metropolitan<br />
Administration), 106b<br />
BNPB (Badan Nasional Penanggulangan<br />
Bencana, Indonesian monitoring<br />
agency), 208<br />
Bogota (Colombia)<br />
housing program in, 105<br />
slums in, 38b<br />
Bolivia, <strong>climate</strong> mitigation in, 164–65<br />
Bolivia Urban Infrastructure, 164<br />
Bombay High Court, 52b<br />
Bonde la Mpunga (Dar es Salaam), fl ooding<br />
in, 160<br />
bonds<br />
carbon-linked, 115<br />
green, 121<br />
for slum improvements, 119<br />
Bordo Poniente (Mexican landfi ll), 223<br />
Borivali National Park (Mumbai), 52b<br />
Boston, urban planning in, 70<br />
BPBD (Badan Penanggulangan Bencana<br />
Daerah, Indonesian <strong>disaster</strong><br />
management agency), 206–7, 208<br />
BPLHD (Badan Pengelola Linkungan Hidup<br />
Daerah, Indonesian environmental<br />
agency), 206, 215
Brazil. See also São Paulo<br />
Development Policy Loan for, 106<br />
fl ooding in, 8<br />
urban waste collection in, 46<br />
Brigades of the Ministry of Social<br />
Development (Mexico City), 226<br />
Buenos Aires (Argentina), fl ooding in, 159<br />
building-back-better, good practices for,<br />
170–73<br />
building codes, 71<br />
building designs, <strong>climate</strong> projections and, 82<br />
buildings expected to be heavily damaged<br />
(BEHD), 71<br />
Bus Rapid Transit line (Mexico City), 222<br />
C<br />
Cairo (Egypt)<br />
“newtowns” in, 30<br />
public infrastructure in, 104<br />
Caixa Econômica Federal (Federal Bank,<br />
Brazil), 263<br />
California, water management in, 85<br />
Ca Mau (Vietnam), urban upgrading in, 167<br />
Cambodia, housing fi nance in, 120<br />
Canadian Sustainable Environment<br />
Management Offi ce, 73<br />
Can Th o (Vietnam)<br />
Local Resilience Action Plan in, 155<br />
urban upgrading in, 167<br />
capacity building, 89, 90t, 121, 153, 184,<br />
202, 204<br />
Capacity Strengthening of Least Developing<br />
Countries for Adaptation to Climate<br />
Change (CLACC), 153<br />
cap-and-trade programs, 117b<br />
Cape Flats informal settlement<br />
(Cape Town), 40<br />
Cape Town (South Africa), urban planning<br />
in, 70<br />
Caracas (Venezuela), slums in, 38b<br />
carbon credits, 265<br />
Carbon Credits Auctions, 237<br />
carbon footprints, 266–67<br />
carbon markets, 110, 115<br />
Carbon Partnership Facility, 115<br />
carbon revenue, 165–66<br />
Caribbean. See also specifi c countries<br />
cyclones in, 17<br />
earthquake exposure in, 144<br />
<strong>risk</strong> fi nancing in, 170<br />
INDEX ■ 279<br />
Caribbean Catastrophe Risk Insurance<br />
Facility (CCRIF), 170<br />
Casablanca (Morocco), action plans<br />
for, 102<br />
Cash-for-Work program, 167<br />
Cash for Work Temporary Employment<br />
Project (CfWTEP), 168<br />
Catastrophe Risk Deferred Drawdown<br />
Option (CAT DDO), 170<br />
Cayman Islands, <strong>risk</strong> fi nancing in, 170<br />
CBOs. See community-based organizations<br />
CCRIF (Caribbean Catastrophe Risk<br />
Insurance Facility), 170<br />
CDCF (Community Development Carbon<br />
Fund), 164–65, 166<br />
CDHU. See Housing and Urban<br />
Development Agency<br />
CDM. See Clean Development Mechanism<br />
Central America. See also specifi c countries<br />
cyclones in, 17<br />
<strong>disaster</strong>-induced emergency<br />
funding in, 170<br />
volcanoes in, 20<br />
Centre for Atmospheric Sciences, 218<br />
Centre for Urban Studies (Bangladesh), 131<br />
Centro de Previsão de Tempo e Estudos<br />
Climáticos (Eta-CPTEC) Model,<br />
249, 251<br />
certifi ed emission reductions (CERs),<br />
115, 116b<br />
CET (Traffi c Engineering Company), 255<br />
C40 group, 237<br />
CfWTEP (Cash for Work Temporary<br />
Employment Project), 168<br />
CGE (Emergency Management Center, São<br />
Paulo), 244–45<br />
Cheonggyecheon Restoration Project, 76<br />
Chicago<br />
adaptation planning in, 84b<br />
emissions trading systems in, 117b<br />
children<br />
health impacts of <strong>climate</strong> <strong>change</strong><br />
on, 126<br />
public health and, 49<br />
self-insurance and, 168<br />
in slums, 257<br />
as vulnerable population, 86<br />
Chile<br />
earthquakes in, 8, 173<br />
fl ood management in, 75
280 ■ INDEX<br />
China, People’s Republic of<br />
cook stoves in, 47<br />
cyclones in, 17<br />
earthquakes in, 8, 19<br />
fl oods in, 8<br />
technical assistance programs in, 154<br />
cholera, 48–49, 192<br />
CIFs (Climate Investment Funds), 134<br />
Cities Alliance, 161<br />
Cities on the Move (<strong>World</strong> Bank), 130<br />
City Assembly (São Paulo), 237<br />
City Climate Law (São Paulo), 237<br />
City Education Secretariat (SME,<br />
São Paulo), 263<br />
City Emergency Management Agency<br />
(COMDEC, São Paulo), 244–45, 246<br />
City Health Secretariat (São Paulo), 245<br />
City Housing, Social Welfare and Social<br />
Development of Public Policies (São<br />
Paulo), 266<br />
City Housing Secretariat (SEHAB,<br />
São Paulo), 245, 251, 254–55, 260,<br />
263, 264–65<br />
City Public Safety Secretariat<br />
(São Paulo), 244<br />
Ciudad Kenedy slum (Bogota), 30<br />
CIUP (Community Infrastructure<br />
Upgrading Program), 161, 183–84<br />
Civil Protection Agency (Mexico City),<br />
224, 226<br />
CLACC (Capacity Strengthening of Least<br />
Developing Countries for Adaptation<br />
to Climate Change), 153<br />
“clandestine” fi elds, 223<br />
Clean Development Mechanism (CDM),<br />
110, 115, 116b, 165, 185, 237<br />
Clean Technology Fund, 105, 106b, 107b<br />
ClimAdapt, 73<br />
<strong>climate</strong> <strong>change</strong><br />
Dar es Salaam and, 181–97. See also Dar<br />
es Salaam<br />
<strong>disaster</strong> <strong>risk</strong> assessment and, 7–25.<br />
See also <strong>disaster</strong>s and <strong>disaster</strong> <strong>risk</strong><br />
assessment<br />
exposure in cities and, 141–47. See also<br />
exposure in cities<br />
fi nance opportunities and, 99–123. See also<br />
fi nance opportunities<br />
Jakarta and, 199–215. See also Jakarta<br />
literature review, 125–39. See also literature<br />
review<br />
Mexico City and, 217–33. See also Mexico<br />
City<br />
project and program experiences and,<br />
149–80. See also project and program<br />
experiences<br />
São Paulo and, 235–68. See also São Paulo<br />
urban poor, building resilience for, 63–97.<br />
See also urban poor, building<br />
resilience for<br />
urban poor, vulnerability of, 27–62. See also<br />
urban poor, vulnerability of<br />
Climate Change Adaptation Program<br />
(Mexico City), 69b, 223<br />
Climate Change Economy Committee (São<br />
Paulo), 262<br />
Climate Change Risk Management Strategy<br />
for HRM (Halifax Region<br />
Municipality), 73<br />
Climate Committee (São Paulo), 263<br />
Climate Investment Funds (CIFs), 134<br />
Climate Resilient Cities (CRC) Primer, 154<br />
Climate Resilient Communities<br />
Program, 153<br />
Climate Risks and Adaptation in Asian<br />
Coastal Megacities: A Synthesis Report<br />
(<strong>World</strong> Bank), 100, 131, 133<br />
<strong>climate</strong> sensitivity, 82–83, 83t<br />
Climate SMART (Sustainable Mitigation<br />
and Adaptation Risk Toolkit), 73<br />
Climate Summit for Mayors (2009), 9<br />
coastal areas and cities, 17–18, 49, 144–45,<br />
189–90. See also port cities<br />
coastal-defense projects, 82<br />
CODELs (local emergency committees), 159<br />
COHAB (Metropolitan Housing<br />
Company of São Paulo), 260, 265<br />
cold waves, 135<br />
Colombia<br />
public transport projects in, 133<br />
<strong>risk</strong> management in, 168–69<br />
COMDEC (City Emergency Management<br />
Agency, São Paulo), 244–45, 246<br />
communicable diseases, 48–49, 58–59n14, 92.<br />
See also specifi c diseases<br />
community-based organizations (CBOs),<br />
86, 150–51, 162–63, 171–72<br />
Community-based Settlements<br />
Rehabilitation and Reconstruction,<br />
171–72<br />
Community Development Carbon Fund<br />
(CDCF), 164–65, 166
Community Infrastructure Upgrading<br />
Program (CIUP), 87, 161,<br />
183–84, 188<br />
concession contracts, 117, 118b<br />
cookstoves, 47–48, 58n10, 134<br />
Costa Rica, drawdown options in, 170<br />
Th e Cost to Developing Countries of Adapting<br />
to Climate Change (<strong>World</strong> Bank), 133<br />
COVISA (Health Vigilance Coordination,<br />
São Paulo), 245<br />
CPTM (Train Management Agency, São<br />
Paulo), 242<br />
CRC (Climate Resilient Cities Primer), 154<br />
credit guarantees, 119<br />
Crisis Commons, 173<br />
Cuba, early-warning systems in, 159<br />
Cuitegi Plaza (São Paulo), 116b<br />
Curitiba (Brazil), fl ood management<br />
in, 75<br />
Cuttack (India)<br />
mapping and data gathering in, 157–58<br />
<strong>risk</strong> assessment in, 65<br />
CVCCCM (Virtual Center on Climate<br />
Change for Mexico City), 88, 218<br />
cyclones, 2f, 12–19, 144<br />
Cyclone Sidr (2007), 88<br />
D<br />
Da Nang (Vietnam), urban upgrading<br />
in, 167<br />
DANIDA (Danish International Development<br />
Agency), 92, 161–62<br />
Danilenko, Alexander, 130<br />
Danish International Development Agency<br />
(DANIDA), 92, 161–62<br />
Dao, H., 131<br />
Dar es Salaam (Tanzania), 181–97<br />
administrative units in, 3f, 86<br />
case study summary for, 11, 186–97<br />
built environment and service<br />
provision, 186–87<br />
city profi le, 186, 187t<br />
<strong>climate</strong> hazards, 192–95, 193f,<br />
194t, 195f<br />
<strong>climate</strong> hazards assessment,<br />
191–96, 192t<br />
<strong>disaster</strong> <strong>risk</strong> management, 187–91<br />
future <strong>climate</strong> projections, 194–95<br />
institutional assessment, 187–91<br />
leading agencies, 191<br />
natural <strong>disaster</strong>s, 191–92<br />
INDEX ■ 281<br />
policies and legislation, 188<br />
potential losses, 195–96<br />
pro-poor services and local<br />
expenditure, 191<br />
socioeconomic assessment, 196–97<br />
urban poor, location and exposure of,<br />
196–97, 196f<br />
City Council, 86, 182, 184, 187–88, 191<br />
Climate Summit for Mayors and, 9<br />
cook stoves in, 47<br />
diseases in, 48–49<br />
fl oods in, 19<br />
infrastructure upgrading in, 87<br />
maladaptation to <strong>climate</strong> <strong>change</strong><br />
in, 149–50<br />
malaria in, 20<br />
overview and key fi ndings, 181–86<br />
government at work, 183–84<br />
information gaps and, 184–85<br />
key constraints, 184<br />
looking forward, 185–86<br />
<strong>risk</strong> assessment in, 65, 122, 191–96, 192t<br />
roads in, 46–47<br />
sanitation in, 42<br />
solid-waste disposal in, 46<br />
urban planning in, 160–61<br />
water supply in, 42, 43b<br />
Dar es Salaam City Council (DCC), 86, 182,<br />
184, 187–88, 191<br />
data collection<br />
Jakarata case study and, 201<br />
Mexico City case study and, 219<br />
for <strong>risk</strong> assessment, 64–65<br />
for vulnerability, 157–58<br />
DCC. See Dar es Salaam City Council<br />
decision-making tools, 83–86, 85b<br />
Decision of the Parties (Cancun, 2010), 115<br />
Decree 50.866/2009 on <strong>climate</strong> <strong>change</strong> (São<br />
Paulo), 263–64<br />
Delhi (India), temperatures in, 48<br />
dengue, 18, 20, 48, 49, 50b<br />
Density and Disasters (Lall and<br />
Deichmann), 131<br />
Deutsche Gesellschaft für Technische<br />
Zusammenarbeit (GTZ), 159<br />
Developer’s Risk Management Guide<br />
(Halifax Region Municipality), 73<br />
developing countries<br />
fi nancing sources for, 105<br />
greenhouse gas emissions in, 115<br />
Development Policy Loans (DPLs), 105–6
282 ■ INDEX<br />
Dhaka (Bangladesh)<br />
<strong>climate</strong> <strong>change</strong> vulnerability of, 144<br />
drainage in, 44<br />
security of tenure in, 52<br />
slums in, 131<br />
Dharavi slum (Mumbai), 32<br />
diarrhea, 44–45, 48, 163, 192<br />
Dinas Pekerjaan Umum (DPU, Indonesian<br />
public works agency), 207<br />
<strong>disaster</strong>-management plans, 50–51<br />
<strong>disaster</strong> <strong>risk</strong> reduction (DRR), 106–7, 128–29,<br />
130, 132, 134–35, 144<br />
<strong>disaster</strong>s and <strong>disaster</strong> <strong>risk</strong> assessment, 7–25.<br />
See also specifi c <strong>disaster</strong>s<br />
(e.g., earthquakes)<br />
background, analytical framework, and<br />
approach, 9–12, 11–14t<br />
decision making and, 64–65, 66–67b<br />
early-warning systems. See early-warning<br />
systems<br />
emergency services and, 49–51<br />
exposure, estimation of, 22–23, 22–23t<br />
hazard <strong>risk</strong> and, 6f, 12–22, 15–16t, 18t<br />
drought, 20<br />
earthquakes, volcanoes, and landslides,<br />
2f, 19–20<br />
fl oods and cyclones, 2f, 12–19<br />
heat waves, 20–22, 21b<br />
key messages, 7<br />
objectives of study, 7–9<br />
service delivery and, 38–51, 64, 86–89<br />
shelters and, 40<br />
diseases. See communicable diseases;<br />
noncommunicable diseases; specifi c<br />
diseases<br />
DKI. See Special Capital District<br />
Dodman, David, 131<br />
Dominica, <strong>risk</strong> fi nancing in, 170<br />
Dong Th ap (Vietnam), urban upgrading<br />
in, 167<br />
Douglas, Ian, 129<br />
DPLs (Development Policy Loans), 105–6<br />
DPU (Dinas Pekerjaan Umum, Indonesian<br />
public works agency), 207<br />
drainage. See also sanitation<br />
<strong>disaster</strong> <strong>risk</strong> and, 44–45, 189<br />
job creation and, 167–68<br />
partnerships to supply, 163–64<br />
service delivery and, 129<br />
solid-waste disposal and, 46<br />
drawdown options, 170<br />
droughts, 20<br />
drowning, 18<br />
dysentery, 192<br />
E<br />
early-warning systems, 51, 88, 93–94b, 102,<br />
158–60, 225–26, 227<br />
Earthquake Disaster Risk Index (EDRI), 145<br />
Earthquake Master Plan for Istanbul, 71<br />
earthquakes<br />
<strong>disaster</strong> <strong>risk</strong> and, 19–20, 71–72, 145<br />
exposure to, 2f, 144<br />
shelters and, 40<br />
slums and, 29, 38b<br />
East Asia, earthquakes in, 19<br />
Ebrard, Marcelo, 222<br />
EcoEconomy Committee (São Paulo), 263<br />
Ecofrota Program (São Paulo), 264<br />
ecological services, green infrastructure<br />
and, 74–76<br />
EDRI (Earthquake Disaster Risk Index), 145<br />
Egypt, public transport projects<br />
in, 133<br />
elderly<br />
health impacts of <strong>climate</strong> <strong>change</strong> on, 126<br />
heat waves and, 20<br />
public health and, 49<br />
as vulnerable population, 86<br />
El Salvador<br />
drawdown options in, 170<br />
self-insurance in, 110, 168<br />
Emergency Management Agency<br />
(São Paulo), 87, 244, 245, 261<br />
Emergency Management Center (CGE,<br />
São Paulo), 244–45<br />
emissions reduction (ER) units, 166<br />
emissions trading systems (ETSs),<br />
115, 117b<br />
Empresa Paulista de Planejamento<br />
Metropolitano (EMPLASA), 255<br />
Enda-Tiers Monde, 163<br />
energy services, 49–51, 133, 164–66<br />
Environmental Agenda of Mexico City, 223<br />
environmental health interventions, 92<br />
environmentally sensitive lands, 52b<br />
Environmental Public Fund (Mexico City),<br />
219, 224<br />
environmental traffi c lights (semaforos<br />
ambientales), 169<br />
ER (emissions reduction) units, 166<br />
Esteli (Nicaragua), social networks in, 54
Eta-CPTEC (Centro de Previsão de Tempo e<br />
Estudos Climáticos) Model, 249, 251<br />
Ethiopia, roads in, 46<br />
ETSs (emissions trading systems), 115, 117b<br />
European Union, emissions-trading<br />
schemes in, 117b<br />
evictions, forced, 51–53<br />
Excel spreadsheets, 158<br />
“excess deaths,” 21<br />
exposure in cities, 141–47<br />
coastal cities and, 144–45<br />
<strong>disaster</strong> <strong>risk</strong> reduction economics, 144<br />
Earthquake Disaster Risk Index (EDRI)<br />
and, 145<br />
megacities and, 143<br />
Multi-Hazard City Risk Index (MHCRI),<br />
145–46<br />
port cities and, 141–43, 142t<br />
F<br />
family networks, extended, 54<br />
FAR (fl oor-area ratio), 28, 58n1<br />
Fay, Marianne, 130<br />
fees as government revenue source, 104<br />
fi nance opportunities, 8, 99–123<br />
adaptation and <strong>risk</strong> reduction, sources for,<br />
103–21, 103t, 108t<br />
carbon markets and related<br />
instruments, 110, 115<br />
<strong>climate</strong> <strong>change</strong> and, 105–6<br />
<strong>disaster</strong> <strong>risk</strong> reduction and<br />
recovery, 106–7<br />
government revenues and<br />
expenditures, 104–5<br />
multilateral development banks and<br />
donors, 105–8<br />
private sector and, 115–20<br />
results-based fi nancing (RBF)<br />
and, 120–21<br />
<strong>risk</strong>-management instruments, 108–10,<br />
111–14t<br />
urban development and slum<br />
upgrading, 107<br />
adaptation costing and <strong>risk</strong> reduction,<br />
100–103<br />
key messages, 99<br />
literature review of, 134<br />
summarizing concepts, 121–22<br />
Fire and Health Department (Mexico<br />
City), 226<br />
Flexible Adaptation Pathways, 69b<br />
INDEX ■ 283<br />
Flood Control Committee (Dar es<br />
Salaam), 160–61<br />
fl oods<br />
ad hoc adaptation and, 55<br />
coastal-defense projects and, 82<br />
community organizations and, 162–63<br />
costs from, 100<br />
decision making and, 85b<br />
drainage and, 44–45<br />
early-warning systems for, 91, 93–94b,<br />
159–60, 188<br />
frequency of, 129<br />
hazards <strong>risk</strong>s and, 17–18<br />
maladaptation to, 149–50<br />
patterns of, 36b<br />
planning for, 74<br />
port cities and, 141–43, 142t<br />
rainwater-harvesting systems and, 53<br />
<strong>risk</strong> management for, 12–19, 72,<br />
75–76, 87<br />
sand-bagging and, 51<br />
shelters and, 40–41<br />
urban planning and, 160–63<br />
urban poor and, 4f<br />
urban upgrading and, 166–67<br />
water supply and, 43–44<br />
fl oor-area ratio (FAR), 28, 58n1<br />
Florida, adaptation cost curve for, 100,<br />
101f, 102<br />
Fondo de Desastres Naturales<br />
(FONDEN), 109b<br />
Food Price Crisis Response Trust Fund, 168<br />
forced evictions, 51–53<br />
forest fi res, 73<br />
France, heat waves in, 20<br />
Francisco, H. A., 131<br />
G<br />
GDP. See gross domestic product<br />
GEF (Global Environment Facility), 110<br />
GEO-CAN (Global Earth Observation—<br />
Catastrophe Assessment Network),<br />
87, 172<br />
Geographical Information System (GIS),<br />
157–58, 255<br />
geotechnical charts, 255<br />
GFDRR. See Global Facility for Disaster<br />
Reduction and Recovery<br />
GHG emissions. See greenhouse gas<br />
GIS (Geographical Information System),<br />
157–58, 255
284 ■ INDEX<br />
Global Assessment Report on Disaster Risk<br />
Reduction (ISDR), 9, 127<br />
Global Circulation Models, 194<br />
Global Community Monitor, 92<br />
Global Earth Observation—Catastrophe<br />
Assessment Network (GEO—CAN),<br />
87, 172<br />
Global Environment Facility (GEF), 110<br />
Global Environment Fund, 134<br />
Global Facility for Disaster Reduction<br />
and Recovery (GFDRR), 65, 66b, 144,<br />
169, 214<br />
Global Facility for Disaster Risk Reduction<br />
and Poverty, 127<br />
Global MultiCat, 109<br />
Global Partnership on Output Based Aid<br />
(GPOBA), 121<br />
Google, volunteer technology community<br />
participation of, 173<br />
Google Earth, 65, 157–58<br />
government revenues, 104–5<br />
GPOBA (Global Partnership on Output<br />
Based Aid), 121<br />
GPS devices, 65, 157<br />
Grameen Bank, 120<br />
grass roots organizations, 155–57<br />
Greater Bangalore Water and Sanitation<br />
Pooled Facility, 119<br />
Greater London Authority, 72<br />
Great Hanshim-Awaji earthquake (1995), 40<br />
Green and Environment Secretariat (SVMA,<br />
São Paulo), 235, 244, 245, 263, 264<br />
green bonds, 121<br />
greenhouse gas (GHG) emissions<br />
city-level indexes for, 121<br />
clean technology funds and, 106b<br />
<strong>climate</strong> <strong>change</strong> mitigation and adaptation<br />
and, 133–34<br />
emissions inventory, 15, 215, 237<br />
emissions-trading schemes for, 117b<br />
post-consumer waste and, 46<br />
reductions in, 115, 128, 222, 237, 266<br />
water supply and, 165–66<br />
greening initiatives, 74<br />
Green Plan (Plan Verde), 222, 223<br />
green rooft ops, 53, 75<br />
Grenada, <strong>risk</strong> fi nancing in, 170<br />
gross domestic product (GDP), 100, 143,<br />
145, 204, 221, 232–33, 232t<br />
GTZ (Deutsche Gesellschaft für Technische<br />
Zusammenarbeit), 159<br />
Guangzhou (China), fl oods in, 142<br />
Guarapiranga dam (São Paulo), 265–66<br />
Gujarat (India) earthquake (2001), 37<br />
Gulbarga (India), water effi ciency project<br />
in, 166<br />
H<br />
HABISP. See Housing Information System<br />
Haines, Andy, 130<br />
Hai Phong (Vietnam), urban upgrading<br />
in, 167<br />
Haiti<br />
basic service delivery in, 39<br />
earthquakes in, 8, 87, 106–7, 173<br />
<strong>risk</strong> fi nancing in, 170<br />
Halifax (Canada)<br />
<strong>climate</strong> <strong>change</strong> mainstreaming in, 73<br />
urban planning in, 70<br />
Halifax Region Municipality (HRM), 73<br />
Hamilton City (New Zealand), infrastructure<br />
systems in, 132<br />
HAND model, 255<br />
Hardoy, J.G., 131<br />
hazardous sites<br />
declivity, 35b<br />
geotechnical, 8f, 34, 35b<br />
Headwaters Program (São Paulo), 265–66<br />
Health Department (Mexico City), 224<br />
Health Secretariat (São Paulo), 245–46<br />
health services, 92, 130<br />
Health Vigilance Coordination<br />
(COVISA, São Paulo), 245<br />
heat-island eff ects, 21, 227<br />
heat-warning systems, 88<br />
heat waves, 20–22, 21b, 48, 72, 73–74, 132<br />
Herold, C., 131<br />
Ho Chi Minh City (Vietnam)<br />
fl oods in, 100, 142, 166–67<br />
as “hotspot” city, 132<br />
urban planning in, 70<br />
homeless people, 150, 233n3<br />
Honduras, early-warning systems<br />
in, 158–59<br />
“hotspots,” 132, 154, 155<br />
housing<br />
building-back-better options for, 170–71<br />
gaps in literature on, 135<br />
literature review of, 131–32<br />
in Mexico City case study, 230–31<br />
urban poor and, 131–32<br />
vulnerable areas and, 7f
Housing and Urban Development Agency<br />
(CDHU, São Paulo), 260, 263, 265<br />
Housing Information System (HABISP,<br />
São Paulo), 251, 254, 255, 263<br />
HRM (Halifax Region Municipality), 73<br />
Hubli/Dharwad (India), water effi ciency<br />
project in, 166<br />
Human Development Report (UNDP), 127<br />
“Human Health” (IPCC), 126, 130<br />
“humanitarian technologists,” 172<br />
Hurricane Mitch (1998), 158–59<br />
Hurricane Wilma (2005), 159<br />
I<br />
IBRD (International Bank for Reconstruction<br />
and Development), 170<br />
ICLEI USA, 153<br />
IIED (International Institute for<br />
Environment and Development),<br />
128, 153<br />
Iloilo (Philippines)<br />
City Urban Poor Aff airs Offi ce, 156<br />
grassroots organizations in, 156<br />
local partnerships in, 91<br />
Improving Water and Sanitation in<br />
Quelimane City, Mozambique<br />
program, 161<br />
Independent Evaluation Group<br />
(<strong>World</strong> Bank), 169<br />
index of social vulnerability (IPVS), 255<br />
India<br />
Asian Cities Climate Change Resilience<br />
Network in, 154<br />
carbon revenue in, 165–66<br />
cook stoves in, 47<br />
earthquakes in, 19<br />
housing fi nance in, 120<br />
parks in, 52b<br />
slums in, 119, 130<br />
Indonesia. See also Jakarta<br />
Asian Cities Climate Change Resilience<br />
Network in, 154<br />
community programs in, 88–89, 171–72<br />
Development Policy Loan for, 106<br />
earthquakes in, 19<br />
technical assistance programs in, 154<br />
Indore (India), slums in, 129–30<br />
“Industry, Settlements and Society”<br />
(IPCC), 126<br />
infectious diseases. See communicable<br />
diseases<br />
INDEX ■ 285<br />
infl uenza epidemics, 221<br />
informal settlements. See also slums;<br />
squatter settlements<br />
environmentally sensitive lands and, 52b<br />
Jakarta case study and, 213<br />
policy tradeoff s and, 77<br />
information systems, 184<br />
infrastructure. See also transportation sector<br />
costs for, 102–3<br />
green, 70, 74–76<br />
investments in, 100<br />
Jakarta case study and, 201–2<br />
security of tenure and, 51–52<br />
upgrading of, 87<br />
INPE (Instituto Nacional de Pesquisas<br />
Espaciais), 248–49, 251<br />
Institute for Social and Environmental<br />
Transition (ISET), 153<br />
Institute of Research and Technology<br />
(São Paulo), 248–49, 251<br />
Institute of Resource Assessment, 182<br />
Institute of Science and Technology of the<br />
Federal District (Mexico City), 218<br />
Instituto Nacional de Pesquisas Espaciais<br />
(INPE), 248–49, 251<br />
insurance, 53, 108–9, 110, 168–69<br />
Integrated Urban Water Management, 45<br />
Inter-Governmental Panel on Climate<br />
Change (IPCC)<br />
analytical framework of, 10<br />
Assessment Reports, 10, 49, 125, 126, 130<br />
<strong>climate</strong> <strong>change</strong> literature and, 9<br />
on <strong>climate</strong> <strong>change</strong> mitigation, 134<br />
on gaps in literature, 135<br />
on health services, 130<br />
on heat waves, 20<br />
on sea levels, 17<br />
on water availability, 42–43<br />
Inter-institutional Climate Change<br />
Commission of Mexico City,<br />
69b, 218, 223<br />
International Bank for Reconstruction and<br />
Development (IBRD), 170<br />
International Development Association, 105<br />
International Institute for Environment<br />
and Development (IIED), 128, 153<br />
International Organization for<br />
Standardization, 154<br />
International Organization on<br />
Migration, 190<br />
International START Secretariat, 182
286 ■ INDEX<br />
International Strategy for Disaster<br />
Reduction (ISDR), 158<br />
International Union for Conservation of<br />
Nature (IUCN), 190<br />
Internet<br />
HABISP information system on, 263<br />
rate of viewing, 245<br />
intestinal worms, 45<br />
Investment Plan for Th ailand, 105, 106b<br />
IPCC. See Inter-Governmental Panel on<br />
Climate Change<br />
IPT. See Technological Research Institute<br />
IPVS (Index of social vulnerability), 255<br />
ISDR (International Strategy for Disaster<br />
Reduction), 158<br />
ISET (Institute for Social and<br />
Environmental Transition), 153<br />
ISO 31000, 154<br />
Istanbul (Turkey)<br />
<strong>disaster</strong> <strong>risk</strong> reduction in, 71–72<br />
urban planning in, 70<br />
IUCN (International Union for<br />
Conservation of Nature), 190<br />
J<br />
Jakarta (Indonesia), 199–215<br />
administrative map of, 5f<br />
case study summary, 11, 204–15<br />
city profi le, 204–6, 205t<br />
<strong>climate</strong> hazards, 211, 212t<br />
constraints and opportunities, 214–15<br />
<strong>disaster</strong> impacts, 212<br />
<strong>disaster</strong> <strong>risk</strong> management, 206–8, 210t<br />
good practice examples, 213–14<br />
greenhouse gas emissions, 215<br />
hazards assessment, 209–12<br />
high-<strong>risk</strong> <strong>disaster</strong> areas, 211–12<br />
informal settlements, characteristics<br />
of, 213<br />
institutional assessment, 206–9<br />
natural <strong>disaster</strong>s, 209–11, 211t<br />
policies and legislation, 207<br />
policy shortcomings, 208<br />
pro-poor programs and <strong>climate</strong><br />
adaptation, 209, 209t<br />
<strong>risk</strong> reduction, 208–9<br />
socioeconomic assessment, 213–15, 214t<br />
urban poor, location of, 213<br />
<strong>climate</strong> <strong>change</strong> vulnerability of, 144<br />
Climate Summit for Mayors and, 9<br />
decentralization in, 86<br />
dengue in, 50b<br />
drainage in, 45<br />
early-warning systems in, 91, 93–94b<br />
fl ooding in, 36b, 55<br />
overview and key fi ndings, 199–204<br />
areas for improvement, 201<br />
government at work, 201<br />
information gaps, 203<br />
key constraints, 201–2<br />
looking forward, 203–4<br />
<strong>risk</strong> assessment in, 65, 67b, 122<br />
<strong>risk</strong> planning in, 74<br />
sea-level rise in, 3f<br />
water supply in, 121<br />
Jakarta Building Control and Monitoring<br />
Offi ce (Penataan dan Pengawasan<br />
Bangunan), 212<br />
Jakarta Coastal Defense Strategy (JCDS), 212<br />
Jakarta Coastal Sea Defense, 202, 207<br />
“Jakarta Flood Hazard Mapping<br />
Framework,” 212<br />
Jakarta Urgent Flood Mitigation Project<br />
(JUFMP), 212<br />
Jamaica, <strong>risk</strong> fi nancing in, 170<br />
Jamii Bora Trust Low Cost Housing<br />
Scheme, 120<br />
Japan<br />
earthquakes in, 8<br />
fl ood exposure in, 143<br />
Japan International Cooperation Agency, 71<br />
Jardim Ana Maria slum (São Paulo), 33–34b<br />
Jardim Romano neighborhood (São<br />
Paulo), 246<br />
Jatiluruh reservoir (Indonesia), 202<br />
Java earthquake (2006), 171<br />
Java Reconstruction Fund, 172<br />
JCDS (Jakarta Coastal Defense Strategy), 212<br />
job creation programs, 167–68<br />
John A. Blume Earthquake Engineering<br />
Center, 145<br />
Joint Implementation (Kyoto Protocol), 110<br />
Jollands, N., 132<br />
JUFMP (Jakarta Urgent Flood Mitigation<br />
Project), 212<br />
Juneja, Shefali, 128<br />
K<br />
Kamal Muara neighborhood (Jakarta), 19<br />
Kampala (Uganda), fl ooding in, 44<br />
Kampung Melayu slum (Jakarta),<br />
91, 93–94b
Kantor Asisten Pembangunan dan<br />
Lingkungan Hidup (Asbang,<br />
Jakarta), 206<br />
Karachi (Pakistan)<br />
capacity building in, 87<br />
water supply and sanitation in, 163–64<br />
Karnataka (India), carbon revenue<br />
in, 165–66<br />
Karnataka Municipal Water Energy<br />
Effi ciency Project, 166<br />
Karnataka Urban Infrastructure<br />
Development and Finance<br />
Corporation (KUIDFC), 166<br />
Kathmandu (Nepal), slums in, 37b<br />
Kebede, Abiy S., 195<br />
Kelurahan Empowerment Initiative, 74<br />
Kenya, housing fi nance in, 120<br />
Kibera slum (Nairobi), 30, 32, 42<br />
KICAMP (Kinondoni Integrated Coastal<br />
Area Management Project), 183, 190<br />
Kien Giang (Vietnam), urban upgrading<br />
in, 167<br />
Kinondoni Integrated Coastal Area<br />
Management Project (KICAMP),<br />
183, 190<br />
knowledge sharing and training, 151–54<br />
Asian Cities Climate Change Resilience<br />
Network (ACCRN), 153–54<br />
Climate Resilient Cities Primer, 154<br />
ICLEI and, 153<br />
ISO 31000, 154<br />
least developing countries, capacity<br />
strengthening of, 153<br />
Kolkata (India), fl oods in, 142<br />
Korea, fl ood management in, 75<br />
Kota Tua (Indonesia), 212<br />
Kovats, S., 130<br />
KUIDFC (Karnataka Urban Infrastructure<br />
Development and Finance<br />
Corporation), 166<br />
Kyoto Protocol (2005), 110, 165, 188<br />
L<br />
LACE (Liberia Agency for Community<br />
Empowerment), 168<br />
land-based revenues, 104–5<br />
landfi lls, 116b<br />
landslides, 19–20, 29, 263<br />
Land Use Change and Forestry<br />
(São Paulo), 266<br />
land-use planning, policy tradeoff s in, 76–77<br />
INDEX ■ 287<br />
Latin America. See also specifi c countries<br />
drowning in, 18<br />
earthquake exposure in, 144<br />
slums in, 37–38b<br />
Law 14459/07 on solar water systems (São<br />
Paulo), 264–65<br />
Least Developed Countries Fund, 134<br />
LECZ (Low Elevation Coastal Zones), 1f, 15<br />
Legislative Assembly (Mexico City), 223<br />
leptospirosis, 245<br />
Liberia<br />
natural <strong>disaster</strong>s in, 167–68<br />
solid-waste disposal in, 46<br />
Liberia Agency for Community<br />
Empowerment (LACE), 168<br />
LIDAR (light detection and ranging)<br />
technology, 73<br />
LINGAP Foundation, 118b<br />
literature review, 125–39<br />
adaptation and mitigation of <strong>climate</strong><br />
<strong>change</strong>, 132–34<br />
<strong>climate</strong> <strong>change</strong> and <strong>disaster</strong> <strong>risk</strong> reduction<br />
(DRR), 128–29<br />
fi nance and, 134<br />
gaps in existing literature, 134–35<br />
housing, 131–32<br />
service delivery, 129–31<br />
urban poverty, 128–31<br />
“Live Green Toronto” project, 74<br />
Local Development Program (PRODEL), 120<br />
Local Emergency Management Group<br />
(NUDEC, São Paulo), 244, 261<br />
Local Resilience Action Plan (LRAP), 68b, 74,<br />
121, 155<br />
London<br />
<strong>climate</strong> <strong>change</strong> adaptation in, 72<br />
urban planning in, 70<br />
Los Angeles, emissions trading systems<br />
in, 117b<br />
Louisiana, oil spill in, 173<br />
Low Elevation Coastal Zones (LECZ), 1f, 15<br />
LRAP. See Local Resilience Action Plan<br />
lurah (urban ward leader), 86, 94n4<br />
Luzon (Philippines), <strong>risk</strong> identifi cation<br />
in, 156<br />
M<br />
Mahila Milan groups, 157–58<br />
Makoko slum (Lagos), 40–41<br />
maladaptation to <strong>climate</strong> <strong>change</strong>, 55–57,<br />
149–50
288 ■ INDEX<br />
malaria<br />
<strong>climate</strong> <strong>change</strong> and, 49<br />
drought and, 20<br />
fl oods and, 44, 192<br />
health services for, 130<br />
public health and, 48<br />
in slums, 18<br />
MAMC (Metropolitan Area of<br />
Mexico City), 217<br />
Managing Disaster Risk in Emerging<br />
Economies (<strong>World</strong> Bank), 128–29<br />
Manchester study, 75<br />
Mancomunidad de los Municipios del<br />
Centro de Atlantida (MAMUCA),<br />
159<br />
Mandaue (Philippines), building-backbetter<br />
in, 171<br />
Mangalore (India), water effi ciency<br />
project in, 166<br />
Manila (Philippines)<br />
<strong>climate</strong> <strong>change</strong> vulnerability of, 144<br />
fl ooding costs in, 100<br />
as “hotspot” city, 132<br />
Multi-Hazard City Risk Index for, 145<br />
water distribution in, 117, 118–19b<br />
Manila Water Company, 117, 118b<br />
Manizales (Colombia)<br />
insurance in, 110<br />
<strong>risk</strong> management in, 168–69<br />
mapping<br />
of fl ood <strong>risk</strong>s, 72<br />
of hazards exposure, 254–55<br />
of landslides, 263<br />
for <strong>risk</strong> assessment, 65, 169, 184<br />
for vulnerability, 157–58<br />
Marikina City (Philippines), fl ood<br />
management in, 75<br />
Mark, O., 130<br />
Marmara earthquake (1999), 71<br />
Mayniland Water Services, 117, 118b<br />
Mayor’s Task Force (Mexico City), 217<br />
Mayor’s Task Force (São Paulo), 236, 237<br />
Mayor’s Task Force on Climate Change,<br />
Disaster Risk and the Urban Poor,<br />
9, 65, 66–67b<br />
MCCAP. See Mexico City Climate<br />
Action Program<br />
MCMA. See Mexico City Metropolitan Area<br />
MDBs (multilateral development banks),<br />
105–8, 110<br />
MDGs (Millennium Development Goals), 39<br />
Médecins San Frontières, 118b<br />
megacities, 1f, 77, 143<br />
Mehrotra, S., 128<br />
meningitis, 20<br />
Mercy Corps, 121, 167<br />
methane gas capture projects, 164–65<br />
Metrobus system (Mexico City), 222<br />
Metropolitan Area of Mexico City<br />
(MAMC), 217<br />
Metropolitan Housing Company of São<br />
Paulo (COHAB), 260, 265<br />
Mexico. See also Mexico City<br />
<strong>climate</strong> <strong>change</strong> fi nancing in, 105, 107b<br />
Development Policy Loan for, 106<br />
MultiCat Program in, 109, 109b<br />
public transport projects in, 133<br />
Urban Transport Transformation<br />
Program, 105, 107b<br />
Mexico City, 217–33. See also Mexico City<br />
Metropolitan Area<br />
action plans in, 68–69b<br />
administrative units in, 86<br />
case study summary, 11, 220–33<br />
agency <strong>risk</strong> management, 227<br />
built environment and service<br />
provision, 222–23<br />
city profi le, 220–21f, 220–22, 222t<br />
<strong>climate</strong> <strong>change</strong> adaptation, 224–27<br />
<strong>disaster</strong> <strong>risk</strong> management, 225–27,<br />
226–27t<br />
economic costs of <strong>climate</strong> <strong>change</strong>,<br />
232–33, 232t<br />
hazards assessment, 15, 227–30<br />
institutional assessment, 223–27,<br />
224–25t<br />
natural <strong>disaster</strong> history, 227–28, 228t<br />
precipitation, 229, 230f<br />
socioeconomic assessment, 230–33, 231t<br />
temperature, 228–29, 229f<br />
trends and projections, 228–30<br />
urban poor, exposure of, 231–33, 232t<br />
urban poor, location of, 230–31, 230t<br />
water runoff , 229–30<br />
<strong>climate</strong>-<strong>change</strong> strategy in, 88<br />
Climate Summit for Mayors and, 9<br />
overview and key fi ndings, 217–19<br />
government at work, 218<br />
key constraints, 219<br />
looking forward, 219<br />
natural hazards, vulnerability<br />
to, 218
isk assessment in, 65, 67b, 122<br />
vulnerable households in, 31–32b<br />
water supply in, 45b, 48<br />
Mexico City Climate Action Program<br />
(MCCAP), 69b, 218, 219, 223–24,<br />
226–27<br />
Mexico City Climate Change Adaptation<br />
Program, 217<br />
Mexico City Metropolitan Area (MCMA),<br />
21b, 220–21, 221f, 223, 229, 231<br />
Mexico Urban Transport Transformation<br />
Program, 107b<br />
MHCRI (Multi-Hazard City Risk Index),<br />
145–46<br />
Miami, fl oods in, 142, 143<br />
Mibanco, 119–20<br />
microfi nance, 110, 119–20<br />
Microsoft , volunteer technology community<br />
participation of, 173<br />
Millennium Development Goals<br />
(MDGs), 39<br />
Millennium Project (2005), UN, 102<br />
Mindanao (Philippines), <strong>risk</strong> identifi cation<br />
in, 156<br />
mitigation of <strong>climate</strong> <strong>change</strong>, 128, 132–34,<br />
160–68, 173. See also adaptation to<br />
<strong>climate</strong> <strong>change</strong><br />
Mitlin, D., 131<br />
Mobility 2001 (<strong>World</strong> Business Council for<br />
Sustainable Development), 130<br />
Mobility 2030 (<strong>World</strong> Business Council for<br />
Sustainable Development), 130<br />
Mogeiro Plaza (São Paulo), 116b<br />
Mombasa (Kenya)<br />
religious organizations in, 87<br />
sea level and, 19<br />
social networks in, 54<br />
Mooca neighborhood (São Paulo), 246<br />
Morocco, public transport in, 133<br />
Moser, Caroline, 9, 127, 128, 131<br />
Mozambique, urban upgrading in, 161–62<br />
MTF study, 201<br />
Mtoni solid-waste dumpsite (Dar es<br />
Salaam), 46, 184<br />
MultiCat Program, 109<br />
Multi-Hazard City Risk Index (MHCRI),<br />
145–46<br />
multilateral development banks (MDBs),<br />
105–8, 110<br />
Multilateral Investment Guarantee<br />
Agency, 110<br />
INDEX ■ 289<br />
Mumbai (India)<br />
“chawls” in, 30<br />
<strong>disaster</strong>-management plan in, 51<br />
fl oods in, 40, 142<br />
houses in, 54<br />
informal settlements in, 52b<br />
slums in, 28, 32, 34<br />
water supply in, 42<br />
Munich Re Group, 143<br />
Municipal Climate Law (Brazil), 262, 263–64<br />
Municipal Development Project<br />
(<strong>World</strong> Bank), 161<br />
Mysore (India), water effi ciency<br />
project in, 166<br />
My Th o (Vietnam), urban upgrading in, 167<br />
N<br />
Nagoya (Japan), fl oods in, 143<br />
Nam Dinh (Vietnam), urban upgrading<br />
in, 167<br />
NAPA (National Adaptation Programme of<br />
Action, Tanzania), 189<br />
NAP-DRR. See National Action Plan for<br />
Disaster Risk Reduction<br />
NASA, volunteer technology community<br />
participation of, 173<br />
NatCat database, 143<br />
National Action Plan for Disaster Risk<br />
Reduction (NAP-DRR, Indonesia),<br />
207, 208, 210<br />
National Adaptation Programme of Action<br />
(NAPA, Tanzania), 189<br />
National Autonomous University of Mexico<br />
(UNAM), 218<br />
National Capital Region (Delhi), 48<br />
National Community Empowerment<br />
Program (PNPM, Indonesia), 88, 214<br />
National Disaster Management Prevention<br />
Strategy (Bangladesh), 88<br />
National Emergency Management Agency<br />
(Brazil), 244, 261<br />
National Environmental Act (Tanzania), 185<br />
National Environmental Policy (Tanzania),<br />
185, 188<br />
National Human Settlements Development<br />
policy (Tanzania), 188<br />
National Hygiene Department (Senegal), 163<br />
National Spatial Research Institute<br />
(Brazil), 255<br />
National Trust for Infrastructure<br />
(Mexico), 107b
290 ■ INDEX<br />
National Urban Upgrading Programs<br />
(VUUP, Vietnam), 166–67<br />
Natural Disaster Hotspots: A Global Risk<br />
Analysis (Dilley et al.), 131<br />
Natural Hazards, UnNatural Disasters<br />
(<strong>World</strong> Bank and UN), 9<br />
Neglected Tropical Diseases (NTDs), 185<br />
Netherlands, fl ood exposure in, 143<br />
New Orleans, fl oods in, 142, 143<br />
New York City<br />
action plans in, 68–69b<br />
Climate Change Adaptation Task Force,<br />
68–69b<br />
fl oods in, 142, 143<br />
urban planning in, 70<br />
NGOs. See nongovernmental organizations<br />
Nicaragua, microfi nance in, 120<br />
Nicholls, R. J., 82, 131, 195<br />
Nigeria, slums in, 40–41<br />
Ningbo (China), Multi-Hazard City Risk<br />
Index for, 145<br />
NMBG, Ltd., 145<br />
noncommunicable diseases, 49, 59n14<br />
nongovernmental organizations (NGOs)<br />
basic services delivery and, 39, 40<br />
community organizations and, 162–63<br />
<strong>disaster</strong> response and, 51<br />
environmental health interventions<br />
and, 92<br />
Jakarta case study and, 200–201, 209, 214<br />
mapping and data gathering and, 157<br />
microfi nance and, 119<br />
<strong>risk</strong> assessment and, 65<br />
<strong>risk</strong> identifi cation and, 156<br />
São Paulo case study and, 237, 262<br />
security of tenure and, 52<br />
urban poor and, 86<br />
water distribution and, 117,<br />
118–19b, 121<br />
North Africa<br />
<strong>climate</strong> <strong>change</strong> adaptation in, 102<br />
<strong>disaster</strong> management in, 50<br />
Norway, <strong>climate</strong> <strong>change</strong> and, 190–91<br />
NTDs (Neglected Tropical Diseases), 185<br />
NUDEC (Local Emergency Management<br />
Group, São Paulo), 244, 261<br />
O<br />
O’Brien, G., 128<br />
Olvera, Lourdes Diaz, 130–31<br />
Operation Clean Stream (São Paulo), 265<br />
Orangi Pilot Project Research and Training<br />
Institute (OPP-RTI), 163–64<br />
Organisation for Economic Co-operation<br />
and Development (OECD), 128,<br />
141–43, 144<br />
Osaka-Kobe (Japan), fl oods in, 142, 143<br />
Ouagadougou (Burkina Faso), solid-waste<br />
disposal in, 46<br />
output-based aid (OBA), 120<br />
“owner-driven development,” 171<br />
Oxfam, 51<br />
P<br />
Pakistan<br />
basic service delivery in, 39<br />
capacity building in, 87<br />
fl ooding in, 8, 173<br />
water supply and sanitation in, 163–64<br />
PALYJA (water utility), 121<br />
Panama, drawdown options in, 170<br />
Parikh, H., 129–30<br />
Parikh, P., 129–30<br />
Paris<br />
<strong>climate</strong> model projections for, 82<br />
heat waves in, 20<br />
Parkinson, J., 130<br />
Parque La Aguada (Santiago), 75–76<br />
partial credit guarantee (PCG), 110<br />
Peduzzi, P., 131<br />
Pelling, Mark, 131<br />
Pemprov (Provincial Government,<br />
Jakarta), 200<br />
Penataan dan Pengawasan Bangunan<br />
(Jakarta Building Control and<br />
Monitoring Offi ce), 212<br />
PET (plastic pluviometers), 245<br />
Philippines<br />
cyclones in, 17<br />
fl ood management in, 75<br />
grass roots organizations in, 155–57<br />
housing fi nance in, 120<br />
informal settlements in, 40, 41t<br />
local partnerships in, 91<br />
public transport in, 133<br />
technical assistance programs in, 154<br />
Philippines Homeless People’s Federation<br />
(PHPF), 91, 155–56<br />
Phnom Penh (Cambodia), fl oods in, 44–45<br />
Pilot Project Research and Training<br />
Institute, 87<br />
Planning Secretariat (São Paulo), 255
Plan Verde (Green Plan), 222, 223<br />
plastic pluviometers (PET), 245<br />
PNPM (Program Nasional Pemberdayaan<br />
Masyarakat, Indonesia), 88, 214<br />
“Pobreza Urbana y Cambio Climático<br />
para la Ciudad de Mexico” (Mexico<br />
City case study document), 217<br />
Port-au-Prince (Haiti)<br />
rebuilding in, 107<br />
roads in, 47<br />
port cities, 141–43, 142t. See also coastal<br />
areas and cities<br />
Porte Alegre (Brazil), housing program<br />
in, 105<br />
Port Vila (Vanuatu), potable water in, 117<br />
Poverty and Climate Change: Reducing<br />
Vulnerability of the Poor through<br />
Adaptation (<strong>World</strong> Bank et al.),<br />
127–28<br />
poverty and poverty reduction. See also<br />
pro-poor programs<br />
<strong>disaster</strong> reduction and, 128–29<br />
literature review of, 128–31<br />
pro-poor adaptation and, 127<br />
PPPs (public-private partnerships), 116–17<br />
“preventive advocacy” approach to health<br />
services, 92<br />
private sector fi nancing, 115–20<br />
PRODEL (Local Development<br />
Program), 120<br />
program experiences. See project and<br />
program experiences<br />
Program Nasional Pemberdayaan<br />
Masyarakat (PNPM), 214<br />
project and program experiences, 149–80<br />
building-back-better, 170–73<br />
community-based institutions<br />
and, 171–72<br />
Volunteer Technology Communities<br />
and, 172–73<br />
early-warning systems, 158–60<br />
asset security improvement, 159–60<br />
dialogue promotion and response<br />
coordination, 158–59<br />
knowledge sharing and training, 151–54<br />
Asian Cities Climate Change<br />
Resilience Network (ACCRN),<br />
153–54<br />
Climate Resilient Cities Primer, 154<br />
ICLEI and, 153<br />
ISO 31000, 154<br />
INDEX ■ 291<br />
least developing countries, capacity<br />
strengthening of, 153<br />
lessons learned and recommendations<br />
from, 173–76, 174–76t<br />
mitigation, 160–68<br />
carbon revenues and, 165–66<br />
community organizations, NGOs, and<br />
government agencies, 162–63<br />
fl ood management and urban planning,<br />
160–63<br />
government–civil society partnerships<br />
and, 163–64<br />
government support and, 160–61<br />
job creation and, 167–68<br />
natural <strong>disaster</strong>s, reducing vulnerability<br />
to, 167–68<br />
neighborhood upgrading and, 166–67<br />
urban adaptation and <strong>climate</strong> mitigation,<br />
164–65<br />
urban upgrading and, 161–62<br />
wastewater management and energy,<br />
164–65<br />
water supply and energy effi ciency,<br />
165–66<br />
water supply and sanitation, 163–64<br />
<strong>risk</strong> defl ection, 168–70<br />
<strong>disaster</strong>-induced emergency<br />
funding, 170<br />
insurance, self and community-based, 168<br />
post-<strong>disaster</strong> relief and reconstruction,<br />
169<br />
<strong>risk</strong> fi nancing, 170<br />
<strong>risk</strong> management innovation,<br />
168–69<br />
<strong>risk</strong> identifi cation, 155–58<br />
grass roots organizations and, 155–57<br />
Local Resilience Action Plan<br />
(LRAP), 155<br />
mapping and data gathering, 157–58<br />
<strong>risk</strong> management, 151, 152f, 168–69<br />
property formalization, 189<br />
Pro-Poor Adaptation to Climate Change in<br />
Urban Centers (<strong>World</strong> Bank),<br />
125–26, 133<br />
pro-poor programs, 127, 191, 209, 209t,<br />
246. See also poverty and poverty<br />
reduction<br />
Protecting Health from Climate Change<br />
(<strong>World</strong> Health Organization), 130<br />
Provincial Government (Pemprov,<br />
Jakarta), 200
292 ■ INDEX<br />
public-private partnerships (PPPs),<br />
116–17, 133<br />
Public Safety Agency (Mexico City), 224<br />
Public Security Ministry (Mexico City), 226<br />
Q<br />
Quelimane City (Mozambique)<br />
local partnerships in, 91–92<br />
urban upgrading in, 161–62<br />
Quelimane City Council (Mozambique), 162<br />
Quito (Ecuador)<br />
<strong>climate</strong> <strong>change</strong> strategy in, 72–73<br />
urban planning in, 70<br />
R<br />
“raft culture” techniques, 190<br />
rainwater-harvesting systems, 53<br />
Random Hacks of Kindness (RHoK), 173<br />
RBF (results-based fi nancing), 120–21<br />
reconstruction projects, 170–73<br />
Red Cross, 51, 159<br />
REDD+ aff orestation, 73<br />
Regional Administration and Local<br />
Government Ministry (Tanzania), 86<br />
Regional Greenhouse Gas Initiative<br />
(US), 117b<br />
“rent allowance,” 87<br />
rent control, 29, 58n3<br />
research centers and universities, 89<br />
Resettlement and Monitoring Task<br />
Force, 156<br />
resilience for urban poor. See urban poor,<br />
building resilience for<br />
Resilient Cities program (<strong>World</strong> Bank), 145<br />
results-based fi nancing (RBF), 120–21<br />
reverse 911, 88<br />
RHoK (Random Hacks of Kindness), 173<br />
Rio de Janeiro (Brazil), landslides in, 19<br />
<strong>risk</strong> assessment. See <strong>disaster</strong>s and <strong>disaster</strong><br />
<strong>risk</strong> assessment<br />
Risk Atlas, 227<br />
<strong>risk</strong> defl ection, 168–70. See also <strong>disaster</strong><br />
<strong>risk</strong> reduction<br />
<strong>risk</strong> identifi cation, 155–58. See also <strong>disaster</strong>s<br />
and <strong>disaster</strong> <strong>risk</strong> assessment<br />
<strong>risk</strong>-management instruments, 108–10,<br />
111–14t<br />
roads, 46–47. See also transportation sector<br />
robust decision making, 83–86, 85b<br />
Rockefeller Foundation, 153<br />
Roots and Shoots (organization), 190<br />
Rotterdam (Netherlands)<br />
fl oods in, 143<br />
sea defense strategy and, 212<br />
urban planning in, 70<br />
runoff reduction, 75<br />
S<br />
SABESP (São Paulo State Sanitation<br />
Utility), 263<br />
Safer Homes, Stronger Communities (Jha), 131<br />
safety nets, 88<br />
SAGUA-PAC (Bolivian cooperative), 165<br />
St. Kitts & Nevis, <strong>risk</strong> fi nancing in, 170<br />
Saint Louis (Senegal), community<br />
organizations and NGOs in, 162–63<br />
St. Lucia, <strong>risk</strong> fi nancing in, 170<br />
St. Vincent & the Grenadines, <strong>risk</strong><br />
fi nancing in, 170<br />
salt-water intrusion, 19<br />
Sanchez-Rodriguez, Roberto, 128<br />
sand-bagging, 51<br />
San Francisco, natural hazard <strong>risk</strong> in, 143<br />
sanitation. See also drainage<br />
<strong>climate</strong> mitigation and, 164–65<br />
<strong>disaster</strong> <strong>risk</strong> and, 41–44, 43b, 44f<br />
service delivery and, 129–30<br />
water supply and, 163–64<br />
San Salvador (El Salvador), slums in, 132<br />
Santa Cruz de la Sierra (Bolivia), <strong>climate</strong><br />
mitigation in, 164–65<br />
Santiago de Chile<br />
emissions trading systems in, 117b<br />
fl ood management in, 75<br />
Santiago Inner Ring Initiative, 75<br />
São Francisco Global Urban Plan, 264<br />
São João Landfi ll (São Paulo), 237<br />
São Paulo (Brazil), 235–68<br />
administrative units in, 86<br />
carbon-fi nance revenues in, 115, 116b<br />
case study summary, 11, 239–67<br />
built environment and basic services,<br />
242–44<br />
carbon credits, 265<br />
carbon footprint, 266–67<br />
city profi le, 239–40f, 239–42, 240t<br />
<strong>climate</strong> hazards, 248–49, 248f<br />
<strong>climate</strong> issues and policy approach,<br />
263–64<br />
<strong>climate</strong> projections, 249–51, 250t<br />
<strong>climate</strong> smart practices, 260–62<br />
constraints, 262–63
<strong>disaster</strong>-related programs or<br />
decrees, 245<br />
<strong>disaster</strong> <strong>risk</strong> management, 244–46<br />
Ecofrota Program, 264<br />
greenhouse gas emissions, 237,<br />
243f, 267f<br />
hazards assessment, 246–54, 252–53t<br />
hazards exposure, 251–57, 256f<br />
Headwaters Program, 265–66<br />
institutional assessment, 244–46<br />
legal framework, 263<br />
linear parks, 244, 246, 260–61, 265<br />
natural <strong>disaster</strong>s, 246–47, 247t<br />
Operation Clean Stream, 265<br />
opportunities, 263–66<br />
poverty, addressing, 261–62<br />
pro-poor services, 246<br />
São Francisco Global Urban Plan, 264<br />
slum characteristics, 257–60<br />
Social Partnership Program, 266<br />
social vulnerability index, 241f, 257<br />
socioeconomic assessment,<br />
254–67, 254t<br />
solar water systems, 264–65<br />
sustainable building projects, 265<br />
transport fl eet, 264<br />
transport use, 242, 243f, 244<br />
urban poor, location of, 257, 258f,<br />
259t, 260t<br />
Climate Summit for Mayors and, 9<br />
geotechnical hazard areas in, 35b<br />
landslides in, 19<br />
metro in, 104<br />
overview and key fi ndings, 235–38<br />
areas for improvement, 237–38<br />
government at work, 237<br />
looking forward, 238<br />
<strong>risk</strong> assessment and management in,<br />
65, 87, 122<br />
sanitation in, 42<br />
slums in, 33–34b, 34<br />
topography and waterways of, 7f<br />
São Paulo Housing Secretariat, 235<br />
São Paulo Secretaria Municipal de<br />
Planejamento (SEMPLA), 255<br />
São Paulo State Sanitation Utility<br />
(SABESP), 263<br />
Satterthwaite, David, 131<br />
Satuan Tugas Koordinasi dan Pelaksana<br />
(SATKORLAK, Indonesian <strong>disaster</strong><br />
<strong>risk</strong> management board), 206–7, 208<br />
INDEX ■ 293<br />
Save the Children Fund, 51<br />
Save the Marikina River program, 75<br />
sea-level rise, 1f, 3f, 17, 19, 82, 83–84<br />
security of tenure<br />
basic services delivery and, 39<br />
slums and, 28<br />
urban poor, vulnerability of, 51–53<br />
SEHAB. See City Housing Secretariat<br />
semaforos ambientales (environmental<br />
traffi c lights), 169<br />
SEMPLA (São Paulo Secretaria Municipal<br />
de Planejamento), 255<br />
Senegal, community organizations and<br />
NGOs in, 162–63<br />
Seoul (Korea), fl ood management<br />
in, 76<br />
service delivery<br />
carbon revenue and, 165–66<br />
<strong>disaster</strong> <strong>risk</strong> and, 38–51, 64, 86–89<br />
literature review and, 129–31<br />
policy tradeoff s of, 77<br />
public-private partnerships and, 133<br />
results-based fi nancing for, 121<br />
urban poor and, 129–31<br />
sewage. See sanitation<br />
Shanghai (China), fl oods in, 142<br />
Shaping Climate Resilient Development—<br />
A Framework for Decision-making<br />
(ECA), 133<br />
Shared Learning Dialogue (SLD), 154<br />
shelter. See housing<br />
SLD (Shared Learning Dialogue), 154<br />
Slum Networking Project “Parivartan,” 119<br />
slums. See also informal settlements;<br />
squatter settlements<br />
community organization partnerships<br />
in, 94<br />
<strong>disaster</strong>s and, 51<br />
formation of, 29–30, 58n2<br />
inner-city, 29<br />
peri-urban, 30, 47<br />
policy tradeoff s and, 77, 81<br />
prevention of new, 76<br />
public-private partnerships and, 117<br />
public transportation and, 47<br />
<strong>risk</strong> assessment for, 87<br />
scattered pockets, 29–30<br />
social networks in, 53–54<br />
upgrading of, 100, 102–3, 104, 107, 119<br />
urban planning and, 70<br />
water supply to, 33, 118–19b
294 ■ INDEX<br />
SME (City Education Secretariat, São<br />
Paulo), 263<br />
SMS messages, 91, 94b, 208<br />
Social Assistance Institute (Mexico City), 224<br />
Social Development Agency (Mexico<br />
City), 224<br />
Social Dimensions of Climate Change<br />
(Mearns & Norton), 127, 133<br />
social networks, 51, 53–54<br />
Social Partnership Program (São Paulo), 266<br />
Social Vulnerability Index, 257<br />
solar water systems, 264–65<br />
solid-waste disposal, 33, 45–46. See also<br />
sanitation<br />
South Asia<br />
cyclones in, 17<br />
drowning in, 18<br />
safe water in, 8<br />
slums in, 37–38b<br />
urban populations in, 12<br />
volcanoes in, 20<br />
Spain<br />
building design in, 82<br />
fl ood management in, 75<br />
Spatial Analysis of Natural Hazard and<br />
Climate Change Risks in Periurban<br />
Expansion Areas of Dakar, Senegal<br />
(Hoff man), 131<br />
SPDMI (Strategic Plan for Disaster Mitigation<br />
in Istanbul), 71–72<br />
Special Capital District (DKI, Jakarta),<br />
200–201, 204, 207, 210, 212, 214<br />
Special Climate Change Fund, 134<br />
Special Fund for the Environment and<br />
Sustainable Development, 237<br />
Special Interest Areas, 34b<br />
Special Report on Emissions Scenarios<br />
(SRES), 194<br />
SP Trans (São Paulo), 264<br />
squatter settlements. See also informal<br />
settlements; slums<br />
eviction and, 39<br />
fl ooding of, 37b<br />
public transportation and, 47<br />
slums and, 29–30, 58n4<br />
solid-waste disposal in, 37–38b<br />
SRES (Special Report on Emissions<br />
Scenarios), 194<br />
stakeholders<br />
action plans and, 68–69b<br />
<strong>risk</strong> assessment and, 64, 65, 67b<br />
Stanford University, 145<br />
State of the <strong>World</strong>: Our Urban Future<br />
(<strong>World</strong> Watch Institute), 9, 125–26,<br />
127, 129, 131, 168<br />
State of the <strong>World</strong>’s Cities (UN-HABITAT), 131<br />
Stern Report (2007), 134<br />
Strategic Plan for Disaster Mitigation in<br />
Istanbul (SPDMI), 71–72<br />
Strategic Urban Development Plan<br />
(SUDP), 188<br />
Sub-Saharan Africa<br />
drought in, 20<br />
safe water in, 8<br />
SUDP (Strategic Urban Development<br />
Plan), 188<br />
Summer Rainfall Operation (São Paulo),<br />
87, 244, 245<br />
Sustainable Building Project (São Paulo), 265<br />
Sustainable Dar es Salaam Project, 188<br />
SVMA. See Green and Environment<br />
Secretariat<br />
Swisscontact, 215<br />
T<br />
Tampa-St Petersburg (Florida), fl oods<br />
in, 143<br />
Tan Hoa-Lo Gom Canal (Vietnam), 167<br />
Tanzania. See also Dar es Salaam<br />
cholera in, 48–49<br />
urban planning in, 160–61<br />
Tanzania Marine Park authorities, 190<br />
Tanzania Meteorological Agency (TMA),<br />
182, 184, 188<br />
taxes<br />
government revenues through, 104<br />
insurance and, 168–69<br />
TCIP (Turkish Catastrophic Insurance<br />
Pool), 169<br />
technical assistance programs, 107, 108t,<br />
121, 154<br />
Technological Research Institute (IPT),<br />
251, 252, 254–55<br />
Temeke municipality (Dar es Salaam), 42<br />
tenure, security of. See security of tenure<br />
text messages. See SMS messages<br />
Th ailand<br />
Asian Cities Climate Change Resilience<br />
Network in, 154<br />
housing fi nance in, 120<br />
public transport in, 133<br />
TMA. See Tanzania Meteorological Agency
Tokyo (Japan)<br />
emissions trading systems in, 117b<br />
fl oods in, 143<br />
natural hazard <strong>risk</strong> in, 143<br />
Toronto (Canada)<br />
urban planning in, 70<br />
wet weather fl ow master plan in,<br />
73–74<br />
Traffi c Engineering Company (CET), 255<br />
Train Management Agency (CPTM, São<br />
Paulo), 242<br />
TransJakarta Busway, 205<br />
transportation sector<br />
<strong>climate</strong> <strong>change</strong> mitigation and, 133<br />
<strong>disaster</strong> <strong>risk</strong> and, 46–47<br />
low-carbon urban programs in, 107b<br />
policy tradeoff s and, 81<br />
urban poor and, 130–31<br />
Tra Vinh (Vietnam), urban upgrading in, 167<br />
Trinidad & Tobago, <strong>risk</strong> fi nancing in, 170<br />
Tunis (Tunisia), action plans for, 102<br />
Turkey<br />
<strong>disaster</strong> management in, 50<br />
post-<strong>disaster</strong> relief and reconstruction<br />
in, 169<br />
Turkish Catastrophic Insurance Pool<br />
(TCIP), 169<br />
Turks & Caicos Islands, <strong>risk</strong> fi nancing<br />
in, 170<br />
Typhoon Frank (2008), 91, 156<br />
U<br />
UBS (basic health units), 245<br />
Uchoraji na Ramani na Sanaa Shirikishi<br />
Dhidi ya Ukimwi (URASU), 190<br />
UNAM (National Autonomous University<br />
of Mexico), 218<br />
uncertainty in <strong>risk</strong> reduction, 81–84<br />
UNEP. See United Nations Environmental<br />
Programme<br />
UNFCCC. See United Nations Framework<br />
Convention on Climate Change<br />
UN-HABITAT<br />
on housing, 131<br />
local partnerships and, 92<br />
<strong>risk</strong> assessment and, 65, 66b<br />
slum estimates by, 58n2<br />
urban upgrading and, 161–62<br />
UNICEF, 92, 162<br />
United Kingdom Climate Impacts<br />
Programme, 74<br />
INDEX ■ 295<br />
United Nations<br />
on <strong>climate</strong> <strong>change</strong>, 128<br />
cook stoves and, 48<br />
United Nations Environmental Programme<br />
(UNEP), 65, 66b, 105, 127, 149<br />
United Nations Framework Convention on<br />
Climate Change (UNFCCC), 110,<br />
115, 134, 188, 189, 237<br />
United States<br />
emissions-trading schemes in, 117b<br />
fl ood exposure in, 143<br />
migration to, 168<br />
universities and research centers, 89<br />
University of Dar es Salaam, 182<br />
URA. See Urban Risk Assessment<br />
URASU (Uchoraji na Ramani na Sanaa<br />
Shirikishi Dhidi ya Ukimwi), 190<br />
Urban Development and Housing Agency<br />
(Mexico City), 224<br />
Urban Flood Prevention and Drainage<br />
Project (Argentina), 159<br />
urbanization<br />
cities. See urbanization; urban poor,<br />
building resilience for; urban poor,<br />
vulnerability of<br />
<strong>climate</strong> <strong>change</strong> and, 125–27<br />
earthquake exposure and, 144<br />
exposure and, 141–47<br />
policy tradeoff s and, 81<br />
urban poor, building resilience for, 8, 63–97.<br />
See also urban poor, vulnerability of<br />
basic services delivery and <strong>disaster</strong> <strong>risk</strong><br />
reduction and, 64, 86–89<br />
capacity building and, 89, 90t<br />
successful examples of, 87–89<br />
decision making and action planning,<br />
64–70<br />
action planning and, 65, 68–69b, 68–70<br />
<strong>risk</strong> assessment and, 64–65, 66–67b<br />
key messages, 63<br />
local solutions, cooperation for, 64,<br />
89–94<br />
<strong>risk</strong> reduction and poverty reduction,<br />
64, 76–86<br />
<strong>climate</strong> sensitivity and, 82–83, 83t<br />
decision making and, 81, 83–86,<br />
84–85b<br />
policy tradeoff s and, 77–81, 78–80t<br />
uncertainty and, 81–84<br />
urban planning and management and,<br />
64, 70–76
296 ■ INDEX<br />
urban poor (continued)<br />
<strong>climate</strong> <strong>change</strong> adaptation in<br />
London, 72<br />
<strong>climate</strong> <strong>change</strong> mainstreaming in<br />
Halifax, 73<br />
<strong>climate</strong> <strong>change</strong> strategy in Quito, 72–73<br />
<strong>disaster</strong> <strong>risk</strong> reduction in Istanbul, 71–72<br />
green infrastructure and ecological<br />
services and, 74–76<br />
<strong>risk</strong> planning in Jakarta, 74<br />
wet weather fl ow master plan in<br />
Toronto, 73–74<br />
urban poor, vulnerability of, 8, 27–62. See also<br />
urban poor, building resilience for<br />
ad hoc adaptation and <strong>risk</strong> of<br />
maladaptation, 53, 55–57, 56–57t<br />
<strong>disaster</strong> <strong>risk</strong> and basic services delivery,<br />
38–51, 41t<br />
drainage, 44–45<br />
emergency services, 49–51<br />
energy, 47–48<br />
public and environmental health, 48–49<br />
roads and transport, 46–47<br />
shelter, 39–41<br />
solid waste, 45–46<br />
water supply and sanitation, 41–44,<br />
43b, 44f<br />
employment and fi nancial security, 53<br />
key messages, 27<br />
location and settlement patterns<br />
and, 28–38<br />
density and morphology, 34–37<br />
inner-city slums, 29<br />
peri-urban slums, 30, 47<br />
scattered slum pockets, 29–30<br />
site conditions and, 34–38<br />
slum formation, 29–30, 58n2<br />
spatial contiguity and size and,<br />
30–34<br />
security of tenure, 51–53<br />
social networks, 53–54<br />
Urban Research Symposium (2009), 130<br />
Urban Risk Assessment (URA), 65, 66b, 182,<br />
200, 217, 235<br />
Urban/Town Planning and Settlement laws<br />
(Tanzania), 185<br />
Urban Transport Transformation Program<br />
(Mexico), 105, 107b<br />
Urban Wastewater Methane Gas Capture,<br />
164–65<br />
USAID, 119, 190<br />
V<br />
Varzeas Tietê River Linear Park (São Paulo),<br />
246, 260–61, 265<br />
Via Parque (São Paulo), 261<br />
Vietnam<br />
action plans in, 68–69b<br />
Asian Cities Climate Change Resilience<br />
Network in, 154<br />
Climate Resilient Cities Primer<br />
in, 154, 155<br />
public transport in, 133<br />
urban upgrading in, 166–67<br />
Virginia Beach, fl oods in, 143<br />
Virtual Center on Climate Change for<br />
Mexico City (CVCCCM), 88, 218<br />
Visayas (Philippines), <strong>risk</strong> identifi cation<br />
in, 156<br />
volcanoes, 19–20<br />
Volunteer Technology Communities<br />
(VTCs), 87, 172–73<br />
VUUP (National Urban Upgrading<br />
Programs, Vietnam), 166–67<br />
W<br />
Wamsler, Christine, 132, 168<br />
wastewater management, 164–65.<br />
See also sanitation<br />
WaterAid, 92, 162<br />
waterfront communities, 69b. See also<br />
coastal areas and cities<br />
water supply and distribution<br />
<strong>disaster</strong> <strong>risk</strong> and, 41–44, 43b, 44f<br />
energy effi ciency and, 165–66<br />
Mexico City case study and, 222–23<br />
public-private partnerships and, 117<br />
results-based fi nancing and, 121<br />
sanitation and, 163–64<br />
service delivery and, 129–30<br />
slums and, 33, 118–19b<br />
solar, 264–65<br />
water truckers, 42<br />
Water System of Mexico City, 224<br />
water truckers, 42<br />
West Africa, precipitation in, 83<br />
West Nile Virus, 20<br />
Wet Weather Flow Master Plan, 74<br />
Wikipedia, 172<br />
Wildlife Society for Nature Conservation, 190<br />
women<br />
awareness raising and, 163<br />
grassroots groups and, 150
health impacts of <strong>climate</strong> <strong>change</strong><br />
on, 126<br />
heat waves and, 20<br />
reconstruction projects and, 172<br />
<strong>risk</strong> management and, 169<br />
working groups for <strong>risk</strong> assessment, 67b<br />
<strong>World</strong> Bank<br />
carbon fi nance and, 115<br />
Carbon Partnership Facility, 115<br />
catastrophe bond programs from, 109, 109b<br />
on <strong>climate</strong> <strong>change</strong>, 125, 126–28<br />
Climate Resilient Cities Primer, 154<br />
Community Development Carbon Fund<br />
and, 166<br />
cook stoves and, 58n10<br />
Dar es Salaam case study and, 182<br />
on fi nance instruments, 134<br />
fi nancing from, 103, 107, 107b, 108t,<br />
121, 197<br />
greenhouse emissions analysis<br />
by, 106b<br />
on “hotspot” cities, 131–32<br />
on housing, 131<br />
Jakarta case study and, 200, 212<br />
job creation programs and, 168<br />
local partnerships and, 92<br />
methane gas capture projects and, 165<br />
Mexico City case study and, 217<br />
partial credit products from, 110<br />
poverty ranking by, 259<br />
poverty reduction and, 214<br />
reconstruction projects, 171, 172<br />
Resilient Cities program, 145<br />
<strong>risk</strong> assessment and, 65, 66b<br />
<strong>risk</strong> fi nancing and, 169<br />
INDEX ■ 297<br />
sanitation and, 130, 164<br />
São Paulo case study and, 235<br />
on transportation sector, 130, 133<br />
urban development and, 107<br />
Urban Flood Prevention and Drainage<br />
Project, 159<br />
on urban poverty, 128–29<br />
urban upgrading and, 161–62, 166<br />
Volunteer Technology Communities and,<br />
172–73<br />
<strong>World</strong> Bank Climate Finance Options, 105<br />
<strong>World</strong> Bank Group, 9, 105<br />
<strong>World</strong> Business Council for Sustainable<br />
Development, 130<br />
<strong>World</strong> Development Report (<strong>World</strong> Bank)<br />
2004: Making Services Work for Poor<br />
People, 130<br />
2009: Reshaping Economic Geography, 130<br />
2010: Development and Climate Change,<br />
9, 125, 126–27, 128<br />
<strong>World</strong> Disasters Report: Focus on Urban Risk<br />
(IFPC), 9<br />
<strong>World</strong> Health Organization, 130<br />
<strong>World</strong> Vision, 190<br />
<strong>World</strong> Watch Institute, 9, 125–26,<br />
127, 131, 168<br />
<strong>World</strong> Wildlife Fund (WWF), 144, 190<br />
Y<br />
Yahoo, volunteer technology community<br />
participation of, 173<br />
Yusuf, A.A., 131<br />
Z<br />
zoning regulations, 81
Climate Change, Disaster Risk, and the Urban Poor analyzes the key<br />
challenges facing the urban poor, given the <strong>risk</strong>s associated with <strong>climate</strong><br />
<strong>change</strong> and <strong>disaster</strong>s.<br />
Through evidence and case studies from a number of cities—such as Dar es<br />
Salaam, Jakarta, Mexico City, and São Paulo—the book identifi es key strategies that<br />
cities can pursue to build resilience for their vulnerable populations. These strategies<br />
are based on diffi cult policy decisions that must balance tradeoffs among <strong>risk</strong><br />
reduction, urban development, and poverty reduction.<br />
Policy makers, researchers, practitioners, and students will fi nd the book’s<br />
analysis robust and comprehensive, and abundant with global examples of policies<br />
and programs that have been implemented at the city level—including a review of<br />
fi nancing options for local governments.<br />
“Cities are highly vulnerable to the impact of <strong>climate</strong> <strong>change</strong>. As a result, mayors<br />
and other urban leaders around the world are identifying <strong>risk</strong>s, exchanging best<br />
practices, and developing action plans to address the challenges we face. This<br />
includes studying and exploring ways to protect our urban poor populations, who<br />
are at particular <strong>risk</strong>. The <strong>World</strong> Bank’s study Climate Change, Disaster Risk, and<br />
the Urban Poor is an important resource for cities such as Mexico City as we make<br />
and implement decisions to counter the impact of our changing <strong>climate</strong>”<br />
Marcelo Ebrard Casaubon, Mayor of Mexico City<br />
Chair, <strong>World</strong> Mayors Council on Climate<br />
“For the fi rst time in history, the majority of the world’s population lives in cities.<br />
This study makes a critical contribution for mayors, international organizations,<br />
and national governments as we work together to overcome <strong>climate</strong> <strong>change</strong> and<br />
build resilient cities in a way that directly addresses the needs of the urban poor.<br />
By having the right strategies, we can ensure that we not only solve the world’s<br />
environmental problems, but we also build a society that works for all.”<br />
David Miller, Mayor of Toronto (2003–2010)<br />
Chair of C40 (2008–2010)<br />
Counsel, International Business and Sustainability, Aird&Berlis LLP<br />
ISBN 978-0-8213-8845-7<br />
SKU 18845