1 - History of Ericsson - History of Ericsson
1 - History of Ericsson - History of Ericsson
1 - History of Ericsson - History of Ericsson

Create successful ePaper yourself
Turn your PDF publications into a flip-book with our unique Google optimized e-Paper software.
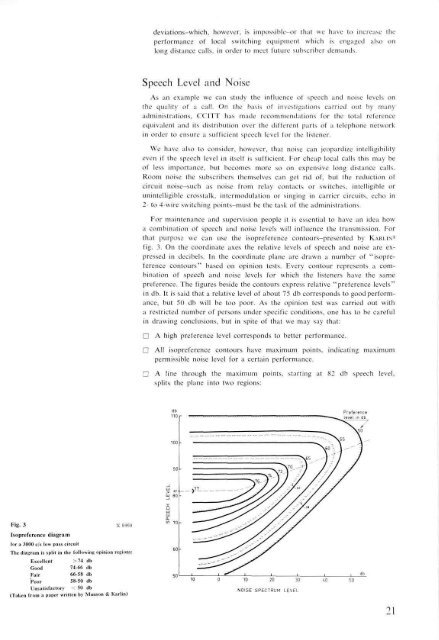
Fig. 3 X 8460<br />
Isopreference diagram<br />
for a 3000 c/s low pass circuit<br />
The diagram is split in the following opinion regions:<br />
Excellent >74 db<br />
Good 74-66 db<br />
Fair 66-58 db<br />
Poor 58-50 db<br />
Unsatisfactory < 50 db<br />
(Taken from a paper written by Munson & Karlin)<br />
deviations-whicb, however, is impossible-or that we have to increase the<br />
performance <strong>of</strong> local switching equipment which is engaged also on<br />
long distance calls, in order to meet future subscriber demands.<br />
Speech Level and Noise<br />
As an example we can study the influence <strong>of</strong> speech and noise levels on<br />
the quality <strong>of</strong> a call. On the basis <strong>of</strong> investigations carried out by many<br />
administrations, CC1TT has made recommendations for the total reference<br />
equivalent and its distribution over the different parts <strong>of</strong> a telephone network<br />
in order to ensure a sufficient speech level for the listener.<br />
We have also to consider, however, that noise can jeopardize intelligibility<br />
even if the speech level in itself is sufficient. For cheap local calls this may be<br />
<strong>of</strong> less importance, but becomes more so on expensive long distance calls.<br />
Room noise the subscribers themselves can get rid <strong>of</strong>, but the reduction <strong>of</strong><br />
circuit noise-such as noise from relay contacts or switches, intelligible or<br />
unintelligible crosstalk, intermodulation or singing in carrier circuits, echo in<br />
2- to 4-wire switching points-must be the task <strong>of</strong> the administrations.<br />
For maintenance and supervision people it is essential to have an idea how<br />
a combination <strong>of</strong> speech and noise levels will influence the transmission. For<br />
that purpose we can use the isopreference contours-presented by KARLIN 3<br />
fig. 3. On the coordinate axes the relative levels <strong>of</strong> speech and noise are expressed<br />
in decibels. In the coordinate plane are drawn a number <strong>of</strong> "isopreference<br />
contours" based on opinion tests. Every contour represents a combination<br />
<strong>of</strong> speech and noise levels for which the listeners have the same<br />
preference. The figures beside the contours express relative "preference levels"<br />
in db. It is said that a relative level <strong>of</strong> about 75 db corresponds to good performance,<br />
but 50 db will be too poor. As the opinion test was carried out with<br />
a restricted number <strong>of</strong> persons under specific conditions, one has to be careful<br />
in drawing conclusions, but in spite <strong>of</strong> that we may say that:<br />
• A high preference level corresponds to better performance.<br />
• All isopreference contours have maximum points, indicating maximum<br />
permissible noise level for a certain performance.<br />
• A line through the maximum points, starting at 82 db speech level,<br />
splits the plane into two regions:<br />
10 20 30<br />
NOISE SPECTRUM LEVEL<br />
21