The Art of Timber Cruising, Part II - Fixed - Ontario woodlot.com
The Art of Timber Cruising, Part II - Fixed - Ontario woodlot.com
The Art of Timber Cruising, Part II - Fixed - Ontario woodlot.com

You also want an ePaper? Increase the reach of your titles
YUMPU automatically turns print PDFs into web optimized ePapers that Google loves.
<strong>The</strong> <strong>Art</strong> <strong>of</strong> <strong>Timber</strong> <strong>Cruising</strong> – <strong>Part</strong> <strong>II</strong><br />
<strong>Fixed</strong>-Area Plots<br />
In this second article on timber cruising, we will be looking at a simple method <strong>of</strong> preparing a<br />
basic description <strong>of</strong> the forest <strong>com</strong>partments in your <strong>woodlot</strong>. It is an easy method <strong>of</strong> collecting<br />
data that can be <strong>com</strong>pleted by most <strong>woodlot</strong> owners – this system is called fixed-area plot<br />
sampling.<br />
<strong>The</strong> Concept <strong>of</strong> <strong>Fixed</strong>-Area <strong>Cruising</strong><br />
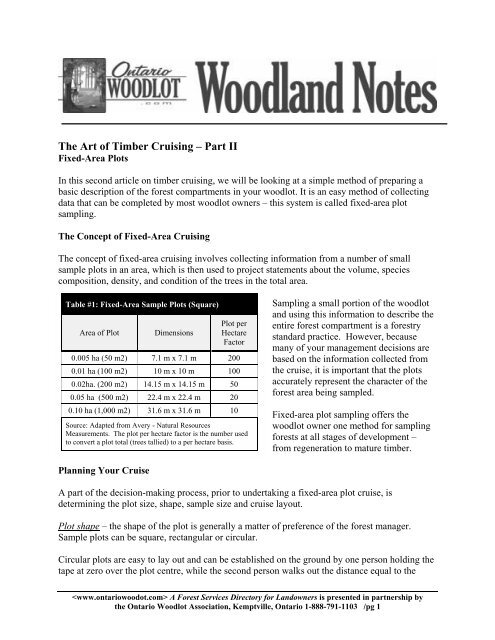
<strong>The</strong> concept <strong>of</strong> fixed-area cruising involves collecting information from a number <strong>of</strong> small<br />
sample plots in an area, which is then used to project statements about the volume, species<br />
<strong>com</strong>position, density, and condition <strong>of</strong> the trees in the total area.<br />
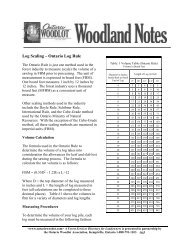
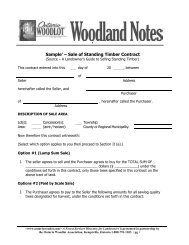
Table #1: <strong>Fixed</strong>-Area Sample Plots (Square)<br />
Area <strong>of</strong> Plot Dimensions<br />
Planning Your Cruise<br />
Plot per<br />
Hectare<br />
Factor<br />
0.005 ha (50 m2) 7.1 m x 7.1 m 200<br />
0.01 ha (100 m2) 10 m x 10 m 100<br />
0.02ha. (200 m2) 14.15 m x 14.15 m 50<br />
0.05 ha (500 m2) 22.4 m x 22.4 m 20<br />
0.10 ha (1,000 m2) 31.6 m x 31.6 m 10<br />
Source: Adapted from Avery - Natural Resources<br />
Measurements. <strong>The</strong> plot per hectare factor is the number used<br />
to convert a plot total (trees tallied) to a per hectare basis.<br />
Sampling a small portion <strong>of</strong> the <strong>woodlot</strong><br />
and using this information to describe the<br />
entire forest <strong>com</strong>partment is a forestry<br />
standard practice. However, because<br />
many <strong>of</strong> your management decisions are<br />
based on the information collected from<br />
the cruise, it is important that the plots<br />
accurately represent the character <strong>of</strong> the<br />
forest area being sampled.<br />
<strong>Fixed</strong>-area plot sampling <strong>of</strong>fers the<br />
<strong>woodlot</strong> owner one method for sampling<br />
forests at all stages <strong>of</strong> development –<br />
from regeneration to mature timber.<br />
A part <strong>of</strong> the decision-making process, prior to undertaking a fixed-area plot cruise, is<br />
determining the plot size, shape, sample size and cruise layout.<br />
Plot shape – the shape <strong>of</strong> the plot is generally a matter <strong>of</strong> preference <strong>of</strong> the forest manager.<br />
Sample plots can be square, rectangular or circular.<br />
Circular plots are easy to lay out and can be established on the ground by one person holding the<br />
tape at zero over the plot centre, while the second person walks out the distance equal to the<br />
A Forest Services Directory for Landowners is presented in partnership by<br />
the <strong>Ontario</strong> Woodlot Association, Kemptville, <strong>Ontario</strong> 1-888-791-1103 /pg 1
adius <strong>of</strong> the predetermined plot size. <strong>The</strong> plot radius should be measured a number <strong>of</strong> times<br />
along the circumference to determine the boundary <strong>of</strong> the plot. One disadvantage <strong>of</strong> circular<br />
plots is that they can be difficult to establish in dense undergrowth or in rough terrain.<br />
Square or rectangular plots are best established by using a crew <strong>of</strong> two or more people. <strong>The</strong>y<br />
usually take a little longer to establish; however, once established it is easier to determine the<br />
boundaries <strong>of</strong> the plot, which may provide for a more reliable tree tally.<br />
Tables 1 and 2 provide a number <strong>of</strong> options for <strong>woodlot</strong> owners looking at using fixed-area plot<br />
sampling methods.<br />
Plot size – Table #2<br />
provides a number <strong>of</strong><br />
re<strong>com</strong>mendations in respect<br />
to plot size. <strong>The</strong> size <strong>of</strong> the<br />
plot is dependent on the type<br />
<strong>of</strong> vegetation being sampled.<br />
For example, it is<br />
re<strong>com</strong>mended to use a<br />
smaller plot for young<br />
plantations (100 m2) or a<br />
larger plot size (400 m2) for<br />
natural stand conditions.<br />
Sample size – the amount<br />
sampled will depend on the<br />
purpose <strong>of</strong> the inventory, the<br />
variability <strong>of</strong> the forest<br />
cover, the size <strong>of</strong> the forest<br />
<strong>com</strong>partment, and the how<br />
reliable the information<br />
needs to be.<br />
As a rule…<br />
As the area to be<br />
sampled increases, the<br />
sample intensity<br />
decreases. Conversely,<br />
the smaller the area to be<br />
sampled, the sample<br />
intensity increases;<br />
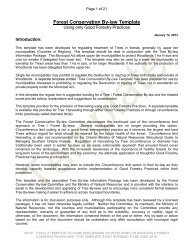
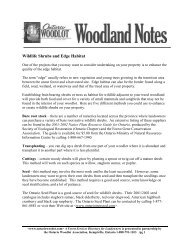
Table #2: <strong>Fixed</strong>-Area Sample (Circular) Plot Sizes<br />
Area <strong>of</strong> Plot<br />
Radius <strong>of</strong><br />
Plot<br />
Plot per<br />
Hectare<br />
Factor*<br />
.0001 (1m2) 0.56 10,000<br />
.002 ha (20m2) 2.52 m 500<br />
.005 ha (50 m2) 3.99 m 200<br />
.01 ha (100 m2) 5.64 m 100<br />
.02 ha (200 m2) 7.98 m 50<br />
.03 ha (300 m2) 9.77 m 33.3<br />
.04 ha (400 m2) 11.28 m 25<br />
.05 ha (500 m2) 12.62 m 20<br />
When to Use<br />
Ground plants, tree<br />
regeneration surveys.<br />
Shrubs and tree saplings<br />
under 2.5 cm diameter at<br />
breast height.<br />
Shrubs and tree saplings<br />
under 2.5 cm diameter at<br />
breast height.<br />
Young plantations,<br />
uniform stand conditions.<br />
Young plantations,<br />
uniform stand conditions.<br />
Natural stand conditions.<br />
Variable tree species and<br />
age distribution.<br />
Natural stand conditions.<br />
Variable tree species and<br />
age distribution.<br />
Natural stand conditions.<br />
Variable tree species and<br />
age distribution.<br />
<strong>The</strong> plot per hectare factor is the number used to convert a plot total (trees<br />
tallied) to a per hectare basis. Source: Making Cents Out <strong>of</strong> Forest<br />
Inventories – A Guide for Small Woodlot Owners.<br />
<strong>The</strong> intensity <strong>of</strong> the sample should increase for operational decisions (e.g. harvesting). <strong>The</strong>se<br />
types <strong>of</strong> management decisions require more precise information versus inventory<br />
requirements, which are used to make longer-term planning decisions.<br />
A Forest Services Directory for Landowners is presented in partnership by<br />
the <strong>Ontario</strong> Woodlot Association, Kemptville, <strong>Ontario</strong> 1-888-791-1103 /pg 2
<strong>The</strong> sampling intensity needs to be increased when the forest <strong>com</strong>partment consists <strong>of</strong> a<br />
variety <strong>of</strong> growing conditions and/or when variable terrain is encountered; and<br />
Increased reliability equates to an increased sampling intensity.<br />
For most small <strong>woodlot</strong> owners, a sampling intensity from 2% to 10% is <strong>com</strong>mon. However, if<br />
you are considering harvesting activities, you may want to consider a sampling intensity <strong>of</strong> 10%<br />
or higher. (Source - Making Cents Out <strong>of</strong> Forest Inventories)<br />
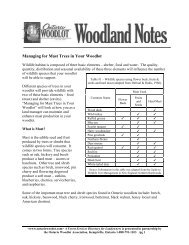
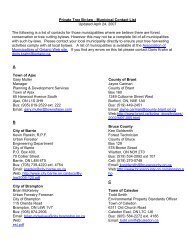
Cruise layout – a series <strong>of</strong> transect lines (or<br />
cruise lines) are laid out parallel to each<br />
other to ensure that conditions throughout<br />
the forest <strong>com</strong>partment are sampled in an<br />
unbiased manner. <strong>The</strong> cruise lines should<br />
run against the topography (i.e. up and<br />
down the hills), and the sample plots are<br />
located at regular intervals along the line.<br />
<strong>The</strong> accuracy with which the sample plots<br />
represent the forest <strong>com</strong>partment depends<br />
on this unbiased selection <strong>of</strong> plots. See<br />
Figure 1.<br />
Instruments Required<br />
In contrast to point sampling, where a special forestry tool called a wedge prism is required,<br />
collecting information from fixed-area plots requires no special tools. Most <strong>woodlot</strong> owners will<br />
have all the necessary tools in their workshop. <strong>The</strong>se include: two tape measures (3-m tape to<br />
measure tree diameters and a 25-m tape to lay out the plot boundaries); wooden stakes; steel pins<br />
or flagging tape (to mark the centre or corners <strong>of</strong> the plot); a clipboard and tally sheets (to record<br />
your information).<br />
Important note – if you are going to use a regular tape measure to measure the diameter <strong>of</strong> the<br />
tree you must convert this circumference measurement into diameter. <strong>The</strong> conversion factor is<br />
3.1416. For example, a measurement <strong>of</strong> 38-cm using a regular tape would be recorded on your<br />
tally sheet as a 12-cm diameter tree.<br />
However, if you plan on undertaking a large cruising project, you should consider purchasing or<br />
borrowing forestry equipment specifically designed for measuring tree diameters, e.g. diameter<br />
tape, calipers, or a Biltmore stick. This equipment is available from most forest equipment<br />
retailers such as Canadian Forestry Equipment, Mississauga, ON, 1-800-387-4940.<br />
Information Collected<br />
ϕ-----ϕ-----ϕ-----ϕ<br />
ϕ-----ϕ-----ϕ-----ϕ<br />
ϕ-----ϕ-----ϕ-----ϕ-----ϕ<br />
ϕ-----ϕ-----ϕ<br />
Plot location<br />
Stand boundary<br />
Figure 1. Cruise lines should be laid out in a grid<br />
fashion so the lines are run at right angles to the<br />
topography.<br />
<strong>The</strong> amount <strong>of</strong> information collected at each plot will depend on your objectives – timber<br />
production, wildlife management, or recreation. At a minimum, the tree species and the diameter<br />
<strong>of</strong> each tree in the plot should be collected, and an average age and height need to be determined<br />
A Forest Services Directory for Landowners is presented in partnership by<br />
the <strong>Ontario</strong> Woodlot Association, Kemptville, <strong>Ontario</strong> 1-888-791-1103 /pg 3
for each forest <strong>com</strong>partment. Collecting this minimum amount <strong>of</strong> information will provide you<br />
with a general description <strong>of</strong> the forest <strong>com</strong>partment and will meet the minimum requirements<br />
for the Managed Forest Tax Incentive Program.<br />
In most forest inventories tree<br />
diameters are measured at 1.3 m<br />
above the ground (referred to as dbh),<br />
and only those trees with a diameter<br />
<strong>of</strong> 10 cm or larger are tallied.<br />
Optional information that you may<br />
want to collect would include – tree<br />
quality (AGS or UGS); individual tree<br />
heights and ages; soil information;<br />
advanced regeneration; and flora<br />
information.<br />
Preparing a Compartment<br />
Description<br />
It is easy to calculate the species<br />
<strong>com</strong>position <strong>of</strong> your forest<br />
<strong>com</strong>partment by inserting the cruise<br />
information you have collected into<br />
the formula noted below.<br />
Species Composition % = (species tally divided by<br />
total tree tally) x 100<br />
For example, you have collected the following<br />
information in <strong>com</strong>partment “A” <strong>of</strong> your <strong>woodlot</strong>:<br />
Circular fixed-area sample plot = 9.77 m radius<br />
(0.03 ha)<br />
Number <strong>of</strong> plots sampled = 3<br />
Conversation factor = 33.3<br />
Tree tally <strong>of</strong> all 3 plots = 42 (maple = 24, beech =<br />
13, red oak = 5)<br />
Trees per ha = (42 x 33.3) divided by 3 = 466<br />
This calculation needs to be <strong>com</strong>pleted for each<br />
species tallied in your cruise.<br />
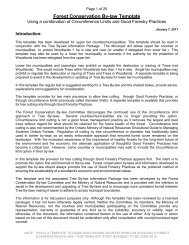
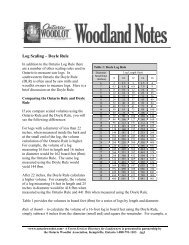
1<br />
Plot boundary<br />
Figure 2. A square sample plot measuring 20 metres by 20 metres<br />
equals an area <strong>of</strong> .04 hectares. Only those trees measuring<br />
greater than 10 cm in diameter at dbh within the plot are tallied.<br />
Note borderline trees are tallied only if more than ½ <strong>of</strong> the bole <strong>of</strong><br />
tree are in the plot. In this example 20 trees are tallied<br />
representing 500 trees per hectare. Note – trees 1, 2 and 3 are<br />
outside the plot and are not tallied.<br />
Compartment “A” has an average <strong>of</strong> 466 trees per<br />
hectare; <strong>of</strong> this total 266 were hard maple, 144 were beech, and the remaining 56 trees were red<br />
A Forest Services Directory for Landowners is presented in partnership by<br />
the <strong>Ontario</strong> Woodlot Association, Kemptville, <strong>Ontario</strong> 1-888-791-1103 /pg 4<br />
3<br />
2<br />
Raduis = 9.77 m<br />
Plot<br />
boundary<br />
Figure 3. A circular plot with a radius <strong>of</strong> 9.77<br />
metres is equal to an area <strong>of</strong> 300 square metres<br />
or .03 hectares. <strong>The</strong> 14 trees tallied in the<br />
sample plot represents 466 trees per hectare (14<br />
x 33.3 conversion factor = 466).
oak. Using the formula, hard maple would represent 57% <strong>of</strong> the <strong>com</strong>position <strong>of</strong> this<br />
<strong>com</strong>partment (i.e. 266÷466 x 100 = 57); beech would represent 31% (i.e. 144÷466 x 100 = 31)<br />
and red oak would make up the final 127% (i.e. 56÷466 x 100 = 12). <strong>The</strong>refore, the tree species<br />
and percent <strong>com</strong>position for this forest <strong>com</strong>partment would be hard maple 60%, beech 30% and<br />
red oak 10%.<br />
Note – the tree species and percent <strong>com</strong>position <strong>of</strong> the forest <strong>com</strong>partment should only list<br />
species that make up at least 10%; percentages are normally rounded <strong>of</strong>f to the closest multiple<br />
<strong>of</strong> 10; and the total <strong>of</strong> all species is not to exceed 100%.<br />
Table 3: Basal Area Table<br />
Diameter<br />
(cm)<br />
Basal Area <strong>of</strong><br />
stem (m 2 )<br />
10 0.008<br />
12 0.011<br />
14 0.015<br />
16 0.020<br />
18 0.025<br />
20 0.031<br />
22 0.038<br />
24 0.045<br />
26 0.053<br />
28 0.062<br />
30 0.071<br />
32 0.080<br />
34 0.091<br />
Calculating the Compartment Basal Area<br />
Expressing Density as Stems per Hectare Using a <strong>Fixed</strong>-<br />
Area Plot<br />
Expressing the density <strong>of</strong> the <strong>woodlot</strong> based on the number<br />
<strong>of</strong> trees per hectare is a relatively straightforward measure<br />
that most <strong>woodlot</strong> owners can easily identify with.<br />
Expressing the density in this manner with the information<br />
collected in your fixed-area plots is simple.<br />
To calculate the stems per hectare you would total the trees<br />
tallied in the plot (or plots sampled) and multiply this<br />
number by the “plot per hectare factor” as shown in Figure<br />
#3. Tables #1 and #2 provide you with the “plot per hectare<br />
factor” for a variety <strong>of</strong> different sized sample plots.<br />
Although you are not measuring the <strong>com</strong>partment’s basal area as you gather data from your<br />
fixed-area plots, the stem diameter information collected and the information contained in Table<br />
#3 can be used to calculate the basal area.<br />
Table 3 - provides the basal area in square metres <strong>of</strong> individual trees measured at breast height<br />
(1.3 m from the ground).<br />
For example, in <strong>com</strong>partment “A” you have an average <strong>of</strong> 466 trees per hectare, with the<br />
diameter distribution as shown in Table #4. Using the information and the individual stem basal<br />
Table 4: Calculating Basal Area.<br />
Diameter Stems<br />
Basal Area<br />
<strong>of</strong> stem (m 2 )<br />
Total BA<br />
16 cm 333 0.020 6.7<br />
32 cm 100 0.080 8.0<br />
44 cm 21 0.152 3.2<br />
50 cm 12 0.196 2.4<br />
Total trees/ha 466 BA/ha (m 2 ) 20.3<br />
area information from Table #3, the basal<br />
area <strong>of</strong> this <strong>com</strong>partment is 20 m2 per<br />
hectare.<br />
A Forest Services Directory for Landowners is presented in partnership by<br />
the <strong>Ontario</strong> Woodlot Association, Kemptville, <strong>Ontario</strong> 1-888-791-1103 /pg 5
Re<strong>com</strong>mended Reading<br />
For additional information on preparing an inventory for your <strong>woodlot</strong>, you may want to<br />
consider reading one <strong>of</strong> the following guides:<br />
Making Cents Out <strong>of</strong> Forest Inventories – A Guide for Small Woodlot Owners, <strong>Ontario</strong> Ministry<br />
<strong>of</strong> Natural Resources - $10.00. Or, A True Picture – Taking Inventory <strong>of</strong> Your Woodlot, Eastern<br />
<strong>Ontario</strong> Model Forest - $10.00. Copies <strong>of</strong> these two publications can be obtained from the<br />
LandOwner Resource Centre by calling (613) 692-2390.<br />
© 2003, <strong>Ontario</strong> Woodlot Association<br />
A Forest Services Directory for Landowners is presented in partnership by<br />
the <strong>Ontario</strong> Woodlot Association, Kemptville, <strong>Ontario</strong> 1-888-791-1103 /pg 6