Understanding the Report Card - Department of Education
Understanding the Report Card - Department of Education
Understanding the Report Card - Department of Education

Create successful ePaper yourself
Turn your PDF publications into a flip-book with our unique Google optimized e-Paper software.
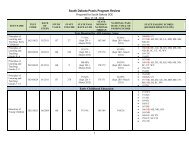
<strong>Understanding</strong> <strong>the</strong> South Dakota <strong>Report</strong> <strong>Card</strong><br />
Starting with <strong>the</strong> 2011/12 school year, <strong>the</strong> South Dakota <strong>Report</strong> <strong>Card</strong> looks dramatically different<br />
from previous years. The reason being, <strong>the</strong> SD <strong>Department</strong> <strong>of</strong> <strong>Education</strong> secured a new vendor<br />
to produce our South Dakota <strong>Report</strong> <strong>Card</strong>(s) at all levels.<br />
This document highlights <strong>the</strong> different tabs <strong>of</strong> <strong>the</strong> <strong>Report</strong> <strong>Card</strong> and gives an overview <strong>of</strong> <strong>the</strong><br />
information displayed on each <strong>of</strong> <strong>the</strong> tabs.<br />
Overview Tab<br />
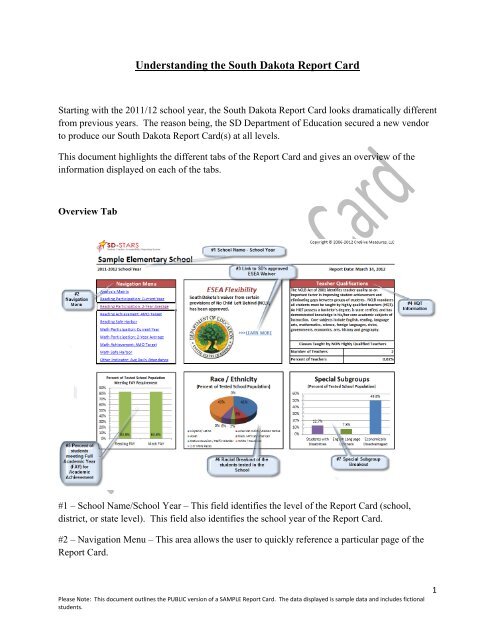
#1 – School Name/School Year – This field identifies <strong>the</strong> level <strong>of</strong> <strong>the</strong> <strong>Report</strong> <strong>Card</strong> (school,<br />
district, or state level). This field also identifies <strong>the</strong> school year <strong>of</strong> <strong>the</strong> <strong>Report</strong> <strong>Card</strong>.<br />
#2 – Navigation Menu – This area allows <strong>the</strong> user to quickly reference a particular page <strong>of</strong> <strong>the</strong><br />
<strong>Report</strong> <strong>Card</strong>.<br />
Please Note: This document outlines <strong>the</strong> PUBLIC version <strong>of</strong> a SAMPLE <strong>Report</strong> <strong>Card</strong>. The data displayed is sample data and includes fictional<br />
students.<br />
1
#3 – ESEA Flexibility – This area gives <strong>the</strong> user a link to additional information on South<br />
Dakota’s recently approved ESEA Flexibility waiver.<br />
#4 – Teacher Qualifications – This area <strong>of</strong> <strong>the</strong> <strong>Report</strong> <strong>Card</strong> identifies <strong>the</strong> Highly Qualified<br />
statuses <strong>of</strong> <strong>the</strong> teachers at <strong>the</strong> individual school, district and state levels.<br />
#5 – Percent <strong>of</strong> students meeting Full Academic Year (FAY) for Academic Achievement – This<br />
gives <strong>the</strong> percent <strong>of</strong> students in <strong>the</strong> tested grades who were continuously enrolled from October<br />
1 st through <strong>the</strong> end <strong>of</strong> <strong>the</strong> testing window. These are <strong>the</strong> students who are included in <strong>the</strong><br />
Academic Achievement analysis.<br />
#6 – Racial Breakout <strong>of</strong> <strong>the</strong> students tested in <strong>the</strong> School – this is a quick reference <strong>of</strong> <strong>the</strong> racial<br />
breakout <strong>of</strong> <strong>the</strong> students tested.<br />
#7 – Special Subgroup Breakout – this is a quick reference <strong>of</strong> <strong>the</strong> 3 non-racial subgroups tested.<br />
NAEP Overview Tab<br />
This tab provides general information on <strong>the</strong> most current NAEP testing that has occurred in<br />
South Dakota.<br />
NAEP Grade 4 Tab<br />
This tab provides <strong>the</strong> results <strong>of</strong> <strong>the</strong> NAEP testing in both Reading and Math at Grade 4.<br />
NAEP Grade 8 Tab<br />
This tab provides <strong>the</strong> results <strong>of</strong> <strong>the</strong> NAEP testing in both Reading and Math at Grade 8.<br />
Reading 95% Participation<br />
This tab provides information as to how each subgroup did in meeting <strong>the</strong> participation rate for<br />
<strong>the</strong> current year. This information is measured against <strong>the</strong> pre-established participation rate<br />
target which is 95%.<br />
Please Note: This document outlines <strong>the</strong> PUBLIC version <strong>of</strong> a SAMPLE <strong>Report</strong> <strong>Card</strong>. The data displayed is sample data and includes fictional<br />
students.<br />
2
Reading 2yr Participation<br />
This tab provides <strong>the</strong> participation rates for each subgroup for <strong>the</strong> last 2 years.<br />
Reading AMO Target<br />
This tab provides <strong>the</strong> pr<strong>of</strong>iciency rate that each subgroup achieved in Reading for <strong>the</strong> current<br />
year. This information is measured against <strong>the</strong> pre-established AMO Target as outlined in <strong>the</strong><br />
Accountability Workbook. http://doe.sd.gov/NCLB/index.asp<br />
Math 95% Participation<br />
This tab provides information as to how each subgroup did in meeting <strong>the</strong> participation rate for<br />
<strong>the</strong> current year. This information is measured against <strong>the</strong> pre-established participation rate<br />
target which is 95%.<br />
Math 2yr Participation<br />
This tab provides <strong>the</strong> participation rates for each subgroup for <strong>the</strong> last 2 years.<br />
Math AMO Target<br />
This tab provides <strong>the</strong> pr<strong>of</strong>iciency rate that each subgroup achieved in Math for <strong>the</strong> current year.<br />
This information is measured against <strong>the</strong> pre-established AMO Target as outlined in <strong>the</strong><br />
Accountability Workbook. http://doe.sd.gov/NCLB/index.asp<br />
OAI<br />
This tab provides information as to how each subgroup did in meeting <strong>the</strong> “O<strong>the</strong>r Academic<br />
Indicator – OAI”. Attendance is <strong>the</strong> OAI used for Elementary Schools and Middle Schools.<br />
Graduation Rate is <strong>the</strong> OAI used for High Schools.<br />
Please Note: This document outlines <strong>the</strong> PUBLIC version <strong>of</strong> a SAMPLE <strong>Report</strong> <strong>Card</strong>. The data displayed is sample data and includes fictional<br />
students.<br />
3
Source Data<br />
The Source Data tab displays aggregate data which is used to populate all <strong>the</strong> charts within <strong>the</strong><br />
<strong>Report</strong> <strong>Card</strong>. Subgroups with less than 10 students will not be displayed in order to protect <strong>the</strong><br />
privacy <strong>of</strong> <strong>the</strong> students.<br />
Please Note: This document outlines <strong>the</strong> PUBLIC version <strong>of</strong> a SAMPLE <strong>Report</strong> <strong>Card</strong>. The data displayed is sample data and includes fictional<br />
students.<br />
4