Corn, Small Grain and Forage - AgBioResearch - Michigan State ...
Corn, Small Grain and Forage - AgBioResearch - Michigan State ...
Corn, Small Grain and Forage - AgBioResearch - Michigan State ...

You also want an ePaper? Increase the reach of your titles
YUMPU automatically turns print PDFs into web optimized ePapers that Google loves.
2009<br />
U.P. <strong>Corn</strong>, <strong>Small</strong> <strong>Grain</strong> <strong>and</strong> <strong>Forage</strong> Performance Trials<br />
D.H. Min <strong>and</strong> C.J. Kapp<br />
Upper Peninsula Experiment Station<br />
<strong>Michigan</strong> <strong>State</strong> University<br />
Introduction<br />
In 2009 the Upper Peninsula Experiment Station conducted small grain, corn, cool season grass <strong>and</strong><br />
alfalfa variety trials. The purpose of these trials was to evaluate each variety to determine which consistently<br />
performs the best in the soil <strong>and</strong> climatic conditions of the Upper Peninsula. Yield is the single largest<br />
determinant of return per acre for forage, corn <strong>and</strong> small grain production. Selecting varieties with high yield<br />
potential is fundamental to obtaining high yields <strong>and</strong> economic profitability. The yield advantage realized with<br />
good varieties quickly minimizes their greater seed cost. When choosing a variety, always try to evaluate it based<br />
on multi‐year yield performance when possible. Yield will vary from year to year as a result of several<br />
environmental factors such as soil type, amount of rainfall, temperature, disease <strong>and</strong> insect incidence. A<br />
producer needs to take care when interpreting the information from variety trials. The more years represented,<br />
as well as the extent of similarity between the test <strong>and</strong> grower's field environments, the more reliable the<br />
information will be.<br />
Methods<br />
The results shown are the average of four replications grown in close proximity to each other. Two or<br />
more plots of the same variety in the same field may produce somewhat different results because of variability in<br />
the soil <strong>and</strong> other environmental factors. Replication <strong>and</strong> r<strong>and</strong>omization of the entries are two methods used to<br />
account for this variation. The value calculated as the “least significant difference” or “LSD” is the amount that an<br />
individual hybrid would have to differ from another hybrid in the same test to be considered significantly<br />
different from that hybrid. The CV, or coefficient of variation, is indicative of a trial’s precision. Trials with low<br />
levels of error variation have lower CV values. Each of the trials was treated with the recommended seeding,<br />
fertility <strong>and</strong> herbicide rates per species. Pure live seed (PLS) was used when determining seeding rate. Pure live<br />
seed refers to the amount of live seed in a lot of bulk seed. The formula is purity (%) multiplied by germination<br />
(%) divided by 100 equals the % of pure live seed in a lot of bulk seed.<br />
Discussion<br />
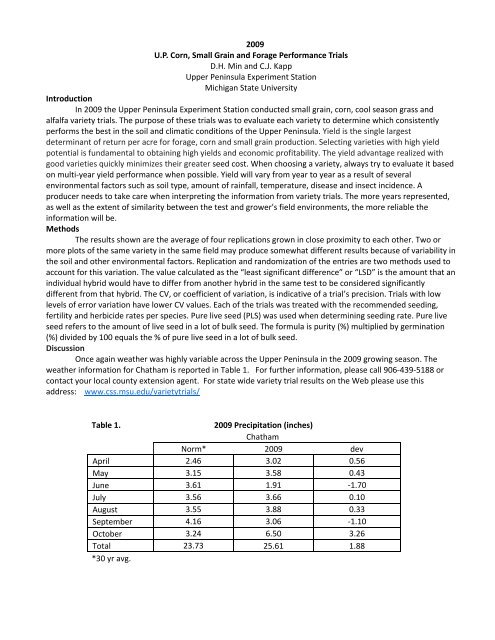
Once again weather was highly variable across the Upper Peninsula in the 2009 growing season. The<br />
weather information for Chatham is reported in Table 1. For further information, please call 906‐439‐5188 or<br />
contact your local county extension agent. For state wide variety trial results on the Web please use this<br />
address: www.css.msu.edu/varietytrials/<br />
Table 1. 2009 Precipitation (inches)<br />
Chatham<br />
Norm* 2009 dev<br />
April 2.46 3.02 0.56<br />
May 3.15 3.58 0.43<br />
June 3.61 1.91 ‐1.70<br />
July 3.56 3.66 0.10<br />
August 3.55 3.88 0.33<br />
September 4.16 3.06 ‐1.10<br />
October 3.24 6.50 3.26<br />
Total 23.73 25.61 1.88<br />
*30 yr avg.
Fig 1.<br />
Table 2.<br />
Barley Variety Trial 2009<br />
UPES, Chatham, MI<br />
Heading Date, Plant Scores* <strong>and</strong> Disease reactions of Barley varieties**<br />
Variety Heading Date Plant scores<br />
Powdery<br />
Mildew Rust scores<br />
B0007 7/14/2009 6.8 6.8 2.8<br />
B3404 7/13/2009 7.0 6.3 4.5<br />
B4478 7/13/2009 7.0 6.0 4.0<br />
CDC Clyde 7/14/2009 6.5 7.3 2.3<br />
Celebration 7/15/2009 6.8 7.3 2.5<br />
Excel 7/12/2009 6.8 7.3 3.0<br />
Kewaunee 7/10/2009 7.5 4.3 4.5<br />
Lacey 7/12/2009 7.0 6.0 2.0<br />
Legacy 7/11/2009 6.3 7.3 3.5<br />
Rasmusson 7/12/2009 6.0 5.8 3.8<br />
SR412 7/15/2009 6.3 7.3 3.3<br />
SR425 7/11/2009 6.3 6.5 3.8<br />
SR420 7/12/2009 7.5 5.8 4.0<br />
SR424 7/15/2009 7.3 6.3 3.5<br />
Stellar‐ND 7/12/2009 7.3 6.3 3.5<br />
Tradition 7/12/2009 7.0 6.0 3.3<br />
*1 to 10 scale where 1 = least desirable, 10 = most desirable<br />
**1 to 10 scale where 1 = most resistant, 10 = most susceptible
Table 3. Barley Variety Trial 2009<br />
UPES, Chatham, MI<br />
Variety<br />
Moisture<br />
(%)<br />
** Busch Agricultural Resources Inc<br />
Test wt<br />
(lbs/bu) Ht (in) Bu/acre* 2 yr avg Type Origin<br />
B0007 11.7 48.0 27.5 54.7 NA Malting BAR LLC**<br />
B3404 11.6 48.2 26.0 48.7 NA Malting BAR LLC<br />
B4478 11.8 47.7 26.1 49.0 48.3 Malting BAR LLC<br />
CDC Clyde 11.7 48.0 26.2 52.2 52.5 Malting Canada<br />
Celebration 11.5 47.0 26.7 55.0 NA Malting BAR LLC<br />
Excel 11.6 47.5 26.8 52.2 48.2 Malting Minnesota<br />
Kewaunee 11.8 48.3 29.1 47.5 50.7 Feed Wisconsin<br />
Lacey 11.5 49.6 26.7 56.5 54.2 Malting Minnesota<br />
Legacy 12.0 48.1 27.7 58.5 56.8 Malting BAR LLC<br />
Rasmusson 12.0 49.7 26.0 59.0 56.1 Malting Minnesota<br />
SR412 11.9 46.2 26.3 57.0 52.3 Malting Canada<br />
SR425 11.7 46.5 26.8 51.2 NA Malting Canada<br />
SR420 11.9 47.0 26.8 53.0 50.7 Malting Canada<br />
SR424 12.0 47.0 26.3 63.7 NA Malting Canada<br />
Stellar‐ND 11.9 48.5 26.5 53.5 51.5 Malting North Dakota<br />
Tradition 11.7 49.2 26.3 51.0 54.8 Malting BAR LLC<br />
Mean 11.8 47.9 26.7 53.9 52.4<br />
CV% 3.3 2.3 7.0 17.0 10.3<br />
LSD 5% 0.5 1.6 2.6 13.1 7.8<br />
*Yield adjusted to 14.5% moisture<br />
Design: RCB, plot size 3 x 20', (3 x 18' harvested) Harvested: 8‐27‐2009<br />
Soil type: Eben very cobbly s<strong>and</strong>y loam Herbicide: 1.5 pts of Buctril/ac<br />
Seeded: 5‐11‐2009 (120 lbs/ac) Fertility: 150 lbs/ac 46‐0‐0
Table 4. Oats Variety Trial 2009<br />
UPES, Chatham, MI<br />
Variety<br />
Moisture<br />
(%)<br />
Test wt<br />
(lbs/bu) Ht (in) Bu/acre* 2 yr avg Heading Date Origin<br />
Buckskin 11.2 35.9 34.6 94.3 88.5 7/13/2009 Illinois<br />
Esker 11.0 33.7 31.7 83.9 89.9 7/11/2009 Wisconsin<br />
Excel 11.0 33.1 33.6 98.7 NA 7/11/2009 Indiana<br />
Ida 10.9 34.0 34.7 85.7 92.0 7/13/2009 <strong>Michigan</strong><br />
IL 00 7267 11.6 36.1 30.3 98.0 NA 7/16/2009 Illinois<br />
IL 02 8658 11.9 35.6 30.7 92.1 NA 7/8/2009 Illinois<br />
Kame 11.8 33.6 30.6 76.2 83.7 7/8/2009 Wisconsin<br />
Ogle 11.3 33.5 33.0 101.6 96.8 7/11/2009 Illinois<br />
Spurs 11.5 36.2 31.6 77.6 83.3 7/11/2009 Illinois<br />
Wabasha 11.0 35.4 34.2 89.2 85.3 7/12/2009 Minnesota<br />
Winona 11.5 34.7 33.5 78.1 81.9 7/8/2009 Minnesota<br />
X8787‐1 11.7 34.3 33.1 90.5 NA 7/13/2009 Wisconsin<br />
X8791‐1 11.5 32.3 32.2 73.6 NA 7/13/2009 Wisconsin<br />
X8995‐4 11.6 36.2 32.8 80.7 78.1 7/6/2009 Wisconsin<br />
Mean 11.4 34.6 32.6 87.1 86.6<br />
CV% 4.5 1.5 3.8 10.3 6.6<br />
LSD 5% 0.7 0.7 1.8 12.8 8.4<br />
* Yield Adjusted to 14% moisture<br />
Design: RCB, plot size 3 x 20', (3 x 18' harvested) Harvested: 9‐3‐2009<br />
Soil type: Eben very cobbly s<strong>and</strong>y loam Herbicide: 1.5 pts of Buctril/ac<br />
Seeded: 5‐12‐2009 (96 lbs/ac) Fertility: 150 lbs/ac 46‐0‐0<br />
Table 5. Spring Wheat Variety Trial 2009<br />
UPES, Chatham, MI<br />
Variety<br />
Moisture<br />
(%)<br />
Test wt<br />
(lbs/bu) Ht (in) Bu/acre* 2 yr avg<br />
Heading<br />
Date Origin<br />
Ada 11.3 60.9 28.8 27.5 29.0 7/10/2009 Minnesota<br />
Briggs 11.7 61.4 30.5 35.2 36.5 7/5/2009 South Dakota<br />
Oklee 11.9 62.5 29.1 32.0 33.3 7/7/2009 Minnesota<br />
RB07 11.8 60.6 27.1 36.7 37.2 7/5/2009 Minnesota<br />
Tom 12.0 61.4 29.0 26.0 29.3 7/8/2009 Minnesota<br />
Traverse 11.3 59.4 30.8 36.0 38.5 7/8/2009 South Dakota<br />
Ulen 11.5 60.8 27.3 29.7 31.6 7/8/2009 Minnesota<br />
Mean 11.7 61.0 28.9 31.8 33.6<br />
CV% 2.4 0.8 6.1 13.3 7.5<br />
LSD 5% 0.4 0.7 2.6 6.3 3.7<br />
* Yield Adjusted to 13% moisture<br />
Design: RCB, plot size 3 x 20', (3 x 18' harvested) Harvested: 9‐8‐2009<br />
Soil type: Eben very cobbly s<strong>and</strong>y loam Herbicide: 1.5 pts of Buctril/ac<br />
Seeded: 5‐12‐2009 (150 lbs/ac) Fertility: 150 lbs/ac 46‐0‐0
Table 6. Grass Variety Trial Yield<br />
UPES, Chatham, MI<br />
<strong>Forage</strong> yields, animal preference, <strong>and</strong> st<strong>and</strong> ratings<br />
Non‐irrigated<br />
Preference St<strong>and</strong><br />
Species/Marketer Cultivar 1‐Jun 26‐Jun 27‐Jul 30‐Sep 2009 1 to 5* 1 to 10†<br />
Orchardgrass<br />
Entry 25‐Jun 5‐Aug 1‐Oct 2009<br />
Garst 6417 1.62 1.15 0.68 3.46<br />
Garst 6431 1.57 1.13 0.75 3.44<br />
Vernal 1.54 1.17 0.73 3.43<br />
DKA33‐16 1.45 1.16 0.77 3.38<br />
Velocity 1.49 1.14 0.72 3.35<br />
DK140 1.48 1.14 0.72 3.34<br />
Pioneer 55V48 1.41 1.09 0.62 3.11<br />
WL343HQ 1.34 1.00 0.75 3.09<br />
Evergreen 3 1.46 0.96 0.64 3.05<br />
AmeriSt<strong>and</strong> 407TQ 1.40 1.02 0.62 3.04<br />
Mean 1.47 1.10 0.70 3.27<br />
CV% 15 14 19 14<br />
LSD 5% NS NS NS NS<br />
dry matter yield tons/acre cut 1 cut 2 cut 3 cut 4 spring09<br />
DLF Intl Endurance 0.56 0.53 0.57 0.38 2.04 3.9 3.9 2.6 3.9 8.5<br />
FFR OG0604WH 0.62 0.50 0.54 0.35 2.01 3.0 3.6 3.8 3.6 8.8<br />
FFR OG0606G 0.44 0.59 0.59 0.36 1.98 4.3 4.3 3.4 4.3 8.3<br />
FFR OG0505G 0.48 0.52 0.54 0.43 1.96 3.6 3.6 2.6 3.6 8.5<br />
Check Elsie 0.57 0.46 0.58 0.33 1.94 4.1 4.0 2.9 4.0 8.3<br />
FFR OG0605G 0.53 0.42 0.53 0.26 1.74 3.8 3.9 3.1 3.9 9.0<br />
Perennial Ryegrass<br />
Pickseed Intl PSG06BLh** 0.41 0.51 0.62 0.40 1.93 4.4 3.9 3.4 3.9 6.5<br />
Pickseed Intl PSG47M01 0.50 0.63 0.45 0.26 1.84 3.5 3.6 3.8 3.6 7.3<br />
Pickseed Intl PSGAM108 0.47 0.67 0.39 0.15 1.67 3.4 2.5 2.5 2.5 7.5<br />
Check BG34 0.41 0.58 0.45 0.21 1.65 2.4 2.4 2.1 2.4 6.3<br />
Mean 0.50 0.54 0.52 0.31 1.88 3.6 3.6 3.0 3.6 7.9<br />
CV% 28 21 18 33 13 10 13 34 13 7<br />
LSD 5% 0.2 0.17 0.13 0.14 0.35 0.5 0.6 1.5 0.6 0.7<br />
*Visual Rating 1‐5 with 0=0% grazed, 1=20%, 2=40%, 3=60%, 4=80%, 5=100% grazed. Preference of grasses is established by<br />
visual estimation of percent defoliation of the plots after 6‐8 hours of grazing by Holstein cows.<br />
**Hybrid ryegrass (Lolium hybrid)<br />
† Visual Rating 1‐10 with 10 =90‐100% ground cover<br />
Design: RCB, plot size 3 x 24'<br />
Soil type: Eben very cobbly s<strong>and</strong>y loam<br />
Seeded: 5‐15‐2008<br />
Fertility: 200 lbs N/a. (50 lbs/a. following green‐up, 50 lbs/a. after cuts 1‐3)<br />
Table 7. Alfalfa Variety Trial Yield<br />
(DM tons/acre)<br />
UPES, Chatham, MI<br />
Design: RCB, plot size: 3 x 24’<br />
Seeded: 8/1/08, 20 lbs. PLS/acre<br />
Soil type: Eben Very Cobbly S<strong>and</strong>y<br />
Loam<br />
Fertility: 0‐84‐252 /acre
Table 8. Silage <strong>Corn</strong> Variety Trial (80‐92 Day)<br />
Alger County 2009<br />
2009 YIELD<br />
% QUALITY<br />
BRAND / HYBRID RM %DM GT/A DT/A IVD ADF NDF NDFD CP<br />
DEKALB DKC36‐34 (VT3) 80 20.9 22.9 4.8 73.3 30.8 57.8 53.9 8.8<br />
DEKALB DKC38‐89 (VT3) 81 19.5 24.6 4.8 73.4 31.2 58.8 54.9 9.3<br />
DYNAGRO 52V01 80 19.4 26.6 5.2 73.2 32.3 60.0 55.5 8.6<br />
DYNAGRO 53V80 83 18.5 26.4 4.9 75.5 31.5 60.5 59.6 9.1<br />
MYCOGEN 2D140 86 19.5 23.3 4.5 75.9 29.4 56.2 57.0 8.9<br />
MYCOGEN TMF2Q296 88 18.6 26.4 4.9 76.0 32.2 60.6 60.4 8.6<br />
NuTech 1B‐887 CB/LL 90 19.2 27.3 5.2 74.0 32.1 59.5 56.3 8.6<br />
NuTech 3C‐889 RR/YGCB 91 20.3 25.2 5.1 74.3 30.6 57.7 55.4 9.6<br />
NuTech 3A‐094 RR/LFY 92 18.5 25.6 4.7 75.4 31.7 59.9 58.9 9.4<br />
NuTech 3T‐295 VT3 82 19.0 23.1 4.4 76.7 30.3 57.4 59.5 8.9<br />
PIONEER 39V08 86 20.4 22.1 4.5 69.9 34.1 60.2 50.1 9.0<br />
PIONEER 39B23 87 21.4 24.7 5.3 71.7 34.0 61.3 53.9 8.8<br />
PIONEER 38N88 86 21.9 24.2 5.3 77.6 26.7 52.6 57.5 8.9<br />
PIONEER 38H08 87 21.0 26.3 5.5 71.6 32.7 58.4 51.3 8.2<br />
NK Br<strong>and</strong> N19G 87 19.2 24.8 4.7 72.0 33.8 61.6 54.6 9.1<br />
NK Br<strong>and</strong> N22‐C2 87 20.2 25.2 5.1 72.3 33.8 62.3 55.7 8.9<br />
NK Br<strong>and</strong> N23K 88 21.1 26.3 5.6 74.1 30.9 57.7 55.1 9.0<br />
Mean 19.9 25.0 5.0 73.9 31.6 59.0 55.8 8.9<br />
CV (%) 5.8 5.2 7.2 4.0 8.2 6.3 5.3 10.7<br />
LSD (5%) 1.6 1.8 0.5 4.2 3.7 5.3 4.2 1.4<br />
Table 9. Silage <strong>Corn</strong> Variety Trial (80‐92 Day)<br />
2009 Menominee County<br />
2009 YIELD<br />
% QUALITY<br />
BRAND / HYBRID RM %DM GT/A DT/A IVD ADF NDF NDFD CP<br />
DEKALB DKC36‐34 (VT3) 80 38.4 17.5 6.8 79.7 25.3 49.9 59.2 7.2<br />
DEKALB DKC38‐89 (VT3) 81 39.2 22.0 8.6 83.1 21.2 43.2 60.9 7.1<br />
DYNAGRO 52V01 80 31.7 20.4 6.4 79.7 25.5 48.0 57.4 6.7<br />
DYNAGRO 53V80 83 33.0 23.4 7.8 79.8 26.0 49.9 59.5 6.7<br />
MYCOGEN 2D140 86 35.1 20.0 7.0 82.3 21.9 44.6 60.0 7.1<br />
MYCOGEN TMF2Q296 88 32.3 22.7 7.3 82.2 24.7 49.3 63.9 6.7<br />
NuTech 1B‐887 CB/LL 90 30.6 23.4 7.2 79.6 25.9 49.1 58.5 7.3<br />
NuTech 3C‐889 RR/YGCB 91 37.9 19.7 7.5 80.4 25.7 51.6 62.0 6.7<br />
NuTech 3A‐094 RR/LFY 92 29.2 24.2 7.1 81.7 24.8 48.3 62.1 7.4<br />
NuTech 3T‐295 VT3 82 34.3 22.0 7.6 82.8 22.5 45.5 62.2 7.1<br />
PIONEER 39V08 86 39.0 17.6 6.9 77.2 27.6 52.3 56.5 6.8<br />
PIONEER 39B23 87 40.5 19.7 8.0 81.0 24.5 48.3 60.7 6.9<br />
PIONEER 38N88 86 33.7 22.8 7.7 80.8 24.1 47.9 59.9 7.5<br />
PIONEER 38H08 87 35.4 20.7 7.3 80.6 24.5 46.5 58.4 6.4<br />
NK Br<strong>and</strong> N19G 87 33.3 21.1 7.0 79.3 26.9 51.2 59.8 7.7<br />
NK Br<strong>and</strong> N22‐C2 87 34.8 24.1 8.3 80.5 24.9 49.1 60.3 7.2<br />
NK Br<strong>and</strong> N23K 88 39.7 22.3 8.8 80.3 25.4 48.6 59.4 6.8<br />
Mean 35.2 21.4 7.5 80.6 24.8 48.4 60.0 7.0<br />
CV (%) 9.6 8.3 9.7 2.8 11.4 8.3 4.1 6.6<br />
LSD (5%) 4.8 2.5 1.0 3.2 4.0 5.7 3.5 0.7
Table 10. Silage <strong>Corn</strong> Varity Trial (90‐104 Day)<br />
Menominee County 2009<br />
2009 YIELD<br />
% QUALITY<br />
BRAND / HYBRID RM %DM GT/A DT/A IVD ADF NDF NDFD CP<br />
DAIRYLAND Hi DF‐3000‐9 100 33.3 20.8 7.0 82.0 22.2 44.4 59.3 6.7<br />
DAIRYLAND STEALTH‐9196 96 36.6 19.4 7.1 81.3 21.5 42.8 56.5 6.4<br />
DAIRYLAND STEALTH‐9799 99 33.8 19.4 6.5 79.8 23.4 45.4 55.8 6.6<br />
DYNAGRO 55R10 100 33.2 22.4 7.4 82.1 23.2 46.3 61.5 6.5<br />
DYNAGRO 55V48 102 33.0 20.8 6.8 82.5 21.3 42.6 59.0 6.5<br />
GREAT LAKES 4041G3VT3 90 36.7 20.1 7.3 81.6 22.8 44.9 59.0 6.8<br />
GREAT LAKES 4481G3VT3 94 34.5 20.5 7.0 81.3 23.3 45.2 58.8 6.6<br />
MYCOGEN TMF2L418 94 34.8 19.4 6.7 81.5 24.0 47.3 61.1 6.6<br />
MYCOGEN TMF2R521 98 33.3 21.5 7.1 82.0 22.5 44.6 59.8 6.7<br />
MYCOGEN TMF2W587 104 33.6 21.7 7.3 81.9 22.0 43.4 58.5 6.8<br />
NuTech 3T‐600 VT3 100 32.3 21.5 6.9 81.4 23.8 46.3 59.7 6.6<br />
NuTech 5X‐100 RR/HXT 100 33.2 23.2 7.7 81.7 22.8 45.4 59.8 6.7<br />
NuTech 3T‐603 VT3 103 32.0 24.2 7.7 79.4 24.4 47.3 56.5 6.5<br />
PIONEER 38M60 94 38.0 17.7 6.7 82.1 21.5 43.6 59.2 6.4<br />
PIONEER 38P43 95 38.8 16.9 6.6 80.8 23.1 46.2 58.5 6.4<br />
PIONEER 36Y26 101 32.2 22.4 7.2 81.3 23.8 46.3 59.7 7.0<br />
Mean 34.3 20.7 7.1 81.4 22.8 45.1 58.9 6.6<br />
CV (%) 7.4 8.5 9.3 1.9 10.2 7.7 2.9 6.3<br />
LSD (5%) 2.1 1.4 0.5 1.3 1.9 2.8 1.4 0.3<br />
Table 10a. Agronomic information on silage trial locations<br />
County<br />
Planting<br />
Date<br />
Menominee 5/15/2009<br />
Harvest<br />
Date<br />
9/26/2009<br />
10/7/2009<br />
Previous<br />
Crop<br />
Average<br />
St<strong>and</strong><br />
<strong>Corn</strong> 33,792<br />
Alger 5/15/2009 10/7/2009 Canola 32,768<br />
Fertility<br />
N‐P‐K<br />
145‐40‐40<br />
+ Manure<br />
160‐40‐40<br />
+ Manure<br />
Soil Type Farm Cooperator<br />
Onaway<br />
S<strong>and</strong>y Loam<br />
Eben Very<br />
Cobbly S<strong>and</strong>y<br />
Loam<br />
Johnson Farms LLC<br />
U.P. Experiment<br />
Station
Table 11. <strong>Corn</strong> <strong>Grain</strong> Variety Trial (81‐92 Day)<br />
Delta <strong>and</strong> Menominee County 2009<br />
2009 Delta<br />
BRAND / HYBRID RM<br />
%<br />
moisture Bu/acre*<br />
Menominee<br />
Twt<br />
(lbs/bu)<br />
%<br />
moisture<br />
Bu/acre*<br />
Twt<br />
(lbs/bu)<br />
BAYSIDE Super 80 80 27.9 116.8 52.0 21.1 149.2 54.1<br />
BAYSIDE 1541RR 81 31.7 125.9 51.0 19.8 149.4 54.1<br />
DEKALB DKC30‐23 (RR2) 80 25.8 137.2 52.1 20.5 146.4 54.5<br />
DEKALB DKC33‐54 (RR2) 83 23.2 129.4 53.2 19.9 141.5 54.3<br />
DEKALB DKC36‐34 (VT3) 86 27.0 136.2 51.3 23.3 167.1 53.2<br />
DEKALB DKC38‐89 (VT3) 88 37.2 121.2 50.3 26.4 154.2 52.0<br />
DEKALB DKC40‐20 (VT3) 90 36.9 126.6 50.4 28.3 165.7 51.9<br />
DEKALB DKC41‐60 (VT3) 91 38.0 137.3 50.3 28.6 159.0 51.6<br />
DEKALB DKC42‐72 (VT3) 92 37.8 136.4 50.4 30.1 157.4 51.3<br />
DYNAGRO 51V45 82 24.8 125.5 52.3 21.7 140.7 54.0<br />
DYNAGRO 52V01 86 32.3 138.1 50.9 24.2 169.1 52.5<br />
DYNAGRO CX08287 87 34.8 142.1 50.5 24.0 151.6 52.8<br />
HYLAND SEEDS HLB32R 86 36.3 122.7 50.5 21.8 154.6 53.8<br />
HYLAND SEEDS HLCVR36 87 36.0 117.5 50.4 28.3 149.5 51.6<br />
NuTech 1B‐887 CB/LL 87 37.0 131.2 50.4 24.3 144.1 52.5<br />
NuTech 1N‐887 CB/LL/RW 87 38.4 126.2 50.3 24.2 154.5 52.1<br />
G2 GENETICS 5X‐591 RR/HXT 88 35.8 112.8 50.4 25.0 149.8 52.2<br />
NuTech 3C‐889 RR/YGCB 89 35.0 133.5 50.6 24.5 167.2 52.0<br />
PIONEER 39V07 80 27.4 123.4 51.8 21.2 157.4 53.4<br />
PIONEER 39B23 88 32.8 136.8 50.9 24.0 161.0 52.6<br />
RENK RK212CBLL 82 32.0 144.3 51.1 20.5 166.4 54.3<br />
RENK RK292GTCBLL 85 37.1 127.4 50.4 24.1 152.5 52.9<br />
RENK RK302CBLL 87 35.8 137.8 50.5 23.8 151.5 52.2<br />
Mean 33.1 129.8 50.9 23.9 154.8 52.8<br />
CV (%) 5.9 6.3 0.9 7.1 6.7 1.5<br />
LSD (5%) 2.7 11.6 0.6 2.4 14.6 1.1<br />
* Yield adjusted to 15.5 % moisture<br />
Table 11a. Agronomic information on grain trial locations<br />
County<br />
Planting<br />
Date<br />
Harvest<br />
Date<br />
Previous<br />
Crop<br />
Average<br />
St<strong>and</strong><br />
Menominee 5/15/2009 11/16/2009 <strong>Corn</strong> 31,680<br />
Delta 5/15/2009 11/16/2009 <strong>Corn</strong> 27,720<br />
Fertility<br />
N‐P‐K<br />
145‐40‐40<br />
+ Manure<br />
131‐40‐40<br />
+ Manure<br />
Soil Type Farm Cooperator<br />
Onaway<br />
S<strong>and</strong>y Loam<br />
Charlevoix<br />
S<strong>and</strong>y Loam<br />
Johnson Farms LLC<br />
Herioux Farms LLC<br />
Special thanks to Johnson Farms <strong>and</strong> Herioux Farms for cooperating with us this year.<br />
Special thanks also to Project GREEEN for partially funding the Upper Peninsula <strong>Corn</strong> Trials for 2009.