

Volatility Arbitrage from the Short Side - Oxeye Capital Management ...
Volatility Arbitrage from the Short Side - Oxeye Capital Management ...
Volatility Arbitrage from the Short Side - Oxeye Capital Management ...

You also want an ePaper? Increase the reach of your titles
YUMPU automatically turns print PDFs into web optimized ePapers that Google loves.
<strong>Oxeye</strong> <strong>Capital</strong> <strong>Management</strong> Limited<br />
<strong>Volatility</strong> <strong>Arbitrage</strong> <strong>from</strong> <strong>the</strong> <strong>Short</strong> <strong>Side</strong><br />
Printed in Hedge Funds World October 2003<br />
One sector currently sparking interest in <strong>the</strong> alternative investment arena is <strong>Volatility</strong> <strong>Arbitrage</strong><br />
(VA). The definition of arbitrage is <strong>the</strong> opportunity to buy an asset at a low price <strong>the</strong>n<br />
immediately to sell it on a different market for a higher price, effectively a riskless trade.<br />
<strong>Volatility</strong> arbitrage is <strong>the</strong> process of executing riskless trades in volatility.<br />
For this purpose volatility may be measured in two specific ways. Firstly <strong>the</strong> historical or<br />
statistical volatility which measures <strong>the</strong> extent of an asset’s movement or speed of movement.<br />
And secondly implied volatility which is specific to options and measures <strong>the</strong> rate of an option’s<br />
price change implied by current trading.<br />
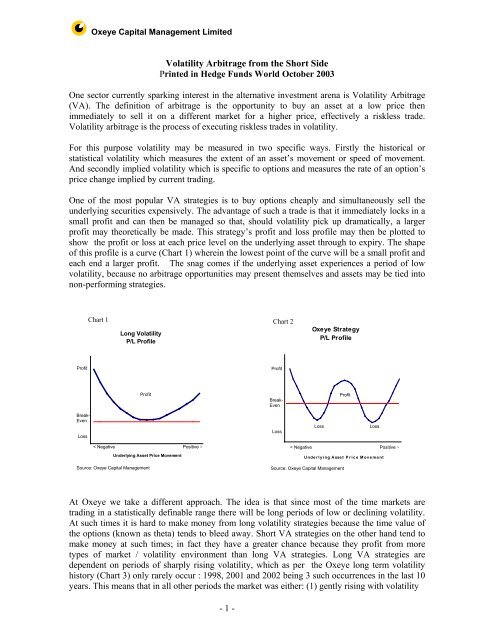
One of <strong>the</strong> most popular VA strategies is to buy options cheaply and simultaneously sell <strong>the</strong><br />
underlying securities expensively. The advantage of such a trade is that it immediately locks in a<br />
small profit and can <strong>the</strong>n be managed so that, should volatility pick up dramatically, a larger<br />
profit may <strong>the</strong>oretically be made. This strategy’s profit and loss profile may <strong>the</strong>n be plotted to<br />
show <strong>the</strong> profit or loss at each price level on <strong>the</strong> underlying asset through to expiry. The shape<br />
of this profile is a curve (Chart 1) wherein <strong>the</strong> lowest point of <strong>the</strong> curve will be a small profit and<br />
each end a larger profit. The snag comes if <strong>the</strong> underlying asset experiences a period of low<br />
volatility, because no arbitrage opportunities may present <strong>the</strong>mselves and assets may be tied into<br />
non-performing strategies.<br />
3000<br />
2500 Profit<br />
2000<br />
1500<br />
1000<br />
500<br />
Break-<br />
Even<br />
0<br />
-500<br />
Loss<br />
Chart 1<br />
Long <strong>Volatility</strong><br />
P/L Profile<br />
Profit<br />
-1000<br />
-16%-14%-12%-10% < Negative -8% -6% -4% -2% 0% 2% 4% 6% 8% 10% Positive 12% 14% 16% ><br />
Underlying Asset Price Movement<br />
Source: <strong>Oxeye</strong> <strong>Capital</strong> <strong>Management</strong><br />
- 1 -<br />
Chart 2<br />
1 0 %<br />
8 %<br />
6 %<br />
4 %<br />
2 %<br />
-2 %<br />
-4 %<br />
-8 %<br />
<strong>Oxeye</strong> Strategy<br />
P/L Profile<br />
< Negative Positive ><br />
Underlying Asset Price Movement<br />
At <strong>Oxeye</strong> we take a different approach. The idea is that since most of <strong>the</strong> time markets are<br />
trading in a statistically definable range <strong>the</strong>re will be long periods of low or declining volatility.<br />
At such times it is hard to make money <strong>from</strong> long volatility strategies because <strong>the</strong> time value of<br />
<strong>the</strong> options (known as <strong>the</strong>ta) tends to bleed away. <strong>Short</strong> VA strategies on <strong>the</strong> o<strong>the</strong>r hand tend to<br />
make money at such times; in fact <strong>the</strong>y have a greater chance because <strong>the</strong>y profit <strong>from</strong> more<br />
types of market / volatility environment than long VA strategies. Long VA strategies are<br />
dependent on periods of sharply rising volatility, which as per <strong>the</strong> <strong>Oxeye</strong> long term volatility<br />
history (Chart 3) only rarely occur : 1998, 2001 and 2002 being 3 such occurrences in <strong>the</strong> last 10<br />
years. This means that in all o<strong>the</strong>r periods <strong>the</strong> market was ei<strong>the</strong>r: (1) gently rising with volatility<br />
Profit<br />
Break- 0%<br />
Even<br />
-6 % Loss<br />
Source: <strong>Oxeye</strong> <strong>Capital</strong> <strong>Management</strong><br />
Profit<br />
Loss Loss
<strong>Oxeye</strong> <strong>Capital</strong> <strong>Management</strong> Limited<br />
falling, (2) gently falling with volatility gently rising or (3) moving sideways with volatility<br />
falling. All of which are environments friendly to <strong>the</strong> VA seller who will cash in on<br />
Implied <strong>Volatility</strong> %<br />
Chart 3<br />
35%<br />
30%<br />
25%<br />
20%<br />
15%<br />
10%<br />
5%<br />
<strong>Oxeye</strong> <strong>Volatility</strong> Index<br />
0%<br />
1995 1996 1997 1998 1999 2000 2001 2002 2003<br />
Source: <strong>Oxeye</strong> <strong>Capital</strong> <strong>Management</strong> Limited<br />
regular small profits which, assuming he gets his sums right, take care of <strong>the</strong> occasional large-ish<br />
loss. But what happens when that loss does comes along? The loss is limited to <strong>the</strong> 2 lower levels<br />
of <strong>the</strong> W (Chart 2). In <strong>the</strong> event of a huge 1987 style move <strong>the</strong> outside slopes of <strong>the</strong> W kick in<br />
and <strong>the</strong> strategy becomes long of volatility and benefits <strong>from</strong> <strong>the</strong> greater ratio of long out-of-<strong>the</strong>money<br />
options relative to short in- or at-<strong>the</strong>-money options. O<strong>the</strong>r benefits include <strong>the</strong> selfhealing<br />
aspect of <strong>the</strong> process in that normally <strong>the</strong> occasional large losses stem <strong>from</strong> a period of<br />
sharply rising volatility. In a similar vein to ‘averaging down’ <strong>the</strong> volatility seller takes in a<br />
higher income during periods of sharply rising volatility and <strong>the</strong>n, as volatility subsides, enjoys a<br />
steady period of profitability which quickly pays for any losses <strong>from</strong> <strong>the</strong> spike in volatility<br />
(usually a matter of 6 months or so in <strong>Oxeye</strong>’s experience). In a similar way to insurance<br />
underwriting <strong>the</strong> market prices <strong>the</strong> risk and pays <strong>the</strong> risk-taker an acceptable premium for being<br />
in <strong>the</strong> market. This gives an attractive return to drawdown ratio and compares favourably with<br />
long only strategies where it may take many years to recover bear market losses.<br />
To conclude, such a strategy might hardly be termed an investment process, but more of a risk<br />
management exercise which, when combined with more traditional investment strategies, may be<br />
structured to produce a well-balanced and flexible approach for <strong>the</strong> modern fund manager.<br />
Article written by Martin Pe<strong>the</strong>rick of <strong>Oxeye</strong> <strong>Capital</strong> <strong>Management</strong> Limited<br />
This Publication is issued by <strong>Oxeye</strong> <strong>Capital</strong> <strong>Management</strong> Limited (‘<strong>Oxeye</strong>' ) which is regulated by The Financial Services Authority. References to ‘we’,<br />
‘us’ and ‘our’ in this Publication shall mean <strong>Oxeye</strong> unless o<strong>the</strong>rwise stated. This Publication was prepared and distributed by us for information purposes<br />
only, and may contain information, advice, recommendations and/or opinions, which may be used as <strong>the</strong> basis for trading undertaken by us and our<br />
officers, employees, associated and/or affiliated companies. This Publication should not be construed as solicitation, nor as offering advice for <strong>the</strong><br />
purposes of <strong>the</strong> purchase or sale of any derivative, security or investment. The information and opinions contained within this Publication were considered<br />
by us to be valid when published. This Publication may also contain information that has been provided to us by third parties. The source of such<br />
information may be disclosed within this Publication where relevant. Whilst we consider we have taken all reasonable steps to ensure <strong>the</strong> information is<br />
correct, we do not under any circumstances whatsoever, warrant <strong>the</strong> accuracy or completeness of such information. Any person placing reliance upon this<br />
Publication to undertake trading, does so entirely at <strong>the</strong>ir own risk, and accordingly, we do not accept any liability as a result, whe<strong>the</strong>r direct or indirectly<br />
incurred. Derivatives and securities markets may be subject to rapid and unexpected price movements, and past performance is not necessarily a guide to<br />
future performance. Currency movements may also have an unfavourable, as well as favourable effect on <strong>the</strong> value of <strong>the</strong> underlying investment and/or<br />
assets. Investments and/or strategies discussed herein, may not be suitable for all investors. Accordingly, if any person reading this Publication has doubts<br />
about <strong>the</strong>ir particular suitability, <strong>the</strong>y should consult an independent investment adviser.<br />
- 2 -