

PAPER NO.: 70 New Common Rail Systems ... - Ganser CRS AG
PAPER NO.: 70 New Common Rail Systems ... - Ganser CRS AG
PAPER NO.: 70 New Common Rail Systems ... - Ganser CRS AG

Create successful ePaper yourself
Turn your PDF publications into a flip-book with our unique Google optimized e-Paper software.
has been investigated using the AMESim<br />
simulation model of Reference [8]. If dynamic<br />
pressure waves arise due to the pumping strokes<br />
of the pump, the most critical location is the inlet<br />
at the beginning of the individual fuel lines leading<br />
to each injector, see Fig. 4, because a fluctuating<br />
pressure at this location will influence the injected<br />
quantity at the injectors.<br />
To isolate the effects caused by the injections<br />
from those caused by the HP Pump, the injections<br />
were switched off in the model, so that no fuel is<br />
injected. The results are shown in Figure 12.<br />
Figure 12: Pressure histories with injectors<br />
switched off at the beginning of the 8 fuel lines of<br />
the system according to Figure 4, obtained with<br />
the AMESim simulation model of Reference [8],<br />
together with the history of the HP fuelling at the<br />
pump outlet.<br />
The high pressure fuelling into the system (bottom<br />
picture of Figure 12) fluctuates between 5 and 10<br />
Liters/Min., this means up to 50%. The higher<br />
fluctuations in the time between 0.20 and 0.30 s is<br />
due to the higher outlet pressure and the resulting<br />
stiffer bulk modulus of the fuel.<br />
These relatively high fluctuations of the pump fuel<br />
delivery do not cause noticeable pressure waves<br />
in the overall HP volume, as shown on the top<br />
picture of Figure 12. At the beginning of<br />
simulation, the pressure in the system has been<br />
set to 500 bar. This pressure gradually increases<br />
at the inlet to the individual injector’s fuel lines due<br />
do the delivery of the pump and the absence of<br />
injection events. The 8 tracings are practically<br />
super imposed; the effects of pressure waves are<br />
negligible.<br />
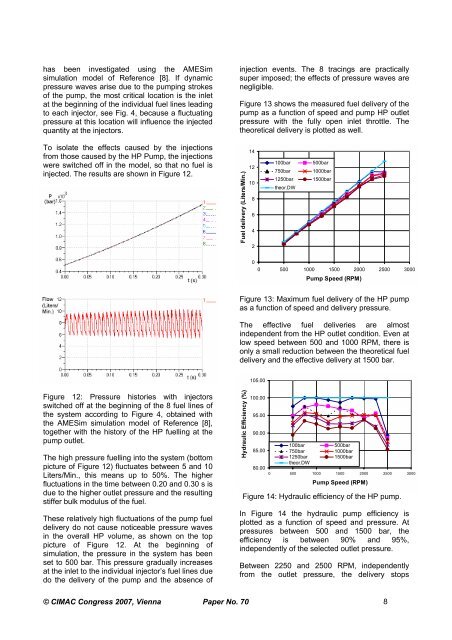
Figure 13 shows the measured fuel delivery of the<br />
pump as a function of speed and pump HP outlet<br />
pressure with the fully open inlet throttle. The<br />
theoretical delivery is plotted as well.<br />
0<br />
0 500 1000 1500 2000 2500 3000<br />
© CIMAC Congress 2007, Vienna Paper No. <strong>70</strong> 8<br />
Fuel delivery (Liters/Min.)<br />
14<br />
12<br />
10<br />
8<br />
6<br />
4<br />
2<br />
100bar 500bar<br />
750bar 1000bar<br />
1250bar 1500bar<br />
theor.DW<br />
Pump Speed (RPM)<br />
Figure 13: Maximum fuel delivery of the HP pump<br />
as a function of speed and delivery pressure.<br />
The effective fuel deliveries are almost<br />
independent from the HP outlet condition. Even at<br />
low speed between 500 and 1000 RPM, there is<br />
only a small reduction between the theoretical fuel<br />
delivery and the effective delivery at 1500 bar.<br />
Hydraulic Efficiency (%)<br />
105.00<br />
100.00<br />
95.00<br />
90.00<br />
100bar 500bar<br />
85.00 750bar 1000bar<br />
80.00<br />
1250bar<br />
theor.DW<br />
1500bar<br />
0 500 1000 1500 2000 2500 3000<br />
Pump Speed (RPM)<br />
Figure 14: Hydraulic efficiency of the HP pump.<br />
In Figure 14 the hydraulic pump efficiency is<br />
plotted as a function of speed and pressure. At<br />
pressures between 500 and 1500 bar, the<br />
efficiency is between 90% and 95%,<br />
independently of the selected outlet pressure.<br />
Between 2250 and 2500 RPM, independently<br />
from the outlet pressure, the delivery stops