Splash of Math 4–8 - Sea World
Splash of Math 4–8 - Sea World
Splash of Math 4–8 - Sea World

Create successful ePaper yourself
Turn your PDF publications into a flip-book with our unique Google optimized e-Paper software.
6. Discuss the animals’ food intake.<br />
Note that the animal information<br />
cards list food intake as a percent<br />
<strong>of</strong> body weight. Choose one animal<br />
and have the students determine<br />
the range <strong>of</strong> amount <strong>of</strong> daily food<br />
intake. Why is giving a percent<br />
<strong>of</strong> body weight a better way to<br />
communicate this information<br />
than by giving a range?<br />
7. Have students create pie charts<br />
depicting various animals’ diets<br />
at <strong>Sea</strong><strong>World</strong>.<br />
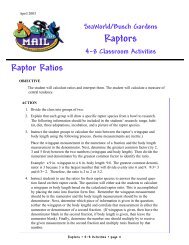
4. Communicating maximum adult sizes:<br />
Students may create various bar<br />
graphs. The top graph here is<br />
one example.<br />
5. For animal populations,<br />
swimming speed, and<br />
diving depth, students<br />
may suggest and create<br />
various types <strong>of</strong> bar graphs.<br />
6. Determining the range <strong>of</strong> food intake:<br />
Using a Florida manatee as an<br />
example, Florida manatees range in<br />
size from 363 to 544 kilograms, and<br />
they eat 4% to 9% <strong>of</strong> their body<br />
weight per day. On the low side <strong>of</strong><br />
the range, we can calculate:<br />
363 kilograms x 0.04<br />
= 14.5 kilograms <strong>of</strong> food per day<br />
On the high side <strong>of</strong> the range we can<br />
calculate:<br />
544 kilograms x 0.09<br />
= 49.0 kilograms <strong>of</strong><br />
food per day<br />
Percent food intake is a more<br />
accurate picture <strong>of</strong> how much an<br />
individual animal eats, given that<br />
the adult size <strong>of</strong> animals varies.<br />
Larger animals <strong>of</strong> the same<br />
species generally eat more than<br />
small animals.<br />
7. Students create pie charts such<br />
as the graph at right.<br />
ANSWERS<br />
<strong>Splash</strong> <strong>of</strong> <strong>Math</strong> <strong>4–8</strong><br />
8. Next, students gain experience<br />
making scale drawings. Have each<br />
learning group choose one animal<br />
from the Ocean Animals information<br />
cards and trace it onto graph paper.<br />
They will use their tracing to create<br />
an enlarged drawing in proportion to<br />
the size <strong>of</strong> the original. First, each<br />
group decides whether their new<br />
drawing will reflect a proportion <strong>of</strong><br />
2:1, 3:1, or 4:1. Help them plot key<br />
points on their graph paper and<br />
create their drawings. Ask students<br />
how they would plan to construct a<br />
life-size scale drawing <strong>of</strong> their animal.<br />
©2004 <strong>Sea</strong> <strong>World</strong>, Inc. 15