Raptor Population Ecology - Sea World
Raptor Population Ecology - Sea World
Raptor Population Ecology - Sea World

You also want an ePaper? Increase the reach of your titles
YUMPU automatically turns print PDFs into web optimized ePapers that Google loves.
April 2003<br />
<strong>Raptor</strong> <strong>Population</strong> <strong>Ecology</strong><br />
OBJECTIVE<br />
ACTION<br />
1. Divide the class into groups of three or four.<br />
<strong>Sea</strong><strong>World</strong>/Busch Gardens<br />
<strong>Raptor</strong>s<br />
9-12 Classroom Activities<br />
The student will calculate population size, carrying capacity, annual change in population size, and<br />
maximum rate of population increase.<br />
2. Explain that each group is going to analyze the results from a ten-year raptor study.<br />
Each group will be assigned a different study to analyze involving different raptor<br />
species. Students will write a brief synopsis about their assigned raptor species<br />
including the following information: range, habitat, diet, incubation, description, and<br />
status. Students should locate a photograph of the raptor to include in their research.<br />
3. Review the definitions listed in the background and the procedure for calculating<br />
population size, carrying capacity, annual change in population size, and maximum<br />
rate of population increase.<br />
4. Instruct students to read all the background information on the study provided them,<br />
calculate the population size, carrying capacity, maximum rate of population<br />
increase, and the annual change in population size for each year of the study. All calculated<br />
totals should be rounded to the nearest 100th and documented on the raptor<br />
chart provided. Note: For convenience, information given in the background is<br />
already listed on the chart.<br />
5. Instruct students to answer the questions on their funsheets regarding their study<br />
analysis.<br />
6. Create a mock raptor convention for students to display the results of their study.<br />
Each student group will act as representatives from their particular study and present<br />
their research. The teacher will check the calculations for accuracy using the<br />
teacher’s guide.<br />
<strong>Raptor</strong>s • 9-12 Activities • page 1
MATERIALS<br />
For each student group:<br />
• copy of a <strong>Raptor</strong> <strong>Population</strong> <strong>Ecology</strong><br />
funsheet (studies 1 to 8)<br />
• copy of Background Information on<br />
Formulas study guide<br />
• calculator<br />
• library or internet access<br />
for class:<br />
• <strong>Raptor</strong> <strong>Population</strong> <strong>Ecology</strong> Answer Sheet<br />
PREPARATION<br />
Photocopy the raptor population ecology<br />
funsheets. Make sure there are enough<br />
sheets for each student group (groups of<br />
three or four) to have one. Fold sheets in<br />
half and have a representative from each<br />
student group choose one.<br />
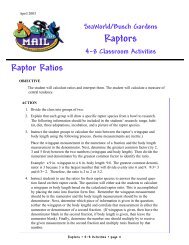
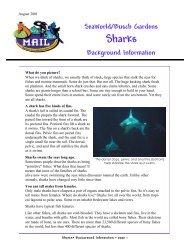
Screech owls, like Emma above, are the smalled North American<br />
owls with “ear tuffs.” Emma was rescued after being hit by a car and<br />
losing a wing. Today she helps the Busch GardensTampa Bay<br />
Education Department staff teach about raptor conservation.<br />
<strong>Raptor</strong>s • 9-12 Activities • page 2 © 2003 Busch Gardens.
BACKGROUND INFORMATION ON FORMULAS<br />
<strong>Population</strong> (N): A group of individuals of one species that live in a particular geographic area.<br />
Carrying Capacity (K): The maximum population size that can be supported by the available resources.<br />
Biotic Potential (r max): The maximum rate of natural increase that can possibly occur under ideal<br />
circumstances (unlimited resources, space, no predators, no parasites,etc.). It is very difficult to<br />
calculate the biotic potential for a species since these optimal circumstances rarely occur.<br />
�N: The number of organisms added to a population within a unit of time.<br />
CALCULATIONS FOR ACTIVITY<br />
<strong>Population</strong> Calculations:<br />
• The initial population for the first year of each study is stated and listed on the raptor chart.<br />
During the course of this activity other designated populations will appear on the raptor chart.<br />
The reasoning for these new population totals are listed in the background section of each study.<br />
• �N represents the number of new organisms coming into a population. The �N totals calculated<br />
at the end of each year and must be added to the population. (See �N calculation section<br />
below). The calculated sum represents the new population total for the subsequent year. For<br />
example: If the population for the first year of the study is 20 individuals and the �N was calculated<br />
to be 2. Then the population for the second year of the study will be 22 individuals.<br />
Carrying Capacity Percentage Calculations :<br />
• The carrying capacity is stated with each study.<br />
• The following equation will be used to determine what percentage of the carrying capacity (K)<br />
is still available for population growth: (K-N)/K. For example: If the population (N) is 20<br />
individuals and the carrying capacity (K) is 50 individuals, then 60% of the carrying capacity is<br />
left. 50-20/50 = 0.6 0.6 x 100 = 60%.<br />
Biotic Potential Calculations (r max)<br />
• The initial biotic potential is stated with each study. However, this is the maximum rate of<br />
increase a species can gain. Each study included in the activity begins with a certain population.<br />
That population reduces the biotic potential (r max) because they are taking up space and resources.<br />
Therefore the r max value must be calculated for each year because the population fluctuates.<br />
• The biotic potential value is calculated by multiplying the initial r max stated with each study (this<br />
is the optimal rate that the species could grow at) by the carrying capacity percentage. The r ma<br />
value is multiplied by the carrying capacity percentage because there is already an initial population<br />
taking up resources and space. Therefore a new r max value must be found to accommodate<br />
the existing population. For example, if it was stated that r max was 0.05 or 5% (this is the optimal<br />
rate of increase) and the carrying capacity percentage was calculated to be 0.4 (40% of the<br />
carrying capacity left in the environment), then the new r max value is 0.02 or 2%. (0.4)(0.05) =<br />
0.02 or 2% Interpretation of Results: The initial population could increase every year by 5%,<br />
but since there is already a population in the environment, the rate of increase has been reduced to<br />
2%. This new r max value takes into account the existing population.<br />
�N Calculations:<br />
• This is the number by which the population will increase by at the end of each year. It is calculated<br />
by multiplying the r max value (this is the r max value that takes into account the existing population,<br />
NOT the optimal r max value stated initially) by the population. For example: If (N) is 20 individuals<br />
and the r max value was calculated to be 0.05 or 5%, then the number of individuals to be added to<br />
the population is 1. (0.05)(20) = 1.0 Then one individual must be added to next year’s population.<br />
<strong>Raptor</strong>s • 9-12 Activities • page 3 © 2003 Busch Gardens.
<strong>Raptor</strong> <strong>Population</strong> <strong>Ecology</strong> Funsheet<br />
Study 1: bald eagle Haliaeetus leucocephalus<br />
Carrying capacity (K): 5,000 Maximum rate of increase (r max ): 0.05 <strong>Population</strong> (N): 1,000<br />
Background:<br />
During the third year of the study there was immigration. The population increased to 3,200.<br />
During the fifth year of the study there was emigration. The population decreased to 2,000.<br />
During the seventh year of the study there was immigration. The population increased to 4,000.<br />
Note: Answers need to be rounded to the nearest 100th.<br />
Year N (K-N)/K r max �N<br />
1 1,000<br />
2<br />
3 3,200<br />
4<br />
5 2,000<br />
6<br />
7 4,000<br />
8<br />
9<br />
10<br />
A. Which year of the study came closest to the carrying capacity?<br />
B. Which year(s) of the study was the increase in raptor population less than or equal to 2%?<br />
C. Which year(s) of the study was there 75% or more left until the carrying capacity was reached?<br />
D. Graph the results of the study.<br />
*Note: All values for population, carrying capacity, and biotic potential are fictional. They do not represent actual values.<br />
<strong>Raptor</strong>s • 9-12 Activities • page 4 © 2003 Busch Gardens.
<strong>Raptor</strong> <strong>Population</strong> <strong>Ecology</strong> Funsheet<br />
Study 2: great horned owl Bubo virginianus<br />
Carrying capacity (K): 3,500 Maximum rate of increase (r max): 0.05 <strong>Population</strong> (N): 750<br />
Background:<br />
During the fourth year of the study there was immigration. The population increased to 2,250.<br />
During the sixth year of the study there was emigration. The population decreased to 1,700.<br />
During the eighth year of the study there was immigration. The population increased to 3,200.<br />
Note: Answers need to be rounded to the nearest 100th.<br />
Year N (K-N)/K r max �N<br />
1 750<br />
2<br />
3<br />
4 2,250<br />
5<br />
6 1,700<br />
7<br />
8 3,200<br />
9<br />
10<br />
A. Which year of the study came closest to the carrying capacity?<br />
B. Which year(s) of the study was the increase in raptor population less than or equal to 2%?<br />
C. Which year(s) of the study was there 75% or more left until the carrying capacity was reached?<br />
D. Graph the results of the study.<br />
*Note: All values for population, carrying capacity, and biotic potential are fictional. They do not represent actual values.<br />
<strong>Raptor</strong>s • 9-12 Activities • page 5 © 2003 Busch Gardens.
<strong>Raptor</strong> <strong>Population</strong> <strong>Ecology</strong> Funsheet<br />
Study 3: red-tailed hawk Buteo jamaicensis<br />
Carrying capacity (K): 10,000 Maximum rate of increase (r max ): 0.04 <strong>Population</strong> (N): 6,000<br />
Background:<br />
During the third year of the study there was immigration. The population increased to 8,400.<br />
During the fifth year of the study there was emigration. The population decreased to 5,500.<br />
During the eighth year of the study there was immigration. The population increased to 7,000.<br />
Note: Answers need to be rounded to the nearest 100th.<br />
Year N (K-N)/K r max �N<br />
1 6,000<br />
2<br />
3 8,400<br />
4<br />
5 5,500<br />
6<br />
7<br />
8<br />
9 7,000<br />
10<br />
A. Which year of the study came closest to the carrying capacity?<br />
B. Which year(s) of the study was the increase in raptor population less than or equal to 2%?<br />
C. Which year(s) of the study was there 75% or more left until the carrying capacity was reached?<br />
D. Graph the results of the study.<br />
*Note: All values for population, carrying capacity, and biotic potential are fictional. They do not represent actual values.<br />
<strong>Raptor</strong>s • 9-12 Activities • page 6 © 2003 Busch Gardens.
<strong>Raptor</strong> <strong>Population</strong> <strong>Ecology</strong> Funsheet<br />
Study 4: screech owl Otus asio<br />
Carrying capacity (K): 1,000 Maximum rate of increase (r max): 0.03 <strong>Population</strong> (N): 575<br />
Background:<br />
During the fourth year of the study there was emigration. The population decreased to 300.<br />
During the sixth year of the study there was immigration. The population increased to 575.<br />
Note: Answers need to be rounded to the nearest 100th.<br />
Year N (K-N)/K r max �N<br />
1 575<br />
2<br />
3<br />
4 300<br />
5<br />
6<br />
7 700<br />
8<br />
9<br />
10<br />
A. Which year of the study came closest to the carrying capacity?<br />
B. Which year(s) of the study was the increase in raptor population less than or equal to 2%?<br />
C. Which year(s) of the study was there 75% or more left until the carrying capacity was reached?<br />
D. Graph the results of the study.<br />
*Note: All values for population, carrying capacity, and biotic potential are fictional. They do not represent actual values.<br />
<strong>Raptor</strong>s • 9-12 Activities • page 7 © 2003 Busch Gardens.
<strong>Raptor</strong> <strong>Population</strong> <strong>Ecology</strong> Funsheet<br />
Study 5: barn owl Tyto alba<br />
Carrying capacity (K): 5,000 Maximum rate of increase (r max ): 0.06 <strong>Population</strong> (N): 2,750<br />
Background:<br />
During the fourth year of the study there was immigration. The population increased to 4,000.<br />
During the seventh year of the study there was emigration. The population decreased to 3,500.<br />
During the ninth year of the study there was immigration. The population increased to 3,950.<br />
Note: Answers need to be rounded to the nearest 100th.<br />
Year N (K-N)/K r max �N<br />
1 2,750<br />
2<br />
3<br />
4 4,000<br />
5<br />
6<br />
7 3,500<br />
8<br />
9 3,950<br />
10<br />
A. Which year of the study came closest to the carrying capacity?<br />
B. Which year(s) of the study was the increase in raptor population less than or equal to 2%?<br />
C. Which year(s) of the study was there 75% or more left until the carrying capacity was reached?<br />
D. Graph the results of the study.<br />
*Note: All values for population, carrying capacity, and biotic potential are fictional. They do not represent actual values.<br />
<strong>Raptor</strong>s • 9-12 Activities • page 8 © 2003 Busch Gardens.
<strong>Raptor</strong> <strong>Population</strong> <strong>Ecology</strong> Funsheet<br />
Study 6: golden eagle Aquila chrysaetos canadensis<br />
Carrying capacity (K): 2,500 Maximum rate of increase (r max): 0.05 <strong>Population</strong> (N): 1,000<br />
Background:<br />
During the third year of the study there was emigration. The population decreased to 750.<br />
During the sixth year of the study there was immigration. The population increased to 1,500.<br />
During the ninth year of the study there was immigration. The population increased to 2,000.<br />
Note: Answers need to be rounded to the nearest 100th.<br />
Year N (K-N)/K r max �N<br />
1 1,000<br />
2<br />
3 750<br />
4<br />
5<br />
6 1,500<br />
7<br />
8<br />
9 2,000<br />
10<br />
A. Which year of the study came closest to the carrying capacity?<br />
B. Which year(s) of the study was the increase in raptor population less than or equal to 2%?<br />
C. Which year(s) of the study was there 75% or more left until the carrying capacity was reached?<br />
D. Graph the results of the study.<br />
*Note: All values for population, carrying capacity, and biotic potential are fictional. They do not represent actual values.<br />
<strong>Raptor</strong>s • 9-12 Activities • page 9 © 2003 Busch Gardens.
<strong>Raptor</strong> <strong>Population</strong> <strong>Ecology</strong> Funsheet<br />
Study 7: Harris hawk Parabuteo unicinctus<br />
Carrying capacity (K): 5,000 Maximum rate of increase (r max): 0.04 <strong>Population</strong> (N): 3,750<br />
Background:<br />
During the fourth year of the study there was emigration. The population decreased to 2,500.<br />
During the seventh year of the study there was emigration. The population decreased to 1,750.<br />
During the ninth year of the study there was immigration. The population increased to 2,000.<br />
Note: Answers need to be rounded to the nearest 100th.<br />
Year N (K-N)/K r max �N<br />
1 3,7500<br />
2<br />
3<br />
4 2,500<br />
5<br />
6<br />
7 1,750<br />
8<br />
9 2,000<br />
10<br />
A. Which year of the study came closest to the carrying capacity?<br />
B. Which year(s) of the study was the increase in raptor population less than or equal to 2%?<br />
C. Which year(s) of the study was there 75% or more left until the carrying capacity was reached?<br />
D. Graph the results of the study.<br />
*Note: All values for population, carrying capacity, and biotic potential are fictional. They do not represent actual values.<br />
<strong>Raptor</strong>s • 9-12 Activities • page 10 © 2003 Busch Gardens.
<strong>Raptor</strong> <strong>Population</strong> <strong>Ecology</strong> Funsheet<br />
Study 8: osprey Pandion haliaetus<br />
Carrying capacity (K): 4,000 Maximum rate of increase (r max ): 0.06 <strong>Population</strong> (N): 100<br />
Background:<br />
During the third year of the study there was immigration. The population increased to 1,000.<br />
During the sixth year of the study there was immigration. The population increased to 1,300.<br />
During the eighth year of the study there was immigration. The population increased to 2,250.<br />
Note: Answers need to be rounded to the nearest 100th.<br />
Year N (K-N)/K r max �N<br />
1 100<br />
2<br />
3 1,000<br />
4<br />
5<br />
6 1,300<br />
7<br />
8 2,250<br />
9<br />
10<br />
A. Which year of the study came closest to the carrying capacity?<br />
B. Which year(s) of the study was the increase in raptor population less than or equal to 2%?<br />
C. Which year(s) of the study was there 75% or more left until the carrying capacity was reached?<br />
D. Graph the results of the study.<br />
*Note: All values for population, carrying capacity, and biotic potential are fictional. They do not represent actual values.<br />
<strong>Raptor</strong>s • 9-12 Activities • page 11 © 2003 Busch Gardens.
<strong>Raptor</strong> <strong>Population</strong> <strong>Ecology</strong> Answer Sheet<br />
Study 1: bald eagle Haliaeetus leucocephalus<br />
Year N (K-N)/K r max �N<br />
1 1,000 0.8 0.04 40<br />
2 1,040 0.79 0.04 42<br />
3 3,200 0.36 0.02 64<br />
4 3,264 0.35 0.02 65<br />
5 2,000 0.6 0.03 60<br />
6 2,060 0.6 0.03 62<br />
7 4,000 0.2 0.01 40<br />
8 4,040 0.2 0.01 40<br />
9 4,080 0.2 0.01 41<br />
10 4,121 0.2 0.01 41<br />
1. Which year of the study came closest to the carrying capacity? 10th year<br />
2. Which year(s) of the study was the increase in raptor population less than or equal to<br />
2%? 3rd, 4th, 7th, 8th, 9th, and 10th years<br />
3. Which year(s) of the study was there 75% or more left until the carrying capacity was<br />
reached? 1st and 2nd years<br />
Study 2: great horned owl Bubo virginianus<br />
Year N (K-N)/K r max �N<br />
1 750 0.8 0.04 30<br />
2 780 0.8 0.04 31<br />
3 811 0.8 0.04 32<br />
4 2,250 0.4 0.02 45<br />
5 2,295 0.3 0.02 46<br />
6 1,700 0.5 0.03 51<br />
7 1,751 0.5 0.03 53<br />
8 3,200 0.1 0.01 32<br />
9 3,232 0.1 0.01 32<br />
10 3,264 0.1 0.01 33<br />
1. Which year of the study came closest to the carrying capacity? 10th year<br />
2. Which year(s) of the study was the increase in raptor population less than or equal to<br />
2%? 4th, 5th, 8th, 9th, and 10th years<br />
3. Which year(s) of the study was there 75% or more left until the carrying capacity was<br />
reached? 1st, 2nd and 3rd years<br />
<strong>Raptor</strong>s • 9-12 Activities • page 12 © 2003 Busch Gardens.
<strong>Raptor</strong> <strong>Population</strong> <strong>Ecology</strong> Answer Sheet<br />
Study 3: red-tailed hawk Buteo jamaicensis<br />
Year N (K-N)/K r max �N<br />
1 6,000 0.4 0.02 120<br />
2 6,120 0.4 0.02 122<br />
3 8,400 0.2 0.01 84<br />
4 8,484 0.2 0.01 85<br />
5 5,500 0.5 0.02 110<br />
6 5,610 0.4 0.02 112<br />
7 5,722 0.4 0.02 114<br />
8 5,836 0.4 0.02 117<br />
9 7,000 0.3 0.01 70<br />
10 7070 0.3 0.01 71<br />
1. Which year of the study came closest to the carrying capacity? 4th year<br />
2. Which year(s) of the study was the increase in raptor population less than or equal to<br />
2%? every year of the study (1-10)<br />
3. Which year(s) of the study was there 75% or more left until the carrying capacity was<br />
reached? None of the years had 75% or more of the carrying capacity left<br />
Study 4: screech owl Otus asio<br />
Year N (K-N)/K r max �N<br />
1 575 0.4 0.01 6<br />
2 581 0.4 0.01 6<br />
3 587 0.4 0.01 6<br />
4 300 0.7 0.02 6<br />
5 306 0.7 0.02 6<br />
6 700 0.3 0.01 7<br />
7 707 0.3 0.01 7<br />
8 714 0.3 0.01 7<br />
9 721 0.3 0.01 7<br />
10 728 0.3 0.01 7<br />
1. Which year of the study came closest to the carrying capacity? 10th year<br />
2. Which year(s) of the study was the increase in raptor population less than or equal to<br />
2%? every year of the study (1-10)<br />
3. Which year(s) of the study was there 75% or more left until the carrying capacity was<br />
reached? None of the years of the study had 75% or more of the carrying capacity left<br />
<strong>Raptor</strong>s • 9-12 Activities • page 13 © 2003 Busch Gardens.
<strong>Raptor</strong> <strong>Population</strong> <strong>Ecology</strong> Answer Sheet<br />
Study 5: barn owl Tyto alba<br />
Year N (K-N)/K r max �N<br />
1 2,750 0.5 0.03 83<br />
2 2,833 0.4 0.02 57<br />
3 2,890 0.4 0.02 58<br />
4 4,000 0.2 0.01 40<br />
5 4,040 0.2 0.01 40<br />
6 4,080 0.2 0.01 41<br />
7 3,500 0.3 0.02 70<br />
8 3,570 0.3 0.02 71<br />
9 3,950 0.2 0.01 40<br />
10 3990 0.2 0.01 40<br />
1. Which year of the study came closest to the carrying capacity? 6th year<br />
2. Which year(s) of the study was the increase in raptor population less than or equal to<br />
2%? 2nd, 3rd, 4th, 5th, 6th, 7th, 8th, 9th, and 10th<br />
3. Which year(s) of the study was there 75% or more left until the carrying capacity was<br />
reached? None of the years of the study had 75% or more of the carrying capacity left<br />
Study 6: golden eagle Aquila chrysaetos Canadensis<br />
Year N (K-N)/K r max �N<br />
1 1,000 0.6 0.03 30<br />
2 1,030 0.6 0.03 31<br />
3 750 0.7 0.04 30<br />
4 780 0.7 0.04 31<br />
5 811 0.7 0.04 32<br />
6 1,500 0.4 0.02 30<br />
7 1,530 0.4 0.02 31<br />
8 1,561 0.4 0.02 31<br />
9 2,000 0.2 0.01 20<br />
10 2020 0.2 0.01 20<br />
1. Which year of the study came closest to the carrying capacity? 10th year<br />
2. Which year(s) of the study was the increase in raptor population less than or equal to<br />
2%? 6th, 7th, 8th, 9 th, and 10th<br />
3. Which year(s) of the study was there 75% or more left until the carrying capacity was<br />
reached? None of the years of the study had 75% or more of the carrying capacity left<br />
<strong>Raptor</strong>s • 9-12 Activities • page 14 © 2003 Busch Gardens.
<strong>Raptor</strong> <strong>Population</strong> <strong>Ecology</strong> Answer Sheet<br />
Study 7: Harris hawk Parabuteo unicinctus<br />
Year N (K-N)/K r max �N<br />
1 3,750 0.3 0.01 38<br />
2 3,788 0.2 0.01 38<br />
3 3,826 0.2 0.01 38<br />
4 2,500 0.5 0.02 50<br />
5 2,550 0.5 0.02 51<br />
6 2,601 0.5 0.02 52<br />
7 1,750 0.7 0.03 53<br />
8 1,803 0.6 0.02 36<br />
9 2,000 0.6 0.02 40<br />
10 2040 0.6 0.02 41<br />
1. Which year of the study came closest to the carrying capacity? 3rd year<br />
2. Which year(s) of the study was the increase in raptor population less than or equal to<br />
2%? 1st, 2nd, 3rd, 4th, 5th, 6th, 8th, 9th, and 10th years<br />
3. Which year(s) of the study was there 75% or more left until the carrying capacity was<br />
reached? None of the years of the study had 75% or more of the carrying capacity left<br />
Study 8: osprey Pandion haliaetus<br />
Year N (K-N)/K r max �N<br />
1 100 1 0.06 6<br />
2 106 1 0.06 6<br />
3 1,000 0.8 0.05 50<br />
4 1,050 0.7 0.04 42<br />
5 1,092 0.7 0.04 44<br />
6 1,300 0.7 0.04 52<br />
7 1,352 0.7 0.04 54<br />
8 2,250 0.4 0.02 45<br />
9 2,295 0.4 0.02 46<br />
10 2341 0.4 0.02 47<br />
1. Which year of the study came closest to the carrying capacity? 10th year<br />
2. Which year(s) of the study was the increase in raptor population less than or equal to<br />
2%? 8th, 9th,and 10th years<br />
3. Which year(s) of the study was there 75% or more left until the carrying capacity was<br />
reached? 3rd year<br />
<strong>Raptor</strong>s • 9-12 Activities • page 15 © 2003 Busch Gardens.