Risk Attitude Scales: Concepts, Questionnaires, Utilizations
Risk Attitude Scales: Concepts, Questionnaires, Utilizations
Risk Attitude Scales: Concepts, Questionnaires, Utilizations

Create successful ePaper yourself
Turn your PDF publications into a flip-book with our unique Google optimized e-Paper software.
4.2 Selected results for questionnaire items<br />
4.2.1 ROQ results<br />
ROHRMANN - <strong>Risk</strong> <strong>Attitude</strong> <strong>Scales</strong> 10<br />
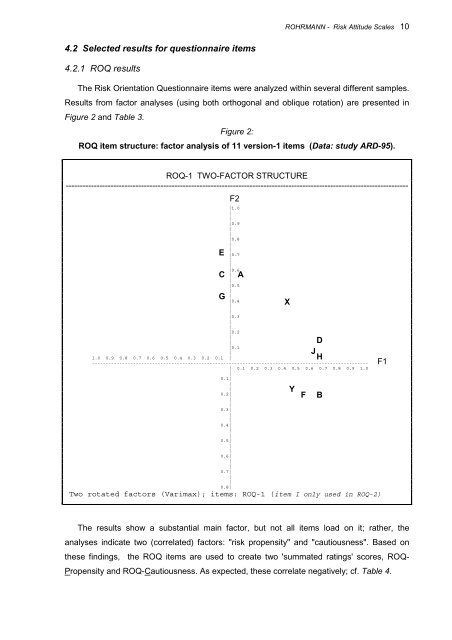
The <strong>Risk</strong> Orientation Questionnaire items were analyzed within several different samples.<br />
Results from factor analyses (using both orthogonal and oblique rotation) are presented in<br />
Figure 2 and Table 3.<br />
Figure 2:<br />
ROQ item structure: factor analysis of 11 version-1 items (Data: study ARD-95).<br />
ROQ-1 TWO-FACTOR STRUCTURE<br />
---------------------------------------------------------------------------------------------------------------------------<br />
1.0 0.9 0.8 0.7 0.6 0.5 0.4 0.3 0.2 0.1 |<br />
E<br />
C<br />
G<br />
|1.0<br />
|<br />
|<br />
|0.9<br />
|<br />
|<br />
|0.8<br />
|<br />
|<br />
|0.7<br />
|<br />
|<br />
|0.6<br />
|<br />
|<br />
|0.5<br />
|<br />
|<br />
|0.4<br />
|<br />
|<br />
|0.3<br />
|<br />
|<br />
|0.2<br />
|<br />
|<br />
|0.1<br />
|<br />
-----------------------------------------------------------------------------------------------------<br />
| 0.1 0.2 0.3 0.4 0.5 0.6 0.7 0.8 0.9 1.0<br />
|<br />
0.1|<br />
|<br />
|<br />
Y<br />
0.2|<br />
F B<br />
|<br />
|<br />
0.3|<br />
|<br />
|<br />
0.4|<br />
|<br />
|<br />
0.5|<br />
|<br />
|<br />
0.6|<br />
|<br />
|<br />
0.7|<br />
|<br />
|<br />
0.8|<br />
Two rotated factors (Varimax); items: ROQ-1 (item I only used in ROQ-2)<br />
The results show a substantial main factor, but not all items load on it; rather, the<br />
analyses indicate two (correlated) factors: "risk propensity" and "cautiousness". Based on<br />
these findings, the ROQ items are used to create two 'summated ratings' scores, ROQ-<br />
Propensity and ROQ-Cautiousness. As expected, these correlate negatively; cf. Table 4.<br />
F2<br />
A<br />
X<br />
D<br />
J<br />
H<br />
F1