Risk Attitude Scales: Concepts, Questionnaires, Utilizations
Risk Attitude Scales: Concepts, Questionnaires, Utilizations
Risk Attitude Scales: Concepts, Questionnaires, Utilizations

You also want an ePaper? Increase the reach of your titles
YUMPU automatically turns print PDFs into web optimized ePapers that Google loves.
4.3 Correlations between general and domain-specific risk attitudes<br />
ROHRMANN - <strong>Risk</strong> <strong>Attitude</strong> <strong>Scales</strong> 16<br />
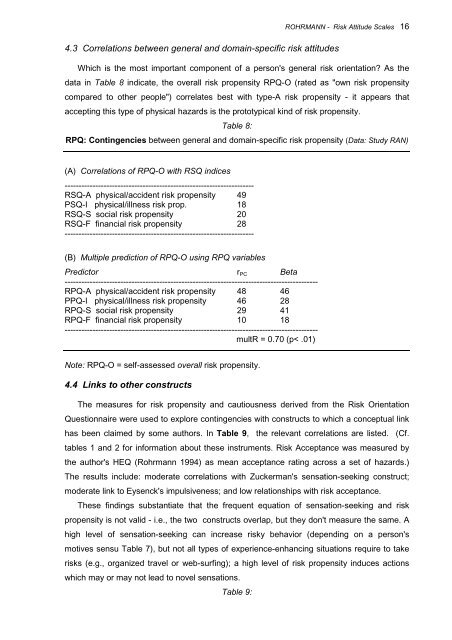
Which is the most important component of a person's general risk orientation? As the<br />
data in Table 8 indicate, the overall risk propensity RPQ-O (rated as "own risk propensity<br />
compared to other people") correlates best with type-A risk propensity - it appears that<br />
accepting this type of physical hazards is the prototypical kind of risk propensity.<br />
Table 8:<br />
RPQ: Contingencies between general and domain-specific risk propensity (Data: Study RAN)<br />
(A) Correlations of RPQ-O with RSQ indices<br />
--------------------------------------------------------------------<br />
RSQ-A physical/accident risk propensity 49<br />
PSQ-I physical/illness risk prop. 18<br />
RSQ-S social risk propensity 20<br />
RSQ-F financial risk propensity 28<br />
--------------------------------------------------------------------<br />
(B) Multiple prediction of RPQ-O using RPQ variables<br />
Predictor rPC Beta<br />
-------------------------------------------------------------------------------------------<br />
RPQ-A physical/accident risk propensity 48 46<br />
PPQ-I physical/illness risk propensity 46 28<br />
RPQ-S social risk propensity 29 41<br />
RPQ-F financial risk propensity 10 18<br />
-------------------------------------------------------------------------------------------<br />
multR = 0.70 (p< .01)<br />
Note: RPQ-O = self-assessed overall risk propensity.<br />
4.4 Links to other constructs<br />
The measures for risk propensity and cautiousness derived from the <strong>Risk</strong> Orientation<br />
Questionnaire were used to explore contingencies with constructs to which a conceptual link<br />
has been claimed by some authors. In Table 9, the relevant correlations are listed. (Cf.<br />
tables 1 and 2 for information about these instruments. <strong>Risk</strong> Acceptance was measured by<br />
the author's HEQ (Rohrmann 1994) as mean acceptance rating across a set of hazards.)<br />
The results include: moderate correlations with Zuckerman's sensation-seeking construct;<br />
moderate link to Eysenck's impulsiveness; and low relationships with risk acceptance.<br />
These findings substantiate that the frequent equation of sensation-seeking and risk<br />
propensity is not valid - i.e., the two constructs overlap, but they don't measure the same. A<br />
high level of sensation-seeking can increase risky behavior (depending on a person's<br />
motives sensu Table 7), but not all types of experience-enhancing situations require to take<br />
risks (e.g., organized travel or web-surfing); a high level of risk propensity induces actions<br />
which may or may not lead to novel sensations.<br />
Table 9: