Performance Testing Report Analysis - ManageEngine
Performance Testing Report Analysis - ManageEngine
Performance Testing Report Analysis - ManageEngine

Create successful ePaper yourself
Turn your PDF publications into a flip-book with our unique Google optimized e-Paper software.
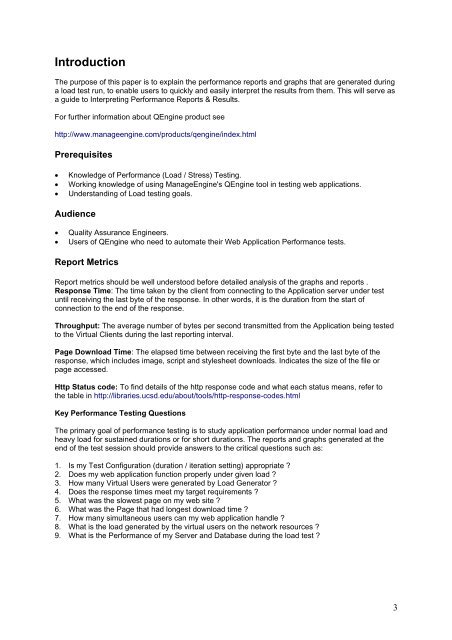
Introduction<br />
The purpose of this paper is to explain the performance reports and graphs that are generated during<br />
a load test run, to enable users to quickly and easily interpret the results from them. This will serve as<br />
a guide to Interpreting <strong>Performance</strong> <strong>Report</strong>s & Results.<br />
For further information about QEngine product see<br />
http://www.manageengine.com/products/qengine/index.html<br />
Prerequisites<br />
• Knowledge of <strong>Performance</strong> (Load / Stress) <strong>Testing</strong>.<br />
• Working knowledge of using <strong>ManageEngine</strong>'s QEngine tool in testing web applications.<br />
• Understanding of Load testing goals.<br />
Audience<br />
• Quality Assurance Engineers.<br />
• Users of QEngine who need to automate their Web Application <strong>Performance</strong> tests.<br />
<strong>Report</strong> Metrics<br />
<strong>Report</strong> metrics should be well understood before detailed analysis of the graphs and reports .<br />
Response Time: The time taken by the client from connecting to the Application server under test<br />
until receiving the last byte of the response. In other words, it is the duration from the start of<br />
connection to the end of the response.<br />
Throughput: The average number of bytes per second transmitted from the Application being tested<br />
to the Virtual Clients during the last reporting interval.<br />
Page Download Time: The elapsed time between receiving the first byte and the last byte of the<br />
response, which includes image, script and stylesheet downloads. Indicates the size of the file or<br />
page accessed.<br />
Http Status code: To find details of the http response code and what each status means, refer to<br />
the table in http://libraries.ucsd.edu/about/tools/http-response-codes.html<br />
Key <strong>Performance</strong> <strong>Testing</strong> Questions<br />
The primary goal of performance testing is to study application performance under normal load and<br />
heavy load for sustained durations or for short durations. The reports and graphs generated at the<br />
end of the test session should provide answers to the critical questions such as:<br />
1. Is my Test Configuration (duration / iteration setting) appropriate ?<br />
2. Does my web application function properly under given load ?<br />
3. How many Virtual Users were generated by Load Generator ?<br />
4. Does the response times meet my target requirements ?<br />
5. What was the slowest page on my web site ?<br />
6. What was the Page that had longest download time ?<br />
7. How many simultaneous users can my web application handle ?<br />
8. What is the load generated by the virtual users on the network resources ?<br />
9. What is the <strong>Performance</strong> of my Server and Database during the load test ?<br />
3