Real Evidence of a Subducting Plate - Geological Society of America
Real Evidence of a Subducting Plate - Geological Society of America
Real Evidence of a Subducting Plate - Geological Society of America

Create successful ePaper yourself
Turn your PDF publications into a flip-book with our unique Google optimized e-Paper software.
TOPIC: <strong>Plate</strong> Tectonics<br />
GRADE LEVEL: 9 - 12<br />
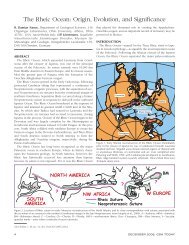
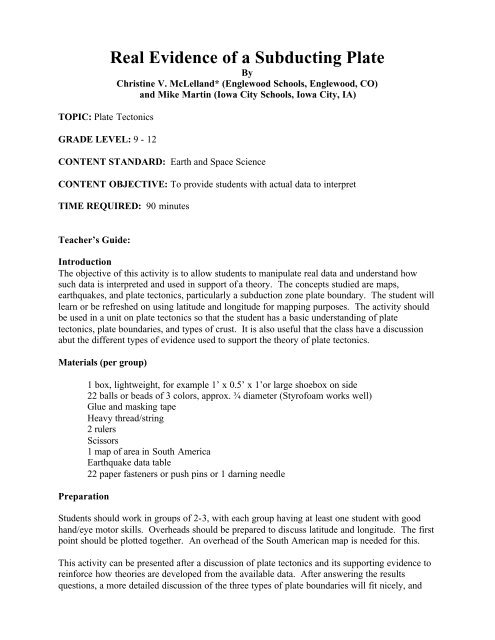
<strong>Real</strong> <strong>Evidence</strong> <strong>of</strong> a <strong>Subducting</strong> <strong>Plate</strong><br />
By<br />
Christine V. McLelland* (Englewood Schools, Englewood, CO)<br />
and Mike Martin (Iowa City Schools, Iowa City, IA)<br />
CONTENT STANDARD: Earth and Space Science<br />
CONTENT OBJECTIVE: To provide students with actual data to interpret<br />
TIME REQUIRED: 90 minutes<br />
Teacher’s Guide:<br />
Introduction<br />
The objective <strong>of</strong> this activity is to allow students to manipulate real data and understand how<br />
such data is interpreted and used in support <strong>of</strong> a theory. The concepts studied are maps,<br />
earthquakes, and plate tectonics, particularly a subduction zone plate boundary. The student will<br />
learn or be refreshed on using latitude and longitude for mapping purposes. The activity should<br />
be used in a unit on plate tectonics so that the student has a basic understanding <strong>of</strong> plate<br />
tectonics, plate boundaries, and types <strong>of</strong> crust. It is also useful that the class have a discussion<br />
abut the different types <strong>of</strong> evidence used to support the theory <strong>of</strong> plate tectonics.<br />
Materials (per group)<br />
Preparation<br />
1 box, lightweight, for example 1’ x 0.5’ x 1’or large shoebox on side<br />
22 balls or beads <strong>of</strong> 3 colors, approx. ¾ diameter (Styr<strong>of</strong>oam works well)<br />
Glue and masking tape<br />
Heavy thread/string<br />
2 rulers<br />
Scissors<br />
1 map <strong>of</strong> area in South <strong>America</strong><br />
Earthquake data table<br />
22 paper fasteners or push pins or 1 darning needle<br />
Students should work in groups <strong>of</strong> 2-3, with each group having at least one student with good<br />
hand/eye motor skills. Overheads should be prepared to discuss latitude and longitude. The first<br />
point should be plotted together. An overhead <strong>of</strong> the South <strong>America</strong>n map is needed for this.<br />
This activity can be presented after a discussion <strong>of</strong> plate tectonics and its supporting evidence to<br />
reinforce how theories are developed from the available data. After answering the results<br />
questions, a more detailed discussion <strong>of</strong> the three types <strong>of</strong> plate boundaries will fit nicely, and
allow students to answer the conclusion questions. Questions on what causes the trench should<br />
thus emphasize the physical manifestations <strong>of</strong> subduction activity.<br />
This lab can also be used as an introduction to plate tectonics, as a springboard for discussing<br />
plates, plate boundaries, data interpretation, etc. Class discussion <strong>of</strong> the conclusion questions<br />
will hopefully kindle the students’ interest in the topic.<br />
This activity contains a good hands-on model that allows interaction and cooperation among<br />
students. The concept developed is very interesting and, through this modeling, easy to grasp.<br />
Seeing actual data (as opposed to fabricated data to make the activity work well) being used is<br />
also very exciting, and helps sustain interest and credibility to the theory <strong>of</strong> plate tectonics.<br />
Running the Activity<br />
The teacher should read through the student directions at this point to understand what they are<br />
directed to construct (see Figure T-1). Each group will have to construct the box and determine<br />
how to tape the map on correctly. The teacher can have each student plot the station points on<br />
their own map, or have it be a group effort. This is easier to do before it is taped to the box.<br />
Students should be warned to do one epicenter at a time and label it well with the station<br />
numbers to save time searching for it later. It is also possible to have one student locating the<br />
epicenter, one making the ball and string, and a third actually constructing the model with the<br />
material from the first two students. Students should swap jobs at certain points throughout the<br />
lab.<br />
There are several options for making the model itself. Styr<strong>of</strong>oam balls can be used, and the<br />
thread can be pushed through a hole pre-made with a pushpin. A darning needle would work<br />
great with this method as well. If you do not wish to use darning needles, another option is to<br />
fasten the strings to the top <strong>of</strong> the box with paper fasteners (“brad clips”) - wrap the string around<br />
the end <strong>of</strong> the pin, adjusting for length, push the ends up through the box and flatten the ends on<br />
the map. Make the hole with scissors to make it large enough. The strings can also simply be<br />
taped to the underside <strong>of</strong> the top <strong>of</strong> the box, with students feeling a hole at the epicenters made<br />
by a pushpin. In either case, the epicenter can be found by pushing a pin through the top <strong>of</strong> it<br />
and locating the hole on the underside.<br />
A further suggestion is to use different color beads for different magnitudes, OR for different<br />
depths (e.g., three colors for shallow, intermediate, and deep quakes). Paper clips can also work<br />
– the sky is the limit (or the budget). The map could be copied onto a transparency, a hole cut<br />
into the top <strong>of</strong> the box, and the map placed over the hole so that the student can look down upon<br />
the final product. Different colored beads would allow students to see the pattern <strong>of</strong> where the<br />
different levels <strong>of</strong> earthquakes are located. The map would have to be firmly attached to the box,<br />
however, and very light beads would be needed so that the transparency isn’t too heavily<br />
weighted. Using this method, it would be much easier to use a darning needle to pull the thread<br />
through the map.<br />
Students will immediately see the pattern that the balls make if constructed correctly. Questions<br />
are geared toward making the connection between the earthquakes and moving rock – and the<br />
fact that a belt <strong>of</strong> earthquakes means large masses <strong>of</strong> rocks (plates) are moving against each<br />
other.
A general sketch <strong>of</strong> what the final product will look like is provided (figure T-1). The data can<br />
also be used to make a cross-section graph by ignoring the latitude data and plotting longitude<br />
vs. depth below the surface. This may be more appropriate for higher-level students capable <strong>of</strong><br />
abstract thinking. Scale is also optional. We believe that a scale with a vertical exaggeration <strong>of</strong><br />
2 works well, but it is possible to have no vertical exaggeration. An exaggeration <strong>of</strong> 4 makes the<br />
slope <strong>of</strong> the lower plate appear much too steep. A graph <strong>of</strong> the data at actual vertical scale is<br />
shown in figure T-2.<br />
Figure T-1. Sketch <strong>of</strong> final box model using Styr<strong>of</strong>oam balls.<br />
Depth in Km<br />
0<br />
-72 -71 -70 -69 -68<br />
Graph <strong>of</strong> Cross-Section<br />
-67<br />
<strong>of</strong> Area<br />
-66 -65 -64 -63 -62<br />
Longitude W (negative <strong>of</strong> plotting purposes only)<br />
Figure T-2. Graph <strong>of</strong> cross section <strong>of</strong> map area with no vertical exaggeration showing the true<br />
angle <strong>of</strong> dip <strong>of</strong> the Nazca <strong>Plate</strong> beneath the South <strong>America</strong>n <strong>Plate</strong>.<br />
-100<br />
-200<br />
-300<br />
-400<br />
-500<br />
-600
Making Conclusions<br />
It is important to make the connection <strong>of</strong> earthquakes and moving rocks, as mentioned above. A<br />
key point is what causes the earthquakes - motion. The teacher should try to have students make<br />
connections between this motion and the continental and oceanic plates <strong>of</strong> crust interacting in<br />
this region. Since the motion <strong>of</strong> the plate is not given, it is important to think about the densities<br />
<strong>of</strong> the plates, and to look at the map showing ridges and trenches to figure out which direction<br />
the Nazca plate is probably moving (see included map <strong>of</strong> plate boundaries).<br />
The teacher should also, through discussion <strong>of</strong> questions, have students come up with ideas about<br />
the trench located <strong>of</strong>f the coast. Further discussion could deal with the Andes and their<br />
formation from hot magma welling up from the deep below the continental crust. Encourage<br />
ideas about where the hot stuff comes from. Finally the teacher should hand out or show an<br />
overhead <strong>of</strong> a diagram <strong>of</strong> the subducting Nazca plate below the South <strong>America</strong>n plate to indicate<br />
what geologists believe is happening in the area. Overall, however, one <strong>of</strong> the most important<br />
points to cover in this activity is that actual data is used and taken as is, plotted in an appropriate<br />
manner, and then interpreted to give the best explanation. The activity fits in well with the<br />
discussion <strong>of</strong> the history <strong>of</strong> plate tectonics.<br />
Resources<br />
An excellent video source for this topic is the Planet Earth series. Several <strong>of</strong> the videos cover<br />
plate tectonics theory, especially The Living Machine, and show footage <strong>of</strong> mid-ocean ridge<br />
activity and underwater pillow basalt formation (in Hawaii). There are also excellent graphics<br />
showing the three boundary types in the first episode. It can be ordered from most earth science<br />
catalogs or from www.cduniverse.com.<br />
An online resource describing plate tectonics and showing a subduction boundary is located at<br />
http://www.seismo.unr.edu/ftp/pub/louie/class/100/plate-tectonics.html<br />
Data for the earthquakes was obtained via Internet from various sources such as the National<br />
Earthquake Research Center in Boulder, CO.<br />
To get even more real data or to update the data we present, go to http://quake.wr.usgs.gov<br />
This site also has additional resource links.<br />
* Christine V. McLelland is the 2003-2003 Subaru Distinguished Earth Science Educator at the<br />
<strong>Geological</strong> <strong>Society</strong> <strong>of</strong> <strong>America</strong>, 3300 Penrose Place, Boulder, CO.<br />
subaruteacher@geosociety.org
Map <strong>of</strong> South <strong>America</strong> between latitudes 35 o S and 15 o S and between longitudes 70 o W<br />
and 62 o W.
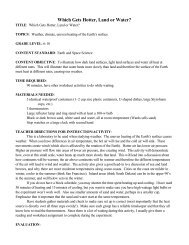
STUDENT GUIDE Name: __________________<br />
<strong>Real</strong> <strong>Evidence</strong> <strong>of</strong> a <strong>Subducting</strong> <strong>Plate</strong><br />
Introduction<br />
As you’ve learned in this unit, the uppermost crust <strong>of</strong> the Earth is believed to be made up <strong>of</strong> a<br />
series <strong>of</strong> plates. The rocks that make up the continental plates are lighter colored and less dense<br />
than the rocks that make up the oceanic plates. Earthquakes and volcanoes are the result <strong>of</strong> the<br />
interaction <strong>of</strong> the rocks that make up these plates, and the kinds <strong>of</strong> earthquakes and volcanoes<br />
produced depends on whether the plates are coming together, spreading apart, or sliding past<br />
each other.<br />
The theory <strong>of</strong> plate tectonics has been widely accepted because <strong>of</strong> the many pieces <strong>of</strong> evidence<br />
that support it. You have already discussed some <strong>of</strong> the evidence in this unit. Like solving a<br />
jigsaw puzzle, scientists look for the best explanation that fits all the data available. In the<br />
following lab, you will be looking at earthquake data and determining if plate tectonics can<br />
explain what you find.<br />
EARTHQUAKES AND FAULTS<br />
Earthquakes and faults are caused by the movement <strong>of</strong> the earth’s crust as it is pushed together or<br />
pulled apart. As the movement occurs, the rocks will <strong>of</strong>ten break and grind together, releasing<br />
vibrations <strong>of</strong> energy into the ground. The plane along which the rocks break and move is called<br />
a fault (see figure 1). This fault can occur near the ground surface where humans can actually<br />
see it, or deep below the ground. The technology we use to detect earthquakes can actually tell<br />
us exactly where the faulting has occurred below the surface. Figure 1 shows two blocks <strong>of</strong> earth<br />
that are sliding against each other. The location at which the rocks actually break during a single<br />
event is called the focus (or hypocenter) <strong>of</strong> the earthquake.<br />
The point on the earth’s surface that is directly above the focus is called the epicenter. This is<br />
the area where the most violent shaking will occur because it is directly above the actual rock<br />
movement.<br />
Procedure<br />
On your data table you will find information on earthquakes near the west coast <strong>of</strong> South<br />
<strong>America</strong>. Provided are the latitude, longitude, depth and magnitude (how strong the earthquake<br />
was) <strong>of</strong> each earthquake.<br />
Your research will require you to take the data provided on earthquakes, construct a 3-D<br />
dimensional model <strong>of</strong> these events, and determine what type <strong>of</strong> pattern (if any) that the<br />
earthquakes create in the region.
Figure 1. Diagram showing a fault plane (Image courtesy <strong>of</strong> Kian H. Chong, Univ. <strong>of</strong> California, Davis)<br />
1. Locate the epicenter <strong>of</strong> each earthquake and plot it on the map provided.<br />
To do this you must plot the latitude and longitude <strong>of</strong> the epicenter. Latitude is the<br />
measure <strong>of</strong> the distance north and south <strong>of</strong> the equator, like the x-axis <strong>of</strong> a graph.<br />
Longitude is the measure <strong>of</strong> the distance east and west <strong>of</strong> the prime meridian, like the yaxis<br />
<strong>of</strong> a graph. See figure 2 for help on plotting the points. You are given one line <strong>of</strong><br />
latitude and one line <strong>of</strong> longitude for each. Like a graph, you need to find where these<br />
two lines meet – that will be the location <strong>of</strong> the earthquake epicenter. We will plot the<br />
first point together in class.<br />
2. Lay the box on its side and tape the map on what is now the top surface <strong>of</strong> the box. Orient the<br />
map so that the boundary between the ocean and the continent is perpendicular to the open end<br />
<strong>of</strong> the box.<br />
The map represents the surface <strong>of</strong> the land, while the open side <strong>of</strong> the box represents your<br />
view <strong>of</strong> the crust beneath the surface. This view is called a cross-section view <strong>of</strong> the<br />
earth. Figure 3 shows a cross-section <strong>of</strong> the area in South <strong>America</strong> that we are studying<br />
along the Tropic <strong>of</strong> Capricorn (23.5 o S latitude).<br />
3. At each epicenter point, punch a hole with the pushpin through the map and box. The hole<br />
needs to be big enough to push a piece <strong>of</strong> your thread through (but not too big!). Hang a<br />
Styr<strong>of</strong>oam ball so that it represent the focus <strong>of</strong> each earthquake:<br />
For each <strong>of</strong> your epicenters, you have information about the depth <strong>of</strong> the earthquake. To<br />
make a three-dimensional representation <strong>of</strong> the earthquakes in this area, you are going to<br />
use a Styr<strong>of</strong>oam ball to represent where the FOCUS <strong>of</strong> the earthquake is. From the<br />
epicenter, you need to hang a Styr<strong>of</strong>oam ball on a length <strong>of</strong> string that represents the<br />
depth <strong>of</strong> the earthquake. Be careful <strong>of</strong> your scale!!
Figure 2. Lines <strong>of</strong> latitude and longitude <strong>of</strong> the Earth.<br />
REMEMBER: you must consider the deepest earthquake and use a scale so that it will fit into the<br />
box. You should most <strong>of</strong>ten use the same scale as the one used for the map <strong>of</strong> South <strong>America</strong>.<br />
However, scientists sometimes change the vertical scale so that the feature you are studying<br />
shows up better for analysis. Most 3-D globes you see that show the mountains on the earth<br />
have an “exaggerated vertical scale,” otherwise even the highest mountains would barely show<br />
up. For your South <strong>America</strong>n map, the distance between each degree <strong>of</strong> latitude and between<br />
each degree <strong>of</strong> longitude is about 111 km (~69 miles). That is your scale. If your deepest<br />
earthquake is 500 km, that may only be about 5 cm deep! Differences in depth wouldn’t show<br />
up very well, so you may want to exaggerate the vertical scale. Perhaps you would rather make<br />
the scale 4 times more than the actual scale. Therefore your deepest ball would be at 20 cm.<br />
Experiment with this and determine which scale fits your box and your purpose best.<br />
To hang the Styr<strong>of</strong>oam balls, you need to first attach one end <strong>of</strong> the string to the Styr<strong>of</strong>oam<br />
ball. You then need to determine the length <strong>of</strong> the string that will represent the depth <strong>of</strong> the<br />
earthquake. Mark the string at that point. Pull the string up through the hole you made at the<br />
epicenter until the ball is at the correct depth. Repeat for each <strong>of</strong> the earthquakes.<br />
4. When you are finished with your model, please answer the results questions:
Figure 3. A cross-section <strong>of</strong> South <strong>America</strong> along the Tropic <strong>of</strong> Capricorn. Notice<br />
sea-level and the Andes mountains that rise high above the rest <strong>of</strong> the continent.<br />
Illustration from CEEP (Crustal Evolution Education Project, Wards Natural Science Establishment, Inc.)<br />
TABLE 1. Table with data from actual earthquakes in South <strong>America</strong> from 1993-1994.<br />
Station Latitude (S) Longitude (W) Depth (Km) Magnitude<br />
1 19.8 66.6 259 4.6<br />
2 27.8 63.2 513 5.1<br />
3 26.2 63.3 550 4.8<br />
4 31.2 71.5 33 5.0<br />
5 23.2 66.4 200 4.8<br />
6 23.5 71.0 25 5.0<br />
7 24.5 70.8 33 5.0<br />
8 21.3 68.2 122 4.7<br />
9 23.6 70.0 42 5.0<br />
10 23.5 70.5 50 NA<br />
11 22.9 68.3 115 4.8<br />
12 34.1 69.8 45 NA<br />
13 22.3 66.1 274 5.0<br />
14 23.2 69.3 67 4.9<br />
15 22.5 67.4 168 4.5<br />
16 19.5 65.8 305 4.5<br />
17 21.4 68.1 123 5.1<br />
18 27.0 63 500 4.9<br />
19 27.2 67.1 155 4.7<br />
20 20.4 66.0 300 4.5<br />
21 25.6 66.0 385 5.0<br />
22 22.2 64.5 440 4.8
Looking at the Results:<br />
Please answer the following questions:<br />
1. What information does an epicenter provide about an earthquake?<br />
2. What is the difference between the focus and the epicenter <strong>of</strong> an earthquake?<br />
3. What is happening to the rocks at the focus <strong>of</strong> an earthquake, and what do we call this?<br />
4. What do you notice about the depth <strong>of</strong> the focus <strong>of</strong> the earthquakes as you go further inland<br />
from the coast <strong>of</strong> South <strong>America</strong>?<br />
5. What appears to be happening to the two plates that meet along the west coast <strong>of</strong> South<br />
<strong>America</strong>, according to your model?<br />
6. Draw and label a diagram or make a model showing what is happening to the plates along the<br />
west coast <strong>of</strong> SA as you described in question 5:<br />
Making Conclusions:<br />
1. Describe the type <strong>of</strong> plate boundary which you think is present along the west coast <strong>of</strong> South<br />
<strong>America</strong>.<br />
2. Explain how your data supports your conclusions in question 1.
3. How can our model explain the deep trench that lies just <strong>of</strong>f the coast <strong>of</strong> South <strong>America</strong>?<br />
4. Looking at the maps <strong>of</strong> the world attached (figure 4), can you find some other areas where<br />
this same type <strong>of</strong> plate boundary is occurring?<br />
Figure 4. Ridge and trench systems <strong>of</strong> the world. Ridges are where new ocean crust is being<br />
formed (plates are moving apart). Trenches are formed where an oceanic plate is being<br />
subducted (plates are coming together). Figure from Global Science Laboratory Manual, John W.<br />
Christensen, Kendall/Hunt Publishing.<br />
Going Further<br />
1. Consider the following: How is volcanism related to this type <strong>of</strong> boundary (study where it is<br />
in relation to the trench and plates)?<br />
2. Mt. St. Helens is part <strong>of</strong> a volcanic belt formed under similar conditions as the Andes<br />
Mountains. Search the Internet <strong>of</strong> library for seismicity data regarding the Oregon/Washington<br />
coast <strong>of</strong> the United States. What is happening there? What are the differences between this area<br />
and the SA coast?
Facts from the USGS earthquake site: http://earthquake.usgs.gov/4kids/facts.html<br />
1. The largest recorded earthquake in the United States was a magnitude 9.2 that<br />
struck Prince William Sound, Alaska on Good Friday, March 28, 1964.<br />
2. The largest recorded earthquake in the world was a magnitude 9.5 (Mw) in Chile<br />
on May 22, 1960.<br />
3. The earliest reported earthquake in California was felt in 1769 by the exploring<br />
expedition <strong>of</strong> Gaspar de Portola while the group was camping about 48 kilometers<br />
(30 miles) southeast <strong>of</strong> Los Angeles.<br />
4. The average rate <strong>of</strong> motion across the San Andreas Fault Zone during the past<br />
3 million years is 56 mm/yr (2 in/yr). This is about the same rate at which your<br />
fingernails grow. Assuming this rate continues, scientists project that Los Angeles<br />
and San Francisco will be adjacent to one another in approximately 15 million years.<br />
5. The East African Rift System is a 50-60 km (31-37 miles) wide zone <strong>of</strong> active<br />
volcanics and faulting that extends north-south in eastern Africa for more than<br />
3000 km (1864 miles) from Ethiopia in the north to Zambezi in the south. It is a<br />
rare example <strong>of</strong> an active continental rift zone, where a continental plate is<br />
attempting to split into two plates which are moving away from one another.<br />
6. The first "pendulum seismoscope" to measure the shaking <strong>of</strong> the ground during an<br />
earthquake was developed in 1751, and it wasn't until 1855 that faults were<br />
recognized as the source <strong>of</strong> earthquakes.<br />
7. Although both are sea waves, a tsunami and a tidal wave are two different<br />
unrelated phenomenon. A tidal wave is a large sea wave produced by high winds, and<br />
a tsunami is a sea wave caused by an underwater earthquake or landslide (usually<br />
triggered by an earthquake) displacing the ocean water.<br />
8. The hypocenter <strong>of</strong> an earthquake is the location beneath the earth's surface where<br />
the rupture <strong>of</strong> the fault begins. The epicenter <strong>of</strong> an earthquake is the location<br />
directly above the hypocenter on the surface <strong>of</strong> the earth.<br />
9. The greatest mountain range is the Mid-Ocean Ridge, extending 64,374 km<br />
(40,000 mi) from the Arctic Ocean to the Atlantic Ocean, around Africa, Asia, and<br />
Australia, and under the Pacific Ocean to the west coast <strong>of</strong> North <strong>America</strong>. It has<br />
a greatest height <strong>of</strong> 4207 m (13,800 ft) above the base ocean depth.<br />
10. The world's greatest land mountain range is the Himalaya-Karakoram. It contains<br />
96 <strong>of</strong> the world's 109 peaks <strong>of</strong> over 7317 m (24,000 ft). The longest range is the<br />
Andes <strong>of</strong> South <strong>America</strong> which is 7564 km (4700 mi) in length. Both were created<br />
by the movement <strong>of</strong> tectonic plates.<br />
11. It is estimated that there are 500,000 detectable earthquakes in the world each<br />
year. 100,000 <strong>of</strong> those can be felt, and 100 <strong>of</strong> them cause damage.