

The Annual Compensation Report: 2013
The Annual Compensation Report: 2013
The Annual Compensation Report: 2013

Create successful ePaper yourself
Turn your PDF publications into a flip-book with our unique Google optimized e-Paper software.
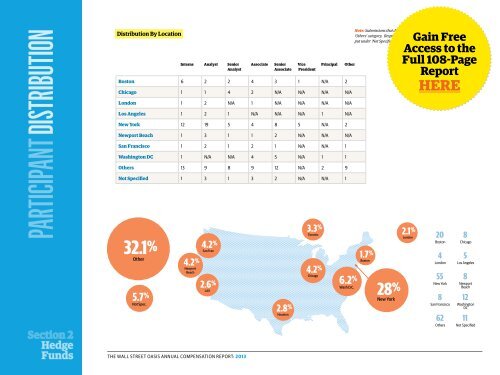
PaRtIcIPant DIstRIbUtIon<br />
Section 2<br />
Hedge<br />
Funds<br />
Distribution By Location<br />
Boston<br />
Chicago<br />
London<br />
Los Angeles<br />
New York<br />
Newport Beach<br />
San Francisco<br />
Washington DC<br />
Others<br />
Not Specified<br />
32.1%<br />
Other<br />
5.7 %<br />
Not Spec.<br />
Interns Analyst Senior<br />
Analyst<br />
the wall street oasis annual compensation report: <strong>2013</strong><br />
Associate Senior<br />
Associate<br />
Vice<br />
President<br />
Principal Other<br />
6 2 2 4 3 1 n/a 2<br />
1 1 4 2 n/a n/a n/a n/a<br />
1 2 n/a 1 n/a n/a n/a n/a<br />
1 2 1 n/a n/a n/a 1 n/a<br />
12 19 5 4 8 5 n/a 2<br />
1 3 1 1 2 n/a n/a n/a<br />
1 2 1 2 1 n/a n/a 1<br />
1 n/a n/a 4 5 n/a 1 1<br />
13 9 8 9 12 n/a 2 9<br />
1 3 1 3 2 n/a n/a 1<br />
4.2 %<br />
Newport<br />
Beach<br />
4.2 %<br />
San Fran<br />
2.6 %<br />
LAX<br />
2.8 %<br />
Houston<br />
3.3 %<br />
Toronto<br />
4.2 %<br />
Chicago<br />
6.2 %<br />
Wash D.C.<br />
1.7 %<br />
Boston<br />
28 %<br />
New York<br />
2.1 %<br />
London<br />
Gain Free<br />
Note: Submissions that did not fall in a specified division were placed in the<br />
‘Others’ category. Responses that failed to identify a specific division were<br />
put under ‘Not Specified’. Please see sample sizes in distribution table on<br />
Access to the<br />
Full 108-Page<br />
<strong>Report</strong><br />
HERE<br />
20<br />
Boston<br />
4<br />
london<br />
55<br />
new York<br />
8<br />
san Francisco<br />
62<br />
others<br />
8<br />
chicago<br />
5<br />
los angeles<br />
8<br />
newport<br />
Beach<br />
12<br />
washington<br />
Dc<br />
11<br />
not specified