Stalking : policing and prosecuting practices in three Australian ...
Stalking : policing and prosecuting practices in three Australian ...
Stalking : policing and prosecuting practices in three Australian ...

Create successful ePaper yourself
Turn your PDF publications into a flip-book with our unique Google optimized e-Paper software.
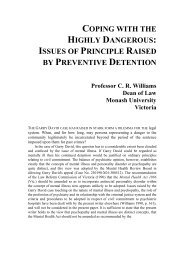
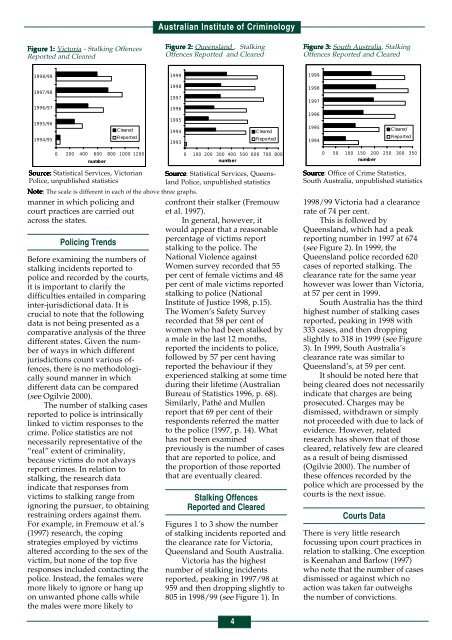
Figure Figure Figure 1: 1: Victoria - <strong>Stalk<strong>in</strong>g</strong> Offences<br />
Reported <strong>and</strong> Cleared<br />
1998/99<br />
1997/98<br />
1996/97<br />
1995/96<br />
1994/95<br />
0 200 400 600 800 1000 1200<br />
number<br />
Note<br />
Note<br />
manner <strong>in</strong> which <strong>polic<strong>in</strong>g</strong> <strong>and</strong><br />
court <strong>practices</strong> are carried out<br />
across the states.<br />
Polic<strong>in</strong>g Trends<br />
Cleared<br />
R eported<br />
Source: Source: Statistical Services, Victorian<br />
Police, unpublished statistics<br />
Before exam<strong>in</strong><strong>in</strong>g the numbers of<br />
stalk<strong>in</strong>g <strong>in</strong>cidents reported to<br />
police <strong>and</strong> recorded by the courts,<br />
it is important to clarify the<br />
difficulties entailed <strong>in</strong> compar<strong>in</strong>g<br />
<strong>in</strong>ter-jurisdictional data. It is<br />
crucial to note that the follow<strong>in</strong>g<br />
data is not be<strong>in</strong>g presented as a<br />
comparative analysis of the <strong>three</strong><br />
different states. Given the number<br />
of ways <strong>in</strong> which different<br />
jurisdictions count various offences,<br />
there is no methodologically<br />
sound manner <strong>in</strong> which<br />
different data can be compared<br />
(see Ogilvie 2000).<br />
The number of stalk<strong>in</strong>g cases<br />
reported to police is <strong>in</strong>tr<strong>in</strong>sically<br />
l<strong>in</strong>ked to victim responses to the<br />
crime. Police statistics are not<br />
necessarily representative of the<br />
“real” extent of crim<strong>in</strong>ality,<br />
because victims do not always<br />
report crimes. In relation to<br />
stalk<strong>in</strong>g, the research data<br />
<strong>in</strong>dicate that responses from<br />
victims to stalk<strong>in</strong>g range from<br />
ignor<strong>in</strong>g the pursuer, to obta<strong>in</strong><strong>in</strong>g<br />
restra<strong>in</strong><strong>in</strong>g orders aga<strong>in</strong>st them.<br />
For example, <strong>in</strong> Fremouw et al.’s<br />
(1997) research, the cop<strong>in</strong>g<br />
strategies employed by victims<br />
altered accord<strong>in</strong>g to the sex of the<br />
victim, but none of the top five<br />
responses <strong>in</strong>cluded contact<strong>in</strong>g the<br />
police. Instead, the females were<br />
more likely to ignore or hang up<br />
on unwanted phone calls while<br />
the males were more likely to<br />
<strong>Australian</strong> Institute of Crim<strong>in</strong>ology<br />
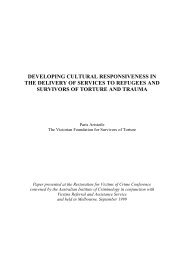
Figure Figure Figure 2: 2: Queensl<strong>and</strong> , <strong>Stalk<strong>in</strong>g</strong><br />
Offences Reported <strong>and</strong> Cleared<br />
1999<br />
1998<br />
1997<br />
1996<br />
1995<br />
1994<br />
1993<br />
Note: The scale is different <strong>in</strong> each of the above <strong>three</strong> graphs.<br />
0 100 200 300 400<br />
number<br />
500 600 700 800<br />
confront their stalker (Fremouw<br />
et al. 1997).<br />
In general, however, it<br />
would appear that a reasonable<br />
percentage of victims report<br />
stalk<strong>in</strong>g to the police. The<br />
National Violence aga<strong>in</strong>st<br />
Women survey recorded that 55<br />
per cent of female victims <strong>and</strong> 48<br />
per cent of male victims reported<br />
stalk<strong>in</strong>g to police (National<br />
Institute of Justice 1998, p.15).<br />
The Women’s Safety Survey<br />
recorded that 58 per cent of<br />
women who had been stalked by<br />
a male <strong>in</strong> the last 12 months,<br />
reported the <strong>in</strong>cidents to police,<br />
followed by 57 per cent hav<strong>in</strong>g<br />
reported the behaviour if they<br />
experienced stalk<strong>in</strong>g at some time<br />
dur<strong>in</strong>g their lifetime (<strong>Australian</strong><br />
Bureau of Statistics 1996, p. 68).<br />
Similarly, Pathé <strong>and</strong> Mullen<br />
report that 69 per cent of their<br />
respondents referred the matter<br />
to the police (1997, p. 14). What<br />
has not been exam<strong>in</strong>ed<br />
previously is the number of cases<br />
that are reported to police, <strong>and</strong><br />
the proportion of those reported<br />
that are eventually cleared.<br />
<strong>Stalk<strong>in</strong>g</strong> Offences<br />
Reported <strong>and</strong> Cleared<br />
Figures 1 to 3 show the number<br />
of stalk<strong>in</strong>g <strong>in</strong>cidents reported <strong>and</strong><br />
the clearance rate for Victoria,<br />
Queensl<strong>and</strong> <strong>and</strong> South Australia.<br />
Victoria has the highest<br />
number of stalk<strong>in</strong>g <strong>in</strong>cidents<br />
reported, peak<strong>in</strong>g <strong>in</strong> 1997/98 at<br />
959 <strong>and</strong> then dropp<strong>in</strong>g slightly to<br />
805 <strong>in</strong> 1998/99 (see Figure 1). In<br />
4<br />
Cleared<br />
Reported<br />
Source Source: Source Statistical Services, Queensl<strong>and</strong><br />
Police, unpublished statistics<br />
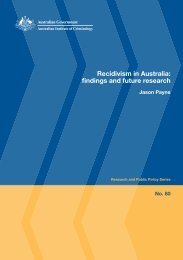
Figure Figure 3: 3: 3: South Australia, <strong>Stalk<strong>in</strong>g</strong><br />
Offences Reported <strong>and</strong> Cleared<br />
1999<br />
1998<br />
1997<br />
1996<br />
1995<br />
1994<br />
Cleared<br />
Reported<br />
0 50 100 150 200 250 300 350<br />
number<br />
Source Source: Source Office of Crime Statistics,<br />
South Australia, unpublished statistics<br />
1998/99 Victoria had a clearance<br />
rate of 74 per cent.<br />
This is followed by<br />
Queensl<strong>and</strong>, which had a peak<br />
report<strong>in</strong>g number <strong>in</strong> 1997 at 674<br />
(see Figure 2). In 1999, the<br />
Queensl<strong>and</strong> police recorded 620<br />
cases of reported stalk<strong>in</strong>g. The<br />
clearance rate for the same year<br />
however was lower than Victoria,<br />
at 57 per cent <strong>in</strong> 1999.<br />
South Australia has the third<br />
highest number of stalk<strong>in</strong>g cases<br />
reported, peak<strong>in</strong>g <strong>in</strong> 1998 with<br />
333 cases, <strong>and</strong> then dropp<strong>in</strong>g<br />
slightly to 318 <strong>in</strong> 1999 (see Figure<br />
3). In 1999, South Australia’s<br />
clearance rate was similar to<br />
Queensl<strong>and</strong>’s, at 59 per cent.<br />
It should be noted here that<br />
be<strong>in</strong>g cleared does not necessarily<br />
<strong>in</strong>dicate that charges are be<strong>in</strong>g<br />
prosecuted. Charges may be<br />
dismissed, withdrawn or simply<br />
not proceeded with due to lack of<br />
evidence. However, related<br />
research has shown that of those<br />
cleared, relatively few are cleared<br />
as a result of be<strong>in</strong>g dismissed<br />
(Ogilvie 2000). The number of<br />
these offences recorded by the<br />
police which are processed by the<br />
courts is the next issue.<br />
Courts Data<br />
There is very little research<br />
focuss<strong>in</strong>g upon court <strong>practices</strong> <strong>in</strong><br />
relation to stalk<strong>in</strong>g. One exception<br />
is Keenahan <strong>and</strong> Barlow (1997)<br />
who note that the number of cases<br />
dismissed or aga<strong>in</strong>st which no<br />
action was taken far outweighs<br />
the number of convictions.