Blowing Bubbles: Heuristics and Biases in the Run-Up of Stock Prices
Blowing Bubbles: Heuristics and Biases in the Run-Up of Stock Prices
Blowing Bubbles: Heuristics and Biases in the Run-Up of Stock Prices

You also want an ePaper? Increase the reach of your titles
YUMPU automatically turns print PDFs into web optimized ePapers that Google loves.
JOURNAL OF THE ACADEMY Johnson, 10.1177/0092070305277381 OF Tellis MARKETING / HEURISTICS SCIENCE AND BIASES ARTICLE<br />
FALL 2005<br />
<strong>Blow<strong>in</strong>g</strong> <strong>Bubbles</strong>: <strong>Heuristics</strong> <strong>and</strong> <strong>Biases</strong><br />
<strong>in</strong> <strong>the</strong> <strong>Run</strong>-<strong>Up</strong> <strong>of</strong> <strong>Stock</strong> <strong>Prices</strong><br />
Joseph Johnson<br />
University <strong>of</strong> Miami<br />
Gerard J. Tellis<br />
University <strong>of</strong> Sou<strong>the</strong>rn California, Los Angeles<br />
Ads <strong>of</strong> stocks <strong>and</strong> mutual funds typically tout <strong>the</strong>ir past<br />
performance, despite a disclosure that past performance<br />
does not guarantee future returns. Are consumers motivated<br />
to buy or sell based on past performance <strong>of</strong> assets?<br />
More generally, do consumers (wrongly) use sequential<br />
<strong>in</strong>formation about past performance <strong>of</strong> assets to make<br />
suboptimal decisions? Use <strong>of</strong> this heuristic leads to two<br />
well-known biases: <strong>the</strong> hot h<strong>and</strong> <strong>and</strong> <strong>the</strong> gambler’s fallacy.<br />
This study proposes a <strong>the</strong>ory <strong>of</strong> hype that <strong>in</strong>tegrates<br />
<strong>the</strong>se two biases; that a positive run could <strong>in</strong>flate prices,<br />
while a negative run could depress <strong>the</strong>m, although <strong>the</strong> pattern<br />
could reverse on extended runs. Tests on two experiments<br />
<strong>and</strong> one event study <strong>of</strong> stock purchases strongly<br />
suggest that consumers dump “losers” <strong>and</strong> buy “w<strong>in</strong>ners.”<br />
The latter phenomenon could lead to hyped-up<br />
prices on <strong>the</strong> stock market for w<strong>in</strong>n<strong>in</strong>g stocks. The authors<br />
discuss <strong>the</strong> managerial, public policy, <strong>and</strong> research<br />
implications <strong>of</strong> <strong>the</strong> results.<br />
Keywords: heuristics <strong>and</strong> biases; f<strong>in</strong>ancial products; behavioral<br />
decision <strong>the</strong>ory; judgment <strong>and</strong> decision<br />
mak<strong>in</strong>g<br />
The use <strong>of</strong> past sequential <strong>in</strong>formation is a common<br />
practice <strong>of</strong> consumers when mak<strong>in</strong>g decisions under<br />
uncerta<strong>in</strong>ty. Examples <strong>in</strong>clude wait<strong>in</strong>g before buy<strong>in</strong>g a<br />
new product because its prices are fall<strong>in</strong>g, wait<strong>in</strong>g to ref<strong>in</strong>ance<br />
a home because home mortgage rates are decl<strong>in</strong><strong>in</strong>g,<br />
<strong>and</strong> rush<strong>in</strong>g to buy a mutual fund because prices or asset<br />
Journal <strong>of</strong> <strong>the</strong> Academy <strong>of</strong> Market<strong>in</strong>g Science.<br />
Volume 33, No. 4, pages 486-503.<br />
DOI: 10.1177/0092070305277381<br />
Copyright © 2005 by Academy <strong>of</strong> Market<strong>in</strong>g Science.<br />
values are <strong>in</strong>creas<strong>in</strong>g. Indeed, many analysts believe that<br />
<strong>the</strong> rise <strong>in</strong> <strong>the</strong> price <strong>of</strong> high-technology stocks until March<br />
2000 was fed by prior <strong>in</strong>creases <strong>in</strong> price ra<strong>the</strong>r than any<br />
underly<strong>in</strong>g evaluation <strong>of</strong> <strong>the</strong>ir worth.<br />
Marketers <strong>of</strong> mutual funds, stocks, <strong>and</strong> similar f<strong>in</strong>ancial<br />
products exploit this practice <strong>of</strong> consumers by aggressively<br />
advertis<strong>in</strong>g <strong>the</strong> past positive performance <strong>of</strong> <strong>the</strong>ir<br />
<strong>of</strong>fer<strong>in</strong>gs. Our <strong>in</strong>formal survey <strong>of</strong> issues <strong>in</strong> 2 years <strong>of</strong> <strong>the</strong><br />
magaz<strong>in</strong>e Money <strong>in</strong>dicates that <strong>the</strong> ads for such products<br />
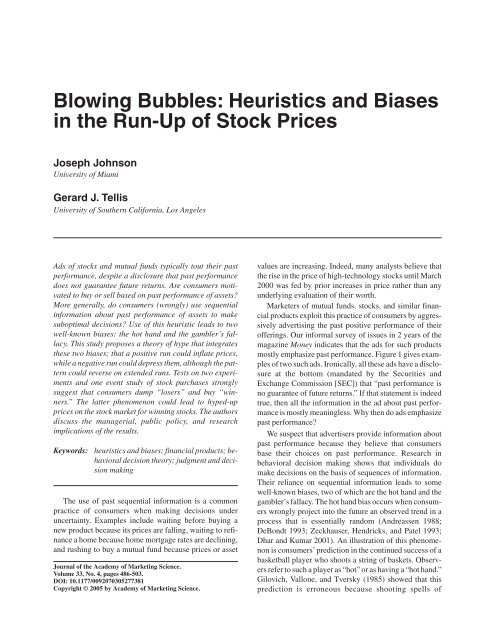
mostly emphasize past performance. Figure 1 gives examples<br />
<strong>of</strong> two such ads. Ironically, all <strong>the</strong>se ads have a disclosure<br />
at <strong>the</strong> bottom (m<strong>and</strong>ated by <strong>the</strong> Securities <strong>and</strong><br />
Exchange Commission [SEC]) that “past performance is<br />
no guarantee <strong>of</strong> future returns.” If that statement is <strong>in</strong>deed<br />
true, <strong>the</strong>n all <strong>the</strong> <strong>in</strong>formation <strong>in</strong> <strong>the</strong> ad about past performance<br />
is mostly mean<strong>in</strong>gless. Why <strong>the</strong>n do ads emphasize<br />
past performance?<br />
We suspect that advertisers provide <strong>in</strong>formation about<br />
past performance because <strong>the</strong>y believe that consumers<br />
base <strong>the</strong>ir choices on past performance. Research <strong>in</strong><br />
behavioral decision mak<strong>in</strong>g shows that <strong>in</strong>dividuals do<br />
make decisions on <strong>the</strong> basis <strong>of</strong> sequences <strong>of</strong> <strong>in</strong>formation.<br />
Their reliance on sequential <strong>in</strong>formation leads to some<br />
well-known biases, two <strong>of</strong> which are <strong>the</strong> hot h<strong>and</strong> <strong>and</strong> <strong>the</strong><br />
gambler’s fallacy. The hot h<strong>and</strong> bias occurs when consumers<br />
wrongly project <strong>in</strong>to <strong>the</strong> future an observed trend <strong>in</strong> a<br />
process that is essentially r<strong>and</strong>om (Andreassen 1988;<br />
DeBondt 1993; Zeckhauser, Hendricks, <strong>and</strong> Patel 1993;<br />
Dhar <strong>and</strong> Kumar 2001). An illustration <strong>of</strong> this phenomenon<br />
is consumers’ prediction <strong>in</strong> <strong>the</strong> cont<strong>in</strong>ued success <strong>of</strong> a<br />
basketball player who shoots a str<strong>in</strong>g <strong>of</strong> baskets. Observers<br />
refer to such a player as “hot” or as hav<strong>in</strong>g a “hot h<strong>and</strong>.”<br />
Gilovich, Vallone, <strong>and</strong> Tversky (1985) showed that this<br />
prediction is erroneous because shoot<strong>in</strong>g spells <strong>of</strong>
asketball players is essentially r<strong>and</strong>om. If marketers <strong>of</strong><br />
f<strong>in</strong>ancial products believe that consumers behave like this<br />
when choos<strong>in</strong>g f<strong>in</strong>ancial products, <strong>the</strong>n <strong>the</strong>y would have<br />
reason to design ads that emphasize past performance. Our<br />
review <strong>of</strong> ads suggests that marketers <strong>of</strong> f<strong>in</strong>ancial products<br />
do subscribe to this view.<br />
The gambler’s fallacy occurs when consumers wrongly<br />
expect a reversal <strong>in</strong> a r<strong>and</strong>om sequence that happens to<br />
show a trend (Tversky <strong>and</strong> Kahneman 1971). They mistakenly<br />
believe that <strong>the</strong> trend must reverse because <strong>the</strong> <strong>in</strong>dividual<br />
draws are related ra<strong>the</strong>r than <strong>in</strong>dependent. This bias<br />
afflicts <strong>the</strong> gambler who mistakenly believes he will w<strong>in</strong><br />
after a str<strong>in</strong>g <strong>of</strong> losses. If consumers really believe <strong>in</strong> trend<br />
reversals, <strong>the</strong>n <strong>the</strong> advertis<strong>in</strong>g <strong>of</strong> record-break<strong>in</strong>g str<strong>in</strong>gs<br />
<strong>of</strong> past successes <strong>of</strong> stocks or mutual funds would backfire,<br />
as consumers would expect an imm<strong>in</strong>ent loss <strong>and</strong><br />
shun those products. Our review <strong>of</strong> ads suggests that marketers<br />
<strong>of</strong> f<strong>in</strong>ancial products do not subscribe to this view.<br />
Both <strong>the</strong> above patterns <strong>of</strong> behavior arise from consumers’<br />
basic misunderst<strong>and</strong><strong>in</strong>g <strong>of</strong> r<strong>and</strong>om events due to a<br />
mistaken belief that small samples should be representative<br />
<strong>of</strong> <strong>the</strong> underly<strong>in</strong>g process (Kahneman <strong>and</strong> Tversky<br />
1972). However, <strong>the</strong> dom<strong>in</strong>ant paradigm <strong>in</strong> f<strong>in</strong>ance asserts<br />
that <strong>the</strong> current price <strong>of</strong> a stock reflects <strong>the</strong> discounted<br />
FIGURE 1<br />
Examples <strong>of</strong> Advertisements for F<strong>in</strong>ancial Products<br />
Johnson, Tellis / HEURISTICS AND BIASES 487<br />
future value <strong>of</strong> all available <strong>in</strong>formation about that stock<br />
until that po<strong>in</strong>t <strong>in</strong> time. Thus, any trends <strong>in</strong> stock prices are<br />
devoid <strong>of</strong> mean<strong>in</strong>g, <strong>and</strong> <strong>the</strong> best estimate <strong>of</strong> <strong>the</strong> future<br />
price is <strong>the</strong> current price.<br />
This th<strong>in</strong>k<strong>in</strong>g underlies <strong>the</strong> SEC’s requirement <strong>of</strong> a fair<br />
disclosure <strong>in</strong> <strong>the</strong> ads for f<strong>in</strong>ancial products. If consumers<br />
do <strong>in</strong>deed believe this <strong>the</strong>ory, <strong>the</strong>n marketers <strong>of</strong> f<strong>in</strong>ancial<br />
products do not need to advertise past performance at all,<br />
nor would <strong>the</strong> SEC require advertisers to put such a disclosure<br />
<strong>in</strong> <strong>the</strong>ir ads. Apparently, <strong>the</strong>ir practice suggests that<br />
this is nei<strong>the</strong>r <strong>the</strong>ir belief nor <strong>the</strong>ir hope. But are <strong>the</strong>y right<br />
<strong>in</strong> <strong>the</strong>ir beliefs? The key question is, which <strong>of</strong> <strong>the</strong>se three<br />
patterns <strong>of</strong> behavior do consumers follow? In particular,<br />
how do <strong>in</strong>dividual consumers respond to <strong>in</strong>formation<br />
about <strong>the</strong> past performance <strong>of</strong> f<strong>in</strong>ancial products when<br />
choos<strong>in</strong>g to <strong>in</strong>vest <strong>in</strong> <strong>the</strong>m? This is <strong>the</strong> focus <strong>of</strong> <strong>the</strong> current<br />
study.<br />
We propose that consumers typically do not ignore past<br />
<strong>in</strong>formation about products, even when <strong>the</strong>y should. In<br />
particular, when faced with <strong>the</strong> performance <strong>of</strong> products <strong>in</strong><br />
<strong>the</strong> form <strong>of</strong> a sequence <strong>of</strong> events, <strong>the</strong>y develop beliefs<br />
about <strong>the</strong> future <strong>of</strong> <strong>the</strong> sequence that <strong>in</strong>cludes both trend<br />
projection <strong>and</strong> trend reversal, depend<strong>in</strong>g on <strong>the</strong> length <strong>of</strong><br />
<strong>the</strong> trend. As a result, <strong>the</strong>ir behavior <strong>in</strong>corporates both
488 JOURNAL OF THE ACADEMY OF MARKETING SCIENCE FALL 2005<br />
effects described <strong>in</strong> <strong>the</strong> research <strong>in</strong> behavioral decision<br />
mak<strong>in</strong>g: <strong>the</strong> hot h<strong>and</strong> (due to trend projection) <strong>and</strong> <strong>the</strong><br />
gambler’s fallacy (due to trend reversal). The importance<br />
<strong>of</strong> this behavior arises from <strong>the</strong> fact that this behavior is not<br />
justified by f<strong>in</strong>ancial <strong>the</strong>ories <strong>of</strong> <strong>the</strong> stock market or by an<br />
empirical test <strong>of</strong> <strong>the</strong> <strong>the</strong>ories. Moreover, this behavior may<br />
expla<strong>in</strong> two major f<strong>in</strong>d<strong>in</strong>gs unear<strong>the</strong>d by f<strong>in</strong>ancial<br />
researchers dur<strong>in</strong>g <strong>the</strong> past two decades: <strong>the</strong> existence <strong>of</strong><br />
momentum <strong>in</strong> stock returns dur<strong>in</strong>g short periods <strong>of</strong> 3 to 12<br />
months followed by reversals dur<strong>in</strong>g long periods <strong>of</strong> 3 to 5<br />
years. Swam<strong>in</strong>athan <strong>and</strong> Lee (2000) stated that “<strong>the</strong> reconciliation<br />
<strong>of</strong> <strong>the</strong>se two patterns represents an important<br />
challenge to f<strong>in</strong>ancial researchers.”<br />
We test our <strong>the</strong>sis through three studies <strong>in</strong> <strong>the</strong> context <strong>of</strong><br />
consumers’purchase <strong>of</strong> stocks on <strong>the</strong> basis <strong>of</strong> <strong>in</strong>formation<br />
about past earn<strong>in</strong>gs <strong>of</strong> those stocks. First, an experiment<br />
ascerta<strong>in</strong>s how sequences <strong>of</strong> <strong>in</strong>creas<strong>in</strong>g or decreas<strong>in</strong>g<br />
earn<strong>in</strong>gs affect consumers’ propensity to buy or sell a specific<br />
stock. Second, ano<strong>the</strong>r experiment looks at process<br />
measures <strong>and</strong> ascerta<strong>in</strong>s whe<strong>the</strong>r <strong>the</strong> results are robust to<br />
mood manipulations. This study also looks at process<br />
measures. Third, an event analysis tries to detect if,<br />
because <strong>of</strong> such behavior <strong>of</strong> consumers, stocks show<br />
abnormal returns conditional on various sequences <strong>of</strong><br />
<strong>in</strong>creas<strong>in</strong>g or decreas<strong>in</strong>g earn<strong>in</strong>gs. In contrast to studies <strong>in</strong><br />
economics or behavioral f<strong>in</strong>ance, our goal is not to focus<br />
on <strong>the</strong> efficiency or <strong>in</strong>efficiency <strong>of</strong> f<strong>in</strong>ancial markets.<br />
(Such a test would have to go fur<strong>the</strong>r to see if one could<br />
pr<strong>of</strong>itably exploit patterns <strong>in</strong> prices after account<strong>in</strong>g for<br />
transactions costs.) Ra<strong>the</strong>r, our goal is to research <strong>the</strong> systematic<br />
biases <strong>in</strong> consumers’ behavior relative to <strong>the</strong> dictates<br />
<strong>of</strong> economic <strong>the</strong>ory, because <strong>of</strong> sequences <strong>of</strong> <strong>in</strong>formation,<br />
<strong>and</strong> to test if such biases can be detected at <strong>the</strong><br />
<strong>in</strong>dividual <strong>and</strong> <strong>the</strong> market level.<br />
Our work has some similarity to that <strong>of</strong> Barberis,<br />
Shliefer, <strong>and</strong> Vishny (1998), who tried to model consumers<br />
as ei<strong>the</strong>r hav<strong>in</strong>g a mean-revert<strong>in</strong>g m<strong>in</strong>d-set (ak<strong>in</strong> to<br />
gamblers fallacy) or a cont<strong>in</strong>uation m<strong>in</strong>d-set (ak<strong>in</strong> to hot<br />
h<strong>and</strong>), when faced with past earn<strong>in</strong>gs <strong>of</strong> a firm. However,<br />
<strong>the</strong>y demonstrate <strong>the</strong>ir ma<strong>in</strong> <strong>the</strong>sis by simulation. We do so<br />
by experimentation <strong>and</strong> market analysis, as Raghubir <strong>and</strong><br />
Das (1999) urged. We first conduct a test <strong>of</strong> our <strong>the</strong>sis by<br />
analyz<strong>in</strong>g <strong>the</strong> responses <strong>of</strong> experimental subjects to earn<strong>in</strong>gs<br />
str<strong>in</strong>gs <strong>of</strong> vary<strong>in</strong>g length. We <strong>the</strong>n conduct a market<br />
analysis <strong>of</strong> returns <strong>of</strong> stocks to <strong>the</strong> same sequence <strong>of</strong> <strong>in</strong>formation.<br />
Thus, we address two critical questions not addressed<br />
by Barberis et al. (1998): Which <strong>of</strong> <strong>the</strong>se two<br />
m<strong>in</strong>d-sets do consumers adopt? <strong>and</strong> How do <strong>the</strong>y make <strong>the</strong><br />
transition from one m<strong>in</strong>d-set to <strong>the</strong> o<strong>the</strong>r? In particular, <strong>the</strong><br />
latter question is one that f<strong>in</strong>ancial researchers have not<br />
been able to expla<strong>in</strong>. As Swam<strong>in</strong>athan <strong>and</strong> Lee (2000)<br />
stated, “Even less is known about <strong>the</strong> transitional dynamics<br />
between <strong>the</strong>se two effects (mean-revert<strong>in</strong>g <strong>and</strong> cont<strong>in</strong>uation<br />
m<strong>in</strong>d-sets).” In contrast, we show how <strong>the</strong> vary<strong>in</strong>g<br />
length <strong>of</strong> <strong>the</strong> run <strong>of</strong> past <strong>in</strong>formation can cause this<br />
transition.<br />
The purchase <strong>of</strong> f<strong>in</strong>ancial products is just one context <strong>in</strong><br />
which to test our <strong>the</strong>sis. Our <strong>the</strong>sis applies to a number <strong>of</strong><br />
different contexts where consumers can act on <strong>the</strong> basis <strong>of</strong><br />
a sequence <strong>of</strong> <strong>in</strong>formation about <strong>the</strong> past performance <strong>of</strong> a<br />
product. Examples <strong>in</strong>clude <strong>the</strong> frenzied bidd<strong>in</strong>g <strong>in</strong> auctions,<br />
<strong>the</strong> overvaluation <strong>of</strong> celebrity endorsers until <strong>the</strong>y<br />
suddenly become unpopular (Agarwal <strong>and</strong> Kamakura<br />
1995), <strong>the</strong> rapid growth <strong>of</strong> new products until a sudden<br />
drop <strong>in</strong> sales (Goldenberg, Libai, <strong>and</strong> Muller 2002), <strong>the</strong><br />
escalation <strong>in</strong> real estate prices <strong>in</strong> a hot market until a sudden<br />
reversal, <strong>and</strong> <strong>the</strong> rise <strong>and</strong> fall <strong>of</strong> fads. We contend that<br />
<strong>in</strong> all such scenarios, trend projection could be one explanation<br />
for <strong>the</strong> <strong>in</strong>itial hype that surrounds a product’s popularity,<br />
followed by its implosion when trend reversal sets<br />
<strong>in</strong>. These contexts differ from <strong>the</strong> stock market scenario <strong>in</strong><br />
which a strongly developed <strong>the</strong>ory suggests that past<br />
trends are not <strong>in</strong>formative <strong>of</strong> future performance. As such,<br />
we can devise a formal test <strong>of</strong> <strong>the</strong> <strong>the</strong>sis <strong>in</strong> <strong>the</strong> context <strong>of</strong><br />
<strong>the</strong> stock market. For auctions, we can ascerta<strong>in</strong> <strong>the</strong> true<br />
value by <strong>the</strong> price <strong>in</strong> markets outside <strong>of</strong> <strong>the</strong> auction. However,<br />
one would need a creative test to establish <strong>the</strong> overvaluation<br />
<strong>in</strong> <strong>the</strong> o<strong>the</strong>r contexts.<br />
We divide <strong>the</strong> rest <strong>of</strong> this paper <strong>in</strong>to <strong>the</strong> follow<strong>in</strong>g parts.<br />
We first review <strong>the</strong> relevant literatures. We <strong>the</strong>n present a<br />
def<strong>in</strong>ition <strong>of</strong> hype <strong>and</strong> o<strong>the</strong>r terms. Next, we <strong>in</strong>tegrate past<br />
<strong>the</strong>ory to derive specific hypo<strong>the</strong>ses that are tested <strong>in</strong> three<br />
separate studies. F<strong>in</strong>ally, we discuss <strong>the</strong> implications <strong>and</strong><br />
limitations <strong>of</strong> <strong>the</strong>se studies.<br />
LITERATURE: HOW PAST INFORMATION<br />
AFFECTS CONSUMERS’ CHOICES<br />
There is a small but grow<strong>in</strong>g literature <strong>in</strong> market<strong>in</strong>g that<br />
looks at stock market returns to market<strong>in</strong>g events or announcements,<br />
such as br<strong>and</strong> extensions (Lane <strong>and</strong> Jacobson<br />
1995), new product <strong>in</strong>troductions (Chaney, Dev<strong>in</strong>ney,<br />
<strong>and</strong> W<strong>in</strong>er 1991), <strong>and</strong> celebrity announcements (Agarwal<br />
<strong>and</strong> Kamakura 1995). Relative to those studies, our<br />
research focuses on <strong>the</strong> rationale for advertis<strong>in</strong>g <strong>the</strong> past<br />
performance <strong>of</strong> stocks <strong>and</strong> mutual funds, <strong>and</strong> its impact, if<br />
any, on <strong>the</strong> abnormal returns to those f<strong>in</strong>ancial products. It<br />
could also provide a unify<strong>in</strong>g <strong>the</strong>ory for momentum <strong>and</strong><br />
reversal effects documented by f<strong>in</strong>ancial researchers. It<br />
draws on <strong>the</strong> literature <strong>of</strong> biases <strong>and</strong> heuristics, which has<br />
begun to <strong>in</strong>terest marketers (e.g., Raghubir <strong>and</strong> Das 1999).<br />
As <strong>in</strong>dicated above, past sequences <strong>of</strong> <strong>in</strong>formation<br />
about a stock could affect consumers’ expectations <strong>of</strong> <strong>the</strong><br />
future performance <strong>of</strong> <strong>the</strong> stock <strong>in</strong> two alternative ways:<br />
<strong>the</strong> hot h<strong>and</strong> (trend projection) <strong>and</strong> <strong>the</strong> gambler’s fallacy<br />
(trend reversal). Both <strong>the</strong>se responses arise from a consumer’s<br />
basic misunderst<strong>and</strong><strong>in</strong>g <strong>of</strong> r<strong>and</strong>om events.
Consumers mistakenly believe that small samples should<br />
be representative <strong>of</strong> <strong>the</strong> underly<strong>in</strong>g process. This misunderst<strong>and</strong><strong>in</strong>g<br />
has been called <strong>the</strong> representativeness heuristic<br />
or <strong>the</strong> law <strong>of</strong> small numbers (Kahneman <strong>and</strong> Tversky<br />
1972). This heuristic causes people to judge <strong>the</strong> probability<br />
<strong>of</strong> an event “by <strong>the</strong> degree to which it is (i) similar <strong>in</strong><br />
essential properties to its parent population <strong>and</strong> (ii) reflects<br />
<strong>the</strong> salient features <strong>of</strong> <strong>the</strong> process by which it is generated”<br />
(Kahneman <strong>and</strong> Tversky 1972:430). In contrast, <strong>the</strong> dom<strong>in</strong>ant<br />
view <strong>in</strong> economics <strong>and</strong> f<strong>in</strong>ance is that past trends <strong>in</strong><br />
stock prices do not conta<strong>in</strong> any <strong>in</strong>formation about its future<br />
price, because <strong>the</strong> current price encapsulates all past<br />
<strong>in</strong>formation.<br />
Here we briefly review <strong>the</strong> literature beh<strong>in</strong>d <strong>the</strong>se three<br />
related issues: <strong>the</strong> gambler’s fallacy, <strong>the</strong> hot h<strong>and</strong>, <strong>and</strong> <strong>the</strong><br />
r<strong>and</strong>om walk. We <strong>the</strong>n clearly del<strong>in</strong>eate <strong>the</strong> focus <strong>and</strong> contribution<br />
<strong>of</strong> <strong>the</strong> current research.<br />
The Gambler’s Fallacy<br />
One <strong>of</strong> <strong>the</strong> earliest known statistical mistakes people<br />
made was <strong>the</strong> assumption <strong>of</strong> dependence <strong>in</strong> a sequence <strong>of</strong><br />
<strong>in</strong>dependent events such as outcomes <strong>of</strong> a co<strong>in</strong> toss. This<br />
phenomenon came to be called <strong>the</strong> gambler’s fallacy,<br />
because <strong>the</strong> error was common among gamblers who persisted<br />
<strong>in</strong> play<strong>in</strong>g <strong>in</strong> <strong>the</strong> face <strong>of</strong> losses, because <strong>the</strong>y<br />
wrongly believed that success must follow a str<strong>in</strong>g <strong>of</strong><br />
losses. Tversky <strong>and</strong> Kahneman (1971) proposed that this<br />
fallacy arises because consumers do not realize that each<br />
draw is an <strong>in</strong>dependent event, <strong>and</strong> thus a loss is as likely<br />
after a str<strong>in</strong>g <strong>of</strong> losses as on <strong>the</strong> first trial.<br />
The gambler’s fallacy may be <strong>the</strong> underly<strong>in</strong>g cause <strong>of</strong><br />
an anomaly <strong>in</strong> <strong>the</strong> stock market. Shefr<strong>in</strong> <strong>and</strong> Statman<br />
(1985) <strong>and</strong> Odean (1998) showed that consumers hold on<br />
to <strong>the</strong>ir los<strong>in</strong>g stocks too long <strong>and</strong> sell <strong>the</strong>ir w<strong>in</strong>n<strong>in</strong>g stocks<br />
too fast. We posit that <strong>the</strong> gambler’s fallacy identified at<br />
<strong>the</strong> <strong>in</strong>dividual level may be <strong>the</strong> probable cause for <strong>the</strong> phenomenon<br />
<strong>of</strong> hold<strong>in</strong>g on to losers at <strong>the</strong> aggregate level. In<br />
both cases, consumers wrongly expect a reversal <strong>in</strong> what<br />
are essentially r<strong>and</strong>om events. The gambler expects <strong>the</strong><br />
los<strong>in</strong>g streak to reverse. Similarly, consumers hold on to<br />
los<strong>in</strong>g stocks expect<strong>in</strong>g <strong>the</strong> str<strong>in</strong>g <strong>of</strong> losses to reverse. So,<br />
hang<strong>in</strong>g on to los<strong>in</strong>g stocks would enable <strong>the</strong>m to recoup<br />
<strong>the</strong>ir losses on <strong>the</strong> reversal. The gambler’s fallacy seems to<br />
conflict with <strong>the</strong> o<strong>the</strong>r bias <strong>in</strong> process<strong>in</strong>g sequences <strong>of</strong><br />
<strong>in</strong>formation under uncerta<strong>in</strong>ty: <strong>the</strong> hot h<strong>and</strong>.<br />
The Hot H<strong>and</strong><br />
Gilovich, Vallone, <strong>and</strong> Tversky (1985) orig<strong>in</strong>ally<br />
co<strong>in</strong>ed <strong>the</strong> term hot h<strong>and</strong> to describe <strong>the</strong> public’s beliefs<br />
about <strong>the</strong> performance <strong>of</strong> basketball players. A player has<br />
a hot h<strong>and</strong> when he has had a run <strong>of</strong> successful baskets.<br />
The authors found that Philadelphia 76er basketball fans,<br />
players, <strong>and</strong> coaches believed that a player has a higher<br />
Johnson, Tellis / HEURISTICS AND BIASES 489<br />
probability <strong>of</strong> mak<strong>in</strong>g a basket after a streak <strong>of</strong> successful<br />
baskets. However, <strong>the</strong>ir empirical tests showed that players’<br />
performance was no better than chance. Tversky <strong>and</strong><br />
Gilovich (1989) showed that this behavior was due to <strong>the</strong><br />
fact that <strong>in</strong>dividuals did not see <strong>in</strong>dependence <strong>in</strong> <strong>the</strong> str<strong>in</strong>g<br />
<strong>of</strong> r<strong>and</strong>om events. Camerer (1989) showed that at <strong>the</strong><br />
aggregate level, <strong>the</strong> discrepancy between expectations<br />
based on <strong>the</strong> hot h<strong>and</strong> <strong>and</strong> performance <strong>of</strong> “hot” players<br />
was not strong enough for consumers to pr<strong>of</strong>it from.<br />
The hot h<strong>and</strong> phenomenon <strong>in</strong> sports is analogous to<br />
phenomena <strong>in</strong> behavioral f<strong>in</strong>ance called overreaction <strong>and</strong><br />
momentum <strong>in</strong>vest<strong>in</strong>g. DeBondt <strong>and</strong> Thaler (1985) conducted<br />
<strong>the</strong> study that sparked <strong>of</strong>f this debate. They argued<br />
that consumers who rely on past <strong>in</strong>formation become<br />
overly pessimistic about past losers <strong>and</strong> overly optimistic<br />
about past w<strong>in</strong>ners. As a result, past losers come to be<br />
undervalued <strong>and</strong> past w<strong>in</strong>ners come to be overvalued. This<br />
heuristic-driven bias causes prices to deviate from <strong>the</strong>ir<br />
fundamental value. So, DeBondt <strong>and</strong> Thaler (1985) predicted<br />
that stocks with extreme performance over an<br />
extended time period would display a reversal, as consumers<br />
realized <strong>the</strong> stocks’ fundamental value. Through empirical<br />
research, DeBondt <strong>and</strong> Thaler (1987, 1989, 1990)<br />
showed that, <strong>in</strong> <strong>the</strong> long run, extreme losers outperformed<br />
<strong>the</strong> market <strong>and</strong> extreme w<strong>in</strong>ners underperformed <strong>the</strong><br />
market.<br />
Chopra, Lakonishok, <strong>and</strong> Ritter (1993) confirmed this<br />
phenomenon by show<strong>in</strong>g that even after carefully controll<strong>in</strong>g<br />
for size <strong>and</strong> risk, past losers still earned excess returns.<br />
In addition, Chopra et al. (1993) <strong>and</strong> La Porta, Lakonishok,<br />
Shleifer, <strong>and</strong> Vishny (1994) showed that corrections<br />
occur after earn<strong>in</strong>gs announcements. This result implies<br />
that consumers believe <strong>in</strong> a positive trend until <strong>the</strong>y are<br />
disappo<strong>in</strong>ted by a negative earn<strong>in</strong>gs result. Consistent<br />
with this f<strong>in</strong>d<strong>in</strong>g, momentum studies such as those by<br />
Jegadeesh <strong>and</strong> Titman (1993) found that prior w<strong>in</strong>ners<br />
cont<strong>in</strong>ue to outperform prior losers <strong>in</strong> <strong>the</strong> short run,<br />
which could result from trends projected by <strong>in</strong>dividual<br />
consumers.<br />
The phenomenon <strong>of</strong> <strong>the</strong> hot h<strong>and</strong> identified at <strong>the</strong> <strong>in</strong>dividual<br />
level is <strong>the</strong> probable cause for <strong>the</strong> overreaction phenomenon<br />
at <strong>the</strong> aggregate level <strong>in</strong> stock markets. The tendency<br />
<strong>of</strong> consumers to mis<strong>in</strong>terpret r<strong>and</strong>om runs, see<br />
trends <strong>in</strong> <strong>the</strong>m, <strong>and</strong> project <strong>the</strong> trends <strong>in</strong>to <strong>the</strong> future is<br />
probably <strong>the</strong> underly<strong>in</strong>g process that gives rise to both<br />
phenomena. Indeed, DeBondt <strong>and</strong> Thaler (1985) did <strong>of</strong>fer<br />
a similar explanation under <strong>the</strong> rubric <strong>of</strong> <strong>the</strong> representative<br />
heuristic. The glorification <strong>in</strong> ads <strong>of</strong> past growth for<br />
stocks, mutual funds, <strong>and</strong> similar products shows that<br />
advertisers th<strong>in</strong>k that consumers ei<strong>the</strong>r subscribe to this<br />
view or will do so <strong>in</strong> response to <strong>the</strong> ads.<br />
The <strong>the</strong>ory that stocks essentially follow a r<strong>and</strong>om<br />
walk contrasts with <strong>the</strong> above two views <strong>of</strong> consumer<br />
behavior (<strong>the</strong> hot h<strong>and</strong> <strong>and</strong> <strong>the</strong> gambler’s fallacy).
490 JOURNAL OF THE ACADEMY OF MARKETING SCIENCE FALL 2005<br />
The R<strong>and</strong>om Walk Theory <strong>and</strong><br />
Efficient Markets<br />
The dom<strong>in</strong>ant <strong>the</strong>ory <strong>in</strong> f<strong>in</strong>ance about <strong>the</strong> behavior <strong>of</strong><br />
prices is <strong>the</strong> r<strong>and</strong>om walk. The <strong>the</strong>ory posits that stock<br />
prices behave as if each day’s price comes from a r<strong>and</strong>om<br />
draw. Hence, <strong>the</strong> best estimate <strong>of</strong> tomorrow’s price is<br />
today’s price. Thus, past prices are <strong>of</strong> no consequence<br />
when predict<strong>in</strong>g future prices. Tests <strong>of</strong> <strong>the</strong> r<strong>and</strong>om walk<br />
<strong>the</strong>ory attempt to see if future prices can <strong>in</strong>deed be forecasted<br />
us<strong>in</strong>g past prices. Such tests conclude that <strong>in</strong> <strong>the</strong><br />
prediction <strong>of</strong> <strong>the</strong> next period’s prices, all that matters is<br />
today’s price.<br />
Over <strong>the</strong> years, <strong>the</strong> r<strong>and</strong>om walk has withstood numerous<br />
criticisms (see, e.g., Fama 1998). In particular, Samuelson<br />
(1965) showed that properly anticipated stock<br />
prices are r<strong>and</strong>om, although <strong>the</strong>y fully reflect <strong>the</strong> present<br />
value <strong>of</strong> <strong>the</strong> discounted future cash flows. These ideas led<br />
to Fama’s efficient market hypo<strong>the</strong>sis (Fama 1970, 1991).<br />
Two key propositions <strong>of</strong> this <strong>the</strong>ory are that stock prices<br />
adjust <strong>in</strong>stantaneously to <strong>in</strong>formation so that <strong>the</strong>y fully<br />
<strong>in</strong>corporate past <strong>in</strong>formation <strong>and</strong> future expectation.<br />
Today, a “semistrong” form <strong>of</strong> <strong>the</strong> efficient market<br />
hypo<strong>the</strong>sis is <strong>the</strong> dom<strong>in</strong>ant view <strong>in</strong> <strong>the</strong> f<strong>in</strong>ancial pr<strong>of</strong>ession<br />
(Fama 1991; Jensen 1978). It holds that prices reflect all<br />
“public” <strong>in</strong>formation. Security analysts formulate value<br />
based on public <strong>in</strong>formation available to all consumers.<br />
Aggregation <strong>of</strong> estimates from a large number <strong>of</strong> <strong>in</strong>dependent<br />
analysts leads to a “fair value.”<br />
Researchers have devised a number <strong>of</strong> experiments to<br />
measure how quickly a market adjusts to new <strong>in</strong>formation.<br />
Accord<strong>in</strong>g to <strong>the</strong> efficient market hypo<strong>the</strong>sis, this adjustment<br />
has to occur very quickly so that alert consumers do<br />
not pr<strong>of</strong>it from it. In Fama’s (1970, 1991, 1998) surveys,<br />
<strong>the</strong> vast majority <strong>of</strong> those studies were unable to reject <strong>the</strong><br />
“efficient markets” hypo<strong>the</strong>sis for common stocks. These<br />
early studies led one prom<strong>in</strong>ent researcher to conclude that<br />
“<strong>the</strong>re is no o<strong>the</strong>r proposition <strong>in</strong> economics which has<br />
more solid empirical evidence support<strong>in</strong>g it than <strong>the</strong> efficient<br />
market hypo<strong>the</strong>sis” (Jensen 1978).<br />
Summary<br />
Thus, <strong>the</strong> dom<strong>in</strong>ant view <strong>in</strong> f<strong>in</strong>ance is that <strong>the</strong> stock<br />
market is efficient <strong>and</strong> stock prices are r<strong>and</strong>om. As such,<br />
no <strong>in</strong>dividual could beat <strong>the</strong> market consistently over <strong>the</strong><br />
long haul. Indeed, several studies have shown that even<br />
pr<strong>of</strong>essionals, like managers <strong>of</strong> mutual funds, do not beat<br />
<strong>the</strong> market consistently. The crux <strong>of</strong> <strong>the</strong> issue is whe<strong>the</strong>r<br />
consumers believe <strong>in</strong> <strong>the</strong> r<strong>and</strong>om walk <strong>and</strong> efficient markets.<br />
Marketers <strong>of</strong> stocks <strong>and</strong> mutual funds apparently do<br />
not th<strong>in</strong>k that consumers believe <strong>in</strong> <strong>the</strong> r<strong>and</strong>om walk <strong>and</strong><br />
efficient markets or advertise <strong>in</strong> <strong>the</strong> hope that consumers<br />
would not do so. Marketers rout<strong>in</strong>ely market such products<br />
by advertis<strong>in</strong>g <strong>the</strong> past performance <strong>of</strong> <strong>the</strong>ir favorite<br />
stocks or <strong>the</strong>ir own mutual funds, despite <strong>the</strong> SEC disclosure<br />
at <strong>the</strong> bottom. Apparently, <strong>the</strong>y hope <strong>and</strong> believe that<br />
consumers are <strong>in</strong>fluenced by past performance, suffer<strong>in</strong>g<br />
from <strong>the</strong> hot h<strong>and</strong> fallacy, but not <strong>the</strong> gambler’s fallacy. Is<br />
this belief true?<br />
This is <strong>the</strong> focus <strong>of</strong> <strong>the</strong> current research. We propose<br />
that, <strong>in</strong> contrast to <strong>the</strong> dictates <strong>of</strong> f<strong>in</strong>ancial <strong>and</strong> economic<br />
<strong>the</strong>ory, consumers do not ignore past <strong>in</strong>formation <strong>of</strong> stocks<br />
<strong>and</strong> mutual funds. In particular, when faced with <strong>the</strong> performance<br />
<strong>of</strong> stocks <strong>in</strong> <strong>the</strong> form <strong>of</strong> a sequence <strong>of</strong> outcomes,<br />
<strong>the</strong>y develop beliefs about <strong>the</strong> future <strong>of</strong> <strong>the</strong> sequence that<br />
<strong>in</strong>cludes both trend projection <strong>and</strong> trend reversal, depend<strong>in</strong>g<br />
on <strong>the</strong> length <strong>of</strong> <strong>the</strong> sequence. As a result, <strong>the</strong>ir behavior<br />
<strong>in</strong>corporates both effects described above: <strong>the</strong> hot h<strong>and</strong><br />
(due to trend projection) <strong>and</strong> <strong>the</strong> gambler’s fallacy (due to<br />
trend reversal). This position <strong>in</strong>tegrates <strong>the</strong> two phenomena,<br />
as response to sequences <strong>of</strong> <strong>in</strong>formation, differ<strong>in</strong>g<br />
only by <strong>the</strong> length <strong>of</strong> <strong>the</strong> sequence.<br />
Three studies ascerta<strong>in</strong> whe<strong>the</strong>r (a) <strong>in</strong>formation <strong>in</strong> <strong>the</strong><br />
form <strong>of</strong> a sequence <strong>of</strong> positive or negative earn<strong>in</strong>gs affect<br />
preferences, (b) <strong>the</strong> affective process <strong>of</strong> mood moderates<br />
<strong>the</strong>se preferences, <strong>and</strong> (c) consumers’biases at <strong>the</strong> <strong>in</strong>dividual<br />
level are manifest as anomalies <strong>in</strong> aggregate markets.<br />
We next build a <strong>the</strong>oretical framework that leads to testable<br />
hypo<strong>the</strong>ses.<br />
CONCEPT OF HYPE IN CONSUMERS’<br />
PURCHASE OF FINANCIAL PRODUCTS<br />
We develop <strong>the</strong> concept <strong>of</strong> hype <strong>in</strong> <strong>the</strong> context <strong>of</strong> consumers’<br />
process<strong>in</strong>g <strong>of</strong> sequential <strong>in</strong>formation. To clarify<br />
<strong>the</strong> discussion, we def<strong>in</strong>e some <strong>of</strong> <strong>the</strong> key terms we use. A<br />
sequence or str<strong>in</strong>g is a series <strong>of</strong> ei<strong>the</strong>r positive or negative<br />
numbers. The term run refers to a sequence <strong>of</strong> <strong>in</strong>creas<strong>in</strong>g<br />
or decreas<strong>in</strong>g numbers. We use <strong>the</strong> term positive run to<br />
refer to a sequence <strong>of</strong> <strong>in</strong>creas<strong>in</strong>g positive numbers <strong>and</strong> a<br />
negative run to refer to a sequence <strong>of</strong> decreas<strong>in</strong>g positive<br />
numbers. Thus, a sequence <strong>of</strong> earn<strong>in</strong>gs per share (all numbers<br />
<strong>in</strong> dollars) <strong>of</strong> 2, 4, 6 is a sequence <strong>of</strong> <strong>in</strong>creas<strong>in</strong>g positive<br />
earn<strong>in</strong>gs or a positive run. The sequence 6, 4, 2 is a<br />
sequence <strong>of</strong> decreas<strong>in</strong>g positive earn<strong>in</strong>gs or a negative run.<br />
We use <strong>the</strong> term run length to refer to <strong>the</strong> length or total<br />
number <strong>of</strong> numbers <strong>in</strong> <strong>the</strong> run.<br />
We propose an <strong>in</strong>tegrated heuristic that we call hype<br />
that reconciles <strong>the</strong> conflict<strong>in</strong>g predictions <strong>of</strong> <strong>the</strong> hot h<strong>and</strong><br />
<strong>and</strong> <strong>the</strong> gambler’s fallacy. We use <strong>the</strong> term hype to describe<br />
a mental process by which consumers overvalue or undervalue<br />
an asset, relative to its true or market value, because<br />
<strong>of</strong> a run <strong>of</strong> <strong>in</strong>formation about its past performance. We<br />
posit that this evaluation is not l<strong>in</strong>ear. Initially, <strong>in</strong> <strong>the</strong> face<br />
<strong>of</strong> a sequence <strong>of</strong> <strong>in</strong>creas<strong>in</strong>g positive earn<strong>in</strong>gs, consumers<br />
overvalue an asset, suffer<strong>in</strong>g from <strong>the</strong> hot h<strong>and</strong> fallacy. As<br />
<strong>the</strong> run leng<strong>the</strong>ns, skepticism (gambler’s fallacy) sets <strong>in</strong>,<br />
lead<strong>in</strong>g to a reversal <strong>in</strong> valuations <strong>and</strong> a rejection <strong>of</strong> <strong>the</strong>
asset. The latter phenomenon is ak<strong>in</strong> to <strong>the</strong> gambler’s fallacy.<br />
We believe that for ei<strong>the</strong>r pattern, <strong>the</strong> same underly<strong>in</strong>g<br />
mis<strong>in</strong>terpretation <strong>of</strong> probabilities occurs, that is, consumers<br />
misunderst<strong>and</strong> <strong>the</strong> essential r<strong>and</strong>omness <strong>in</strong> a<br />
sequence <strong>of</strong> events. Relative to <strong>the</strong> literature, <strong>the</strong> key contribution<br />
we make is to assert that consumers suffer from<br />
both <strong>the</strong> hot h<strong>and</strong> <strong>and</strong> <strong>the</strong> gambler’s fallacy, depend<strong>in</strong>g on<br />
<strong>the</strong> length <strong>of</strong> <strong>the</strong> run <strong>the</strong>y face.<br />
We test this framework <strong>in</strong> <strong>the</strong> context <strong>of</strong> consumers’<br />
<strong>and</strong> <strong>the</strong> market’s response to stocks conditional on a run <strong>of</strong><br />
earn<strong>in</strong>gs <strong>of</strong> those <strong>in</strong>struments. We do so <strong>in</strong> three studies,<br />
each <strong>of</strong> which we now describe.<br />
STUDY 1: STOCK PREFERENCES IN THE<br />
PRESENCE OF HYPE<br />
Study 1 elaborates on a <strong>the</strong>ory <strong>of</strong> how hype could affect<br />
consumers’ preferences to trade stocks at <strong>the</strong> <strong>in</strong>dividual<br />
level. The <strong>the</strong>ory leads to certa<strong>in</strong> testable hypo<strong>the</strong>ses,<br />
which we validate through an experiment. We next present<br />
<strong>the</strong> <strong>the</strong>ory, experiment, results, <strong>and</strong> discussion <strong>of</strong> Study 1.<br />
Theory: Does Hype Affect<br />
Consumers’ Trad<strong>in</strong>g <strong>of</strong> <strong>Stock</strong>s?<br />
Our concept <strong>of</strong> hype <strong>in</strong>tegrates two separate biases: <strong>the</strong><br />
hot h<strong>and</strong> <strong>and</strong> <strong>the</strong> gambler’s fallacy. At <strong>the</strong> level <strong>of</strong> <strong>the</strong> <strong>in</strong>dividual<br />
consumer, both <strong>the</strong>se factors occur <strong>in</strong> tension. Initially,<br />
<strong>the</strong> hot h<strong>and</strong> fallacy leads to an <strong>in</strong>creas<strong>in</strong>g bias <strong>in</strong><br />
consumers’ evaluation <strong>and</strong> trad<strong>in</strong>g <strong>of</strong> stocks. After a<br />
period <strong>of</strong> susta<strong>in</strong>ed <strong>in</strong>crease, ano<strong>the</strong>r bias—<strong>the</strong> gambler’s<br />
fallacy—probably dom<strong>in</strong>ates lead<strong>in</strong>g to a reversal <strong>in</strong> this<br />
trend. This pattern leads to a nonl<strong>in</strong>ear, <strong>in</strong>verted U-shaped<br />
response to <strong>in</strong>formation about a stock. We expla<strong>in</strong> this<br />
nonl<strong>in</strong>earity <strong>in</strong> greater depth below.<br />
We believe that <strong>the</strong> phenomenon holds symmetrically<br />
for <strong>the</strong> buy<strong>in</strong>g <strong>and</strong> sell<strong>in</strong>g <strong>of</strong> stocks, with sequences <strong>of</strong><br />
<strong>in</strong>creas<strong>in</strong>g <strong>and</strong> decreas<strong>in</strong>g positive earn<strong>in</strong>gs, albeit <strong>in</strong><br />
opposite directions. In <strong>the</strong> <strong>in</strong>terest <strong>of</strong> parsimony, we <strong>in</strong>itially<br />
develop <strong>the</strong> hypo<strong>the</strong>ses <strong>in</strong> <strong>the</strong> context <strong>of</strong> buy<strong>in</strong>g<br />
stocks with a sequence <strong>of</strong> <strong>in</strong>creas<strong>in</strong>g positive earn<strong>in</strong>gs or a<br />
positive run <strong>and</strong> sell<strong>in</strong>g stocks with a sequence <strong>of</strong> decreas<strong>in</strong>g<br />
positive earn<strong>in</strong>gs or a negative earn<strong>in</strong>gs run.<br />
Consider consumers faced with <strong>the</strong> task <strong>of</strong> buy<strong>in</strong>g<br />
stocks, such as when <strong>the</strong>y have cash from tax rebates, w<strong>in</strong>n<strong>in</strong>gs,<br />
sav<strong>in</strong>gs, or <strong>in</strong>heritances. When consumers choose<br />
stocks for <strong>in</strong>vest<strong>in</strong>g, Lakonishok, Shliefer, <strong>and</strong> Vishny<br />
(1994) have shown that consumers rely on past <strong>in</strong>formation<br />
about <strong>the</strong>se stocks, such as earn<strong>in</strong>gs <strong>and</strong> sales growth,<br />
as guides to <strong>the</strong> value <strong>of</strong> a stock. As such, <strong>the</strong>y are likely to<br />
arrive at biased conclusions <strong>of</strong> <strong>the</strong> value <strong>of</strong> <strong>the</strong> stocks. This<br />
result occurs because consumers are not perfect <strong>in</strong>formation<br />
processors <strong>and</strong> tend to use heuristics to collect<br />
Johnson, Tellis / HEURISTICS AND BIASES 491<br />
<strong>in</strong>formation, reduce uncerta<strong>in</strong>ty, <strong>and</strong> form expectations<br />
(Van Raaij 1991).<br />
The use <strong>of</strong> sequential <strong>in</strong>formation as a heuristic, such as<br />
a run <strong>of</strong> past earn<strong>in</strong>gs <strong>of</strong> a stock, leads to special problems<br />
(Johnson, Tellis, <strong>and</strong> Mac<strong>in</strong>nis forthcom<strong>in</strong>g). Craik <strong>and</strong><br />
Lockhart (1972) have shown that exist<strong>in</strong>g knowledge<br />
structures serve as <strong>in</strong>ternalized frames <strong>of</strong> reference that<br />
encode <strong>in</strong>com<strong>in</strong>g stimuli. This encod<strong>in</strong>g affects how consumers<br />
evaluate sequential <strong>in</strong>formation. Consider first an<br />
<strong>in</strong>creas<strong>in</strong>g sequence <strong>of</strong> earn<strong>in</strong>gs. Consumers observe <strong>the</strong><br />
<strong>in</strong>itial ris<strong>in</strong>g trend <strong>in</strong> <strong>the</strong> sequence <strong>and</strong> conclude that <strong>the</strong><br />
stock is <strong>of</strong> good value <strong>and</strong> are enthusiastic about it. As <strong>the</strong><br />
sequence grows, <strong>the</strong> new stimuli <strong>in</strong> <strong>the</strong> form <strong>of</strong> fur<strong>the</strong>r<br />
<strong>in</strong>creases confirm <strong>the</strong>ir forecasts <strong>and</strong> fur<strong>the</strong>r bias <strong>the</strong>ir valuations<br />
<strong>in</strong> <strong>the</strong> direction <strong>of</strong> <strong>the</strong> exist<strong>in</strong>g judgment. Hence,<br />
<strong>the</strong>ir enthusiasm grows. This response is consistent with<br />
E<strong>in</strong>horn <strong>and</strong> Hogarth (1978), who suggested that people<br />
search for confirm<strong>in</strong>g evidence for <strong>the</strong>ir beliefs. So, as <strong>the</strong><br />
sequence <strong>of</strong> earn<strong>in</strong>gs cont<strong>in</strong>ues upward, consumers place<br />
higher value on <strong>the</strong> stock <strong>and</strong> tend to buy it. Examples <strong>of</strong><br />
such behavior are well documented (Andreassen 1988;<br />
Zeckhauser et al. 1993). Shefr<strong>in</strong> (2000) discussed how<br />
bullishness <strong>in</strong>creases after <strong>the</strong> market has gone up <strong>and</strong><br />
bearishness <strong>in</strong>creases after <strong>the</strong> market has fallen. However,<br />
we posit that this bias persists up to a po<strong>in</strong>t, after<br />
which <strong>the</strong> gambler’s fallacy probably takes precedence.<br />
As <strong>the</strong> trend cont<strong>in</strong>ues, skepticism arises, because <strong>of</strong><br />
consumers’ common experience <strong>and</strong> belief that “no good<br />
th<strong>in</strong>g lasts for ever.” As <strong>the</strong> sequence <strong>of</strong> earn<strong>in</strong>gs grows,<br />
consumers are likely to be subject to <strong>the</strong> gambler’s fallacy<br />
<strong>and</strong> revise <strong>the</strong>ir forecast. The reason is probably due to<br />
consumers’ misunderst<strong>and</strong><strong>in</strong>g <strong>of</strong> probabilities. Tversky<br />
<strong>and</strong> Kahneman (1971) suggested that people mistakenly<br />
believe that chance sequences are locally representative,<br />
so every part <strong>of</strong> <strong>the</strong> sequence must appear equally r<strong>and</strong>om.<br />
They wrongly believe that <strong>the</strong> laws <strong>of</strong> probability preclude<br />
very long sequences. Thus, <strong>the</strong>y th<strong>in</strong>k <strong>the</strong>y need to see<br />
some losses <strong>in</strong> a long positive run or some ga<strong>in</strong>s <strong>in</strong> a long<br />
negative run. Fail<strong>in</strong>g to see that, <strong>the</strong>y expect a reversal <strong>and</strong><br />
act accord<strong>in</strong>gly. Similarly, Shefr<strong>in</strong> (2000) showed that<br />
participants <strong>in</strong> a co<strong>in</strong>-toss<strong>in</strong>g experiment expect a reversal<br />
after a long sequence <strong>of</strong> tails or heads. This is <strong>the</strong> mental<br />
process that gives rise to <strong>the</strong> gambler’s fallacy.<br />
Applied <strong>in</strong> <strong>the</strong> present context <strong>of</strong> stock purchases, consumers<br />
will expect a reversal after a very long run <strong>of</strong> positive<br />
earn<strong>in</strong>gs. As a result, <strong>the</strong>y disfavor stocks whose<br />
earn<strong>in</strong>gs show a very long positive run <strong>and</strong> are less likely<br />
to buy it. Hence, we hypo<strong>the</strong>size <strong>the</strong> follow<strong>in</strong>g:<br />
Hypo<strong>the</strong>sis A1: Faced with a positive earn<strong>in</strong>gs run for a<br />
stock, consumers’ preference for buy<strong>in</strong>g <strong>the</strong> stock<br />
will at first <strong>in</strong>crease for a small to moderate positive<br />
earn<strong>in</strong>gs run, but after some critical run length, consumer<br />
preference for buy<strong>in</strong>g <strong>the</strong> stock will<br />
eventually decrease.
492 JOURNAL OF THE ACADEMY OF MARKETING SCIENCE FALL 2005<br />
And conversely,<br />
Hypo<strong>the</strong>sis A2: Faced with a negative earn<strong>in</strong>gs run for a<br />
stock, consumers’ preference for buy<strong>in</strong>g <strong>the</strong> stock<br />
will at first decrease for a small to moderate negative<br />
run, but after some critical run length, consumer<br />
preference for buy<strong>in</strong>g <strong>the</strong> stock will eventually<br />
<strong>in</strong>crease.<br />
Now, consider consumers fac<strong>in</strong>g a task <strong>of</strong> sell<strong>in</strong>g stocks<br />
to pay for taxes, children’s education, or major purchases.<br />
We expect <strong>the</strong> cha<strong>in</strong> <strong>of</strong> causation that affects consumers<br />
who want to buy stocks with a sequence <strong>of</strong> <strong>in</strong>creas<strong>in</strong>g<br />
earn<strong>in</strong>gs to hold symmetrically for consumers who want to<br />
sell stocks with a sequence <strong>of</strong> decreas<strong>in</strong>g earn<strong>in</strong>gs. Initially,<br />
consumers <strong>in</strong> <strong>the</strong> latter condition are negatively biased<br />
by <strong>the</strong> sequence <strong>of</strong> decl<strong>in</strong><strong>in</strong>g earn<strong>in</strong>gs. As a result,<br />
<strong>the</strong>y tend to shun <strong>the</strong> stock <strong>of</strong> <strong>the</strong> firm that reports such a<br />
sequence <strong>and</strong> tend to sell it. However, for reasons discussed<br />
earlier, beyond a critical po<strong>in</strong>t, as <strong>the</strong> sequence <strong>of</strong><br />
earn<strong>in</strong>gs keeps decreas<strong>in</strong>g, <strong>the</strong>se consumers tend to reverse<br />
<strong>the</strong>ir valuations <strong>of</strong> <strong>the</strong>se stocks. Their aversion to <strong>the</strong><br />
stocks is less severe, <strong>and</strong> <strong>the</strong>y are less prone to sell such<br />
stocks. Hence,<br />
Hypo<strong>the</strong>sis A3: Faced with a positive earn<strong>in</strong>gs run for a<br />
stock, consumers’ preference for sell<strong>in</strong>g <strong>the</strong> stock<br />
will at first decrease for a small to moderate positive<br />
run, but after some critical run length, consumer<br />
preference for sell<strong>in</strong>g <strong>the</strong> stock will eventually<br />
<strong>in</strong>crease.<br />
And conversely,<br />
Hypo<strong>the</strong>sis A4: Faced with a negative earn<strong>in</strong>gs run for a<br />
stock, consumers’ preference for sell<strong>in</strong>g <strong>the</strong> stock<br />
will at first <strong>in</strong>crease for a small to moderate positive<br />
run, but after some critical run length, consumer<br />
preference for sell<strong>in</strong>g <strong>the</strong> stock will eventually<br />
decrease.<br />
Recall, however, that <strong>the</strong> efficient market hypo<strong>the</strong>sis is<br />
<strong>the</strong> dom<strong>in</strong>ant hypo<strong>the</strong>sis <strong>in</strong> f<strong>in</strong>ance <strong>and</strong> suggests that <strong>the</strong><br />
past may not be an <strong>in</strong>dicator <strong>of</strong> <strong>the</strong> future. Similarly, <strong>the</strong><br />
SEC requires that ads have a disclosure that past performance<br />
is no <strong>in</strong>dicator <strong>of</strong> future performance. Therefore,<br />
if consumers believe <strong>in</strong> <strong>the</strong> efficient market or <strong>the</strong> SECm<strong>and</strong>ated<br />
disclosure <strong>in</strong> ads, <strong>the</strong>n <strong>the</strong>y would not be <strong>in</strong>fluenced<br />
by <strong>the</strong> past run <strong>of</strong> earn<strong>in</strong>gs. Thus, we propose <strong>the</strong><br />
follow<strong>in</strong>g null hypo<strong>the</strong>sis:<br />
Hypo<strong>the</strong>sis 01: The length <strong>of</strong> an earn<strong>in</strong>gs run <strong>of</strong> a given<br />
stock does not affect consumers’preference for purchase<br />
or sale <strong>of</strong> its stock.<br />
Experimental Validation<br />
We conducted an experiment to study how past earn<strong>in</strong>gs<br />
<strong>of</strong> stocks affect consumers’ preference for those<br />
stocks. Here we present <strong>the</strong> design, sample, <strong>and</strong> procedure<br />
<strong>of</strong> <strong>the</strong> experiment.<br />
Design, Procedure, <strong>and</strong> Sample<br />
The study used a 3 (<strong>Run</strong> Length) 2 (Trade Type) 2<br />
(Valence) factorial between-subjects design. <strong>Run</strong> Length<br />
(3, 7, or 11) <strong>and</strong> Type <strong>of</strong> Trade (buy or sell) were <strong>the</strong> two<br />
between-subjects factors. Valence (positive or negative<br />
runs) was a with<strong>in</strong>-subjects factor.<br />
For positive runs, participants saw a sequence <strong>of</strong> <strong>in</strong>creas<strong>in</strong>g<br />
positive earn<strong>in</strong>gs. For negative runs, participants<br />
saw a decreas<strong>in</strong>g sequence <strong>of</strong> positive earn<strong>in</strong>gs (see<br />
Appendix). So <strong>in</strong> both cases, we used positive sequences<br />
for two reasons. First, <strong>in</strong> real markets, it is difficult to come<br />
across long runs <strong>of</strong> negative earn<strong>in</strong>gs. Second, consumers<br />
treat a decrease, albeit <strong>in</strong> positive earn<strong>in</strong>gs, as a negative<br />
signal. We kept <strong>the</strong> mean (but not <strong>the</strong> variance) <strong>of</strong> <strong>the</strong><br />
<strong>in</strong>creas<strong>in</strong>g <strong>and</strong> decreas<strong>in</strong>g series constant.<br />
People usually buy stocks when <strong>the</strong>y have money to<br />
<strong>in</strong>vest from tax rebates, w<strong>in</strong>n<strong>in</strong>gs, <strong>in</strong>heritances, or sav<strong>in</strong>gs.<br />
They sell stocks when <strong>the</strong>y want cash to pay for taxes, children’s<br />
education, or major purchases. We <strong>the</strong>refore developed<br />
two separate scenarios for <strong>the</strong> buy <strong>and</strong> sell<br />
conditions.<br />
In <strong>the</strong> buy condition, participants were told that <strong>the</strong>y<br />
had received a tax rebate <strong>of</strong> $1,000, which <strong>the</strong>y <strong>in</strong>tended to<br />
<strong>in</strong>vest <strong>in</strong> <strong>the</strong> stock market for a short period <strong>of</strong> one quarter.<br />
We focused on a quarter because it is well known that people<br />
suffer from temporal myopia (Hayes-Roth <strong>and</strong> Hayes-<br />
Roth 1979). They sought <strong>the</strong>ir broker’s advice who presented<br />
<strong>the</strong>m with two firms. These firms were identical,<br />
except that one stock (<strong>the</strong> w<strong>in</strong>n<strong>in</strong>g stock) had a positive<br />
run <strong>of</strong> <strong>in</strong>creas<strong>in</strong>g positive earn<strong>in</strong>gs, <strong>and</strong> <strong>the</strong> o<strong>the</strong>r (<strong>the</strong> los<strong>in</strong>g<br />
stock) had an equally long but negative run <strong>of</strong> decreas<strong>in</strong>g<br />
positive earn<strong>in</strong>gs. The stocks took on fictitious names,<br />
Haloo <strong>and</strong> Andaz, which were r<strong>and</strong>omized over conditions.<br />
The earn<strong>in</strong>gs per share for each stock were <strong>the</strong>n presented<br />
<strong>in</strong> a tabular format. Depend<strong>in</strong>g on which <strong>of</strong> three<br />
run-length conditions <strong>the</strong> participants were <strong>in</strong>, <strong>the</strong>y saw<br />
run lengths <strong>of</strong> 3, 7, or 11 for both <strong>the</strong> w<strong>in</strong>n<strong>in</strong>g <strong>and</strong> los<strong>in</strong>g<br />
stock. (See Appendix for an example with run length<br />
<strong>of</strong> 11.)<br />
In <strong>the</strong> sell condition, participants were told that <strong>the</strong>y<br />
had <strong>in</strong>herited a small portfolio <strong>of</strong> $20,000 <strong>of</strong> which <strong>the</strong>y<br />
were plann<strong>in</strong>g to use $1,000 to buy a computer. To decide<br />
on which stock to sell, <strong>the</strong>y approached <strong>the</strong>ir broker, who<br />
presented <strong>the</strong>m with two stocks, identical except that <strong>the</strong>y<br />
differed <strong>in</strong> <strong>the</strong>ir sequence <strong>of</strong> past earn<strong>in</strong>gs. The rest <strong>of</strong> <strong>the</strong><br />
experiment was <strong>the</strong> same as for <strong>the</strong> buy condition.<br />
We measured participants’ preference for <strong>the</strong> w<strong>in</strong>n<strong>in</strong>g<br />
<strong>and</strong> los<strong>in</strong>g stocks on a 5-po<strong>in</strong>t scale. The scale ranged from
FIGURE 2<br />
Predicted Preferences for Buy<strong>in</strong>g <strong>and</strong> Sell<strong>in</strong>g<br />
From Study 1<br />
sure preference for <strong>the</strong> w<strong>in</strong>n<strong>in</strong>g stock to sure preference<br />
for <strong>the</strong> los<strong>in</strong>g stock, with <strong>the</strong> center be<strong>in</strong>g a po<strong>in</strong>t <strong>of</strong> <strong>in</strong>difference.<br />
Participants were also asked how <strong>the</strong>y would split<br />
<strong>the</strong>ir $1,000 between <strong>the</strong> two stocks. Additional questions<br />
assessed participants’ knowledge <strong>of</strong>, <strong>and</strong> experience <strong>in</strong>,<br />
<strong>the</strong> stock market.<br />
We used a sample <strong>of</strong> 139 senior bus<strong>in</strong>ess undergraduates<br />
at a large university.<br />
Results<br />
5<br />
4<br />
3<br />
2<br />
1<br />
0<br />
Preference<br />
-11 -9 -7 -5 -3 -1 1 3 5 7 9 11<br />
TABLE 1<br />
Estimates <strong>of</strong> Regression <strong>of</strong><br />
Preference on <strong>Run</strong> Length<br />
Variable Estimate Probability<br />
Intercept 3.000 .0001<br />
Buy Length 0.474 .0001<br />
Buy Length 2<br />
–0.032 .0001<br />
Sell Length –0.191 .0002<br />
Sell Length 2<br />
R<br />
0.011 .0309<br />
2 = .53<br />
F value = 77.866 (.0001)<br />
N = 278<br />
To test <strong>the</strong> hypo<strong>the</strong>ses with <strong>the</strong> experimental data,<br />
we ran <strong>the</strong> follow<strong>in</strong>g multiple regression model, with l<strong>in</strong>ear<br />
<strong>and</strong> quadratic terms to capture <strong>the</strong> nonl<strong>in</strong>earity <strong>in</strong><br />
predictions:<br />
Preference Rat<strong>in</strong>g = Intercept + 1 (BUY LENGTH)<br />
+ 2 (BUY LENGTH 2 )<br />
+ 3 (SELL LENGTH)<br />
+ 4 (SELL LENGTH 2 ) + ,<br />
<strong>Run</strong><br />
Buy<br />
Sell<br />
(1)<br />
Johnson, Tellis / HEURISTICS AND BIASES 493<br />
where BUY <strong>and</strong> SELL are experimental conditions reflect<strong>in</strong>g<br />
whe<strong>the</strong>r participants had to buy or sell stocks,<br />
LENGTH is <strong>the</strong> length <strong>of</strong> run <strong>of</strong> w<strong>in</strong>n<strong>in</strong>g or los<strong>in</strong>g stocks,<br />
betas are parameters to be estimated, <strong>and</strong> epsilon are errors<br />
assumed to be IID normal. To analyze <strong>the</strong> data, we use a regression<br />
with dummy variables <strong>and</strong> <strong>in</strong>teractions. The<br />
model <strong>in</strong> (1) captures both l<strong>in</strong>ear <strong>and</strong> nonl<strong>in</strong>ear effects.<br />
(Figure 2 graphically presents <strong>the</strong> effects captured by <strong>the</strong><br />
regression estimates.)<br />
Results are pooled over <strong>the</strong> alternate fictitious stocks<br />
(Haloo or Andaz) that participants faced. (Separate analyses<br />
for each did not show significant differences <strong>in</strong><br />
coefficients.)<br />
Table 1 presents <strong>the</strong> parameter estimates, p-values, <strong>and</strong><br />
fit statistics for <strong>the</strong> pooled sample.<br />
The f<strong>in</strong>d<strong>in</strong>gs from this experiment support Hypo<strong>the</strong>ses<br />
1, 2, 3, <strong>and</strong> 4. Hypo<strong>the</strong>sis 1 stated that for an <strong>in</strong>creas<strong>in</strong>g<br />
sequence <strong>of</strong> earn<strong>in</strong>gs, <strong>the</strong> longer <strong>the</strong> run length, <strong>the</strong> greater<br />
<strong>the</strong> preference to buy <strong>the</strong> stock. The positive <strong>and</strong> highly<br />
significant coefficient for Buy Length (0.474, p < .0001)<br />
shows that consumers do <strong>in</strong>deed prefer to buy <strong>the</strong> w<strong>in</strong>n<strong>in</strong>g<br />
stock when its run length <strong>in</strong>creases.<br />
Hypo<strong>the</strong>sis 2 stated that for <strong>in</strong>creas<strong>in</strong>g sequences<br />
beyond a certa<strong>in</strong> critical po<strong>in</strong>t, consumers would be less<br />
favorable to buy<strong>in</strong>g <strong>the</strong> stock. The coefficient for Buy <br />
Length 2 is negative <strong>and</strong> highly significant (–0.032, p <<br />
.001), support<strong>in</strong>g this hypo<strong>the</strong>sis.<br />
Conversely, Hypo<strong>the</strong>sis 3 stated that for a decreas<strong>in</strong>g<br />
sequence <strong>of</strong> earn<strong>in</strong>gs, <strong>the</strong> longer <strong>the</strong> run, <strong>the</strong> greater preference<br />
to sell <strong>the</strong> stock. The Sell Length term <strong>in</strong> Table 1<br />
is negative <strong>and</strong> highly significant (–0.191, p < .002), show<strong>in</strong>g<br />
that as run length <strong>in</strong>creases <strong>in</strong> <strong>the</strong> negative direction<br />
(Loser), consumers prefer to sell <strong>the</strong> stock.<br />
Hypo<strong>the</strong>sis 4 stated that for a decreas<strong>in</strong>g sequence <strong>of</strong><br />
earn<strong>in</strong>gs, beyond a critical po<strong>in</strong>t, consumers would lower<br />
<strong>the</strong>ir sell<strong>in</strong>g preferences for <strong>the</strong> stock. The positive <strong>and</strong><br />
highly significant coefficient (0.011, p < .0309) for Sell <br />
Length 2 supports this hypo<strong>the</strong>sis. All <strong>the</strong> results completely<br />
contradict <strong>the</strong> null hypo<strong>the</strong>sis, Hypo<strong>the</strong>sis 01.<br />
Based on parameters <strong>of</strong> <strong>the</strong> regression, Figure 2 shows<br />
<strong>the</strong> predicted preferences as a function <strong>of</strong> trade type <strong>and</strong><br />
run length. We plot run length along <strong>the</strong> x-axis, preference<br />
along <strong>the</strong> y-axis, <strong>and</strong> heavy <strong>and</strong> light curves for <strong>the</strong> buy<br />
<strong>and</strong> sell conditions. The negative numbers on <strong>the</strong> x-axis<br />
reflect run lengths <strong>of</strong> decreas<strong>in</strong>g positive earn<strong>in</strong>gs.<br />
Note from <strong>the</strong> figure that <strong>in</strong> <strong>the</strong> buy condition as <strong>the</strong> run<br />
<strong>of</strong> earn<strong>in</strong>gs <strong>in</strong>creases gets longer, participants’ preference<br />
for <strong>the</strong> w<strong>in</strong>n<strong>in</strong>g stock first rises sharply <strong>and</strong> <strong>the</strong>n falls a little.<br />
In <strong>the</strong> sell condition, as <strong>the</strong> run <strong>of</strong> <strong>in</strong>creas<strong>in</strong>g earn<strong>in</strong>gs<br />
leng<strong>the</strong>ns participants’ preference for sell<strong>in</strong>g, <strong>the</strong> w<strong>in</strong>n<strong>in</strong>g<br />
stock first falls <strong>and</strong> <strong>the</strong>n flattens out. The reverse holds for<br />
buy<strong>in</strong>g los<strong>in</strong>g stocks (with decreas<strong>in</strong>g earn<strong>in</strong>gs) or sell<strong>in</strong>g<br />
los<strong>in</strong>g stocks. A Wald test for check<strong>in</strong>g 1 = 3 was<br />
rejected, 2 (1) = 89.8, p < .001. Similarly, <strong>the</strong> Wald test for
494 JOURNAL OF THE ACADEMY OF MARKETING SCIENCE FALL 2005<br />
2 = 4 was rejected, 2 (1) = 35.47, p < .001). This shows<br />
that <strong>the</strong> slopes are <strong>in</strong>deed different as hypo<strong>the</strong>sized.<br />
Discussion<br />
These results show that participants’preferences to buy<br />
<strong>and</strong> sell stocks differ dramatically depend<strong>in</strong>g on whe<strong>the</strong>r<br />
<strong>the</strong>se stocks are w<strong>in</strong>ners (have <strong>in</strong>creas<strong>in</strong>g earn<strong>in</strong>gs) or losers<br />
(have decreas<strong>in</strong>g earn<strong>in</strong>gs). At least up to a po<strong>in</strong>t, participants<br />
prefer to buy w<strong>in</strong>n<strong>in</strong>g stocks <strong>and</strong> sell los<strong>in</strong>g<br />
stocks. However, as <strong>the</strong> run length <strong>of</strong> <strong>the</strong> w<strong>in</strong>n<strong>in</strong>g or los<strong>in</strong>g<br />
streak cont<strong>in</strong>ues, both <strong>of</strong> <strong>the</strong>se patterns tend to flatten out<br />
or reverse. The reversal is a little sharper <strong>in</strong> <strong>the</strong> realm <strong>of</strong><br />
buy<strong>in</strong>g than that <strong>in</strong> sell<strong>in</strong>g. We did not have a hypo<strong>the</strong>sis<br />
about <strong>the</strong> asymmetry nor have any clear explanation for it.<br />
Note that run length was a between-subjects manipulation.<br />
Thus, <strong>the</strong> reversal was not a dem<strong>and</strong> artifact.<br />
We had only a weak suspicion that this reversal would<br />
take place around a length <strong>of</strong> 7 given <strong>the</strong> experimental context<br />
we chose. Fur<strong>the</strong>rmore, we believe that <strong>the</strong> turn<strong>in</strong>g<br />
po<strong>in</strong>t is due to <strong>the</strong> number <strong>of</strong> pieces <strong>of</strong> <strong>in</strong>formation, ra<strong>the</strong>r<br />
than <strong>the</strong> real time implied by <strong>the</strong>m. That is, we th<strong>in</strong>k that<br />
<strong>the</strong> turn<strong>in</strong>g po<strong>in</strong>t would have occurred around 7 for our<br />
participants, irrespective <strong>of</strong> whe<strong>the</strong>r returns were <strong>in</strong><br />
months, quarter, or years. However, we have no strong predictions<br />
about what <strong>the</strong>se turn<strong>in</strong>g po<strong>in</strong>ts would be <strong>in</strong> real<br />
situations.<br />
We did collect responses on <strong>the</strong> “fraction <strong>of</strong> a budget”<br />
participants would spend on each stock. The results did not<br />
show any patterns. We suspect that <strong>the</strong> participants misunderstood<br />
<strong>the</strong> task. So we do not present <strong>the</strong> analysis here.<br />
The results for <strong>the</strong> preference measure clearly support<br />
<strong>the</strong> advertis<strong>in</strong>g strategy <strong>of</strong> marketers <strong>of</strong> stocks or mutual<br />
funds. Consumers do buy on <strong>the</strong> basis <strong>of</strong> positive runs <strong>and</strong><br />
do sell on <strong>the</strong> basis <strong>of</strong> negative runs, at least to a po<strong>in</strong>t.<br />
Thus, such marketers should cont<strong>in</strong>ue to emphasize past<br />
performance, as long as it is not illegal.<br />
The results provide underly<strong>in</strong>g support at <strong>the</strong> <strong>in</strong>dividual<br />
consumer level for f<strong>in</strong>d<strong>in</strong>gs <strong>of</strong> overreaction or momentum<br />
<strong>in</strong>vest<strong>in</strong>g at <strong>the</strong> aggregate level as cited <strong>in</strong> <strong>the</strong> literature<br />
review (e.g., DeBondt <strong>and</strong> Thaler 1985; Chopra,<br />
Lakonishok, <strong>and</strong> Ritter 1993; Jegadeesh <strong>and</strong> Titman 1993;<br />
La Porta et al. 1994).<br />
The results suggest where <strong>the</strong> possible turn<strong>in</strong>g po<strong>in</strong>ts<br />
may fall <strong>in</strong> our experiments. For <strong>the</strong> buy side, it is around<br />
7.4 (0.474/2 0.032), <strong>and</strong> for <strong>the</strong> sell side, it is –8.7<br />
(–0.191/2 0.011).<br />
Nei<strong>the</strong>r experience nor knowledge seems to mediate<br />
<strong>the</strong>se patterns. Thus, <strong>the</strong> hot h<strong>and</strong> bias seems to be a deep<br />
endur<strong>in</strong>g fallacy <strong>in</strong> stock trad<strong>in</strong>g. This result seems consistent<br />
with casual observation <strong>of</strong> <strong>the</strong> stock market. At <strong>the</strong><br />
height <strong>of</strong> <strong>the</strong> Internet boom <strong>in</strong> 2000, not only amateurs<br />
were try<strong>in</strong>g to make a quick pr<strong>of</strong>it (many day traders), but<br />
even experts consistently made “buy” recommendations.<br />
They were all caught up <strong>in</strong> <strong>the</strong> euphoria <strong>of</strong> an ever<strong>in</strong>creas<strong>in</strong>g<br />
stock market. Study 2 explores <strong>the</strong> consumer<br />
choice process fur<strong>the</strong>r by check<strong>in</strong>g if <strong>the</strong> affective process<br />
<strong>of</strong> mood can delay <strong>the</strong> onset <strong>of</strong> <strong>the</strong> gambler’s fallacy. Study<br />
2 also exam<strong>in</strong>es process measures that allow us a deeper<br />
<strong>in</strong>sight <strong>in</strong>to how consumers make <strong>the</strong> switch between <strong>the</strong><br />
hot h<strong>and</strong> <strong>and</strong> <strong>the</strong> gambler’s fallacy.<br />
STUDY 2: ROLE OF MOOD IN TRADING<br />
WINNERS AND LOSERS<br />
Consumer researchers have shown that both cognitive<br />
<strong>and</strong> affective processes affect decision mak<strong>in</strong>g. Is <strong>the</strong> pattern<br />
<strong>of</strong> chas<strong>in</strong>g w<strong>in</strong>ners <strong>and</strong> dump<strong>in</strong>g losers moderated by<br />
affective factors such as emotions <strong>and</strong> mood? The issue is<br />
particularly relevant, because bull markets are <strong>of</strong>ten associated<br />
with euphoria (e.g., <strong>the</strong> Internet boom), while bear<br />
markets are <strong>of</strong>ten associated with gloom (e.g., <strong>the</strong> current<br />
situation). This study looks at how optimistic (euphoric)<br />
or pessimistic (dysphoric) moods affect <strong>the</strong> biases <strong>in</strong><br />
Study 1. The issue is important because we th<strong>in</strong>k that<br />
mood could also affect whe<strong>the</strong>r an <strong>in</strong>dividual adopts <strong>the</strong><br />
hot h<strong>and</strong> or <strong>the</strong> gambler’s fallacy or when that <strong>in</strong>dividual<br />
switches from one to <strong>the</strong> o<strong>the</strong>r. At <strong>the</strong> height <strong>of</strong> <strong>the</strong> Internet<br />
boom, euphoria raged as <strong>in</strong>vestors raved about <strong>the</strong>ir success<br />
<strong>in</strong> stock pick<strong>in</strong>g. In recent years, dysphoria is common<br />
as <strong>in</strong>vestors lick <strong>the</strong>ir wounds <strong>and</strong> shun stocks.<br />
We next present <strong>the</strong> <strong>the</strong>ory, experiment, results, <strong>and</strong><br />
discussion <strong>of</strong> Study 2.<br />
Does Mood Affect Investor Preferences?<br />
The effect <strong>of</strong> mood on <strong>in</strong>formation process<strong>in</strong>g is well<br />
documented (Isen 1989). Mood reflects a temporary emotional<br />
state that can affect our judgment. If we are <strong>in</strong> a positive<br />
mood, we are more likely to recall positive <strong>in</strong>formation,<br />
<strong>and</strong> if we are <strong>in</strong> a negative mood, we are more likely to<br />
recall negative <strong>in</strong>formation. Affective states are stored as a<br />
node <strong>in</strong> memory that is l<strong>in</strong>ked to <strong>the</strong> <strong>in</strong>formation processed<br />
with it (Isen 1989). Also, we process <strong>in</strong>formation <strong>in</strong> more<br />
detail when mood is more <strong>in</strong>tense.<br />
We <strong>the</strong>refore contend that a positive mood about <strong>the</strong><br />
stock market will accentuate <strong>the</strong> effect <strong>of</strong> <strong>the</strong> hot h<strong>and</strong> bias<br />
<strong>in</strong> buy<strong>in</strong>g stocks. Specifically, consumers <strong>in</strong> a euphoric<br />
mood will have a greater preference for buy<strong>in</strong>g a stock that<br />
has an <strong>in</strong>creas<strong>in</strong>g positive run length <strong>of</strong> earn<strong>in</strong>gs than consumers<br />
<strong>in</strong> a dysphoric mood. Thus, we hypo<strong>the</strong>size <strong>the</strong> follow<strong>in</strong>g<br />
for a positive earn<strong>in</strong>gs run:<br />
Hypo<strong>the</strong>sis A5: Consumers <strong>in</strong> an optimistic mood will<br />
have a greater preference to buy <strong>the</strong> stock with a positive<br />
earn<strong>in</strong>gs run than those who are <strong>in</strong> a pessimistic<br />
mood.
Mood also affects <strong>the</strong> choice between sell<strong>in</strong>g w<strong>in</strong>ners<br />
versus sell<strong>in</strong>g losers. How would consumers who feel optimistic<br />
about <strong>the</strong> stock market choose between sell<strong>in</strong>g a<br />
stock that has a sequence <strong>of</strong> positive earn<strong>in</strong>gs versus one<br />
that has a sequence <strong>of</strong> negative earn<strong>in</strong>gs? In an optimistic<br />
scenario, a stock that has a negative run may be seen as a<br />
bad stock, <strong>and</strong> thus consumers may want to get rid <strong>of</strong> it.<br />
However, as <strong>the</strong> negative run length <strong>in</strong>creases, <strong>the</strong>re will be<br />
a turnaround <strong>in</strong> preference as people feel like hold<strong>in</strong>g on to<br />
a stock because it may turn around.<br />
This effect will be more pronounced <strong>in</strong> a pessimistic<br />
scenario. In a market that has a gloomy outlook, stocks that<br />
have a positive run will be seen as more valuable than<br />
stocks that have a negative outlook. Consumers will <strong>the</strong>refore<br />
prefer to dump losers. Thus,<br />
Hypo<strong>the</strong>sis A6: Consumers <strong>in</strong> a pessimistic mood will<br />
have a greater preference to sell <strong>the</strong> stock with a negative<br />
earn<strong>in</strong>gs run than those who are subject to an<br />
optimistic mood.<br />
We also postulate that <strong>the</strong> hot h<strong>and</strong> bias cannot cont<strong>in</strong>ue<br />
to grow <strong>in</strong>def<strong>in</strong>itely. At some stage it will be weakened by<br />
<strong>the</strong> gambler’s fallacy. Mood <strong>in</strong>teracts with <strong>the</strong> onset <strong>of</strong> <strong>the</strong><br />
gambler’s fallacy. Specifically, consumers <strong>in</strong> an optimistic<br />
mood will tend to be more prone to <strong>the</strong> hot h<strong>and</strong> fallacy<br />
than to <strong>the</strong> gambler’s fallacy at every run length. In contrast,<br />
for consumers <strong>in</strong> a pessimistic mood, <strong>the</strong> onset <strong>of</strong> <strong>the</strong><br />
gambler’s fallacy will tend to be more prom<strong>in</strong>ent at every<br />
run length. This <strong>in</strong>teraction <strong>of</strong> mood with <strong>the</strong> hot h<strong>and</strong> <strong>and</strong><br />
<strong>the</strong> gambler’s fallacy will affect consumers’ preference to<br />
buy <strong>and</strong> sell stocks.<br />
When consumers who feel optimistic about <strong>the</strong> prospects<br />
<strong>of</strong> <strong>the</strong> stock market face a stock with a positive earn<strong>in</strong>gs<br />
sequence, <strong>the</strong>y are likely to conclude that <strong>the</strong> trend<br />
will cont<strong>in</strong>ue. Conversely, when consumers who feel pessimistic<br />
about <strong>the</strong> prospects <strong>of</strong> <strong>the</strong> stock market face a<br />
stock with a positive earn<strong>in</strong>gs sequence, <strong>the</strong>y are likely to<br />
conclude that <strong>the</strong> trend will turn around. The belief that <strong>the</strong><br />
sequence will turn around will come at a later po<strong>in</strong>t when<br />
<strong>the</strong>y are optimistic than when <strong>the</strong>y are pessimistic. This is<br />
because <strong>the</strong> gambler’s fallacy is more pronounced when<br />
consumers are <strong>in</strong> a pessimistic mood. As <strong>the</strong> sequence <strong>of</strong><br />
<strong>in</strong>creas<strong>in</strong>g earn<strong>in</strong>gs rises, skepticism sets <strong>in</strong> <strong>and</strong> consumers<br />
feel that a turn<strong>in</strong>g po<strong>in</strong>t is around <strong>the</strong> corner. Hence,<br />
Hypo<strong>the</strong>sis A7: For consumers <strong>in</strong> an optimistic mood,<br />
<strong>the</strong> turn<strong>in</strong>g po<strong>in</strong>t <strong>in</strong> preferences for buy<strong>in</strong>g a w<strong>in</strong>n<strong>in</strong>g<br />
stock occurs later than for consumers <strong>in</strong> a pessimistic<br />
mood.<br />
Consumers who want to sell <strong>and</strong> are <strong>in</strong> an optimistic<br />
mood will expect a turnaround for short sequences <strong>of</strong> negative<br />
runs <strong>of</strong> earn<strong>in</strong>gs, <strong>and</strong> thus <strong>the</strong>ir preferences to sell <strong>the</strong><br />
los<strong>in</strong>g stock will be lower than for consumers <strong>in</strong> a pessi-<br />
Johnson, Tellis / HEURISTICS AND BIASES 495<br />
FIGURE 3<br />
Observed Preferences Optimistic<br />
Versus Pessimistic Buy<strong>in</strong>g<br />
5<br />
4<br />
3<br />
2<br />
1<br />
-11 -9 -7 -5 -3<br />
0<br />
-1 1 3 5 7 9 11<br />
FIGURE 4<br />
Observed Preferences Optimistic<br />
Versus Pessimistic Sell<strong>in</strong>g<br />
5<br />
4<br />
3<br />
2<br />
1<br />
-11 -9 -7 -5 -3<br />
0<br />
-1 1 3 5 7 9 11<br />
OPTBUY<br />
PESBUY<br />
OPTSELL<br />
PESSELL<br />
mistic mood. This is because consumers <strong>in</strong> a pessimistic<br />
mood are likely to th<strong>in</strong>k that negative runs will cont<strong>in</strong>ue.<br />
Thus, we see that when people have to sell <strong>and</strong> are faced<br />
with a choice <strong>of</strong> negative or positive runs, optimism <strong>and</strong><br />
pessimism will cause <strong>the</strong> gambler’s fallacy to kick <strong>in</strong> at<br />
different po<strong>in</strong>ts <strong>in</strong> time as run length <strong>in</strong>creases. Thus,<br />
Hypo<strong>the</strong>sis A8: For consumers <strong>in</strong> an optimistic mood,<br />
<strong>the</strong> turn<strong>in</strong>g po<strong>in</strong>t <strong>of</strong> preferences for sell<strong>in</strong>g a los<strong>in</strong>g<br />
stock occurs earlier than for consumers <strong>in</strong> a pessimistic<br />
mood.<br />
The efficient market hypo<strong>the</strong>sis ignores <strong>the</strong> role <strong>of</strong><br />
mood <strong>in</strong> predict<strong>in</strong>g preferences for buy<strong>in</strong>g or sell<strong>in</strong>g.<br />
Therefore, consumers should rema<strong>in</strong> unaffected by <strong>the</strong> optimistic<br />
<strong>and</strong> pessimistic state <strong>the</strong>y are <strong>in</strong>. Thus, we propose<br />
<strong>the</strong> follow<strong>in</strong>g null hypo<strong>the</strong>sis:<br />
Hypo<strong>the</strong>sis 02: Consumers’propensity to buy or sell will<br />
rema<strong>in</strong> unaffected by <strong>the</strong>ir mood.
496 JOURNAL OF THE ACADEMY OF MARKETING SCIENCE FALL 2005<br />
Experimental Validation<br />
This experiment is similar to <strong>the</strong> previous one <strong>in</strong> scope,<br />
with <strong>the</strong> major difference be<strong>in</strong>g that we now manipulate<br />
participants’ mood <strong>and</strong> collect free responses for <strong>the</strong>ir<br />
choices. The pessimistic-mood scenario was created by<br />
describ<strong>in</strong>g <strong>the</strong> possible drag <strong>the</strong> U.S. war <strong>in</strong> Iraq would<br />
have on <strong>the</strong> economy, while <strong>the</strong> optimistic-mood scenario<br />
was created by describ<strong>in</strong>g <strong>the</strong> benefits <strong>of</strong> f<strong>in</strong>d<strong>in</strong>g stocks<br />
that are undervalued <strong>and</strong> may present good prospects <strong>of</strong><br />
future growth.<br />
Design<br />
This study used a 3 2 2 full factorial design, with run<br />
length (3, 7, 11), trade type (buy vs. sell), <strong>and</strong> mood<br />
(euphoria <strong>and</strong> dysphoria) all as between-subjects factors.<br />
The sample conta<strong>in</strong>ed 91 undergraduate <strong>and</strong> graduate<br />
bus<strong>in</strong>ess majors from a large university.<br />
Results<br />
To test <strong>the</strong> hypo<strong>the</strong>ses, we plotted <strong>the</strong> observed means<br />
across <strong>the</strong> different conditions. These plots are shown <strong>in</strong><br />
Figures 3 <strong>and</strong> 4.The figures plot preferences for <strong>the</strong> w<strong>in</strong>n<strong>in</strong>g<br />
stock on <strong>the</strong> y-axis <strong>and</strong> run length on <strong>the</strong> x-axis. We<br />
plot separate graphs for <strong>the</strong> buy <strong>and</strong> sell conditions, with<br />
separate curves for <strong>the</strong> pessimistic <strong>and</strong> optimistic conditions<br />
with<strong>in</strong> each.<br />
Hypo<strong>the</strong>sis 5 states that consumers <strong>in</strong> an optimistic<br />
mood will have a greater propensity to buy <strong>the</strong> stock with a<br />
w<strong>in</strong>n<strong>in</strong>g run than consumers <strong>in</strong> a pessimistic mood. A test<br />
for <strong>the</strong> difference <strong>of</strong> mean preferences <strong>of</strong> participants <strong>in</strong><br />
<strong>the</strong> optimistic condition differed significantly from <strong>the</strong><br />
mean preferences <strong>of</strong> participants <strong>in</strong> <strong>the</strong> pessimistic at run<br />
length 7 (p < .05) (Figure 3). This result partially supports<br />
Hypo<strong>the</strong>sis 5.<br />
Hypo<strong>the</strong>sis 6 states that consumers <strong>in</strong> a pessimistic<br />
mood will have a greater propensity to sell <strong>the</strong> los<strong>in</strong>g stock<br />
than a consumer <strong>in</strong> an optimistic mood. A test for <strong>the</strong> difference<br />
<strong>of</strong> mean preferences <strong>of</strong> participants <strong>in</strong> <strong>the</strong> optimistic<br />
condition versus participants <strong>in</strong> <strong>the</strong> pessimistic condition<br />
was not significant (Figure 4). Thus, Hypo<strong>the</strong>sis 6<br />
was not supported.<br />
Hypo<strong>the</strong>sis 7 states that for consumers who are buy<strong>in</strong>g,<br />
<strong>the</strong> turn<strong>in</strong>g po<strong>in</strong>t for preferences <strong>of</strong> stocks with positive<br />
runs will come later for consumers <strong>in</strong> <strong>the</strong> optimistic condition<br />
than for those <strong>in</strong> <strong>the</strong> pessimistic condition. The curves<br />
<strong>in</strong> Figure 3 show that <strong>the</strong> peak <strong>of</strong> <strong>the</strong> optimistic buy is<br />
<strong>in</strong>deed higher than <strong>the</strong> peak <strong>of</strong> <strong>the</strong> pessimistic buy, thus<br />
support<strong>in</strong>g Hypo<strong>the</strong>sis 7.<br />
Hypo<strong>the</strong>sis 8 states that for consumers who are sell<strong>in</strong>g,<br />
<strong>the</strong> turn<strong>in</strong>g po<strong>in</strong>t for preferences for stocks with negative<br />
runs will come earlier for those <strong>in</strong> <strong>the</strong> optimistic condition<br />
than for those <strong>in</strong> <strong>the</strong> pessimistic condition. We could not<br />
TABLE 2<br />
Classification <strong>of</strong> Reasons:<br />
Buy Condition (<strong>in</strong> percentages)<br />
Reason 3 7 11<br />
Hot h<strong>and</strong> 64 67 67<br />
Gambler’s fallacy 14 7 0<br />
Rational 7 0 20<br />
Blank 14 13 13<br />
O<strong>the</strong>rs 0 13 0<br />
Total 100 100 100<br />
TABLE 3<br />
Classification <strong>of</strong> Reasons:<br />
Sell Condition (<strong>in</strong> percentages)<br />
Reason 3 7 11<br />
Hot h<strong>and</strong> 39 23 71<br />
Gambler’s fallacy 17 38 0<br />
Rational 22 8 12<br />
Blank 11 15 18<br />
O<strong>the</strong>rs 11 15 0<br />
Total 100 100 100<br />
detect any significant difference across <strong>the</strong> mood conditions<br />
for <strong>the</strong> sell condition (Figure 4). Thus, hypo<strong>the</strong>sis 8<br />
was not supported.<br />
Manipulation Check<br />
We tested <strong>the</strong> strength <strong>of</strong> our mood manipulation. This<br />
was measured on a 10-po<strong>in</strong>t scale, where 10 was coded as<br />
optimistic <strong>and</strong> 1 was coded as pessimistic. The mean measure<br />
for optimism for participants <strong>in</strong> <strong>the</strong> optimistic condition<br />
was 5.98, <strong>and</strong> <strong>the</strong> mean for those <strong>in</strong> <strong>the</strong> pessimistic<br />
condition was 5.83. This is not significant, show<strong>in</strong>g that<br />
<strong>the</strong> mood manipulation was not strong enough.<br />
Process Measures<br />
To <strong>in</strong>vestigate <strong>the</strong> mental process that underlies <strong>the</strong>se<br />
preferences <strong>and</strong> how consumers switch between <strong>the</strong> hot<br />
h<strong>and</strong> <strong>and</strong> <strong>the</strong> gambler’s fallacy, we asked participants to<br />
list <strong>the</strong>ir reasons for <strong>the</strong>ir choices. For this analysis, we<br />
collapsed <strong>the</strong> responses across mood conditions. The<br />
responses were coded by two <strong>in</strong>dependent judges <strong>in</strong>to five<br />
categories: hot h<strong>and</strong>, gambler’s fallacy, rational, blank/<br />
cannot <strong>in</strong>terpret, <strong>and</strong> o<strong>the</strong>rs. Differences were resolved<br />
through discussion. The <strong>in</strong>tercoder reliability was .98.<br />
Table 2 shows <strong>the</strong> proportion <strong>of</strong> people who fell <strong>in</strong>to <strong>the</strong><br />
various categories across <strong>the</strong> buy <strong>and</strong> sell conditions for<br />
<strong>the</strong> three run lengths.
Table 2 shows that for <strong>the</strong> buy condition, <strong>the</strong> proportion<br />
<strong>of</strong> participants who are subject to <strong>the</strong> hot h<strong>and</strong> fallacy<br />
rema<strong>in</strong>s almost constant across run lengths at a relatively<br />
high level. The proportion <strong>of</strong> participants who fall for <strong>the</strong><br />
gambler’s fallacy falls as run length <strong>in</strong>creases. This shows<br />
that <strong>the</strong> presence <strong>of</strong> <strong>the</strong> hot h<strong>and</strong> fallacy dom<strong>in</strong>ates <strong>the</strong><br />
gambler’s fallacy for all run lengths <strong>in</strong> <strong>the</strong> buy condition.<br />
Table 3 shows that for <strong>the</strong> sell condition, <strong>the</strong> proportion<br />
<strong>of</strong> participants who are subject to <strong>the</strong> hot h<strong>and</strong> fallacy first<br />
decreases <strong>and</strong> <strong>the</strong>n turns around. The gambler’s fallacy, on<br />
<strong>the</strong> contrary, first <strong>in</strong>creases <strong>and</strong> <strong>the</strong>n decreases dramatically.<br />
This shows that for short run lengths, <strong>the</strong> hot h<strong>and</strong><br />
fallacy dom<strong>in</strong>ates <strong>the</strong> gambler’s fallacy. This pattern flips<br />
for moderate run lengths as <strong>the</strong> gambler’s fallacy ga<strong>in</strong>s<br />
ascendancy. F<strong>in</strong>ally, for longer run lengths, this flips<br />
aga<strong>in</strong>, with <strong>the</strong> hot h<strong>and</strong> dom<strong>in</strong>at<strong>in</strong>g aga<strong>in</strong>. This shows<br />
why <strong>the</strong> proportion <strong>of</strong> people who chose to sell losers<br />
dropped as run length <strong>in</strong>creased <strong>and</strong> <strong>the</strong>n rose as run length<br />
<strong>in</strong>creased fur<strong>the</strong>r.<br />
Overall, <strong>the</strong>se results show that <strong>the</strong> hot h<strong>and</strong> dom<strong>in</strong>ates<br />
<strong>in</strong> <strong>the</strong> buy <strong>and</strong> sell conditions for most run lengths. These<br />
results imply that consumers <strong>in</strong> general tend to buy w<strong>in</strong>ners<br />
<strong>and</strong> sell losers.<br />
Discussion<br />
The results <strong>of</strong> our second experiment partially support<br />
our hypo<strong>the</strong>ses on mood as a moderator <strong>of</strong> <strong>the</strong> biases,<br />
especially <strong>in</strong> <strong>the</strong> buy condition. We found support for <strong>the</strong><br />
hypo<strong>the</strong>sis that <strong>the</strong> onset <strong>of</strong> preference reversals because<br />
<strong>of</strong> <strong>the</strong> gambler’s fallacy came much later when <strong>the</strong>y were<br />
optimistic versus when <strong>the</strong>y were pessimistic (Figures 3<br />
<strong>and</strong> 4). We did not get stronger support (e.g., <strong>in</strong> <strong>the</strong> sell<br />
condition), probably because our mood manipulation was<br />
not strong enough.<br />
Consistent with Study 1, we found people cont<strong>in</strong>ued to<br />
chase w<strong>in</strong>ners <strong>in</strong> <strong>the</strong> buy condition <strong>and</strong> dump losers <strong>in</strong> <strong>the</strong><br />
sell condition. Thus, <strong>the</strong> tendency to buy w<strong>in</strong>ners <strong>and</strong> sell<br />
losers seems to be quite strong <strong>and</strong> robust.<br />
Perhaps <strong>the</strong> most useful aspect <strong>of</strong> this study is <strong>the</strong> look<br />
at process measures. The study shows how participants are<br />
more likely to switch between <strong>the</strong> biases as run length<br />
changed. These results show that for <strong>the</strong> buy condition, <strong>the</strong><br />
hot h<strong>and</strong> rema<strong>in</strong>s a powerful bias across run length, while<br />
for <strong>the</strong> sell condition, <strong>the</strong> hot h<strong>and</strong> fallacy is mitigated by<br />
<strong>the</strong> onset <strong>of</strong> <strong>the</strong> gamblers’ fallacy.<br />
STUDY 3: HYPE AT THE MARKET LEVEL<br />
Study 3 determ<strong>in</strong>es whe<strong>the</strong>r biases <strong>of</strong> <strong>in</strong>dividual consumers<br />
identified <strong>in</strong> <strong>the</strong> above experiments lead to aggregate<br />
effects that are visible or can be validated at <strong>the</strong> market<br />
level. Consistent with our experiments, <strong>the</strong> sequence <strong>of</strong><br />
<strong>in</strong>formation we choose here are <strong>the</strong> quarterly earn<strong>in</strong>gs<br />
Johnson, Tellis / HEURISTICS AND BIASES 497<br />
announcements <strong>of</strong> firms. In addition to be<strong>in</strong>g closely<br />
l<strong>in</strong>ked to our experimental design, no research <strong>in</strong> f<strong>in</strong>ance<br />
has exam<strong>in</strong>ed aggregate market levels’ responses to<br />
sequences <strong>of</strong> <strong>in</strong>formation about quarterly earn<strong>in</strong>gs. The<br />
closest study is by Swam<strong>in</strong>athan <strong>and</strong> Lee (2000), who<br />
showed that stock prices overreact to earn<strong>in</strong>gs news. However,<br />
<strong>the</strong>y model this effect as a function <strong>of</strong> earn<strong>in</strong>gs surprises<br />
<strong>and</strong> not <strong>of</strong> sequences <strong>in</strong>formation, for which <strong>the</strong>ory<br />
<strong>and</strong> our experiments show systematic biases. If a sequence<br />
<strong>of</strong> <strong>in</strong>formation leads to trend projection, <strong>the</strong>n stocks will<br />
be overvalued as <strong>the</strong> sequence <strong>of</strong> positive earn<strong>in</strong>gs<br />
<strong>in</strong>creases. We can detect this overvaluation by <strong>the</strong> drop <strong>in</strong><br />
valuation when <strong>the</strong> sequence is broken. Conversely, stocks<br />
will be undervalued as <strong>the</strong> sequence <strong>of</strong> negative earn<strong>in</strong>gs<br />
<strong>in</strong>creases, <strong>and</strong> this undervaluation can be detected by <strong>the</strong><br />
rise <strong>in</strong> valuation when <strong>the</strong> sequence breaks.<br />
Note, this study does not purport to determ<strong>in</strong>e <strong>the</strong><br />
f<strong>in</strong>ancial efficiency <strong>of</strong> <strong>the</strong> market or <strong>the</strong> ability <strong>of</strong> consumers<br />
to pr<strong>of</strong>it from it. Such a goal would require <strong>in</strong> addition a<br />
means to predict <strong>the</strong> turn<strong>in</strong>g po<strong>in</strong>t <strong>in</strong> a run <strong>of</strong> earn<strong>in</strong>gs.<br />
Such a predictive model is beyond <strong>the</strong> scope <strong>of</strong> this study.<br />
Ra<strong>the</strong>r, <strong>the</strong> goal <strong>of</strong> <strong>the</strong> study is to show if biases <strong>of</strong> <strong>in</strong>dividual<br />
consumers due to sequences <strong>of</strong> <strong>in</strong>formation visible <strong>in</strong><br />
our experiments can be validated at <strong>the</strong> aggregate market<br />
level. Fur<strong>the</strong>rmore, <strong>the</strong> market study basically tests <strong>the</strong><br />
market-level implication <strong>of</strong> <strong>the</strong> hot h<strong>and</strong> phenomena that<br />
we expla<strong>in</strong>ed <strong>in</strong> Study 1. We first present our hypo<strong>the</strong>ses,<br />
<strong>the</strong>n <strong>the</strong> method <strong>of</strong> estimation, <strong>and</strong> f<strong>in</strong>ally <strong>the</strong> results.<br />
Hypo<strong>the</strong>ses: <strong>Stock</strong> Returns<br />
Conditional on Earn<strong>in</strong>gs <strong>Run</strong>s<br />
Recall that <strong>the</strong> efficient market hypo<strong>the</strong>sis implies that<br />
prices immediately <strong>in</strong>corporate all available <strong>in</strong>formation.<br />
So runs <strong>in</strong> past earn<strong>in</strong>gs <strong>of</strong> a stock would be unrelated to<br />
current or future prices <strong>of</strong> <strong>the</strong> stock. One <strong>of</strong> <strong>the</strong> key pieces<br />
<strong>of</strong> <strong>in</strong>formation analysts normally track is <strong>the</strong> quarterly<br />
earn<strong>in</strong>gs <strong>of</strong> different firms. If prices at any time fully<br />
reflect past <strong>in</strong>formation <strong>and</strong> future expectations, <strong>the</strong> current<br />
returns <strong>of</strong> a stock would not be related to various runs<br />
<strong>of</strong> its past earn<strong>in</strong>gs.<br />
Hence, <strong>the</strong> null hypo<strong>the</strong>sis, based on <strong>the</strong> efficient market<br />
hypo<strong>the</strong>sis, is as follows:<br />
Hypo<strong>the</strong>sis 03: Market returns <strong>of</strong> a stock are not conditional<br />
on <strong>the</strong> positive or negative earn<strong>in</strong>gs run <strong>of</strong> that<br />
stock.<br />
However, our <strong>the</strong>ory <strong>and</strong> f<strong>in</strong>d<strong>in</strong>gs show that <strong>in</strong>dividuals<br />
are not able to correctly forecast <strong>the</strong> stochastic process <strong>of</strong><br />
earn<strong>in</strong>gs. They are subject to hype <strong>and</strong> systematically<br />
overvalue or undervalue past trends. Note that our earlier<br />
<strong>the</strong>ory shows that <strong>the</strong>y first fall victim <strong>of</strong> <strong>the</strong> hot h<strong>and</strong> <strong>and</strong><br />
<strong>the</strong>n <strong>the</strong> gambler’s fallacy. Chance itself could confirm<br />
<strong>the</strong>ir forecasts by provid<strong>in</strong>g a run <strong>in</strong> <strong>the</strong> same direction <strong>and</strong>
498 JOURNAL OF THE ACADEMY OF MARKETING SCIENCE FALL 2005<br />
<strong>in</strong>creas<strong>in</strong>g <strong>the</strong>ir confidence <strong>in</strong> <strong>the</strong> stock. In fact, based on<br />
Fama <strong>and</strong> French (2000), as <strong>the</strong> positive or negative run <strong>of</strong><br />
a stock’s earn<strong>in</strong>gs leng<strong>the</strong>ns, <strong>the</strong> conditional probability <strong>of</strong><br />
<strong>the</strong> cont<strong>in</strong>uation <strong>of</strong> <strong>the</strong> run decreases. We found that people<br />
buy w<strong>in</strong>ners ra<strong>the</strong>r than losers. Also, people prefer to<br />
sell losers ra<strong>the</strong>r than w<strong>in</strong>ners. Thus, any stock that shows<br />
a run <strong>in</strong> earn<strong>in</strong>gs is likely to rise because those who do not<br />
have <strong>the</strong> stock want to buy it, <strong>and</strong> those who already own it<br />
are reluctant to sell. Once <strong>the</strong> run breaks, consumers realize<br />
<strong>the</strong>ir forecast<strong>in</strong>g errors <strong>and</strong> readjust <strong>the</strong>ir expectations.<br />
The extent <strong>of</strong> this readjustment depends on <strong>the</strong> length <strong>of</strong><br />
<strong>the</strong> run—<strong>the</strong> longer <strong>the</strong> run, <strong>the</strong> greater <strong>the</strong> effect <strong>of</strong> hype<br />
because <strong>of</strong> <strong>the</strong> hot h<strong>and</strong> fallacy, <strong>and</strong> <strong>the</strong> greater <strong>the</strong> adjustment,<br />
although as <strong>the</strong> run extends, <strong>the</strong> onset <strong>of</strong> <strong>the</strong> gambler’s<br />
fallacy mitigates <strong>the</strong> biases for both buyers <strong>and</strong><br />
sellers, thus reduc<strong>in</strong>g <strong>the</strong> size <strong>of</strong> <strong>the</strong> fall. Hence, we<br />
hypo<strong>the</strong>size <strong>the</strong> follow<strong>in</strong>g for a positive run <strong>of</strong> earn<strong>in</strong>gs:<br />
Hypo<strong>the</strong>sis A9: The longer a positive earn<strong>in</strong>gs run <strong>of</strong> a<br />
stock, <strong>the</strong> greater <strong>the</strong> negative returns after a break <strong>in</strong><br />
earn<strong>in</strong>gs, but after some critical run length, <strong>the</strong> negative<br />
returns become smaller.<br />
Conversely, <strong>the</strong> same heuristic affects people fac<strong>in</strong>g a<br />
negative run <strong>of</strong> earn<strong>in</strong>gs. As negative <strong>in</strong>formation cont<strong>in</strong>ues<br />
to accumulate over successive quarters, consumers are<br />
apt to extrapolate fur<strong>the</strong>r decl<strong>in</strong>es <strong>in</strong>to <strong>the</strong> future. The<br />
heuristics <strong>the</strong>y use may result <strong>in</strong> biases that cause <strong>the</strong>m to<br />
project much lower earn<strong>in</strong>gs than <strong>the</strong> underly<strong>in</strong>g stochastic<br />
process would suggest. People who already possess <strong>the</strong><br />
stock would like to sell <strong>the</strong>ir losers while f<strong>in</strong>d<strong>in</strong>g few buyers<br />
for it, <strong>and</strong> thus <strong>the</strong> price falls. This effect depends on <strong>the</strong><br />
length <strong>of</strong> <strong>the</strong> run. As <strong>the</strong> run leng<strong>the</strong>ns, prices tend to fall<br />
more until <strong>the</strong> onset <strong>of</strong> <strong>the</strong> gambler’s fallacy mitigates <strong>the</strong><br />
effects on both buyers <strong>and</strong> sellers, reduc<strong>in</strong>g <strong>the</strong> size <strong>of</strong> <strong>the</strong><br />
rise. Hence, we hypo<strong>the</strong>size <strong>the</strong> follow<strong>in</strong>g:<br />
Hypo<strong>the</strong>sis A10: The longer a negative earn<strong>in</strong>gs run <strong>of</strong> a<br />
stock, <strong>the</strong> greater <strong>the</strong> positive return after a break <strong>in</strong><br />
earn<strong>in</strong>gs, but after some critical run length, <strong>the</strong> positive<br />
returns become smaller.<br />
Method<br />
The empirical method seeks to determ<strong>in</strong>e whe<strong>the</strong>r<br />
returns <strong>of</strong> a stock, beyond those that are normal for <strong>the</strong><br />
market, are related to a positive or negative run <strong>of</strong> past<br />
earn<strong>in</strong>gs. This subsection describes <strong>the</strong> method for comput<strong>in</strong>g<br />
abnormal returns <strong>and</strong> data preparation. The term<br />
abnormal returns refers to returns that are above or below<br />
what is normal for <strong>the</strong> market. It is a measure <strong>of</strong> <strong>the</strong> impact<br />
<strong>of</strong> an event on <strong>the</strong> value <strong>of</strong> <strong>the</strong> stock. In our case, <strong>the</strong> event<br />
is <strong>the</strong> reversal <strong>of</strong> quarterly earn<strong>in</strong>gs <strong>of</strong> a firm. To establish<br />
abnormal returns, we need to arrive at what normal returns<br />
are. We def<strong>in</strong>e normal monthly returns, R it, measured at<br />
<strong>the</strong> month’s end, for firm, i, as a change <strong>in</strong> price between<br />
month t <strong>and</strong> t–1plus cash dividends D it earned dur<strong>in</strong>g <strong>the</strong><br />
month, t. Thus,<br />
R it = (P it – P it – 1 + D it ) / P it – 1 ) (2)<br />
Let be an <strong>in</strong>dex for time <strong>in</strong> quarters, while t is time <strong>in</strong><br />
months. Then, by def<strong>in</strong>ition,<br />
= t + (t +1) + (t + 2)<br />
So quarterly returns can be def<strong>in</strong>ed as follows:<br />
R R<br />
(3)<br />
2 (4)<br />
iit t 0<br />
Classical f<strong>in</strong>ance <strong>the</strong>ory holds that <strong>the</strong> return to a firm’s<br />
stock is determ<strong>in</strong>ed by <strong>the</strong> unique performance <strong>of</strong> each<br />
stock (unsystematic risk) <strong>and</strong> <strong>the</strong> performance <strong>of</strong> <strong>the</strong> general<br />
market or o<strong>the</strong>r environmental conditions (systematic<br />
risk). The effect <strong>of</strong> <strong>the</strong> latter portion can be captured by<br />
regress<strong>in</strong>g a stock’s return on <strong>the</strong> return for <strong>the</strong> whole<br />
stock market. Thus,<br />
where<br />
R it = i + i R mt + it ,<br />
R mt = market rate <strong>of</strong> return, that is, <strong>the</strong> average return <strong>of</strong><br />
<strong>the</strong> S&P 500 at month t<br />
i = <strong>the</strong> time <strong>in</strong>variant idiosyncratic effect <strong>of</strong> firm i on its<br />
own return<br />
i = effect <strong>of</strong> <strong>the</strong> entire market on <strong>the</strong> return <strong>of</strong> firm i<br />
it = errors with E[ it ] = 0 <strong>and</strong> Var[ it ] = 2<br />
<br />
The expected value <strong>of</strong> equation (5) gives <strong>the</strong> normal return,<br />
E[R it ], to stock i for period t, given <strong>the</strong> performance <strong>of</strong><br />
<strong>the</strong> market as a whole. The abnormal return, AR it ,<strong>of</strong>a<br />
stock is its actual return m<strong>in</strong>us <strong>the</strong> normal return over <strong>the</strong><br />
same period. Thus,<br />
(5)<br />
AR it = R it – E[R it ] (6)<br />
To relate this term to earn<strong>in</strong>gs that are released quarterly,<br />
we def<strong>in</strong>e cumulative abnormal returns for firm i <strong>in</strong><br />
quarter as follows:<br />
2 (7)<br />
iit t 0<br />
AR AR<br />
We use event analysis to test our hypo<strong>the</strong>ses (Fama,<br />
Fisher, Jensen, <strong>and</strong> Roll 1969). This technique has been<br />
widely used <strong>in</strong> f<strong>in</strong>ance <strong>and</strong> <strong>in</strong>creas<strong>in</strong>gly used <strong>in</strong> market<strong>in</strong>g<br />
(Aaker <strong>and</strong> Jacobson 1994; Agarwal <strong>and</strong> Kamakura 1995;
Lane <strong>and</strong> Jacobson 1995). The method allows us to determ<strong>in</strong>e<br />
<strong>the</strong> abnormal returns for any <strong>in</strong>formation that arrives<br />
<strong>in</strong> <strong>the</strong> stock market. In our case, <strong>the</strong> event is a reversal <strong>in</strong><br />
earn<strong>in</strong>gs or <strong>the</strong> end <strong>of</strong> an earn<strong>in</strong>gs run.<br />
Data Preparation<br />
The start<strong>in</strong>g po<strong>in</strong>t <strong>in</strong> <strong>the</strong> preparation <strong>of</strong> <strong>the</strong> data is to<br />
choose a portfolio <strong>of</strong> stocks to represent <strong>the</strong> market <strong>and</strong><br />
serve as a basis for <strong>the</strong> analysis. We chose S&P 500 stocks<br />
(as <strong>of</strong> 1998), because it is a widely followed <strong>in</strong>dex conta<strong>in</strong><strong>in</strong>g<br />
large successful firms (Campbell, Lo, <strong>and</strong> MacK<strong>in</strong>lay<br />
1996). We use <strong>the</strong> monthly level for collection <strong>of</strong> stock<br />
returns as <strong>the</strong> best compromise between quarterly data that<br />
are too crude <strong>and</strong> daily data that are too detailed <strong>and</strong> noisy<br />
(Campbell et al. 1996). The Compustat <strong>and</strong> Center for<br />
Research <strong>in</strong> Security <strong>Prices</strong> (CRSP) data sets from <strong>the</strong><br />
Wharton Research Data Services database at Wharton<br />
formed <strong>the</strong> source <strong>of</strong> our data. The data extraction was<br />
done through a series <strong>of</strong> steps <strong>in</strong> two stages. We wrote a<br />
modular program for each step.<br />
Stage 1<br />
Stage 1 used <strong>the</strong> Compustat database <strong>and</strong> had six steps:<br />
<strong>the</strong> first step was to select <strong>the</strong> firms that comprised <strong>the</strong><br />
S&P 500 as <strong>of</strong> December 31, 1998. The second step was to<br />
extract <strong>the</strong> earn<strong>in</strong>gs (Compustat Data 7: diluted earn<strong>in</strong>gs<br />
per share) figures for <strong>the</strong>se firms from <strong>the</strong> Compustat<br />
tapes. Earn<strong>in</strong>gs figures are reported quarterly, <strong>and</strong> 60 to 70<br />
percent <strong>of</strong> <strong>the</strong> firms announce <strong>the</strong>ir results with<strong>in</strong> <strong>the</strong> first 3<br />
weeks <strong>of</strong> <strong>the</strong> quarter. The data were cleaned to ensure that<br />
only firms that reported earn<strong>in</strong>gs with<strong>in</strong> <strong>the</strong> first month <strong>of</strong><br />
<strong>the</strong> quarter appeared <strong>in</strong> our data set.<br />
The third step was to identify sequences <strong>of</strong> earn<strong>in</strong>gs <strong>of</strong><br />
each firm after correct<strong>in</strong>g for seasonality. The fourth step<br />
was to compute all <strong>the</strong> various runs <strong>of</strong> earn<strong>in</strong>gs for each<br />
firm, by identify<strong>in</strong>g <strong>the</strong> break <strong>in</strong> <strong>the</strong> sequence <strong>of</strong> earn<strong>in</strong>gs.<br />
The fifth step was to sort all runs <strong>of</strong> equal length. The sixth<br />
step was to identify <strong>the</strong> month at which <strong>the</strong> run ended. We<br />
<strong>the</strong>n switched to Stage 2. We did not adjust <strong>the</strong> portfolio<br />
for <strong>the</strong> additions <strong>and</strong> changes to <strong>the</strong> S&P 500 over <strong>the</strong><br />
period <strong>of</strong> <strong>the</strong> sample.<br />
Stage 2<br />
Stage 2 used <strong>the</strong> CRSP database <strong>and</strong> had six steps. The<br />
first step was to l<strong>in</strong>k firms <strong>in</strong> <strong>the</strong> Compustat database with<br />
those <strong>in</strong> <strong>the</strong> CRSP database. The second step was to determ<strong>in</strong>e<br />
<strong>the</strong> date on which <strong>the</strong> run <strong>of</strong> earn<strong>in</strong>gs ended <strong>and</strong> compute<br />
<strong>the</strong> returns <strong>of</strong> that particular firm for 30 months prior<br />
<strong>and</strong> 3 months after that date. The returns <strong>in</strong>cluded changes<br />
<strong>in</strong> price <strong>and</strong> cash dividends paid out as def<strong>in</strong>ed <strong>in</strong> equation<br />
(2). We use this long 30-month w<strong>in</strong>dow to estimate <strong>the</strong><br />
normal returns for each stock to avoid temporal<br />
idiosyncrasies.<br />
The third step is to extract monthly returns for each firm<br />
<strong>and</strong> sort <strong>the</strong>m by run length <strong>of</strong> earn<strong>in</strong>gs. The fourth step is<br />
to compute expected normal monthly returns for each firm<br />
us<strong>in</strong>g equation (5). The fifth step was to compute abnormal<br />
monthly returns for each firm us<strong>in</strong>g equation (6). The<br />
sixth step is to compute cumulated abnormal returns for<br />
each firm for <strong>the</strong> quarter us<strong>in</strong>g equation (7) <strong>and</strong> to aggregate<br />
returns with <strong>the</strong> same run length. We <strong>the</strong>n compared<br />
<strong>the</strong> length <strong>of</strong> earn<strong>in</strong>gs’ run with <strong>the</strong> total abnormal returns<br />
for that particular run length. The number <strong>of</strong> firms <strong>in</strong> this<br />
stage varied with run length.<br />
Results<br />
Johnson, Tellis / HEURISTICS AND BIASES 499<br />
TABLE 4<br />
Abnormal Returns for <strong>Run</strong>s<br />
<strong>of</strong> Positive Earn<strong>in</strong>gs<br />
Abnormal t Value (test vs.<br />
<strong>Run</strong> Length Return (%) previous level)<br />
+2 0.16 –0.22<br />
+3 –1.83 –2.38<br />
+4 –2.79 –2.25<br />
+5 –4.70 –2.81<br />
TABLE 5<br />
Abnormal Returns for <strong>Run</strong>s<br />
<strong>of</strong> Negative Earn<strong>in</strong>gs<br />
<strong>Run</strong> Length Abnormal Return(%) t Value<br />
–3 –0.011 –1.398<br />
–4 0.028 1.544<br />
–5 0.012 0.46<br />
TABLE 6<br />
Size <strong>of</strong> Abnormal Returns Versus <strong>Run</strong> Length<br />
Variable Coefficients t Statistic p-Value<br />
Intercept –1.201 –2.530 0.053<br />
Abnormal returns<br />
R<br />
–0.361 –2.933 0.033<br />
2 = .78<br />
Table 4 shows <strong>the</strong> results for positive runs. Not only are<br />
returns significantly different from zero, but <strong>the</strong>y also<br />
show a clear trend with <strong>in</strong>creas<strong>in</strong>g run length. The greater<br />
<strong>the</strong> positive run length, <strong>the</strong> greater <strong>the</strong> drop <strong>in</strong> (abnormal)<br />
returns (relative to <strong>the</strong> market). This result is consistent<br />
with Hypo<strong>the</strong>sis 9. It suggests that <strong>the</strong> expectations <strong>of</strong> consumers<br />
for <strong>the</strong> cont<strong>in</strong>uation <strong>of</strong> positive runs <strong>of</strong> successful<br />
stocks leads to <strong>in</strong>flated valuation <strong>of</strong> those stocks <strong>and</strong>
500 JOURNAL OF THE ACADEMY OF MARKETING SCIENCE FALL 2005<br />
abnormal decl<strong>in</strong>es when <strong>the</strong> run breaks. Because <strong>of</strong><br />
decl<strong>in</strong><strong>in</strong>g number <strong>of</strong> observations as run length <strong>in</strong>creased,<br />
we could only study up to run lengths <strong>of</strong> 5. Thus, <strong>in</strong> <strong>the</strong>se<br />
analyses, we could not analyze any nonl<strong>in</strong>earities associated<br />
with <strong>the</strong> onset <strong>of</strong> <strong>the</strong> gambler’s fallacy.<br />
Table 5 shows <strong>the</strong> results <strong>of</strong> <strong>the</strong> estimation for negative<br />
runs. The results show that <strong>the</strong>re are no systematic abnormal<br />
returns for negative runs. Indeed, <strong>the</strong> results tie <strong>in</strong> with<br />
<strong>the</strong> predictions <strong>of</strong> <strong>the</strong> efficient market hypo<strong>the</strong>sis. Thus,<br />
Hypo<strong>the</strong>sis 10 was not supported.<br />
This po<strong>in</strong>ts to an asymmetry <strong>in</strong> consumers’ response to<br />
a negative run relative to a positive run. Also, <strong>the</strong> number<br />
<strong>of</strong> firms with decreas<strong>in</strong>g run lengths was fewer. This is<br />
probably because <strong>the</strong>y went out <strong>of</strong> bus<strong>in</strong>ess or were bought<br />
over. Fur<strong>the</strong>rmore, managers are less <strong>and</strong> less likely to<br />
report a large sequence <strong>of</strong> negative earn<strong>in</strong>gs. The use <strong>of</strong><br />
managerial discretion to smoo<strong>the</strong>n earn<strong>in</strong>gs is a widely<br />
accepted account<strong>in</strong>g practice (Subramanyam 1996).<br />
To see <strong>the</strong> effect <strong>of</strong> run length on returns, we regressed<br />
<strong>the</strong> abnormal returns across various run lengths. The results<br />
are <strong>in</strong> Table 6.<br />
Table 6 shows that <strong>the</strong> coefficient for abnormal returns<br />
is significant <strong>and</strong> negative. This means that <strong>the</strong> greater <strong>the</strong><br />
positive run length, <strong>the</strong> steeper <strong>the</strong> fall after <strong>the</strong> run length<br />
breaks. Conversely, <strong>the</strong> greater <strong>the</strong> run length <strong>of</strong> negative<br />
runs, <strong>the</strong> more <strong>the</strong> abnormal returns jump when <strong>the</strong> run<br />
length breaks.<br />
DISCUSSION<br />
This section summarizes <strong>the</strong> results, clarifies <strong>the</strong> contribution,<br />
draws some implications, <strong>and</strong> discusses <strong>the</strong> limitations<br />
<strong>of</strong> <strong>the</strong> current research.<br />
Summary <strong>of</strong> Results<br />
The research has <strong>the</strong> follow<strong>in</strong>g ma<strong>in</strong> results:<br />
Study 1 shows that <strong>the</strong> length <strong>of</strong> a run <strong>of</strong> earn<strong>in</strong>gs <strong>of</strong><br />
a firm has a nonmonotonic <strong>in</strong>fluence on consumers’<br />
decision to buy or sell <strong>the</strong> stock <strong>of</strong> that firm. As a<br />
positive run <strong>in</strong>creases, participants <strong>in</strong>itially prefer to<br />
buy <strong>the</strong> stock; as <strong>the</strong> run leng<strong>the</strong>ns, <strong>the</strong>y prefer to sell<br />
<strong>the</strong> stock. Conversely, as a negative run <strong>in</strong>creases,<br />
participants <strong>in</strong>itially prefer to sell <strong>the</strong> stock <strong>and</strong> <strong>the</strong>n<br />
prefer to buy <strong>the</strong> stock. The hot h<strong>and</strong> dom<strong>in</strong>ates <strong>the</strong><br />
buy condition, while <strong>the</strong> gambler’s fallacy plays a<br />
bigger role <strong>in</strong> <strong>the</strong> sell condition.<br />
Study 2 shows that mood may affect <strong>the</strong> onset <strong>of</strong> <strong>the</strong><br />
gambler’s fallacy. This study also <strong>in</strong>vestigates <strong>the</strong><br />
self-reported reasons why participants chose <strong>the</strong>ir<br />
respective stocks <strong>and</strong> provides some <strong>in</strong>sights <strong>in</strong>to<br />
consumers’ <strong>in</strong>ternal processes. We see <strong>the</strong> percentage<br />
<strong>of</strong> people who relied on each heuristic at differ-<br />
ent run lengths <strong>and</strong> how <strong>the</strong> two biases change <strong>in</strong><br />
proportion <strong>in</strong> each condition with change <strong>in</strong> run<br />
length.<br />
Study 3 shows that, at least for positive runs, stocks<br />
have abnormal returns that <strong>in</strong>crease with <strong>the</strong> length<br />
<strong>of</strong> <strong>the</strong> run.<br />
Contribution<br />
Our article makes five important contributions:<br />
Two major heuristics <strong>in</strong> decision mak<strong>in</strong>g, <strong>the</strong> gambler’s<br />
fallacy <strong>and</strong> <strong>the</strong> hot h<strong>and</strong>, can be related to each<br />
o<strong>the</strong>r by run length <strong>of</strong> sequential <strong>in</strong>formation to<br />
which <strong>in</strong>dividuals are exposed.<br />
At short runs, <strong>in</strong>dividuals succumb to <strong>the</strong> hot h<strong>and</strong><br />
fallacy, but at very long runs, <strong>in</strong>dividuals succumb to<br />
<strong>the</strong> gambler’s fallacy.<br />
Individuals’responses to run length reverse depend<strong>in</strong>g<br />
whe<strong>the</strong>r <strong>the</strong>y are <strong>in</strong> a buy<strong>in</strong>g or sell<strong>in</strong>g mode.<br />
This pattern <strong>of</strong> response at <strong>the</strong> <strong>in</strong>dividual level may<br />
expla<strong>in</strong> f<strong>in</strong>ancial behavior at <strong>the</strong> aggregate level,<br />
where momentum <strong>in</strong> <strong>the</strong> short run is followed by a<br />
reversal <strong>in</strong> long run.<br />
<strong>Prices</strong> <strong>of</strong> stocks show dist<strong>in</strong>ct overreaction based on<br />
run length <strong>of</strong> earn<strong>in</strong>gs (overreaction <strong>and</strong> underreaction<br />
studies are based on portfolios <strong>of</strong> best perform<strong>in</strong>g or worst<br />
perform<strong>in</strong>g stocks over time <strong>and</strong> not on run length).<br />
Implications<br />
This research has important implications for market<strong>in</strong>g<br />
<strong>and</strong> public policy, behavioral decision <strong>the</strong>ory, <strong>and</strong> f<strong>in</strong>ance.<br />
Market<strong>in</strong>g <strong>and</strong> Public Policy<br />
Marketers <strong>of</strong> f<strong>in</strong>ancial products, especially <strong>of</strong> stocks<br />
<strong>and</strong> mutual funds, currently advertise <strong>the</strong>ir products by<br />
emphasiz<strong>in</strong>g past performance, despite an SEC-required<br />
disclosure at <strong>the</strong> bottom. Study 1 suggests that policy is<br />
reasonable, because consumers are motivated to buy on<br />
<strong>the</strong> basis <strong>of</strong> short runs <strong>of</strong> positive <strong>in</strong>formation. However,<br />
from a public policy perspective, our results are troubl<strong>in</strong>g.<br />
To <strong>the</strong> extent that consumers focus on past performance<br />
(prom<strong>in</strong>ent <strong>in</strong> ads), <strong>the</strong>y may well make suboptimal<br />
decisions.<br />
We tested our <strong>the</strong>sis <strong>in</strong> <strong>the</strong> context <strong>of</strong> consumers’ purchase<br />
<strong>of</strong> stocks. However, we suspect <strong>the</strong> same phenomenon<br />
could occur <strong>in</strong> o<strong>the</strong>r market<strong>in</strong>g contexts. In such a scenario,<br />
trend projection could be responsible for <strong>the</strong> <strong>in</strong>itial<br />
hype that surrounds a product’s popularity, followed by its<br />
implosion when trend reversal sets <strong>in</strong>. Examples <strong>in</strong>clude<br />
<strong>the</strong> frenzied bidd<strong>in</strong>g <strong>in</strong> auctions, <strong>the</strong> overvaluation <strong>of</strong><br />
celebrity endorsers until <strong>the</strong>y suddenly become unpopular,<br />
<strong>the</strong> rapid growth <strong>of</strong> new products until a sudden drop <strong>in</strong>
sales (Goldenberg et al. 2002), <strong>the</strong> escalation <strong>and</strong> decl<strong>in</strong>e<br />
<strong>in</strong> prices for real estate, <strong>and</strong> <strong>the</strong> rise <strong>and</strong> fall <strong>of</strong> fads. In <strong>the</strong><br />
past, analysts have tended to expla<strong>in</strong> such reversal by<br />
external events. Our research suggests that changes <strong>in</strong> <strong>the</strong><br />
expectations <strong>of</strong> consumers <strong>the</strong>mselves may be at least<br />
partly responsible for <strong>the</strong> sudden <strong>and</strong> sharp reversal <strong>in</strong><br />
valuations.<br />
Behavioral Decision Theory<br />
Research <strong>in</strong> behavioral f<strong>in</strong>ance <strong>and</strong> behavioral decision<br />
mak<strong>in</strong>g has demonstrated <strong>the</strong> effect <strong>of</strong> <strong>the</strong> hot h<strong>and</strong> phenomenon<br />
<strong>and</strong> <strong>the</strong> gambler’s fallacy. Many studies have<br />
documented how <strong>the</strong>se effects occur because <strong>of</strong> <strong>the</strong> biases<br />
with which consumer process <strong>in</strong>formation on performance<br />
runs. However, past research has not suggested that<br />
<strong>the</strong>se two effects could work <strong>in</strong> t<strong>and</strong>em. For example,<br />
DeBondt (1998) discussed how experts <strong>and</strong> <strong>in</strong>dividual<br />
consumers use <strong>the</strong>se heuristics separately. Our experiment<br />
shows that consumers may exhibit both, <strong>the</strong> hot h<strong>and</strong> <strong>and</strong><br />
<strong>the</strong> gambler’s fallacy, depend<strong>in</strong>g on <strong>the</strong> length <strong>of</strong> <strong>the</strong> run <strong>of</strong><br />
<strong>in</strong>formation that <strong>the</strong>y face. For example, when fac<strong>in</strong>g a run<br />
<strong>of</strong> positive <strong>in</strong>formation, consumers may <strong>in</strong>itially resort to<br />
trend projection <strong>and</strong> suffer from <strong>the</strong> hot h<strong>and</strong> problem. As<br />
<strong>the</strong> run leng<strong>the</strong>ns, <strong>the</strong>y may reverse <strong>the</strong>ir prediction <strong>and</strong><br />
suffer from <strong>the</strong> gambler’s fallacy.<br />
F<strong>in</strong>ancial Markets<br />
Our research serves to show that perhaps <strong>the</strong> one explanation<br />
for <strong>the</strong> momentum <strong>and</strong> reversal phenomena so<br />
widely reported <strong>in</strong> <strong>the</strong> f<strong>in</strong>ance literature has its orig<strong>in</strong>s <strong>in</strong><br />
<strong>the</strong> way people process sequential <strong>in</strong>formation. The tendency<br />
<strong>of</strong> consumers to overweight past trends <strong>and</strong> reverse<br />
<strong>the</strong>m after a certa<strong>in</strong> length may expla<strong>in</strong> why phenomena<br />
such as bubbles occur. Such phenomena, as gross overvaluation<br />
<strong>of</strong> asset prices <strong>and</strong> <strong>the</strong>ir subsequent implosion,<br />
have been well known <strong>in</strong> <strong>the</strong> history <strong>of</strong> f<strong>in</strong>ancial markets,<br />
from <strong>the</strong> 16th-century tulip mania to <strong>the</strong> more recent<br />
Internet bubble. Why do people bid up <strong>the</strong> value <strong>of</strong> assets<br />
<strong>and</strong> <strong>the</strong>n reverse <strong>the</strong>ir valuations at a later date? We suggest<br />
that an <strong>in</strong>ternal change <strong>in</strong> valuation <strong>of</strong> an asset, <strong>in</strong> response<br />
to <strong>the</strong> run-up <strong>of</strong> <strong>in</strong>formation about it, may be an explanation.<br />
Consumers switch from trend projection (hot h<strong>and</strong>)<br />
when <strong>the</strong> run is short to skepticism (gambler’s fallacy)<br />
when <strong>the</strong> run gets very long.<br />
The results <strong>of</strong> our econometric section also show that <strong>in</strong><br />
a market situation, <strong>in</strong>vestors can hold subrational (Karp<strong>of</strong>f<br />
1986) views <strong>and</strong> thus affect prices without rational players<br />
automatically correct<strong>in</strong>g from <strong>the</strong>m <strong>and</strong> thus caus<strong>in</strong>g overreaction<br />
to persist (Cooper 1999; Shiller 1990).<br />
Johnson, Tellis / HEURISTICS AND BIASES 501<br />
Limitations <strong>and</strong> Future Research<br />
This study has many obvious limitations, some <strong>of</strong><br />
which we need to discuss. Several <strong>of</strong> <strong>the</strong>se can lead to<br />
future research.<br />
First, this study used stocks as <strong>the</strong> subject <strong>of</strong> consumers’<br />
choice <strong>and</strong> earn<strong>in</strong>gs as <strong>the</strong> run <strong>of</strong> <strong>in</strong>formation. Subsequent<br />
studies could determ<strong>in</strong>e <strong>the</strong> generalizability <strong>of</strong> this<br />
research by exam<strong>in</strong><strong>in</strong>g o<strong>the</strong>r contexts <strong>and</strong> o<strong>the</strong>r runs <strong>of</strong><br />
<strong>in</strong>formation such as new products <strong>and</strong> <strong>the</strong>ir sales, celebrity<br />
endorsers <strong>and</strong> <strong>the</strong>ir contracts, or auctions <strong>and</strong> bids.<br />
Second, this study found a small asymmetry <strong>in</strong> <strong>the</strong><br />
response to positive runs <strong>and</strong> negative runs. In both experimental<br />
<strong>and</strong> market studies, our <strong>the</strong>ory <strong>and</strong> hypo<strong>the</strong>ses<br />
were better or fully confirmed <strong>in</strong> <strong>the</strong> doma<strong>in</strong> <strong>of</strong> positive<br />
runs than <strong>in</strong> that <strong>of</strong> negative runs. We suspect that one reason<br />
may be our def<strong>in</strong>ition <strong>of</strong> a negative run <strong>of</strong> <strong>in</strong>formation.<br />
In all our analyses, we considered a negative run as a<br />
decl<strong>in</strong>e <strong>in</strong> earn<strong>in</strong>gs, which were all still positive. S<strong>in</strong>ce <strong>the</strong><br />
earn<strong>in</strong>gs were still positive, <strong>the</strong>y may not have triggered as<br />
strong a negative response <strong>in</strong>itially. Subsequent research<br />
could <strong>in</strong>vestigate <strong>the</strong> effect <strong>of</strong> a str<strong>in</strong>g <strong>of</strong> <strong>in</strong>creas<strong>in</strong>g losses.<br />
Third, this study did not evaluate <strong>the</strong> actual efficiency<br />
<strong>of</strong> <strong>the</strong> stock market, <strong>in</strong> terms <strong>of</strong> whe<strong>the</strong>r consumers can<br />
pr<strong>of</strong>it from <strong>the</strong> biases that we discovered. Future research<br />
could determ<strong>in</strong>e whe<strong>the</strong>r <strong>in</strong>vest<strong>in</strong>g <strong>in</strong> various portfolios <strong>of</strong><br />
w<strong>in</strong>ners or losers would lead to better returns than from a<br />
r<strong>and</strong>om selection <strong>of</strong> stocks.<br />
Fourth, we have not shown <strong>the</strong> effects <strong>of</strong> <strong>the</strong> gambler’s<br />
fallacy <strong>in</strong> <strong>the</strong> aggregate case, perhaps because we could<br />
not f<strong>in</strong>d long enough sequences <strong>of</strong> <strong>in</strong>creas<strong>in</strong>g or decreas<strong>in</strong>g<br />
returns. Such sequences could be found if one started<br />
out with a large sample <strong>of</strong> stocks to beg<strong>in</strong> with.<br />
Fifth, our experimental results could be open to rival<br />
explanations. For example, <strong>the</strong> rate <strong>of</strong> <strong>in</strong>crease or decrease<br />
<strong>of</strong> <strong>the</strong> earn<strong>in</strong>gs may <strong>in</strong>fluence consumer choice <strong>of</strong> <strong>the</strong> w<strong>in</strong>n<strong>in</strong>g<br />
<strong>and</strong> los<strong>in</strong>g stock. We would need to conduct more<br />
experiments to rule out <strong>the</strong>se explanations.<br />
Sixth, <strong>the</strong> econometric study at <strong>the</strong> aggregate market<br />
level could be conducted us<strong>in</strong>g buy-<strong>and</strong>-hold portfolios<br />
<strong>in</strong>stead <strong>of</strong> us<strong>in</strong>g <strong>the</strong> event study method. In addition, more<br />
ref<strong>in</strong>ed models <strong>in</strong>corporat<strong>in</strong>g more variables can be used<br />
to rule out rival explanations such as <strong>the</strong> effect on discount<br />
rates versus <strong>the</strong> effect on cash flow as firms break <strong>the</strong>ir<br />
str<strong>in</strong>gs <strong>of</strong> earn<strong>in</strong>gs. Use <strong>of</strong> transaction-level data such as<br />
<strong>the</strong> purchase <strong>and</strong> sale <strong>in</strong>formation <strong>of</strong> funds by <strong>in</strong>dividual<br />
<strong>in</strong>vestors could be a better data set to conduct <strong>the</strong> marketlevel<br />
analyses.
502 JOURNAL OF THE ACADEMY OF MARKETING SCIENCE FALL 2005<br />
REFERENCES<br />
Aaker, David A. <strong>and</strong> Robert Jacobson. 1994. “The F<strong>in</strong>ancial Information<br />
Content <strong>of</strong> Perceived Quality.” Journal <strong>of</strong> Market<strong>in</strong>g Research 31:<br />
191-201.<br />
Agarwal, Jagdish <strong>and</strong> Wagner A. Kamakura. 1995. “The Economic<br />
Worth <strong>of</strong> Celebrity Endorsers: An Event Study Analysis.” Journal <strong>of</strong><br />
Market<strong>in</strong>g 59:56-62.<br />
Andreassen, Paul B. 1988. “Expla<strong>in</strong><strong>in</strong>g <strong>the</strong> Price-Volume Relationship:<br />
The Difference Between Price Changes <strong>and</strong> Chang<strong>in</strong>g <strong>Prices</strong>.” Organizational<br />
Behavior <strong>and</strong> Human Decision Processes 41:371-389.<br />
Barberis, N., A. Shliefer, <strong>and</strong> R. Vishny. 1998. “A Model <strong>of</strong> Investor Sentiment.”<br />
Journal <strong>of</strong> F<strong>in</strong>ancial Economics 49 (3): 307-344.<br />
Camerer, Coil<strong>in</strong> F. 1989. “Does <strong>the</strong> Basketball Market Believe <strong>in</strong> <strong>the</strong> ‘Hot<br />
H<strong>and</strong>’?” American Economic Review 79 (5): 1257-1261.<br />
Campbell, J. Y., Andrew W. Lo, <strong>and</strong> A. Craig MacK<strong>in</strong>lay. 1996. The<br />
Econometrics <strong>of</strong> F<strong>in</strong>ancial Markets. Pr<strong>in</strong>ceton, NJ: Pr<strong>in</strong>ceton University<br />
Press.<br />
Chaney, Paul K., Timothy M. Dev<strong>in</strong>ney, <strong>and</strong> Russell S. W<strong>in</strong>er. 1991. “The<br />
Impact <strong>of</strong> New Product Introductions on <strong>the</strong> Market Value <strong>of</strong> Firms.”<br />
Journal <strong>of</strong> Bus<strong>in</strong>ess 64 (4): 573-610.<br />
Chopra, Nav<strong>in</strong>, Josef Lakonishok, <strong>and</strong> Jay Ritter. 1993. “Measur<strong>in</strong>g Abnormal<br />
Performance: Do <strong>Stock</strong>s Overreact?” In Advances <strong>in</strong> Behavioral<br />
F<strong>in</strong>ance, Ed. Richard H. Thaler. New York: Russell Sage<br />
Foundation, 265-302.<br />
Cooper, Michael. 1999. “Filter Rules Based on Price <strong>and</strong> Volume <strong>in</strong> Individual<br />
Security Overreaction.” Review <strong>of</strong> F<strong>in</strong>ancial Studies 12 (4):<br />
901-935.<br />
Craik, F. I. M. <strong>and</strong> R. S. Lockhart. 1972. “Levels <strong>of</strong> Process<strong>in</strong>g: A Framework<br />
for Memory Research.” Journal <strong>of</strong> Verbal Learn<strong>in</strong>g <strong>and</strong> Verbal<br />
Behavior 11:671-684.<br />
DeBondt, Werner. 1993. “Bett<strong>in</strong>g on Trends: Intuitive Forecasts <strong>of</strong> F<strong>in</strong>ancial<br />
Risk <strong>and</strong> Return.” International Journal <strong>of</strong> Forecast<strong>in</strong>g 9:355-<br />
371.<br />
APPENDIX<br />
Presentation <strong>of</strong> Task <strong>and</strong> <strong>Run</strong> Length<br />
to Participants (for runs <strong>of</strong> length 11)<br />
This is an exercise <strong>in</strong> <strong>in</strong>vest<strong>in</strong>g. Your answers are entirely anonymous.<br />
You have just received a tax rebate <strong>of</strong> $1,000. You <strong>in</strong>tend to <strong>in</strong>vest it <strong>in</strong> <strong>the</strong> stock market, for a short time <strong>of</strong> one quarter. You ask your<br />
broker to recommend a couple <strong>of</strong> stocks based on certa<strong>in</strong> criteria you specify. He comes up with two stocks, Haloo <strong>and</strong> Andaz, that meet<br />
most <strong>of</strong> <strong>the</strong> criteria you set. However, <strong>the</strong>y differ substantially <strong>in</strong> recent earn<strong>in</strong>gs. Haloo has had 11 quarters <strong>of</strong> <strong>in</strong>creas<strong>in</strong>g earn<strong>in</strong>gs, while<br />
Andaz has had 11 quarters <strong>of</strong> decreas<strong>in</strong>g earn<strong>in</strong>gs, as follows:<br />
Haloo Inc.:<br />
2001<br />
Year<br />
2002 2003<br />
Quarter Q1 Q2 Q3 Q4 Q1 Q2 Q3 Q4 Q1 Q2 Q3<br />
EPS($) 0.23 0.28 0.32 0.45 0.51 0.64 0.81 0.91 0.99 1.19 1.26<br />
Andaz Inc.:<br />
2001<br />
Year<br />
2002 2003<br />
Quarter Q1 Q2 Q3 Q4 Q1 Q2 Q3 Q4 Q1 Q2 Q3<br />
EPS($) 1.18 1.02 0.94 0.88 0.82 0.69 0.59 0.48 0.43 0.34 0.21<br />
NOTE: EPS = earn<strong>in</strong>gs per share.<br />
———. 1998. “A Portrait <strong>of</strong> <strong>the</strong> Individual Investor.” European Economic<br />
Review 42:831-844.<br />
——— <strong>and</strong> Richard Thaler. 1985. “Does <strong>the</strong> <strong>Stock</strong> Market Overreact?”<br />
Journal <strong>of</strong> F<strong>in</strong>ance 40:793-805.<br />
——— <strong>and</strong> ———. 1987. “Fur<strong>the</strong>r Evidence on Investor Overreaction<br />
<strong>and</strong> <strong>Stock</strong> Market Seasonality.” Journal <strong>of</strong> F<strong>in</strong>ance 42:557-581.<br />
——— <strong>and</strong> ———. 1989. “A Mean Revert<strong>in</strong>g Walk Down Wall Street.”<br />
Journal <strong>of</strong> Economic Perspectives 3 (1): 189-202.<br />
——— <strong>and</strong> ———. 1990. “Do Security Analysts Overreact?” American<br />
Economic Review 80 (2): 52-57.<br />
Dhar, Ravi <strong>and</strong> Alok Kumar. 2001. “A Non-R<strong>and</strong>om Walk Down <strong>the</strong><br />
Ma<strong>in</strong> Street: Impact <strong>of</strong> Price Trends on Trad<strong>in</strong>g Decisions <strong>of</strong> Individual<br />
Investors.” Work<strong>in</strong>g paper. Yale University, New Haven, CT.<br />
E<strong>in</strong>horn, H. J., <strong>and</strong> R. Hogarth. 1978. “Confidence <strong>in</strong> Judgement: Persistence<br />
<strong>in</strong> <strong>the</strong> Illusion <strong>of</strong> Validity.” Psychological Review 85 (5): 395-<br />
416.<br />
Fama, Eugene F. 1970. “Efficient Capital Markets: A Review <strong>of</strong> Theory<br />
<strong>and</strong> Empirical Work.” Journal <strong>of</strong> F<strong>in</strong>ance 25 (2): 383-417.<br />
———. 1991. “Efficient Capital Markets II.” Journal <strong>of</strong> F<strong>in</strong>ance 25:383-<br />
417.<br />
———. 1998. “Efficiency Survives <strong>the</strong> Attack <strong>of</strong> <strong>the</strong> Anomalies.” GSB<br />
Chicago (W<strong>in</strong>ter):14-16.<br />
———, Lawrence Fisher, Michael Jensen, <strong>and</strong> Richard Roll. 1969. “The<br />
Adjustment <strong>of</strong> <strong>Stock</strong> <strong>Prices</strong> to New Information.” International Economic<br />
Review 10:1-21.<br />
——— <strong>and</strong> Kenneth R. French. 2000. “Forecast<strong>in</strong>g Pr<strong>of</strong>itability <strong>and</strong><br />
Earn<strong>in</strong>gs.” Journal <strong>of</strong> Bus<strong>in</strong>ess 73 (2): 161-175.<br />
Gilovich, Thomas R., Robert Vallone, <strong>and</strong> Amos Tversky. 1985. “The<br />
Hot H<strong>and</strong> <strong>in</strong> Basketball: On <strong>the</strong> Misperception <strong>of</strong> R<strong>and</strong>om Sequences.”<br />
Cognitive Psychology 17:295-314.<br />
Goldenberg, Jacob, Barak Libai, <strong>and</strong> Eitan Muller. 2002. “Rid<strong>in</strong>g <strong>the</strong><br />
Saddle: How Cross-Market Communication Creates a Major Slump<br />
<strong>in</strong> Sales.” Journal <strong>of</strong> Market<strong>in</strong>g 66 (April): 1-16.
Jegadeesh, Narasimhan <strong>and</strong> Sheridan Titman. 1993. “Returns to Buy<strong>in</strong>g<br />
W<strong>in</strong>ners <strong>and</strong> Sell<strong>in</strong>g Losers: Implications for <strong>Stock</strong> Market Efficiency.”<br />
Journal <strong>of</strong> F<strong>in</strong>ance 48:65-91.<br />
Jensen, M. 1978. “Some Anomalous Evidence Regard<strong>in</strong>g Market Efficiency.”<br />
Journal <strong>of</strong> F<strong>in</strong>ancial Economics 6:95-102.<br />
Johnson, Joseph, Gerard J. Tellis, <strong>and</strong> Deborah J. Mac<strong>in</strong>nis. Forthcom<strong>in</strong>g.<br />
“Losers, W<strong>in</strong>ners <strong>and</strong> Biased Trades.” Journal <strong>of</strong> Consumer Research.<br />
Hayes-Roth, B. <strong>and</strong> F. Hayes-Roth. 1979. “A Cognitive Model <strong>of</strong> Plann<strong>in</strong>g.”<br />
Cognitive Science 3:275-310.<br />
Isen, Alice M. 1989. “Some Ways <strong>in</strong> Which Affect Influences Cognitive<br />
Processes: Implications for Advertis<strong>in</strong>g <strong>and</strong> Consumer Behavior.” In<br />
Cognitive <strong>and</strong> Affective Responses to Advertis<strong>in</strong>g. Eds.Patricia<br />
Caffereta <strong>and</strong> Alice M. Tybout. Lex<strong>in</strong>gton, MA: Lex<strong>in</strong>gton Books,<br />
91-118.<br />
Kahneman, D. <strong>and</strong> A. Tversky. 1972. “Subjective Probability: A Judgment<br />
<strong>of</strong> Representativeness.” Cognitive Psychology 3:430-454.<br />
Karp<strong>of</strong>f, Jonathan M. 1986. “A Theory <strong>of</strong> Trad<strong>in</strong>g Volume.” Journal <strong>of</strong><br />
F<strong>in</strong>ance 51 (5): 1069-1087.<br />
Lakonishok, Josef, Andrei Shleifer, <strong>and</strong> Robert Vishny. 1994.<br />
“Contrarian Investments, Extrapolation, <strong>and</strong> Risk.” Journal <strong>of</strong> F<strong>in</strong>ance<br />
49 (5): 1541-1578.<br />
Lane, Vicki <strong>and</strong> Robert Jacobson. 1995. “<strong>Stock</strong> Market Reactions to<br />
Br<strong>and</strong> Extension Announcements: The Effects <strong>of</strong> Br<strong>and</strong> Attitude <strong>and</strong><br />
Familiarity.” Journal <strong>of</strong> Market<strong>in</strong>g 59 (January): 63-77.<br />
La Porta, Rafael, Josef Lakonishok, Andrei Shleifer, <strong>and</strong> Robert Vishny.<br />
1994. “Good News for Value Socks: Fur<strong>the</strong>r Evidence on Market Efficiency.”<br />
Journal <strong>of</strong> F<strong>in</strong>ance 52:859-874.<br />
Odean, Terrance. 1998. “Are Investors Reluctant to Realize Their<br />
Losses?” Journal <strong>of</strong> F<strong>in</strong>ance 53 (5): 1775-1798.<br />
Raghubir, Priya <strong>and</strong> Sanjiv Ranjan Das. 1999. “The Psychology <strong>of</strong> F<strong>in</strong>ancial<br />
Decision Mak<strong>in</strong>g: A Case for Theory-Driven Experimental Enquiry.”<br />
F<strong>in</strong>ancial Analyst’s Journal 55 (6): 56-79.<br />
Samuelson, Paul A. 1965. “Pro<strong>of</strong> That Properly Anticipated <strong>Prices</strong> Fluctuate<br />
R<strong>and</strong>omly.” Industrial Management Review 6:41-50.<br />
Shefr<strong>in</strong>, Hersh. 2000. Beyond Greed <strong>and</strong> Fear. Boston, MA: Harvard<br />
Bus<strong>in</strong>ess School Press.<br />
——— <strong>and</strong> Meir Statman. 1985. “The Disposition to Sell W<strong>in</strong>ners Too<br />
Early <strong>and</strong> Ride Losers Too Long: Theory <strong>and</strong> Evidence.” Journal <strong>of</strong><br />
F<strong>in</strong>ance 40:777-790.<br />
Shiller, Robert J. 1990. “Speculative <strong>Prices</strong> <strong>and</strong> Popular Models.” Journal<br />
<strong>of</strong> Economic Perspectives 4 (2): 55-65.<br />
Subramanyam, K. R. 1996. “The Pric<strong>in</strong>g <strong>of</strong> Discretionary Accruals.”<br />
Journal <strong>of</strong> Account<strong>in</strong>g <strong>and</strong> Economics 22:249-281.<br />
Swam<strong>in</strong>athan, Bhaskaran <strong>and</strong> Charles M. C. Lee. 2000. “Do <strong>Stock</strong> <strong>Prices</strong><br />
Overreact to Earn<strong>in</strong>gs News.” Work<strong>in</strong>g paper. Cornell University.<br />
Tversky, Amos <strong>and</strong> Thomas Gilovich. 1989. “The Cold Facts About <strong>the</strong><br />
‘Hot H<strong>and</strong>’<strong>in</strong> Basketball.” Chance: New Directions for Statistics <strong>and</strong><br />
Comput<strong>in</strong>g 2 (1): 16-21.<br />
——— <strong>and</strong> Daniel Kahneman. 1971. “Belief <strong>in</strong> <strong>the</strong> Law <strong>of</strong> Small Numbers.”<br />
Psychological Bullet<strong>in</strong> 76 (July-December): 105-110.<br />
Van Raaij, W. 1991. “The Formation <strong>and</strong> Use <strong>of</strong> Expectations <strong>in</strong> Consumer<br />
Decision Mak<strong>in</strong>g.” In H<strong>and</strong>book <strong>of</strong> Consumer Behavior. Eds.<br />
Thomas S. Robertson <strong>and</strong> Harold H Kassarjian. Englewood Cliff, NJ:<br />
Prentice Hall, 401-418.<br />
Zeckhauser, Richard, Daryll Hendricks, <strong>and</strong> Jayendu Patel. 1993. “Hot<br />
H<strong>and</strong>s <strong>in</strong> Mutual Funds: Short-<strong>Run</strong> Persistence <strong>of</strong> Performance,<br />
1974-88.” Journal <strong>of</strong> F<strong>in</strong>ance 48 (1): 93-130.<br />
ABOUT THE AUTHORS<br />
Johnson, Tellis / HEURISTICS AND BIASES 503<br />
Joseph Johnson (jjohnson@miami.edu), Ph.D., is an assistant<br />
pr<strong>of</strong>essor <strong>of</strong> market<strong>in</strong>g at <strong>the</strong> University <strong>of</strong> Miami. His research<br />
<strong>in</strong>terests are study<strong>in</strong>g consumer biases <strong>in</strong> <strong>the</strong> context <strong>of</strong> f<strong>in</strong>ancial<br />
products, measur<strong>in</strong>g stock market response to new product <strong>in</strong>troductions,<br />
<strong>and</strong> <strong>the</strong> optimal customization <strong>of</strong> market<strong>in</strong>g promotions.<br />
His research has appeared <strong>in</strong> <strong>the</strong> Journal <strong>of</strong> Consumer<br />
Research <strong>and</strong> <strong>the</strong> Journal <strong>of</strong> Optimization Theory <strong>and</strong> Applications.<br />
His teach<strong>in</strong>g <strong>in</strong>terests are <strong>in</strong>ternational market<strong>in</strong>g, market<strong>in</strong>g<br />
strategy, <strong>and</strong> market<strong>in</strong>g research.<br />
Gerard J. Tellis (tellis@usc.edu), Ph.D. Michigan, is <strong>the</strong> Neely<br />
Chair <strong>in</strong> American Enterprise, director <strong>of</strong> <strong>the</strong> Center for Global<br />
Innovation, <strong>and</strong> pr<strong>of</strong>essor <strong>of</strong> market<strong>in</strong>g <strong>in</strong> <strong>the</strong> Marshall School <strong>of</strong><br />
Bus<strong>in</strong>ess at <strong>the</strong> University <strong>of</strong> Sou<strong>the</strong>rn California, Los Angeles.<br />
He has been Visit<strong>in</strong>g Chair <strong>of</strong> Innovation, Market<strong>in</strong>g, <strong>and</strong> Strategy<br />
at <strong>the</strong> Judge Institute <strong>of</strong> Management, Cambridge University,<br />
United K<strong>in</strong>gdom <strong>and</strong> a Dist<strong>in</strong>guished Visitor, Erasmus<br />
University, Rotterdam. He specializes <strong>in</strong> <strong>the</strong> areas <strong>of</strong> global <strong>in</strong>novation,<br />
new product growth, market entry, advertis<strong>in</strong>g, sales promotion,<br />
<strong>and</strong> pric<strong>in</strong>g. He has published more than 60 papers <strong>and</strong><br />
books on <strong>the</strong>se topics (see http://www-rcf.usc.edu/~tellis/<br />
publicat.htm). His articles have won numerous awards, <strong>in</strong>clud<strong>in</strong>g<br />
four <strong>of</strong> <strong>the</strong> most prestigious awards <strong>in</strong> <strong>the</strong> field <strong>of</strong> Market<strong>in</strong>g: <strong>the</strong><br />
Frank M. Bass, William F. Odell, Harold D. Maynard (twice),<br />
<strong>and</strong> American Market<strong>in</strong>g Association (AMA)-Berry awards. He<br />
consults with major mult<strong>in</strong>ational corporations <strong>and</strong> has been on<br />
<strong>the</strong> editorial review boards <strong>of</strong> <strong>the</strong> Journal <strong>of</strong> Market<strong>in</strong>g Research,<br />
<strong>the</strong> Journal <strong>of</strong> Market<strong>in</strong>g, <strong>and</strong> Market<strong>in</strong>g Science for several<br />
years.