Acoustic target strength of capelin measured by single-target ...
Acoustic target strength of capelin measured by single-target ...
Acoustic target strength of capelin measured by single-target ...

Create successful ePaper yourself
Turn your PDF publications into a flip-book with our unique Google optimized e-Paper software.
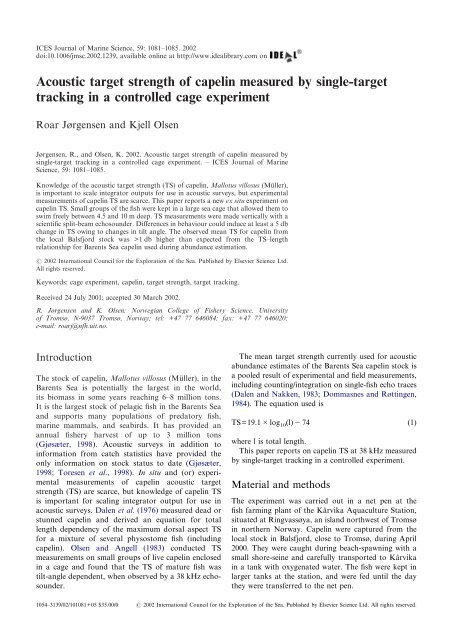
ICES Journal <strong>of</strong> Marine Science, 59: 1081–1085. 2002<br />
doi:10.1006/jmsc.2002.1239, available online at http://www.idealibrary.com on<br />
<strong>Acoustic</strong> <strong>target</strong> <strong>strength</strong> <strong>of</strong> <strong>capelin</strong> <strong>measured</strong> <strong>by</strong> <strong>single</strong>-<strong>target</strong><br />
tracking in a controlled cage experiment<br />
Roar Jørgensen and Kjell Olsen<br />
Jørgensen, R., and Olsen, K. 2002. <strong>Acoustic</strong> <strong>target</strong> <strong>strength</strong> <strong>of</strong> <strong>capelin</strong> <strong>measured</strong> <strong>by</strong><br />
<strong>single</strong>-<strong>target</strong> tracking in a controlled cage experiment. – ICES Journal <strong>of</strong> Marine<br />
Science, 59: 1081–1085.<br />
Knowledge <strong>of</strong> the acoustic <strong>target</strong> <strong>strength</strong> (TS) <strong>of</strong> <strong>capelin</strong>, Mallotus villosus (Müller),<br />
is important to scale integrator outputs for use in acoustic surveys, but experimental<br />
measurements <strong>of</strong> <strong>capelin</strong> TS are scarce. This paper reports a new ex situ experiment on<br />
<strong>capelin</strong> TS. Small groups <strong>of</strong> the fish were kept in a large sea cage that allowed them to<br />
swim freely between 4.5 and 10 m deep. TS measurements were made vertically with a<br />
scientific split-beam echosounder. Differences in behaviour could induce at least a 5 db<br />
change in TS owing to changes in tilt angle. The observed mean TS for <strong>capelin</strong> from<br />
the local Balsfjord stock was >1 db higher than expected from the TS–length<br />
relationship for Barents Sea <strong>capelin</strong> used during abundance estimation.<br />
2002 International Council for the Exploration <strong>of</strong> the Sea. Published <strong>by</strong> Elsevier Science Ltd.<br />
All rights reserved.<br />
Keywords: cage experiment, <strong>capelin</strong>, <strong>target</strong> <strong>strength</strong>, <strong>target</strong> tracking.<br />
Received 24 July 2001; accepted 30 March 2002.<br />
R. Jørgensen and K. Olsen: Norwegian College <strong>of</strong> Fishery Science, University<br />
<strong>of</strong> Tromsø, N-9037 Tromsø, Norway; tel: +47 77 646084; fax: +47 77 646020;<br />
e-mail: roarj@nfh.uit.no.<br />
Introduction<br />
The stock <strong>of</strong> <strong>capelin</strong>, Mallotus villosus (Müller), in the<br />
Barents Sea is potentially the largest in the world,<br />
its biomass in some years reaching 6–8 million tons.<br />
It is the largest stock <strong>of</strong> pelagic fish in the Barents Sea<br />
and supports many populations <strong>of</strong> predatory fish,<br />
marine mammals, and seabirds. It has provided an<br />
annual fishery harvest <strong>of</strong> up to 3 million tons<br />
(Gjøsæter, 1998). <strong>Acoustic</strong> surveys in addition to<br />
information from catch statistics have provided the<br />
only information on stock status to date (Gjøsæter,<br />
1998; Toresen et al., 1998). In situ and (or) experimental<br />
measurements <strong>of</strong> <strong>capelin</strong> acoustic <strong>target</strong><br />
<strong>strength</strong> (TS) are scarce, but knowledge <strong>of</strong> <strong>capelin</strong> TS<br />
is important for scaling integrator output for use in<br />
acoustic surveys. Dalen et al. (1976) <strong>measured</strong> dead or<br />
stunned <strong>capelin</strong> and derived an equation for total<br />
length dependency <strong>of</strong> the maximum dorsal aspect TS<br />
for a mixture <strong>of</strong> several physostome fish (including<br />
<strong>capelin</strong>). Olsen and Angell (1983) conducted TS<br />
measurements on small groups <strong>of</strong> live <strong>capelin</strong> enclosed<br />
in a cage and found that the TS <strong>of</strong> mature fish was<br />
tilt-angle dependent, when observed <strong>by</strong> a 38 kHz echosounder.<br />
The mean <strong>target</strong> <strong>strength</strong> currently used for acoustic<br />
abundance estimates <strong>of</strong> the Barents Sea <strong>capelin</strong> stock is<br />
a pooled result <strong>of</strong> experimental and field measurements,<br />
including counting/integration on <strong>single</strong>-fish echo traces<br />
(Dalen and Nakken, 1983; Dommasnes and Røttingen,<br />
1984). The equation used is<br />
TS=19.1log 10(l)74 (1)<br />
where l is total length.<br />
This paper reports on <strong>capelin</strong> TS at 38 kHz <strong>measured</strong><br />
<strong>by</strong> <strong>single</strong>-<strong>target</strong> tracking in a controlled experiment.<br />
Material and methods<br />
The experiment was carried out in a net pen at the<br />
fish farming plant <strong>of</strong> the Ka˚rvika Aquaculture Station,<br />
situated at Ringvassøya, an island northwest <strong>of</strong> Tromsø<br />
in northern Norway. Capelin were captured from the<br />
local stock in Balsfjord, close to Tromsø, during April<br />
2000. They were caught during beach-spawning with a<br />
small shore-seine and carefully transported to Ka˚rvika<br />
in a tank with oxygenated water. The fish were kept in<br />
larger tanks at the station, and were fed until the day<br />
they were transferred to the net pen.<br />
1054–3139/02/101081+05 $35.00/0 2002 International Council for the Exploration <strong>of</strong> the Sea. Published <strong>by</strong> Elsevier Science Ltd. All rights reserved.
1082 R. Jørgensen and K. Olsen<br />
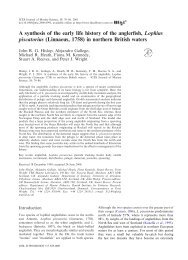
Figure 1. Schematic overview <strong>of</strong> the experimental set-up: (1)<br />
pier, (2) net pen, (3) net ro<strong>of</strong>, (4) big weight, (5) small weight,<br />
(6) air-filled aluminium frame, (7) split-beam transducer, (8)<br />
cable, (9) dry lab with echosounder and computer equipment.<br />
The arrows show how the net pen and the aluminium frame<br />
could be lifted and suspended <strong>by</strong> pulling the smaller weights.<br />
Small groups <strong>of</strong> <strong>capelin</strong> were allowed to swim freely in the pen;<br />
only one fish is shown here.<br />
The experimental net pen was 5510 m with a<br />
mesh size <strong>of</strong> 11 mm (Figure 1). The bottom <strong>of</strong> the pen<br />
was attached to a 5.25.2 m air-filled aluminium frame<br />
stabilized <strong>by</strong> four 20 kg weights. The net pen and the<br />
aluminium frame could be lifted and suspended <strong>by</strong><br />
pulling smaller weights attached to the aluminium frame<br />
(Midling et al., 1998). To keep the <strong>capelin</strong> well outside<br />
the transducer nearfield, a ‘‘ro<strong>of</strong>’’ was installed in the net<br />
pen at a depth <strong>of</strong> 4.5 m. Under the ro<strong>of</strong>, <strong>capelin</strong> were<br />
allowed to move freely between 4.5 and 10 m deep in a<br />
120 m 3 cage shaped as a 554.5 m box with an<br />
additional ro<strong>of</strong> extension 1 m high. The echo from the<br />
net ro<strong>of</strong> (TS
Table 1. Parameter settings and calibration parameters for the EY500 system.<br />
Parameter<br />
maximal vertical movement between consecutive detections<br />
was 10 cm. The tracking output files were reformatted<br />
and imported to SYSTAT (SPSS Inc.) and<br />
MATLAB (Math Works Inc.) for final statistical<br />
analysis.<br />
TS measurements were conducted on several different<br />
groups <strong>of</strong> <strong>capelin</strong>. However, results from just one group<br />
passed the criteria for <strong>single</strong>-fish echo traces: other<br />
groups did not disperse sufficiently to avoid multiple<br />
echoes. This actual group was transferred to the net pen<br />
on 22 June 2000; it consisted <strong>of</strong> 12 female and 3 male<br />
post-spawning Balsfjord <strong>capelin</strong>. The fish were allowed<br />
to acclimatize for 10 h in the net pen prior to TS data<br />
collection. In all, 5 fish, all females, died during the two<br />
2 d experiments. Fish schooled during daylight, but<br />
partly dispersed at night and in the early morning.<br />
Echo-trace data were recorded between 5.8 and<br />
9 m deep; they consisted <strong>of</strong> 6569 TS data distributed<br />
in 273 echo traces, with 5–91 TS detections in each<br />
trace.<br />
A relationship between tilt angle and <strong>target</strong> <strong>strength</strong><br />
for an individual <strong>capelin</strong> was estimated <strong>by</strong> relating TS to<br />
the movement <strong>of</strong> a fish in a selected 33-ping-long echo<br />
trace. For one transmission (‘‘ping’’), n, the angles and<br />
define the <strong>target</strong> direction relative to the acoustic<br />
axis in alongship and athwartship planes respectively.<br />
For small angles, the angle from the acoustic axis is<br />
Date (2000)<br />
05 June 05 June 05 June 26 June 26 June<br />
Sound speed (m s 1 ) 1472 1472 1472 1480 1480<br />
Ping rate (s) 1 1 1 0.0 1<br />
Range (m) 4 5 6 6.4 6.4<br />
RMS (dB) 0.10 0.08 0.08 0.12 0.10<br />
TS gain (dB) 21.3 21.2 21.1 20.5 21.1<br />
3dBbeamwidth()<br />
Athwartship 11.8 12.0 12.1 12.1 12.0<br />
Alongship 12.0 12.3 12.4 12.4 12.4<br />
Offset angle ()<br />
Athwartship 0.19 0.04 0.19 0.00 0.22<br />
Alongship 0.14 0.00 0.18 0.01 0.18<br />
Table 2. Target <strong>strength</strong> detection parameters for the EY500.<br />
Parameter Value<br />
Minimum value<br />
Echo length<br />
70 dB<br />
Minimum 0.8 ms<br />
Maximum 1.8 ms<br />
Maximum gain compensation 6.0 dB<br />
Maximum phase deviation 3.0 steps<br />
<strong>Acoustic</strong> <strong>target</strong> <strong>strength</strong> <strong>of</strong> <strong>capelin</strong><br />
given <strong>by</strong>:<br />
n=√( 2<br />
n+ 2<br />
n) (Reynisson, 1999) (2)<br />
The three-dimensional movement <strong>of</strong> the <strong>capelin</strong> at a<br />
given range (r n) was thus transformed to Cartesian<br />
coordinates alongship:<br />
x n=r n sin( n) (3)<br />
and athwartship:<br />
y n=r n sin( n) (4)<br />
In depth this gives:<br />
1083<br />
z n= r n cos( n) (5)<br />
Random variations <strong>of</strong> <strong>target</strong> positioning were<br />
removed <strong>by</strong> smoothing each coordinate with kernelweighted<br />
polynomial regression (Wilkinson, 1999), with<br />
time as independent variable. The angle, n, between the<br />
line <strong>of</strong> movement from ping n1 to ping n and the<br />
transducer’s face was given <strong>by</strong>:<br />
n=atan{(z nz n1)/√[(x nx n1) 2 +(y ny n1) 2 ]} (6)<br />
The tilt angle in the first ping was estimated to be<br />
equal to the tilt angle in the second ping ( 1= 2).<br />
The smoothed angle from the acoustic axis ( n) was<br />
computed from the smoothed Cartesian coordinates:<br />
n=acos{√[z n/(x 2<br />
n+y 2<br />
n+z 2<br />
n)]} (7)<br />
Because the fish in the selected trace moved approximately<br />
parallel to the alongship axis (x), the tilt angle<br />
could be computed <strong>by</strong> simply adding n to n (x n>0) or<br />
subtracting n from n (x n
1084 R. Jørgensen and K. Olsen<br />
Count<br />
1000<br />
800<br />
600<br />
400<br />
200<br />
0<br />
–57<br />
Results<br />
–56 –55 –54 –53 –52 –51 –50 –49<br />
Target <strong>strength</strong> (dB)<br />
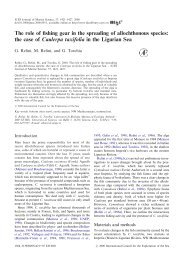
Figure 2. Target-<strong>strength</strong> distribution <strong>of</strong> all observations in the<br />
ex situ experiment (n=6569). The vertical line shows the mean<br />
<strong>target</strong> <strong>strength</strong>, 52.5 db.<br />
Depth (m)<br />
5.55<br />
5.6<br />
5.65<br />
5.7<br />
5.75<br />
5.8<br />
5.85<br />
–0.4<br />
–0.2 0 0.2 0.4 0.6<br />
Alongship (m)<br />
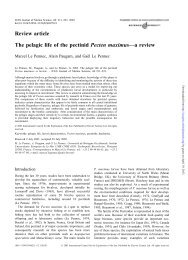
Figure 3. Vertical movements <strong>of</strong> a <strong>capelin</strong> in one echo trace<br />
(n=33). Crosses show actual measurements and arrows show<br />
the direction <strong>of</strong> movement. The smoothed line describes<br />
estimated movement alongship and in depth.<br />
The total length <strong>of</strong> the 15 fish ranged from 10.5 to<br />
12.3 cm, with a mean <strong>of</strong> 11.3 cm (s.d.=0.5). The mean<br />
length <strong>of</strong> the 10 fish alive at the end <strong>of</strong> the experiment<br />
was 11.4 cm (s.d.=0.5).<br />
The TS distribution <strong>of</strong> all valid measurements (Figure<br />
2) is rather narrow, ranging from 49 to 57 dB.<br />
By computing the mean <strong>of</strong> the acoustic backscattering<br />
cross-section, the corresponding mean TS was<br />
52.5 dB (vertical line in Figure 2).<br />
The swimming behaviour <strong>of</strong> a fish in an echo trace is<br />
shown in Figure 3. This fish moved approximately<br />
parallel to the alongship axis through the centre <strong>of</strong> the<br />
beam. The effect <strong>of</strong> tilt angle on TS for this trace<br />
Target <strong>strength</strong> (dB)<br />
–50<br />
–51<br />
–52<br />
–53<br />
–54<br />
–55<br />
Head up<br />
Head down<br />
–56<br />
30 20 10 0 –10 –20 –30 –40 –50<br />
Tilt angle (°)<br />
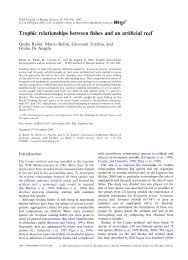
Figure 4. Successive <strong>target</strong>-<strong>strength</strong> observations (circles) in<br />
relation to estimated tilt angle during one echo trace (n=33).<br />
observation is estimated and plotted in Figure 4. For<br />
this <strong>single</strong> <strong>capelin</strong>, the dotted lines that connect the<br />
estimated points (circle) in Figure 4 suggest a maximum<br />
TS with near-horizontal swimming behaviour. The echo<br />
trace has about 5 dB range in TS.<br />
Discussion<br />
If the current TS-length relationship used for Barents<br />
Sea <strong>capelin</strong> surveys (equation 1) is applied, a mean TS <strong>of</strong><br />
53.8 dB for the 10 <strong>capelin</strong> that survived the experiment<br />
would be generated. This is 1.3 dB lower than<br />
estimated during the current measurements. This discrepancy<br />
could be due to differences in behaviour <strong>of</strong><br />
captive <strong>capelin</strong> compared with fish in the open ocean.<br />
Capelin in their natural environment may have a different<br />
tilt-angle distribution than in the net pen, and this<br />
could influence the mean TS (Olsen and Angell, 1983).<br />
Target <strong>strength</strong> in this experiment has been <strong>measured</strong><br />
close to the surface, whereas TS at greater depth may be<br />
lower owing to there being no compensation for<br />
the swimbladder during vertical migration (Ona, 1990).<br />
Furthermore, seasonal variations caused <strong>by</strong> the fat cycle<br />
and gonad development can effect the TS <strong>of</strong> fish such as<br />
herring Clupea harengus (Ona, 1990) and <strong>capelin</strong> (Rose,<br />
1998). These factors may cause the <strong>target</strong> <strong>strength</strong> <strong>of</strong> the<br />
lean post-spawning Balsfjord <strong>capelin</strong> to be different<br />
from that <strong>of</strong> Barents Sea <strong>capelin</strong> during the acoustic<br />
assessment survey in autumn, when <strong>capelin</strong> have a<br />
higher fat content. Reduced swimbladder size as a result<br />
<strong>of</strong> higher fat content may in fact lead to a reduced mean<br />
<strong>target</strong> <strong>strength</strong>. A general conclusion is, however, that,<br />
at surface levels, the <strong>target</strong> <strong>strength</strong> <strong>of</strong> <strong>capelin</strong> is lower<br />
than that <strong>of</strong> other species such as cod Gadus morhua and<br />
herring.
The bimodality <strong>of</strong> the TS distributions shown in<br />
Figure 2 may be related to up-and-down swimming<br />
behaviour <strong>of</strong> the <strong>capelin</strong> or differences in the acoustic<br />
backscattering properties for different fish in the group.<br />
The 30 dB<br />
range found in a similar experiment with mature herring<br />
(Zhao, 1996). At 38 kHz, the drop in <strong>target</strong> <strong>strength</strong><br />
attributable to changes in tilt angle is expected to be<br />
considerably smaller for a more omnidirectional backscattering<br />
<strong>target</strong> such as a 11 cm <strong>capelin</strong>, than for a<br />
30 cm herring (Nakken and Olsen, 1977). This is because<br />
the difference between fish length and the wavelength <strong>of</strong><br />
the transmitted sound at 38 kHz is smaller for <strong>capelin</strong><br />
than for herring.<br />
Acknowledgements<br />
We thank E. Ona and I. Svellingen (IMR) for technical<br />
assistance and for valuable comments on the manuscript.<br />
Special thanks to local fisher H. Frydenlund for<br />
catching the Balsfjord <strong>capelin</strong>, and to J. S. Christiansen<br />
and B. S. Sæther for keeping them in tanks and providing<br />
us with live material. We are grateful to L. P.<br />
Jørgensen and his crew at the fish farming plant at the<br />
Tromsø Aquaculture Research Station for all their various<br />
assistance. The Norwegian Research Council funded<br />
the study.<br />
References<br />
Brede, R., Kristensen, F. H., Solli, H., and Ona, E. 1990.<br />
Target tracking with a split-beam echo sounder. Rapports et<br />
Procès-Verbaux des Réunions du Conseil International pour<br />
l’Exploration de la Mer, 189: 254–263.<br />
Dalen, J., and Nakken, O. 1983. On the application <strong>of</strong> the echo<br />
integration method. ICES CM 1983/B: 19, 30 pp.<br />
Dalen, J., Raknes, A., and Røttingen, R. 1976. Target <strong>strength</strong><br />
measurements and acoustic biomass estimation <strong>of</strong> <strong>capelin</strong><br />
and 0-group fish. ICES CM 1976/B: 37, 9 pp.<br />
Dommasnes, A., and Røttingen, I. 1984. <strong>Acoustic</strong> stock<br />
measurements <strong>of</strong> the Barents Sea <strong>capelin</strong> 1972–1984, a<br />
review. In Proceedings <strong>of</strong> the Soviet-Norwegian Symposium<br />
<strong>Acoustic</strong> <strong>target</strong> <strong>strength</strong> <strong>of</strong> <strong>capelin</strong><br />
1085<br />
on the Barents Sea Capelin, pp. 45–63. Ed. <strong>by</strong> H. Gjøsæter.<br />
Institute <strong>of</strong> Marine Research, Bergen, Norway.<br />
Foote, K. G., and MacLennan, D. N. 1984. Comparison <strong>of</strong><br />
copper and tungsten carbide spheres. Journal <strong>of</strong> the<br />
<strong>Acoustic</strong>al Society <strong>of</strong> America, 75: 612–616.<br />
Foote, K. G., Aglen, A., and Nakken, O. 1986. Measurement<br />
<strong>of</strong> fish <strong>target</strong> <strong>strength</strong> with a split-beam echo sounder.<br />
Journal <strong>of</strong> the <strong>Acoustic</strong>al Society <strong>of</strong> America, 80: 612–621.<br />
Gjøsæter, H. 1998. The population biology and exploitation <strong>of</strong><br />
<strong>capelin</strong> (Mallotus villosus) in the Barents Sea. Sarsia, 83:<br />
453–496.<br />
Midling, K. Ø., Aas, K., Isaksen, B., Pettersen, J., and<br />
Jørgensen, S. H. 1998. A new design in transportation and<br />
net cage technology for live seafood and aquacultural<br />
purposes. ICES CM 1998/L: 15, 7 pp.<br />
Nakken, O., and Olsen, K. 1977. Target <strong>strength</strong> measurements<br />
<strong>of</strong> fish. Rapports et Procès-Verbaux des Réunions du Conseil<br />
International pour l’Exploration de la Mer, 170: 52–69.<br />
Olsen, K., and Angell, J. 1983. A comparison <strong>of</strong> different<br />
echo abundance conversion methods. ICES CM 1983/B: 17,<br />
12 pp.<br />
Ona, E. 1990. Physiological factors causing natural variations<br />
in acoustic <strong>target</strong> <strong>strength</strong> <strong>of</strong> fish. Journal <strong>of</strong> the Marine<br />
Biological Association <strong>of</strong> the United Kingdom, 70: 107–127.<br />
Ona, E., and Hansen, D. 1991. S<strong>of</strong>tware for <strong>target</strong> tracking<br />
with split beam echo sounders. User manual. Institute <strong>of</strong><br />
Marine Research, Bergen, Norway, October 1991. 21 pp.<br />
Ona, E., Zhao, X., Svellingen, I., and Foote, K. G. 1996. Some<br />
pitfalls <strong>of</strong> short-range standard-<strong>target</strong> calibration. ICES CM<br />
1996/B: 36, 18 pp.<br />
Reynisson, P. 1999. Split beam method. In Methodology for<br />
Target Strength Measurements, pp. 19–27. Ed. <strong>by</strong> E. Ona.<br />
ICES Cooperative Research Report, 235.<br />
Rose, G. A. 1998. <strong>Acoustic</strong> <strong>target</strong> <strong>strength</strong> <strong>of</strong> <strong>capelin</strong> in<br />
Newfoundland waters. ICES Journal <strong>of</strong> Marine Science, 55:<br />
918–923.<br />
SIMRAD. 1999. SIMRAD EY500 Portable Scientific Echo<br />
Sounder (Version 5.33). Instruction manual. SIMRAD,<br />
Norway. 243 pp.<br />
Toresen, R., Gjøsæter, H., and de Barros, P. 1998. The acoustic<br />
method as used in the acoustic abundance estimation <strong>of</strong><br />
<strong>capelin</strong> (Mallotus villosus Müller) and herring (Clupea<br />
harengus Linné) in the Barents Sea. Fisheries Research, 34:<br />
27–37.<br />
Wilkinson, L. 1999. Manuals. SYSTAT 9.0. SPSS Inc. 2469 pp.<br />
Zhao, X. 1996. Target <strong>strength</strong> <strong>of</strong> herring (Clupea harengus L.)<br />
<strong>measured</strong> <strong>by</strong> the split-beam tracking method. Masters thesis,<br />
Department <strong>of</strong> Fisheries and Marine Biology, Bergen.<br />
103 pp.