The Discrete Time Footloose Capital Model - School of Social ...
The Discrete Time Footloose Capital Model - School of Social ...
The Discrete Time Footloose Capital Model - School of Social ...

Create successful ePaper yourself
Turn your PDF publications into a flip-book with our unique Google optimized e-Paper software.
Economics<br />
Discussion Paper<br />
EDP-0502<br />
Chaotic <strong>Footloose</strong> <strong>Capital</strong><br />
by<br />
P Commendatorea, M Currie and I Kubinc<br />
<strong>School</strong> <strong>of</strong> <strong>Social</strong> Sciences,<br />
<strong>The</strong> University <strong>of</strong> Manchester<br />
Oxford Road<br />
Manchester M13 9PL<br />
United Kingdom<br />
Combining the strengths <strong>of</strong> UMIST and<br />
<strong>The</strong> Victoria University <strong>of</strong> Manchester<br />
January 2005
Chaotic <strong>Footloose</strong> <strong>Capital</strong><br />
By Pasquale Commendatore a , Martin Currie b and Ingrid Kubin c<br />
a University <strong>of</strong> Naples ‘Federico II’, Italy<br />
b <strong>School</strong> <strong>of</strong> <strong>Social</strong> Sciences, University <strong>of</strong> Manchester, UK<br />
c Department <strong>of</strong> Economics, Vienna University <strong>of</strong> Economics and Business Administration,<br />
Austria<br />
Abstract<br />
This paper examines the long-term behaviour <strong>of</strong> a discrete-time <strong>Footloose</strong><br />
<strong>Capital</strong> model, where capitalists, who are themselves immobile between<br />
regions, move their physical capital between regions in response to economic<br />
incentives. <strong>The</strong> spatial location <strong>of</strong> industry can exhibit cycles <strong>of</strong> any periodicity<br />
or behave chaotically. Long-term behaviour is highly sensitive to transport costs<br />
and to the responsiveness <strong>of</strong> capitalists to pr<strong>of</strong>it differentials. <strong>The</strong> concentration<br />
<strong>of</strong> industry in one region can result from high transport costs or from rapid<br />
responses by capitalists. In terms <strong>of</strong> possible dynamical behaviours, the<br />
discrete-time model is much richer than the standard continuous-time <strong>Footloose</strong><br />
<strong>Capital</strong> model.<br />
JEL classification: F20 ; R1 ; R12<br />
Keywords: core-periphery, footloose capital, dynamics, chaos<br />
Corresponding author:<br />
Dr. Martin Currie<br />
<strong>School</strong> <strong>of</strong> <strong>Social</strong> Sciences<br />
<strong>The</strong> University <strong>of</strong> Manchester<br />
Manchester, M13 9PL<br />
UK<br />
martin.currie@man.ac.uk
Chaotic <strong>Footloose</strong> <strong>Capital</strong><br />
This paper examines the long-term behaviour <strong>of</strong> a discrete-time <strong>Footloose</strong><br />
<strong>Capital</strong> model, where capitalists, who are themselves immobile between<br />
regions, move their physical capital between regions in response to<br />
economic incentives. <strong>The</strong> spatial location <strong>of</strong> industry can exhibit cycles <strong>of</strong><br />
any periodicity or behave chaotically. Long-term behaviour is highly<br />
sensitive to transport costs and to the responsiveness <strong>of</strong> capitalists to pr<strong>of</strong>it<br />
differentials. <strong>The</strong> concentration <strong>of</strong> industry in one region can result from<br />
high transport costs or from rapid responses by capitalists. In terms <strong>of</strong><br />
possible dynamical behaviours, the discrete-time model is much richer than<br />
the standard continuous-time <strong>Footloose</strong> <strong>Capital</strong> model.<br />
1. Introduction<br />
<strong>The</strong> <strong>Footloose</strong> <strong>Capital</strong> model focuses on the spatial location <strong>of</strong> industry, where capitalists,<br />
who are themselves immobile, move their physical capital between countries or regions in<br />
response to economic incentives. Introduced by Martin and Rogers (1995), the <strong>Footloose</strong><br />
<strong>Capital</strong> (FC) model is a variant <strong>of</strong> the influential Core-Periphery (CP) model developed by<br />
Krugman (1991a, 1991b). <strong>The</strong> FC model plays a prominent role in Economic Geography<br />
and Public Policy by Baldwin et al. (2003). Its attractions are two-fold. First, it is more<br />
applicable to the case where the two regions are different nations than is the standard CP<br />
model in which the footloose factor is labour. Accordingly, the FC model features<br />
2
particularly in the trade chapters <strong>of</strong> Baldwin et al. Second, it is much more tractable<br />
analytically than the standard CP model. This is due to the fact that capital earnings are<br />
repatriated and spent in the region in which the capital owners live. Since production<br />
changes brought about by the movements <strong>of</strong> capital are not accompanied by expenditure<br />
switching, the demand-linked circular causality that features in the Core-Periphery model<br />
does not arise. Furthermore, since costs-<strong>of</strong>-living are irrelevant to the production location<br />
decisions <strong>of</strong> capitalists, the cost-linked circular causality <strong>of</strong> the Core-Periphery model is<br />
eliminated.<br />
Currie and Kubin (2005) show that reformulating the standard continuous-time symmetric<br />
Core-Periphery (CP) model in discrete time has pr<strong>of</strong>ound implications for its dynamical<br />
behaviour. In this paper, we explore the implications <strong>of</strong> specifying the much simpler FC<br />
model in discrete time. We consider not only the case <strong>of</strong> symmetric regions but also some<br />
implications <strong>of</strong> regional asymmetries. We set out the assumptions <strong>of</strong> the discrete-time FC<br />
model in Section 2. In Section 3, we characterize a short-run general equilibrium contingent<br />
on the regional allocation <strong>of</strong> capital. In Section 4, we complete the model by specifying the<br />
capital migration process, and we identify the fixed points <strong>of</strong> the dynamical model. In<br />
Section 5, we explore the complex dynamical behaviour for the case <strong>of</strong> symmetric regions,<br />
where each region has the same number <strong>of</strong> workers and where the owners <strong>of</strong> half the capital<br />
are located in each region. In Section 6, we identify some dynamical implications <strong>of</strong><br />
exogenous regional asymmetries. Section 7 concludes.<br />
2. Assumptions<br />
<strong>The</strong>re are two regions, each with a monopolistically competitive manufacturing sector and a<br />
perfectly competitive agricultural sector. <strong>Capital</strong> is used only in manufacturing. <strong>The</strong>re are,<br />
in total, K units <strong>of</strong> physical capital. <strong>The</strong> share <strong>of</strong> physical capital that is owned by capitalists<br />
3
located in region 1 is denoted by s K . <strong>Capital</strong> is mobile between the regions at the transitions<br />
between time periods in response to economic incentives. Labour – the only other factor <strong>of</strong><br />
production – is used in both sectors. <strong>The</strong>re are, in total, L workers, who are immobile<br />
between regions but instantaneously mobile between sectors within a region. <strong>The</strong> share <strong>of</strong><br />
workers located in region 1 is denoted by s L . Each worker provides one unit <strong>of</strong> labour per<br />
period.<br />
Consumers in both regions have Cobb-Douglas preferences over the homogeneous<br />
agricultural good and a quantity index that is a CES function <strong>of</strong> the varieties <strong>of</strong><br />
manufactured goods. <strong>The</strong> exponents <strong>of</strong> the agricultural good and <strong>of</strong> the manufacturing<br />
composite in the common utility function – and hence the invariant shares <strong>of</strong> income<br />
devoted to the agricultural good and to manufactures – are ( 1 µ ) and µ, respectively. <strong>The</strong><br />
constant elasticity <strong>of</strong> substitution between the manufactured varieties is denoted by > 1;<br />
the lower , the greater the consumers’ taste for variety.<br />
With labour being the sole agricultural input, one unit <strong>of</strong> labour yields one unit <strong>of</strong> the<br />
agricultural product. We assume that neither region has enough labour to satisfy the total<br />
demand <strong>of</strong> both regions for the agricultural good. Thus both regions always produce the<br />
agricultural commodity – the so-called non-full-specialization condition. Transportation <strong>of</strong><br />
the agricultural product between regions is costless.<br />
Manufacturing involves increasing returns: each manufacturer requires a fixed input <strong>of</strong> 1<br />
unit <strong>of</strong> capital to operate and has a constant marginal labour requirement . Transport costs<br />
for manufactures take an iceberg form: if 1 unit is shipped between the regions, 1 T arrives<br />
where T 1.<br />
‘Trade freeness’ is defined as<br />
1<br />
T where 0< 1,<br />
with = 1<br />
representing no trade cost and with trade cost becoming prohibitive as 0 . <strong>The</strong><br />
4
manufacturing sectors involve Dixit-Stiglitz monopolistic competition. Given the<br />
consumers’ preference for variety and the increasing returns, a firm would always produce a<br />
variety different from the varieties produced by other firms. Thus the number <strong>of</strong> varieties is<br />
always the same as the number <strong>of</strong> firms. Furthermore, since 1 unit <strong>of</strong> capital is required for<br />
each manufacturing firm, the total number <strong>of</strong> firms / varieties, n, is always equal to the total<br />
supply <strong>of</strong> capital:<br />
(1) n= K<br />
<strong>The</strong> number <strong>of</strong> varieties produced in period t in region r, where r = 1, 2 , is:<br />
(2) = = = ( ) = ( )<br />
where 0 1<br />
t<br />
n1, t tn tK n2, t 1 t n 1 t K<br />
denotes the share <strong>of</strong> physical capital used in region 1 in period t.<br />
As with most economic geography models, the primary focus <strong>of</strong> the FC model is the spatial<br />
location <strong>of</strong> manufacturing industry, governed here by the endogenous regional allocation <strong>of</strong><br />
capital. In Section 3, we characterize a short-run general equilibrium in period t contingent<br />
on t . In Section 4, we complete the dynamical model by specifying the capital migration<br />
process. An accepted tension in the standard CP model, where the inter-regionally mobile<br />
factor is labour, concerns the labour migration assumption. All workers are assumed<br />
identical; yet at the transition between periods some but not all workers migrate in response<br />
to wage differences. This issue has been addressed by Puga (1998), in terms <strong>of</strong> the arrival <strong>of</strong><br />
opportunities to migrate and random migration costs, and by Baldwin et al. (2003), on the<br />
basis <strong>of</strong> utility maximizing households who, facing costly migration, divide their working<br />
time between the regions. Whereas the idea <strong>of</strong> workers dividing their time between regions<br />
is somewhat disconcerting, the notion <strong>of</strong> capitalists diversifying their physical capital<br />
5
etween regions is perfectly natural. Accordingly, when considering the location <strong>of</strong><br />
physical capital, we adopt the device <strong>of</strong> a representative capitalist, who alters the regional<br />
allocation <strong>of</strong> his capital in response to economic incentives. Thus t is the share <strong>of</strong> the<br />
representative capitalist’s physical capital that is located in region 1 in period t.<br />
3. Short-run General Equilibrium<br />
With the instantaneous establishment <strong>of</strong> equilibrium in the agricultural market and no<br />
transport costs, the agricultural price is the same in both regions. Since competition results<br />
in zero agricultural pr<strong>of</strong>its, the equilibrium nominal wage <strong>of</strong> workers in period t is equal to<br />
the agricultural product price and is therefore always the same in both regions. We take this<br />
wage / agricultural price as the numeraire. Since manufacturers in both regions face that<br />
same wage in every period, all set the same mill price p , using the Dixit-Stiglitz pricing<br />
rule. Given that the wage is 1, the local price <strong>of</strong> every variety is:<br />
(3)<br />
<strong>The</strong> effective price paid by consumers for a variety produced in the other region is pT .<br />
p =<br />
Short-run general equilibrium in period t requires that each manufacturer meets the demand<br />
for its variety. 1 For a variety produced in region r:<br />
(4) qrt , = drt<br />
,<br />
1 As a result <strong>of</strong> Walras’ Law, simultaneous equilibrium in all product markets implies equilibrium in the<br />
regional labour markets.<br />
1<br />
6
where qrt , is the output <strong>of</strong> each manufacturer in region r and rt ,<br />
d is the demand for that<br />
manufacturer’s variety. From (3), the short-run equilibrium pr<strong>of</strong>it per variety in region r is:<br />
(5)<br />
pq<br />
= pq q = = q<br />
1<br />
rt ,<br />
rt , rt , rt , rt ,<br />
This pr<strong>of</strong>it per variety constitutes the regional pr<strong>of</strong>it or rental per unit <strong>of</strong> capital. Total<br />
(‘world’) income, denoted by Y 1+ 2,<br />
comprises wages and pr<strong>of</strong>its and is invariant over time.<br />
Since total expenditure is equal to total income, expenditure on the agricultural product is<br />
( 1 µ ) Y1+<br />
2;<br />
the non-full-specialization condition for agriculture is that the latter exceed<br />
{ L ( L)<br />
}<br />
max sL, 1 s L . Expenditure on manufactures is µ Y1+<br />
2.<br />
Since, from (5), pr<strong>of</strong>it equals<br />
the value <strong>of</strong> sales times 1 , the total pr<strong>of</strong>it received by capitalists is µ Y1+<br />
2<br />
given the unit wage, total income is ( µ )<br />
Y = L+ Y , so that:<br />
1+ 2 1+ 2<br />
(6) Y1+<br />
2=<br />
L<br />
µ<br />
. <strong>The</strong>refore,<br />
Total pr<strong>of</strong>it is therefore µ L ( µ ) . Given that all pr<strong>of</strong>its are repatriated to capitalists and<br />
given that each capitalist receives the average pr<strong>of</strong>it, the regional incomes are:<br />
(7)<br />
( )<br />
Y1= sLL+ sK µ sL L= µ<br />
µ + sKµ<br />
L= µ<br />
sL µ<br />
+ sK µ<br />
Y1+ 2= sYY1+ 2<br />
Y = ( 1 s ) L+ ( 1 s )<br />
µ<br />
L= µ<br />
( 1 s )<br />
µ<br />
+ ( 1 s<br />
µ<br />
) Y = ( 1 s ) Y<br />
2 L K L K 1+ 2 Y 1+ 2<br />
where Yr is the nominal income in region r and where region 1’s share in total income (and<br />
in total expenditure) is:<br />
µ µ<br />
(8) sY = sL +<br />
sK<br />
7
Whereas these nominal regional incomes are invariant over time, real regional incomes<br />
depend on costs-<strong>of</strong>-living and, thus, indirectly on the spatial location <strong>of</strong> industry. <strong>The</strong><br />
regional manufacturing price indices facing consumers are given by:<br />
(9)<br />
1, t = 1, t<br />
1<br />
+ 2, t<br />
1 1<br />
1<br />
1 = t + ( 1 t)<br />
1<br />
1<br />
1<br />
1<br />
2, t = 1, t<br />
1 1<br />
+ 2, t<br />
1<br />
1<br />
1 = t + ( 1 t)<br />
1<br />
1<br />
1<br />
1<br />
G n p n p T n p<br />
G n p T n p n p<br />
With less than perfectly free trade, the cost-<strong>of</strong>-living is lower in region 1 than in region 2<br />
[i.e., G1, t G2,<br />
t<br />
< ] if and only if it has a larger manufacturing sector [i.e., > 12].<br />
<strong>The</strong><br />
demand per variety in each region is:<br />
(10)<br />
From (4), (9) and (10):<br />
(11)<br />
( 1 )<br />
d = µ YG + µ YG p = s G + s G p µ Y<br />
1 1 1 1<br />
1, t 1 1, t 2 2, t Y 1, t Y 2, t<br />
1+ 2<br />
( 1 )<br />
d = µ YG + µ Y G p = s G + s G p µ Y<br />
1 1 1 1<br />
2, t 1 1, t 2 2, t Y 1, t Y 2, t<br />
1+ 2<br />
sY 1 sY µ Y<br />
q1, t = d1,<br />
t = +<br />
+ + np<br />
( 1 ) ( 1 )<br />
t t t t<br />
( 1 ) ( 1 )<br />
1+ 2<br />
sY 1 sY µ Y<br />
q2, t = d2,<br />
t = +<br />
+ + np<br />
t t t t<br />
From (1), (5), (6) and (11), the short-run equilibrium pr<strong>of</strong>its per variety / per unit <strong>of</strong> capital<br />
are:<br />
(12)<br />
1, t<br />
2, t<br />
s 1 s<br />
= +<br />
+ +<br />
Y Y<br />
( 1 ) ( 1 )<br />
t t t t<br />
s 1 s<br />
= +<br />
+ +<br />
Y Y<br />
( 1 ) ( 1 )<br />
t t t t<br />
where is the average pr<strong>of</strong>it per unit <strong>of</strong> capital:<br />
1+ 2<br />
t<br />
8
(13)<br />
=<br />
µ L<br />
( µ )<br />
Given the regional allocation <strong>of</strong> capital t , expression (12) determines uniquely the short-<br />
run equilibrium regional pr<strong>of</strong>its. 2 In a core-periphery state where 0<br />
t<br />
K<br />
= or = 1,<br />
the pr<strong>of</strong>it<br />
per unit <strong>of</strong> capital in the core is and the ‘virtual’ pr<strong>of</strong>it in the periphery is<br />
( 1 )<br />
s + s . With perfectly free trade [ = 1],<br />
location does not matter:<br />
1<br />
Y Y<br />
= = for 0 1.<br />
1, t 2, t<br />
t<br />
4. <strong>Capital</strong> Movements and the Complete Dynamical <strong>Model</strong><br />
<strong>The</strong> representative capitalist alters his allocation <strong>of</strong> physical capital in response to the<br />
regional difference in pr<strong>of</strong>its. Since pr<strong>of</strong>it is spent in the region in which the capitalist<br />
concerned lives, costs-<strong>of</strong>-living do not impact on the capital allocation decision. From (12),<br />
the difference in (nominal) pr<strong>of</strong>its is determined uniquely by the allocation <strong>of</strong> capital at the<br />
beginning <strong>of</strong> period t:<br />
(14) ( )<br />
For 1<br />
< , ( )<br />
t<br />
= ! =<br />
1, t 2, t t<br />
! is monotonically declining:<br />
(15) " ( )<br />
s 1 s<br />
+ +<br />
Y Y<br />
( 1 ) ( 1 )<br />
t t t t<br />
Y Y<br />
t + ( 1 t) 2<br />
t + ( 1<br />
2<br />
t)<br />
( 1 )<br />
s 1 s<br />
! = + 1 < 0<br />
t<br />
( ) 2<br />
2 In contrast, for the CP model, the dependence <strong>of</strong> regional expenditures on the spatial allocation <strong>of</strong> the mobile<br />
factor means that closed-form solutions are not possible.<br />
t<br />
9
As with the standard continuous-time core-periphery model and its variants, our<br />
specification <strong>of</strong> the migration process is essentially ad hoc. We invoke a discrete-time<br />
counterpart <strong>of</strong> the process assumed by Baldwin et al. (2003, p. 72) in their continuous-time<br />
FC model. Taking into account the constraint 0 t+ 1 1,<br />
the piecewise smooth one-<br />
dimensional map whereby t+ 1 is determined by t is:<br />
(16) ( )<br />
if M ( t ) <<br />
( ) ( )<br />
if M ( )<br />
# 0 0<br />
$<br />
= Z =% M if 0 M 1<br />
$<br />
& 1 t > 1<br />
t+ 1 t t t<br />
where t is in [0,1] implies that t+ 1 is in [0,1] and where<br />
(17) M ( ) = + ( 1 ) ' ( ) = + ( 1 ) ' ! ( )<br />
t t t t 1, t 2, t t t t t<br />
with ' > 0 . We refer to ' as the ‘speed’ with which the representative capitalist alters his<br />
regional allocation <strong>of</strong> capital in response to economic incentives. <strong>The</strong> supposition that he<br />
does not always immediately shift all his capital to the region with the higher pr<strong>of</strong>it –<br />
however small the differential – could be justified in terms <strong>of</strong> adjustment costs. Thus, given<br />
static expectations, the representative capitalist’s maximand would be:<br />
(18) + ( 1 )<br />
( (<br />
1, t t+ 1 2, t t+<br />
1<br />
( t+ 1<br />
2<br />
t)<br />
c ( )<br />
2 1<br />
t t<br />
where ( denotes the capital owned by the representative capitalist and where adjustment<br />
costs are quadratic with c > 0 . 3 Rearranging the first-order condition for an interior<br />
3 This rationale follows that applied by Baldwin et al. (2003, p. 55) to the labour allocation decisions <strong>of</strong> a<br />
household in the CP model where labour is the inter-regionally mobile factor.<br />
10
maximum gives (17), where ' = ( c . However, since these adjustment costs do not involve<br />
the use <strong>of</strong> real resources, we would not wish to rely on this interpretation <strong>of</strong> the migration<br />
process. Alternatively, ' could be interpreted as a behavioural parameter that reflects the<br />
degree <strong>of</strong> cautiousness <strong>of</strong> the representative capitalist.<br />
If Z ( * ) = * , then * is a fixed point for the dynamical system. Such fixed points<br />
correspond to stationary long-run equilibria. <strong>The</strong> local stability properties <strong>of</strong> a fixed point<br />
* depend on the stability coefficient:<br />
(19) Z" ( * ) = M" ( * ) = 1 + * ( 1 * ) ' ! " ( * ) + ( 1 2 * ) ' ! ( * )<br />
i.e., the first derivative <strong>of</strong> Z ( t ) evaluated at * . With perfectly free trade [i.e., = 1],<br />
all<br />
regional capital allocations are fixed points. <strong>The</strong>refore, we assume henceforth that < 1.<br />
Since capital does not move to a region with no manufacturing sector in the previous<br />
period, the concentration <strong>of</strong> all manufacturing in one (either) region is necessarily a fixed<br />
point. That is, from (16), Z ( 0) = 0 and Z (1) = 1 . We refer to = 0 and = 1 as the core-<br />
periphery fixed points. Since capital migration does not occur when regional pr<strong>of</strong>its are<br />
equal, * is a fixed point if ( * ) 0<br />
! = . Since ! ( ) is monotonically declining, there<br />
can be at most one interior fixed point * . If an interior fixed point * exists, then, from<br />
(14), equality <strong>of</strong> pr<strong>of</strong>its implies that the long-run equilibrium share is:<br />
(20)<br />
1 1+ 1<br />
* = + sY<br />
2 1 2<br />
Using (8), * depends on the regional shares in factor endowments, sL and s K :<br />
(21)<br />
1 1+ µ 1 µ 1<br />
* = + sL +<br />
sK<br />
2 1 2 2<br />
t<br />
11
An interior fixed point need not exist if there is an asymmetry in regional incomes. Suppose<br />
that region 1 is larger, i.e., s Y > 12.<br />
As trade freeness increases, region 1’s long-run<br />
equilibrium share <strong>of</strong> capital use increases until * = 1.<br />
Solving (20) for * = 1 gives the<br />
critical level <strong>of</strong> at and above which there does not exist an interior fixed point:<br />
(22) CP1<br />
1 sY<br />
=<br />
s<br />
Analogously, if s Y < 12,<br />
solving (20) for * = 0 gives the critical level <strong>of</strong> trade freeness,<br />
( 1 )<br />
= s s , at and below which there does not exist an interior fixed point.<br />
CP2 Y Y<br />
<strong>The</strong> discrete-time map Z ( t ) can exhibit complex dynamical behaviour. ( t )<br />
Y<br />
Z is non-<br />
invertible, i.e., in general, t cannot be uniquely determined from t+ 1.<br />
Given the initial<br />
condition 0<br />
, the orbit <strong>of</strong> the system is uniquely determined. <strong>The</strong> first iterate is Z ( )<br />
( )<br />
the second iterate is = Z( ) = Z Z(<br />
) ; and so on. Letting [ ] n<br />
( )<br />
2 1 0<br />
[ n 1]<br />
Z( Z ( 0 ) ) , the system’s orbit is ( )<br />
Z ( * ) = * , then * is a fixed point. If<br />
[ ] ( )<br />
[ ] ( )<br />
2 3<br />
0 0 0 0<br />
= ;<br />
1 0<br />
Z denote<br />
, Z , Z , Z , … As noted above, if<br />
[ k]<br />
Z ( ) = and if k is the smallest such positive<br />
integer, is a periodic point <strong>of</strong> period k and the orbit with initial point is a period-k<br />
orbit. 4 A chaotic orbit is a bounded, non-periodic orbit that displays sensitive dependence<br />
on the initial condition. 5 Sensitive dependence means that orbits that begin as close together<br />
4<br />
A fixed point <strong>of</strong> Z ( t ) is a period-1 orbit. If is a periodic point <strong>of</strong> period k, it is a fixed point <strong>of</strong><br />
Where we refer to a ‘fixed point’, we always have in mind a fixed point <strong>of</strong> Z ( t ) .<br />
5 See Alligood et al. (1996, Chapter 1).<br />
0<br />
[ k]<br />
( )<br />
Z .<br />
t<br />
12
as desired eventually move apart. <strong>The</strong> basin <strong>of</strong> attraction <strong>of</strong> an attractor is the set <strong>of</strong> initial<br />
conditions 0<br />
5. Symmetric Regions<br />
with orbits that approach the attractor.<br />
5.1. Implications <strong>of</strong> Regional Symmetry<br />
Symmetry <strong>of</strong> the regions means here that they have the same factor endowments, which<br />
implies equal nominal regional incomes and expenditures. Given s = s = s = 12,<br />
the<br />
pr<strong>of</strong>it difference (14) simplifies to:<br />
(23) ( )<br />
= ! =<br />
1, t 2, t t<br />
For < 1,<br />
regional symmetry implies:<br />
(24) ( )<br />
( ) ( )<br />
( 1 )<br />
1 1<br />
+ 1 + 1 2<br />
t t t t<br />
2 2<br />
( 1 )<br />
( 1 )<br />
( ) ( )<br />
L K Y<br />
! 0 = > 0 ! 1 2 = 0 ! 1 = < 0<br />
2 2<br />
From (23), regional symmetry also implies:<br />
(25) ! ( 1 t) = ! ( t)<br />
Since the numbering <strong>of</strong> regions is irrelevant:<br />
(26) ( 1 t+ 1)<br />
= M ( 1 t)<br />
( 1 t+ 1)<br />
= Z ( 1 t)<br />
It is easily confirmed that (25) and (26) imply the following symmetry property:<br />
(27) M ( ) = 1 M ( 1 ) Z( ) =<br />
1 Z(<br />
1 )<br />
t t<br />
t t<br />
13
<strong>The</strong> symmetry <strong>of</strong> Z ( t ) has crucial implications for the system’s dynamical properties.<br />
Symmetry Proposition<br />
Given a period-k orbit, either that orbit is symmetric with respect to = 12 or<br />
there exists a period-k orbit that is symmetric to it. In the former case, the orbit’s<br />
basin <strong>of</strong> attraction is symmetric with respect to = 12;<br />
in the latter case, the<br />
basins <strong>of</strong> attraction <strong>of</strong> the two orbits are symmetric with respect to each other.<br />
With symmetric regions, the map Z ( t ) possesses the same three fixed points for any<br />
< 1.<br />
In addition to the core-periphery fixed points = 0 and = 1,<br />
there is necessarily a<br />
symmetric fixed point 12<br />
= , i.e., ( )<br />
! 12 = 0 implies Z ( 12) = 12.<br />
Thus the Symmetry<br />
Proposition is confirmed for k = 1:<br />
a fixed point is either symmetric, i.e., = 12,<br />
or the<br />
symmetric one also exists, i.e., Z ( * ) = * implies ( )<br />
periphery fixed points.<br />
Z 1 * = 1 * for the core-<br />
<strong>The</strong> core-periphery fixed points = 0 and = 1 are unstable for < 1,<br />
since (19), (24) and<br />
(25) imply:<br />
(28) Z" ( ) ' ( ) ' ( ) Z"<br />
( )<br />
0 = 1+ ! 0 = 1 ! 1 = 1 > 1<br />
From (15), (19) and (24), the symmetric fixed point = 12is<br />
locally stable if and only if:<br />
(29) Z"<br />
( ) " ( )<br />
'<br />
1<br />
12 = 1+ ! 12 = 1 ' 1<br />
4 1+<br />
2<br />
14
5.2. Comparative Dynamics<br />
With symmetric regions, the system’s dynamical behaviour depends on the migration speed<br />
' , on trade freeness and on the average pr<strong>of</strong>it per unit <strong>of</strong> capital . That the migration<br />
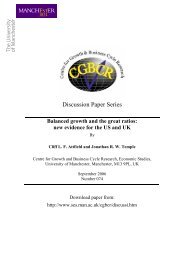
speed matters in a discrete-time system is natural. Figure 1 shows the map Z ( t )<br />
corresponding to two speeds, ' P and ' A , where ' A > 'P.<br />
Graphically, the symmetry<br />
property Z( ) 1 Z(<br />
1 )<br />
= means that rotating the diagram through<br />
t t<br />
0<br />
180 results in the<br />
same map. An increase in the speed ‘stretches’ the map, without affecting the fixed points.<br />
<strong>The</strong> maps in Figure 1 are based on critical speeds. 6 For ' < 'P,<br />
the symmetric fixed point is<br />
an attractor. As ' increases through ' P , where Z" ( 12) = 1,<br />
the symmetric fixed point<br />
becomes unstable and a period-doubling bifurcation occurs. Further increases in speed give<br />
rise to orbits <strong>of</strong> every periodicity and to chaotic behaviour. Long-term behaviour is hyper-<br />
sensitive with respect both to the speed ' and to the initial point 0 . At ' = ' A , the iterate<br />
<strong>of</strong> the interior maximum <strong>of</strong> (16) is 1 and the iterate <strong>of</strong> the interior minimum is 0. For<br />
' > ' A , the responses <strong>of</strong> capitalists are sufficiently rapid (adjustment costs are sufficiently<br />
low) that agglomeration in one <strong>of</strong> the regions occurs for almost all initial points. At the<br />
resulting core-periphery fixed point, the virtual pr<strong>of</strong>it in the periphery exceeds the pr<strong>of</strong>it in<br />
the core.<br />
Instead <strong>of</strong> elaborating on the foregoing claims regarding the impact <strong>of</strong> the migration speed,<br />
we consider in more detail the impact <strong>of</strong> trade freeness, since the latter is the main pre-<br />
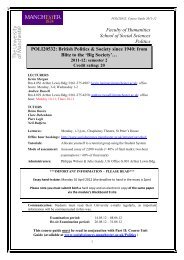
occupation in core-periphery-type models. Figure 2 is a bifurcation diagram (or orbit<br />
diagram) that shows the impact <strong>of</strong> trade freeness on the qualitative nature <strong>of</strong> the system’s<br />
6<br />
In Figure 1, which is based on = 0.5 and 40<br />
= , the critical speeds are ' = 0.45 and ' + 0.874 .<br />
P<br />
A<br />
15
1<br />
t+ 1<br />
0<br />
0<br />
P<br />
Figure 1<br />
A<br />
12<br />
t+ 1 t = show the dependence <strong>of</strong><br />
region 1’s share <strong>of</strong> capital use in period t + 1 on its share in period t for two<br />
> .<br />
With symmetric regions, the maps Z ( )<br />
capital mobility speeds, P and A , where A P<br />
t<br />
1
egion 1's capital share<br />
1<br />
0<br />
Figure 2<br />
0.35 A<br />
Q<br />
P 0.55<br />
trade freeness<br />
Bifurcation diagram showing the impact <strong>of</strong> trade freeness on the long-run<br />
behaviour <strong>of</strong> region 1’s share <strong>of</strong> capital use t .
orbit. For levels <strong>of</strong> trade freeness in the range 0.35 0.55 , it plots the orbit<br />
[ t]<br />
( )<br />
Z for<br />
1001 t 3000,<br />
where the first 1000 iterations are discarded in order to focus on long-term<br />
behaviour. It is based on = 40 , ' = 0.5 , and 0 = 0.499,<br />
i.e., each orbit starts close to the<br />
symmetric fixed point. In the ensuing discussion <strong>of</strong> the impact <strong>of</strong> a ceteris paribus change<br />
in<br />
1<br />
T , the latter change should be interpreted as being due to a change in T, since a<br />
change in would also change . For > P + 0.519 , the symmetric fixed point = 12<br />
is an attractor for any 0 in ( 0,1 ) . As falls through P , where ( )<br />
Z" 12 = 1,<br />
= 12<br />
becomes unstable and a period-doubling (or flip) bifurcation gives rise to a period-2 orbit<br />
symmetric around = 12.<br />
As falls through Q , a pitchfork bifurcation <strong>of</strong> the second<br />
iterate implies that the period-2 orbit becomes unstable and two attracting period-2 orbits<br />
emerge. As falls further, orbits <strong>of</strong> every periodicity and chaotic behaviour occur.<br />
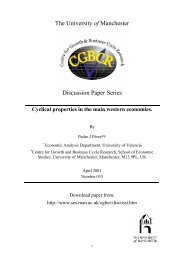
That the long-term asymmetric coexistence <strong>of</strong> manufacturing in both regions is possible is<br />
confirmed by Figure 3. It shows two attracting period-3 orbits, A1 and A2, for = 0.39587 .<br />
<strong>The</strong> existence <strong>of</strong> a period-3 orbit is particularly significant: it guarantees that there are<br />
periodic orbits <strong>of</strong> all (integer) periods. In accordance with the Symmetry Proposition, the<br />
attractors A1 and A2 are symmetric with respect to each other. That is, for A1, region 1 cycles<br />
between " , "" and """ and region 2 cycles between ( 1 " ) , ( 1 "" ) and ( 1 """ ) ,<br />
whereas the converse applies for A2. In terms <strong>of</strong> their real incomes, workers and capitalists<br />
in region 1 would be significantly better-<strong>of</strong>f on A2 than on A1. <strong>The</strong> basins <strong>of</strong> attraction <strong>of</strong> A1<br />
and A2 are symmetric with respect to each other; that is, if the orbit from initial point 0 is<br />
attracted to A1, the orbit from initial point ( 1 0 ) must be attracted to A2. Each basin<br />
comprises an infinite number <strong>of</strong> intervals separated by the periodic points <strong>of</strong> the repelling<br />
0<br />
16
t+ 1<br />
1<br />
0<br />
0<br />
Figure 3<br />
A2<br />
t<br />
With symmetric regions, two period-3 attractors that are symmetric with<br />
respect to each other.<br />
A1<br />
1
period-k orbits ( k , 3 ) and by their preimages <strong>of</strong> any rank. <strong>The</strong>re are infinitely many initial<br />
points which exhibit sensitive dependence on initial conditions. 7<br />
That long-term behaviour can be hyper-sensitive to small changes in trade freeness is<br />
confirmed by the presence <strong>of</strong> ‘windows’ in the bifurcation diagram: a miniscule change in<br />
can abruptly alter long-term behaviour from, say, an orbit <strong>of</strong> very low periodicity to an<br />
orbit <strong>of</strong> very high periodicity or even to chaotic behaviour. Furthermore, a small reduction<br />
in can result in an abrupt change from chaotic behaviour to agglomeration in one region.<br />
This occurs in Figure 2 when falls through A + 0.393,<br />
the latter being the level <strong>of</strong><br />
below which agglomeration occurs for almost all initial conditions. At = A , for which the<br />
iterate <strong>of</strong> the interior maximum <strong>of</strong> (16) is 1 and the iterate <strong>of</strong> the interior minimum is 0,<br />
there exist periodic orbits <strong>of</strong> every period, and every point in [0,1] has sensitive dependence<br />
on initial conditions. 8 For < A , trade costs are sufficiently high that, for almost all initial<br />
points (i.e., except for an invariant Cantor set <strong>of</strong> points <strong>of</strong> zero measure 9 ), the system sooner<br />
or later converges on either = 0 or = 1.<br />
At such a core-periphery fixed point, the pr<strong>of</strong>it<br />
in the core is less than the virtual pr<strong>of</strong>it in the periphery. If such a core-periphery<br />
equilibrium is subjected to a small disturbance, the system may be attracted back to that<br />
particular fixed point or it may be attracted to the other core-periphery fixed points. Figure<br />
7 On the implications <strong>of</strong> the existence <strong>of</strong> a period-3 orbit, see Alligood et al. (1996, Chapter 1).<br />
8<br />
This can be shown by applying to the FC map for = A the same methods that Alligood et al. (1996,<br />
Chapter 1) use to demonstrate these properties for the logistic map G( x) 4x( 1 x)<br />
= .<br />
9 Identifying the set <strong>of</strong> initial points whose orbits do not converge on a core-periphery fixed point would be<br />
similar to identifying the set <strong>of</strong> points whose orbits remain in ( 0,1) for the logistic G( x) µ x( 1 x)<br />
µ > 4 . On the latter, see Devaney (1989, p. 35).<br />
= where<br />
17
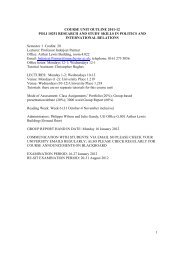
t+ 1<br />
1<br />
0<br />
Map Z ( )<br />
Figure 4<br />
0 1<br />
t+ 1 t = for a case where > A . From , agglomeration occurs<br />
in region 2; from , agglomeration occurs in region 1.<br />
t
4, based on = 0.3917 , assumes that all manufacturing is concentrated in region 2 but that,<br />
for whatever reason, a ‘small’ proportion <strong>of</strong> the capital is moved to region 1 at the<br />
beginning <strong>of</strong> period - . Figure 4 compares the outcome <strong>of</strong> a shift to " - with the outcome <strong>of</strong><br />
a shift to "" - . Both orbits initially move further away from = 0 . However, the dotted orbit<br />
from " - snaps back to 0 = , whereas the solid orbit starting from "" - results in = 1.<br />
Increases in the capital migration speed and reductions in trade freeness are broadly ‘de-<br />
stabilizing’. <strong>The</strong> equivalence follows from the fact that higher trade barriers increase the<br />
importance <strong>of</strong> location and therefore enhance any incentive to move capital. For any level<br />
<strong>of</strong> trade freeness, there exist capital migration speeds sufficiently rapid that long-term<br />
behaviour exhibits periodic or chaotic coexistence or that all industry is concentrated in one<br />
region. Similarly, for any speed, there exist transport costs sufficiently high for long term<br />
behaviour to exhibit complexity or for agglomeration to occur. From (14) and (17), a ceteris<br />
paribus increase in the average pr<strong>of</strong>it per unit <strong>of</strong> capital, , has the same qualitative<br />
impact as an increase in ' . Thus, from (13), an increase in manufactures’ share <strong>of</strong><br />
expenditure µ or in the labour-capital ratio LKare de-stabilizing. <strong>The</strong> impact <strong>of</strong> a change<br />
in the consumers’ preference for variety is more complex: an increase in reduces trade<br />
freeness (which is de-stabilizing) but also reduces the average pr<strong>of</strong>it per unit <strong>of</strong> capital<br />
(which is stabilizing). In Figure 5, which is based on µ = 0.5,<br />
LK= 100 , T = 2 and<br />
' = 0.35 , the symmetric fixed point is an attractor for < 2.5 and for > 9.13.<br />
An important question is the robustness <strong>of</strong> the comparative dynamical propositions with<br />
respect to the specification <strong>of</strong> the capital migration process. An alternative specification, for<br />
example, could involve capitalists responding to the ratio <strong>of</strong> regional pr<strong>of</strong>its. Since does<br />
not affect the pr<strong>of</strong>it ratio, µ and LKwould have no impact on the dynamical behaviour;<br />
18
egion 1's capital share<br />
1<br />
0<br />
Figure 5<br />
2 10<br />
elasticity <strong>of</strong> substitution<br />
Bifurcation diagram showing the impact <strong>of</strong> the elasticity <strong>of</strong> substitution<br />
on the long-run behaviour <strong>of</strong> region 1’s share <strong>of</strong> capital use t .
and would have an effect only via trade freeness. However, the impacts <strong>of</strong> ' and <strong>of</strong><br />
would be qualitatively similar and, more generally, the system would still exhibit complex<br />
dynamical behaviour, with multiple attractors and hyper-sensitivity to initial conditions and<br />
to parameters.<br />
5.3. Comparison <strong>of</strong> <strong>Model</strong>s<br />
<strong>The</strong> contrast between the discrete-time and continuous-time symmetric FC models could<br />
not be more dramatic. For the continuous-time model, the instantaneous short-run general<br />
equilibrium corresponds to the short-run general equilibrium identified in Section 3.<br />
Baldwin et al. assume a capital migration process ( 1 )( )<br />
= . In fact, provided<br />
1 2<br />
only that capital migrates to the region with the higher pr<strong>of</strong>it, the precise specification <strong>of</strong> the<br />
migration process is irrelevant for the long-term behaviour <strong>of</strong> the continuous-time system.<br />
Indeed, for < 1,<br />
the only stable long-run equilibrium for the continuous-time symmetric<br />
FC model is the symmetric equilibrium = 12,<br />
since the core-periphery equilibria are<br />
necessarily unstable. For this reason, Baldwin et al. (2003, p. 80) describe the continuous-<br />
time symmetric FC model as “rather uninteresting”. In contrast, the dynamical behaviour <strong>of</strong><br />
the discrete-time model is extremely interesting.<br />
As noted above, the analytical tractability <strong>of</strong> the FC model derives from the fact that the<br />
repatriation <strong>of</strong> the earnings from capital eliminates both the demand-linked and cost-linked<br />
circularities that feature in the CP model. Whereas the symmetric FC model possesses three<br />
fixed points, the CP model has parameter ranges for which there are five fixed points.<br />
Nevertheless, the discrete-time symmetric FC model retains much <strong>of</strong> the dynamical<br />
complexity <strong>of</strong> the discrete-time symmetric CP model examined by Currie and Kubin<br />
(2005). In both models, long-term behaviour can involve periodic or chaotic coexistence <strong>of</strong><br />
19
manufacturing in both regions; multiple attractors, sensitive dependence on parameters and<br />
sensitive dependence on initial conditions are pervasive. Moreover, whereas discussions <strong>of</strong><br />
the continuous-time CP model portray high transport costs as stabilizing, high transport<br />
costs are de-stabilizing in both the discrete-time FC and CP models.<br />
6. Asymmetric Regions<br />
6.1. Comparative Dynamics<br />
Exogenous regional asymmetries imply, in general, that Z( 1 ) 1 Z(<br />
)<br />
words, rotating Z ( t ) through<br />
, ; in other<br />
t t<br />
0<br />
180 does not result in the same map. In particular, from<br />
(20), s Y , 12 implies Z ( 12) , 12.<br />
Figure 6, for which = 40 , ' = 0.5 , = 0.5 and<br />
sL = sK = sY<br />
= 0.6 , shows that a relatively modest difference simply in the size <strong>of</strong> regions<br />
can result in a highly asymmetric map. In accordance with (20), at the interior fixed point<br />
* = 0.8,<br />
the larger region’s share in capital use exceeds its share in income (and in capital<br />
ownership). Although the interior fixed point * is locally stable, many initial points result<br />
in agglomeration in the larger region. Indeed, with an initial allocation equal to the<br />
ownership share [i.e., 0 = sK<br />
= 0.6 ], the pr<strong>of</strong>it difference would be sufficient to induce<br />
capitalists to move immediately all their capital to the larger region.<br />
Figure 7, for which = 40 , = 0.5 and ' = 0.65 , focuses on the significance <strong>of</strong> region 1’s<br />
share <strong>of</strong> income, assuming that it is the larger region. For 0.5 Y Y<br />
s s"" , ( )<br />
* sY represents<br />
the linear relationship (20): it shows the share <strong>of</strong> capital use at which regional pr<strong>of</strong>its are<br />
equal. <strong>The</strong> pr<strong>of</strong>it in region 1 (the core) equals the virtual pr<strong>of</strong>it in region 2 (the periphery) at<br />
s"" = 1 ( 1+ ) = 2 3,<br />
which is equivalent to ( )<br />
Y<br />
1 sY sY<br />
= . <strong>The</strong> capital migration speed is<br />
20
1<br />
t+ 1<br />
0<br />
0<br />
Map Z ( )<br />
Figure 6<br />
Z ( t )<br />
t<br />
sY = sK<br />
t+ 1 t = with asymmetric regions, where * is the locally stable<br />
interior fixed point, sY is region 1’s share in total expenditure and sK is its<br />
share in capital ownership.<br />
*<br />
1
egion 1's capital share<br />
1<br />
1/2<br />
0<br />
average<br />
capital<br />
share<br />
Figure 7<br />
* ( sY<br />
)<br />
= sY<br />
0.5 sY Y 0.7 s<br />
region 1's income share<br />
<strong>The</strong> dependence <strong>of</strong> region 1’s unstable equilibrium share <strong>of</strong> capital use and <strong>of</strong> its<br />
actual average share <strong>of</strong> capital use on region 1’s income share.
sufficiently high (or trade freeness is sufficiently low) that the interior fixed point * is<br />
repelling for an income share below s"" Y . For sY s" Y,<br />
region 1’s capital use exhibits periodic<br />
or chaotic behaviour but, on average, it is systematically higher than * (and a fortiori<br />
greater than the income share). Above income share s" Y , all manufacturing is concentrated<br />
in region 1. Compared to the virtual pr<strong>of</strong>it in region 2, pr<strong>of</strong>it per unit <strong>of</strong> capital in region 1<br />
is lower for sY sY sY<br />
" < < "" but higher for sY > s"" Y .<br />
Figure 8 illustrates the possible impact <strong>of</strong> the level <strong>of</strong> trade freeness where relative factor<br />
endowments differ. Both regions have the same labour endowments but all the capitalists<br />
live in region 1 [i.e., s K = 1].<br />
<strong>The</strong> simulations are based on = 40 , ' = 0.5 , = 4 and<br />
µ = 0.5;<br />
0 is set close to the relevant fixed point; and the level <strong>of</strong> ranges from just<br />
above 0 to just below 1. <strong>The</strong> values <strong>of</strong> and µ imply s Y + 0.563 , so that, even with<br />
s K = 1,<br />
income shares are not very different. For < A , the volatility that results from the<br />
relatively high trade costs leads to the concentration <strong>of</strong> all industry in region 1. For<br />
A < P,<br />
the interior fixed point is repelling and the system exhibits periodic or chaotic<br />
long-term behaviour, with region 1 exporting capital. For P < CP1,<br />
the system is<br />
attracted to the interior fixed point, where, as implied by (20), * increases as rises.<br />
That is, region 1’s exports <strong>of</strong> capital fall as trade in manufactures becomes less costly. For<br />
( 1 )<br />
= s s , trade is sufficiently free that region 1 does not export any capital.<br />
CP1 Y Y<br />
From (14), > ( s ) s implies ( )<br />
pr<strong>of</strong>it in region 2.<br />
1 Y Y<br />
! 1 > 0,<br />
i.e., the pr<strong>of</strong>it in region 1 exceeds the virtual<br />
21
egion 1's capital share<br />
1<br />
0<br />
0<br />
Figure 8<br />
A<br />
trade freeness<br />
CP1<br />
Bifurcation diagram showing the impact <strong>of</strong> trade freeness<br />
with all capitalists living in region 1.<br />
P<br />
1
6.2. Comparison with Continuous-time FC model<br />
With asymmetric regions, the discrete-time FC model is again dynamically much richer<br />
than its continuous-time counterpart. For the latter, if, say, s Y > 12,<br />
the only stable long-<br />
term behaviour involves *<br />
= for ( 1 )<br />
s s and = 1 otherwise. <strong>The</strong> divergence<br />
Y Y<br />
between * and sY is attributed to the so-called ‘home market effect’, whereby the region<br />
with the larger home market has a more than proportionately larger manufacturing sector,<br />
and therefore exports manufactures. 10 In Figure 7, the impact <strong>of</strong> the home market effect is<br />
on average greater in the discrete-time model than in the continuous-time model. <strong>The</strong> abrupt<br />
agglomeration that occurs in the discrete-time model as sY increases through s" Y does not<br />
occur in the continuous-time model.<br />
<strong>The</strong> sole dynamical feature that Baldwin et al. highlight in the continuous-time model is the<br />
possibility <strong>of</strong> a very ‘rapid’ rate <strong>of</strong> relocation – which they call ‘near-catastrophic<br />
agglomeration’ (2003, p. 88) 11 – when the regions are only slightly different in size and<br />
approaches CP 1 . In the discrete-time FC model, sensitive dependence on parameters is<br />
much more pervasive. Moreover, in contrast to the continuous-time FC model, the system<br />
displays sensitive dependence on initial conditions.<br />
7. Some Final Comments<br />
Reformulating the <strong>Footloose</strong> <strong>Capital</strong> model in terms <strong>of</strong> a discrete-time framework has<br />
astonishing implications for its possible long-run dynamical behaviours. Whereas the long-<br />
10 For a detailed examination <strong>of</strong> the home-market effect in the continuous-time FC model, see Baldwin et al.<br />
(2003, ch. 3).<br />
11<br />
On the notion <strong>of</strong> near-catastrophic agglomeration, see also Baldwin (1999).<br />
22
un behaviour <strong>of</strong> the continuous-time FC model is confined to a unique stationary<br />
equilibrium, long-run behaviour in the discrete-time model can involve the asymmetric<br />
coexistence <strong>of</strong> manufacturing in both regions, even with symmetric regions possessing the<br />
same factor endowments. <strong>The</strong> system possesses multiple attractors, exhibits chaotic<br />
behaviour, and displays sensitive dependence both on initial conditions and on parameters.<br />
<strong>The</strong> discrete-time model is much richer in terms <strong>of</strong> its potential for explaining and<br />
understanding economic phenomena relating to capital movements between regions and<br />
countries. But it also cautions against relying on simple comparative static propositions.<br />
23
References<br />
Alligood, K.T., Sauer T.D., Yorke J.A., 1996. Chaos: An Introduction to Dynamical<br />
Systems (Springer-Verlag, New York).<br />
Baldwin, R.E., 1999, Agglomeration and endogenous capital, European Economic Review<br />
43, 253-280.<br />
Baldwin, R.E., Forslid R., Martin P., Ottaviano G., Robert-Nicoud F., 2003. Economic<br />
Geography and Public Policy (Princeton University Press, Princeton).<br />
Currie, M., Kubin, I., 2005. Chaos in the core-periphery model, Journal <strong>of</strong> Economic<br />
Behavior and Organization, forthcoming.<br />
Devaney, R.L., 1989. An Introduction to Chaotic Dynamical Systems, 2 nd ed. (Addison-<br />
Wesley, California).<br />
Krugman, P.R., 1991a. Increasing returns and economic geography. Journal <strong>of</strong> Political<br />
Economy 99, 483-499.<br />
Krugman, P.R., 1991b. Geography and Trade (MIT Press, Cambridge).<br />
Martin, P., Rogers, C.A., 1995. Industrial location and public infrastructure, Journal <strong>of</strong><br />
International Economics 39, 335-51.<br />
Puga, D., 1998. Urbanization patterns: European versus less developed countries. Journal <strong>of</strong><br />
Regional Science 38, 231-52.<br />
24